impacts of la niña (and nao) on washington dc winters winter media workshop 12/9/2011 jared klein...
TRANSCRIPT

Impacts of La Niña (and NAO) on Washington DC Winters
Winter Media Workshop12/9/2011Jared Klein
LWX Climate Program Leader

NOAA/CPC 2011-12 Winter Outlook(Updated outlook- mid November)
Temperatures Precipitation
The seasonal outlooks combine the effects of long-term trends, soil moisture, and, when appropriate, ENSO.

Current State of ENSO
http://www.cpc.ncep.noaa.gov/products/analysis_monitoring/enso_advisory/
Niño 4 Niño 3.4 Niño 3Niño 1+2

Current State of ENSO (cont.)
http://www.cpc.ncep.noaa.gov/products/analysis_monitoring/enso_advisory/
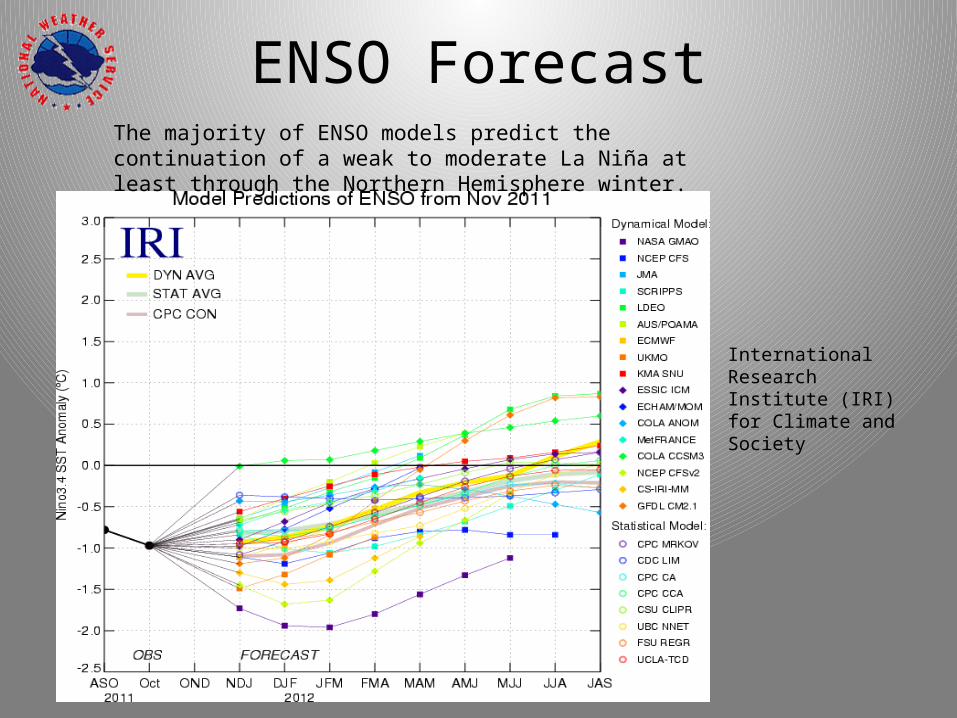
The majority of ENSO models predict the continuation of a weak to moderate La Niña at least through the Northern Hemisphere winter.
ENSO Forecast
International Research Institute (IRI) for Climate and Society

http://www.cpc.noaa.gov/products/analysis_monitoring/ensocycle/nawinter.shtml
El Niño pattern that dominated the 2009-10 winter
La Niña pattern that dominated last winter and so far this fall

http://www.cpc.noaa.gov/products/analysis_monitoring/ensocycle/nawinter.shtml
El Niño pattern that dominated the 2009-10 winter
La Niña pattern that dominated last winter and so far this fall
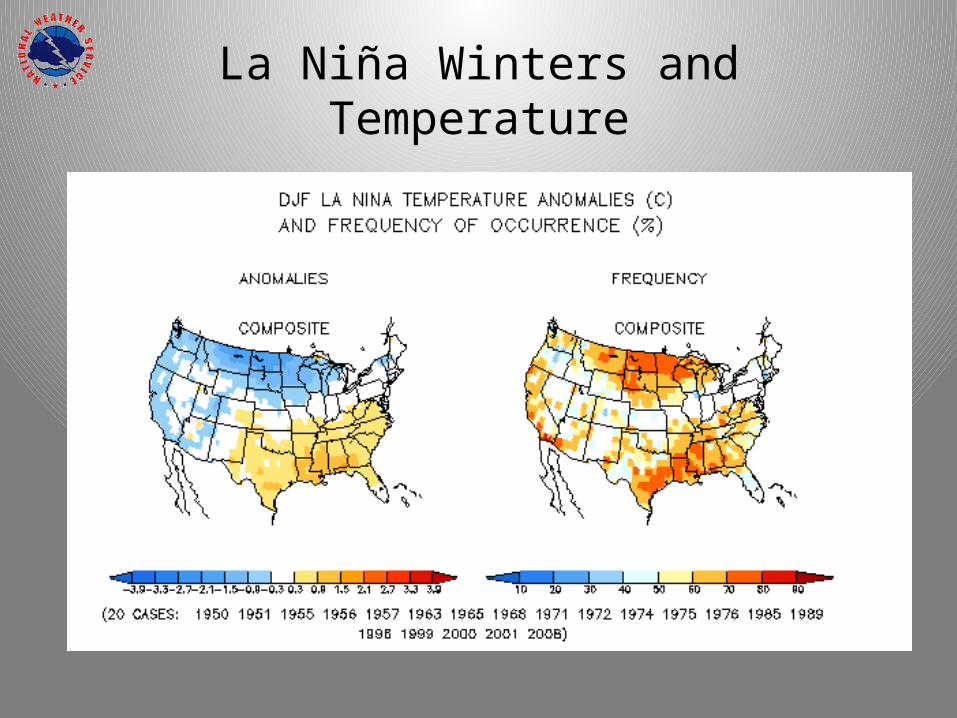
La Niña Winters and Temperature

1949
-195
0
1950
-195
1
1954
-195
5
1955
-195
6
1956
-195
7
1962
-196
3
1964
-196
5
1967
-196
8
1970
-197
1
1971
-197
2
1973
-197
4
1974
-197
5
1975
-197
6
1984
-198
5
1988
-198
9
1995
-199
6
1998
-199
9
1999
-200
0
2000
-200
1
2007
-200
8
2010
-201
1
30313233343536373839404142434445
42.9
37.836.8 36.4
39.5
31.9
36.7
35.2
36.7
40.241.3 41.5
40.4
38.1
38.8
35.3
41.240.1
36.1
40.9
36.5
Temperatures during La Niña Winters Washington D.C. (1950-2011)
D-J-F
Avg
Tem
ps (°
F)Strength of La Niña Episode: Weak Moderate Strong
1981-2010 Normal DJF Temp- 38.2°F
La Niña Weak La Niña Moderate La Niña Strong La Niña 1981-2000 Normal32
33
34
35
36
37
38
39
40
41
42
38.437.2
38.0
40.7
DJF
Aver
age
Tem
pera
ture
(F)
1981-2010 Normal DJF Temp (38.2F)
La Niña Averages
La Niña Time Series

La Niña Winters and Precipitation

1949
-195
0
1950
-195
1
1954
-195
5
1955
-195
6
1956
-195
7
1962
-196
3
1964
-196
5
1967
-196
8
1970
-197
1
1971
-197
2
1973
-197
4
1974
-197
5
1975
-197
6
1984
-198
5
1988
-198
9
1995
-199
6
1998
-199
9
1999
-200
0
2000
-200
1
2007
-200
8
2010
-201
1
4
5
6
7
8
9
10
11
12
6.61
7.55
6.26
5.03
8.38
7.137.49
8.70
10.63
9.389.64
9.08 9.15
6.37 6.59
9.179.70
8.21
6.06
8.82
6.15
Precipitation during La Niña Winters Washington D.C. (1950-2011)
D-J-F
Pre
cip (i
nche
s)Strength of La Niña Episode: Weak Moderate Strong
1981-2010 Normal DJF Precip- 8.48"
La Niña Weak La Niña Moderate La Niña Strong La Niña4
5
6
7
8
9
10
DJF
Prec
ipita
tion
(Inch
es) 1981-2010 Normal DJF Precipitation (8.48”)
La Niña Averages
La Niña Time Series

La Niña Winters and Snowfall

La Niña Averages
La Niña Time Series
Seasonal Snowfall Dec Jan Feb Mar0
2
4
6
8
10
12
14
16
18
20
La Niña Weak La Niña Moderate La Niña Strong La Niña 1981-2000 Normal
Snow
fall
(Inc
hes)
1949
-195
0
1950
-195
1
1954
-195
5
1955
-195
6
1956
-195
7
1962
-196
3
1964
-196
5
1967
-196
8
1970
-197
1
1971
-197
2
1973
-197
4
1974
-197
5
1975
-197
6
1984
-198
5
1988
-198
9
1995
-199
6
1998
-199
9
1999
-200
0
2000
-200
1
2007
-200
8
2010
-201
1
0
5
10
15
20
25
30
35
40
45
3.4
10.26.6
11.314.2
21.4
17.1
21.4
11.7
16.8 16.7
12.8
2.2
10.3
5.7
46
11.615.4
7.44.9
10.1
Seasonal Snowfall during La Niña YearsWashington D.C. (1950-2011)
Seas
onal
Sno
wfa
ll (in
ches
)Strength of La Niña Episode: Weak Moderate Strong
1981-2010 Normal Seasonal Snowfall - 15.5"
1981-2010 Seasonal Snowfall (15.5”)
-2.5 -2.0 -1.5 -1.0 -0.5 0.0 0.5 1.0 1.5 2.0 2.5
-2.5
-2.0
-1.5
-1.0
-0.5
0.0
0.5
1.0
1.5
2.0
2.5
1
16 3
3
5
6
7
8
9
10
1112
1314
15
16
2
18
19
20
2122
Series1
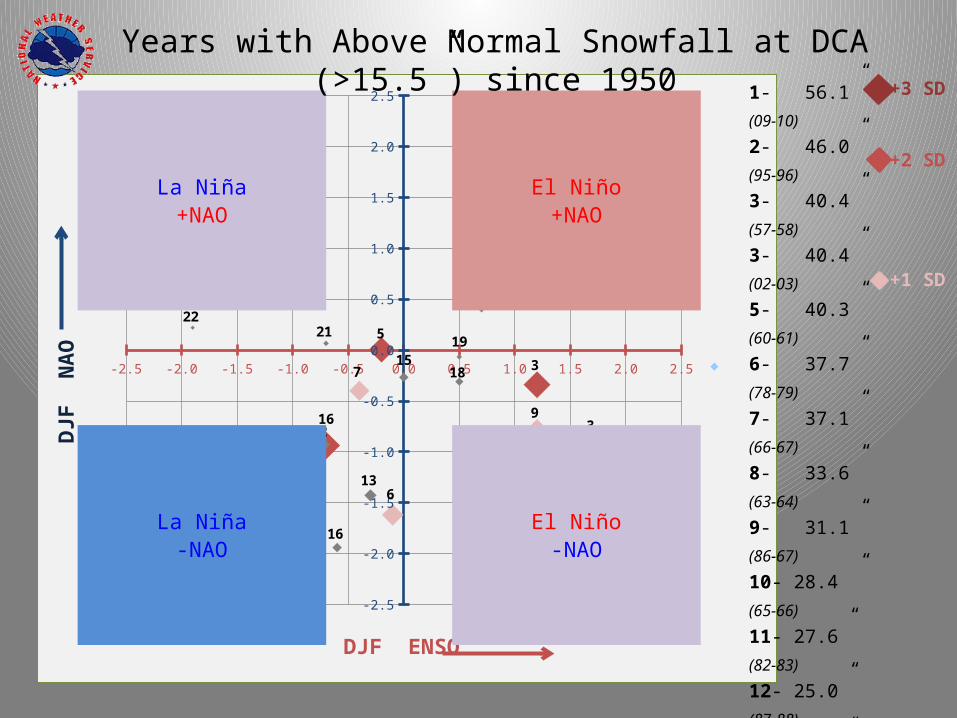
DJF ENSO
DJF
NAO
La Niña+NAO
El Niño+NAO
El Niño-NAO
La Niña-NAO
1- 56.1” (09-10)
2- 46.0” (95-96)
3- 40.4” (57-58)
3- 40.4” (02-03)
5- 40.3” (60-61)
6- 37.7” (78-79)
7- 37.1” (66-67)
8- 33.6” (63-64)
9- 31.1” (86-67)
10- 28.4 ” (65-66)
11- 27.6” (82-83)
12- 25.0” (87-88)
13- 24.3” (59-60)
14- 22.7 ” (77-78)
15- 22.5” (81-82)
16- 21.4” (62-63)
16- 21.4” (67-68)
18- 20.1 ” (79-80)
19- 18.0” (53-54)
20- 17.1 ” (64-65)
21- 16.8” (71-72)
22- 16.7” (73-74)
Years with Above Normal Snowfall at DCA (>15.5”) since 1950+3 SD
+2 SD
+1 SD
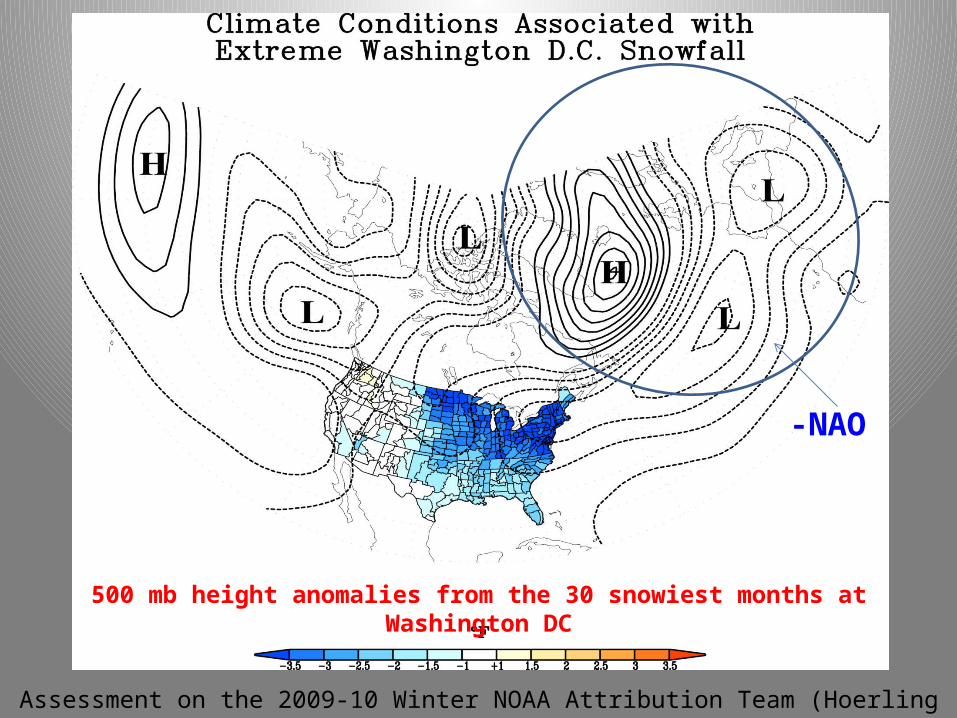
Assessment on the 2009-10 Winter NOAA Attribution Team (Hoerling et al. 2010)
500 mb height anomalies from the 30 snowiest months at Washington DC
-NAO