impacts of non-canonical el niño patterns on atlantic ... of non-canonical el niño patterns on...
TRANSCRIPT

Impacts of non-canonical El Niño patterns on Atlantichurricane activity
Sarah Larson,1 Sang-Ki Lee,2,3 Chunzai Wang,3 Eui-Seok Chung,1 and David Enfield2,3
Received 1 June 2012; accepted 27 June 2012; published 28 July 2012.
[1] The impact of non-canonical El Niño patterns, typicallycharacterized by warmer than normal sea surface tempera-tures (SSTs) in the central tropical Pacific, on Atlantictropical cyclone (TC) is explored by using composites of keyAtlantic TC indices and tropospheric vertical wind shearover the Atlantic main development region (MDR). Thehighlight of our major findings is that, while the canonicalEl Niño pattern has a strong suppressing influence onAtlantic TC activity, non-canonical El Niño patterns con-sidered in this study, namely central Pacific warming,El Niño Modoki, positive phase Trans-Niño, and positivephase Pacific meridional mode, all have insubstantial impacton Atlantic TC activity. This result becomes more conclu-sive when the impact of MDR SST is removed from theAtlantic TC indices and MDR wind shear by using themethod of linear regression. Further analysis suggests thatthe tropical Pacific SST anomalies associated with the non-canonical El Niño patterns are not strong enough to cause asubstantial warming of the tropical troposphere in theAtlantic region, which is the key factor that increases thewind shear and atmospheric static stability over the MDR.During the recent decades, the non-canonical El Niños havebeen more frequent while the canonical El Niño has beenless frequent. If such a trend continues in the future, it isexpected that the suppressing effect of El Niño on AtlanticTC activity will diminish and thus the MDR SST will play amore important role in controlling Atlantic TC activity inthe coming decades. Citation: Larson, S., S.-K. Lee, C. Wang,E.-S. Chung, and D. Enfield (2012), Impacts of non-canonicalEl Niño patterns on Atlantic hurricane activity, Geophys. Res. Lett.,39, L14706, doi:10.1029/2012GL052595.
1. Introduction
[2] Warm sea surface temperature (SST) anomalies in thetropical Pacific induce a global average warming of thetropical troposphere, via a fast tropical teleconnectionmechanism (i.e., Kelvin waves), and thus increase themeridional tropospheric temperature gradient within andacross the edge of the tropics [e.g., Horel and Wallace,
1981; Yulaeva and Wallace, 1994; Chiang and Sobel, 2002].This, in turn, directly increases the vertical wind shear overthe Atlantic main development region (MDR, 10�N–20�Nand 85�W–15�W), via the thermal wind relationship. Addi-tionally, the teleconnected tropospheric warming over thetropical Atlantic also tends to increase atmospheric staticstability and thus causes anomalous diabatic cooling overthe MDR [e.g., Tang and Neelin, 2004; Lee et al., 2011].This, in turn, may force the formation of a stationary bar-oclinic Rossby wave northwest of the MDR, consistent withGill’s simple model of tropical atmospheric circulations, tofurther increase the MDR wind shear [e.g., Lee et al., 2011].El Niño events are thus associated with decreased tropicalcyclone (TC) activity in the Atlantic basin especially in thedeep tropics as a result of increased wind shear and atmo-spheric static stability over the MDR [e.g., Gray, 1984;Goldenberg and Shapiro, 1996; Kossin et al., 2010;Klotzbach, 2011]. Other environmental factors such asreduced relative humidity also contribute to decreasedAtlantic TC activity during El Niño years, as shown inCamargo et al. [2007] using a TC genesis index.[3] The canonical El Niño is characterized by warmer than
normal SSTs in the eastern tropical Pacific Ocean. However,El Niño comes in many different flavors – every El Niñoevent has a somewhat different and distinct character[Trenberth and Stepaniak, 2001]. Recently, a newly identi-fied pattern of central equatorial Pacific warming event(non-canonical El Niño hereafter) has received attention dueto its increasing frequency in recent decades and its poten-tial link to the influence of anthropogenic global warming[Yeh et al., 2009; Lee and McPhaden, 2010]. This non-canonical El Niño is referred to as central Pacific El Niño,El Niño Modoki, warm pool El Niño, Pacific meridionalmode and Trans-Niño in the literature [e.g., Yeh et al., 2009;Ashok et al., 2007; Kao and Yu, 2009; Kug et al., 2009;Chiang and Vimont, 2004; Trenberth and Stepaniak, 2001].It differs from the canonical El Niño in that its warmequatorial SST anomalies are concentrated in the centralPacific with cool SST anomalies flanked in a horseshoepattern to the east and west [Ashok et al., 2007]. While thecanonical El Niño is historically defined as warm SSTanomalies in the Niño-3 region (NINO3; 5�S–5�N, 150�W–90�W) or Niño-3.4 region (NINO3.4; 5�S–5�N, 170�W–120�W), several different definitions of the non-canonicalEl Niño have been referenced in recent literature – centralPacific warming (CPW) [Yeh et al., 2009], El Niño Modokiindex (EMI) [Ashok et al., 2007], Pacific meridional mode(PMM) [Chiang and Vimont, 2004] and Trans-Niño index(TNI) [Trenberth and Stepaniak, 2001]. These definitionswere derived to describe the same anomalous central Pacificwarming pattern that is captured by the 2nd mode of theempirical orthogonal function analysis of monthly tropical
1Rosenstiel School of Marine and Atmospheric Science, University ofMiami, Miami, Florida, USA.
2Cooperative Institute for Marine and Atmospheric Studies, Universityof Miami, Miami, Florida, USA.
3Atlantic Oceanographic and Meteorological Laboratory, NOAA,Miami, Florida, USA.
Corresponding author: S.-K. Lee, Atlantic Oceanographic andMeteorological Laboratory, NOAA, 4301 Rickenbacker Cswy., Miami,FL 33149, USA. ([email protected])
©2012. American Geophysical Union. All Rights Reserved.0094-8276/12/2012GL052595
GEOPHYSICAL RESEARCH LETTERS, VOL. 39, L14706, doi:10.1029/2012GL052595, 2012
L14706 1 of 6

Pacific SST anomalies (EOF2) [Trenberth and Stepaniak,2001; Ashok et al., 2007].[4] Given a strong dependence of overall Atlantic TC
activity on the equatorial Pacific SST anomalies associatedwith El Niño, there is a clear need for understanding how theresponse of Atlantic TC activity to non-canonical El Niñodiffers from that to canonical El Niño. A recent study by Kimet al. [2009] suggested that CPW events are associated witha greater-than-average frequency of tropical storms andincreasing landfall potential along the Gulf of Mexico coastand Central America. However, Lee et al. [2010] performedan independent data analysis to point out that such conclu-sion could be premature because Kim et al. [2009] did notremove in their analysis the local impact of MDR SST,which is as important as the remote impact of tropical PacificSSTs as shown overwhelmingly in earlier studies [e.g.,Knaff, 1997; Knight et al., 2006; Wang et al., 2006; Zhangand Delworth, 2006; Vimont and Kossin, 2007; Kossin andVimont, 2007; Saunders and Lea, 2008].[5] Both Kim et al. [2009] and Lee et al. [2010] consid-
ered only a small number of CPW events to arrive at thecontradicting conclusions. Therefore, here, we furtherattempt to isolate and quantify the impact of non-canonicalEl Niño on Atlantic TC by using composites of SST, windshear and key Atlantic TC indices for various non-canonicalEl Niño definitions, i.e., CPW, EMI, TNI and PMM. One ofthe key points in our analyses is that, in order to isolate theimpact of non-canonical El Niño, the influence of MDR SSTis objectively removed from the Atlantic TC indices andMDR wind shear prior to making the composites by usingthe method of linear regression.
2. Data
[6] The SST dataset used in this study is the NOAAExtended Reconstructed Sea Surface Temperature version 3(ERSST3) [Smith et al., 2008] for the Atlantic hurricaneseason of June to November (JJASON) from the period of1950–2010. The NCEP-NCAR Reanalysis-1 data for thesame season and period is used to compute the wind shearand geopotential thickness between 200 and 850 hPa[Kalnay et al., 1996]. The hurricane reanalysis database(HURDAT) from the National Hurricane Center for thesame period is used to obtain various Atlantic TC indices.[7] As discussed earlier, in order to isolate the impact of
non-canonical El Niño patterns, the influence of MDR SST isremoved from the Atlantic TC indices and wind shear by usingthe method of linear regression. For example, the modifiedMDR vertical wind shear (VWS) can be obtained by
MDR VWS modifiedð Þ ¼ MDR VWS� a�MDR SSTA; ð1Þ
where a (= �1.96 m s�1�C�1) is the regression coefficientof anomalous MDR SST onto the MDR wind shear (seeFigure S1 in the auxiliary material).1 All of our analyses insection 4 are performed both with and without this approach.
3. Indices for Non-canonical El Niño Patterns
[8] As pointed out by Ashok et al. [2007], the EOF2 ofmonthly tropical Pacific SST anomalies captures the distinct
SST anomaly structure characteristic of the non-canonicalEl Niño. Various indices, such as CPW, EMI, TNI, andPMM have been suggested and used to define this samephenomenon. Currently, there is no consensus on how toclassify the non-canonical El Niño. Hence, CPW, EMI,TNI and PMM are all reproduced for this study as describedbelow. The referenced regions of SST anomalies are depic-ted in Figure S2 (and in Figure 1).[9] Ashok et al. [2007] proposed EMI to determine non-
canonical El Niño years. EMI is calculated using the fol-lowing equation:
EMI ¼ SSTA Að Þ � 0:5� SSTA Bð Þ � 0:5� SSTA Cð Þ½ �; ð2Þ
where SSTA(A) is the SST anomalies averaged over a boxregion for 10�S–10�N and 165�E–140�W, SSTA(B) is for15�S–5�N and 110�W–70�W, and SSTA(C) is for 10�S–20�N and 125�E–145�E. In this study, the index is normal-ized ([ ] represents normalization) by the standard deviationof the EMI time series.[10] Yeh et al. [2009] defined non-canonical El Niño years
by establishing a set of criteria for what is called CPW. ACPW year occurs when warm SST anomaly in the Niño-4region (NINO4; 5�S–5�N, 160�E–150�W) exceeds that ofthe Niño-3 region [Yeh et al., 2009]. Note that CPW is notan index but rather criteria for handpicking non-canonicalEl Niño years, thus a CPW time series cannot be computed.CPW years are defined as those years in which NINO4 isgreater than NINO3, while NINO4 is positive.[11] Chiang and Vimont [2004] proposed PMM to
describe an anomalous SST gradient across the mean lati-tude of the intertropical convergence zone (ITCZ) coupled toan anomalous displacement of the ITCZ toward the warmerregion. PMM is calculated in this study using the followingequation:
PMM ¼ ENP½ � � NINO1þ 2½ �½ �; ð3Þ
where ENP (eastern North Pacific) is the SST anomalyaveraged over a box region for 10�N–30�N and 140�E–110�W, and NINO1 + 2 is the SST anomaly averaged overthe Niño-1 + 2 region (10�S–0�N, 90�W–80�W). In thisstudy, the index is normalized by the standard deviation ofthe PMM time series.[12] Trenberth and Stepaniak [2001] suggested that an
optimal characterization of both the distinct character andthe evolution of each El Niño and La Niña event requires aso-called TNI in addition to the conventional SST anomaliesin the Niño-3.4 region. TNI is computed by taking the dif-ference between the normalized SST anomalies averaged inthe Niño-1 + 2 and Niño-4 regions then further normalizingthe resulting time series to have unit standard deviation. Bynormalizing the Niño-1 + 2 and Niño-4 SST anomaly termsprior to subtraction, neither region’s SST anomaly candominate the overall index. This is necessary because themagnitude of the equatorial eastern Pacific SST anomaly isusually larger than equatorial central Pacific SST anomaly.The resulting TNI is SST anomaly difference between theNiño-1 + 2 and Niño-4 regions. Note that Trenberth andStepaniak [2001] calculate TNI by subtracting Niño-4 SSTanomalies from Niño-1 + 2 SST anomalies so that a positiveindex corresponds to a cold central equatorial Pacific event.Here, in order for a positive TNI to correspond to a warmer1Auxiliary materials are available in the HTML. doi:10.1029/
2012GL052595.
LARSON ET AL.: NON-CANONICAL EL NIÑOS AND HURRICANES L14706L14706
2 of 6

than normal SST anomalies in the central tropical Pacific,the normalized Niño-1 + 2 SST anomalies are subtractedfrom the normalized Niño-4 SST anomalies in this study.Therefore, the equation for TNI is given by
TNI ¼ NINO4½ � � NINO1þ 2½ �½ �; ð4Þwhere [ ] represents that the variable is normalized.
[13] To represent each non-canonical El Niño definition,composites of the eight strongest positive (warm) phaseyears, during which NINO4 is also positive, are created forCPW, EMI, TNI and PMM. An additional criterion ofNINO4 > 0 is required to eliminate years in which otherregions’ cold SST anomalies account for the positive index.For example, when calculating TNI, if NINO4 is 0 andNINO1 + 2 is negative, then TNI > 0. However, this is not acentral tropical Pacific warming event but rather an easterntropical Pacific cooling event. Therefore, including the cri-terion of NINO4 > 0 in selecting non-canonical El Niñoyears ensures that these types of years are discarded. NINO3is also computed for the period 1950–2010 to create thecomposite of the eight strongest canonical El Niño years.Hereafter, NINO3 is also referred to as eastern Pacificwarming (EPW). Note that each of these indices is firstaveraged for JJASON, and then is used in selecting the eightstrongest positive phase years.[14] Figure S3 displays the time series of EMI, TNI, PMM
and EPW for JJASON during the period 1950–2010. EOF2contains a strong low frequency signal, and is largely posi-tive (i.e., warmer than normal in the central Pacific) during1950–1970 and negative (i.e., colder than normal in thecentral Pacific) during 1997–2010 (not shown). EMI, TNIand PMM show more variability at the short time scales thanEOF2. Overall, EMI and TNI agree in term of phase with thecorrelation coefficient of 0.86 (see Table S1). Similarly, TNIand PMM are significantly correlated with the correlationcoefficient of 0.70, whereas EMI and EPW are poorly cor-related with the correlation coefficient of 0.17.
4. Non-canonical El Niño Patternsand Atlantic TC Activity
[15] To quantify the impact of non-canonical El Niño onAtlantic TC activity, the number of tropical storms (TS),hurricanes (HR), major hurricanes (MH, categories 3–5),accumulated cyclone energy (ACE), number of UnitedStates landfalling hurricanes (USL), and the MDR windshear for JJASON are averaged for each index’s eight-yearcomposite before and after removing the effect of AtlanticMDR SST (Table 1). For reference, the Atlantic TC indicesand MDR wind shear for each of the eight strongest positivephase years for CPW, EMI, TNI, PMM, and EPW are shownin Table S2, S3, S4, S5, and S6, respectively.[16] It is clear from Table 1 that only EPW shows all
Atlantic TC indices (i.e., TS, HR, MH, ACE and USL)decreased and the MDR wind shear increased at the 90%significance level. Removing the effect of the AtlanticMDR SST has very minor impact (parenthesized values).In CPW and EMI, some Atlantic TC indices are decreasedand the MDR wind shear is slightly increased before andafter the Atlantic MDR SST impact is removed. However,these changes are too small to be statistically significantat the 90% level. In TNI, on the other hand, some AtlanticTC indices (i.e., TS, HR and ACE) are increased andthe MDR wind shear is decreased before the AtlanticMDR SST impact is removed (non-parenthesized value).After the Atlantic MDR SST impact is removed (parenthe-sized value), however, all Atlantic TC indices and theMDR wind shear recover their climatological values. InPMM, all Atlantic TC indices are virtually indistinguishablefrom their climatological values. Removing the effect of the
Figure 1. Composites of SST anomalies in JJASON forthe eight strongest (+) phase (a) CPW, (b) EMI, (c) TNI,(d) PMM and (e) EPW years. The unit is �C. The black boxesindicate the SST regions referenced for the definitions ofCPW (Niño-4), EMI (SSTA(A), SSTA(B), and SSTA(C)),TNI (Niño-4 and Niño-1 + 2), PMM (ENP and Niño-1 + 2)and EPW (Niño-3). See text for exact definitions of theseSST regions.
LARSON ET AL.: NON-CANONICAL EL NIÑOS AND HURRICANES L14706L14706
3 of 6
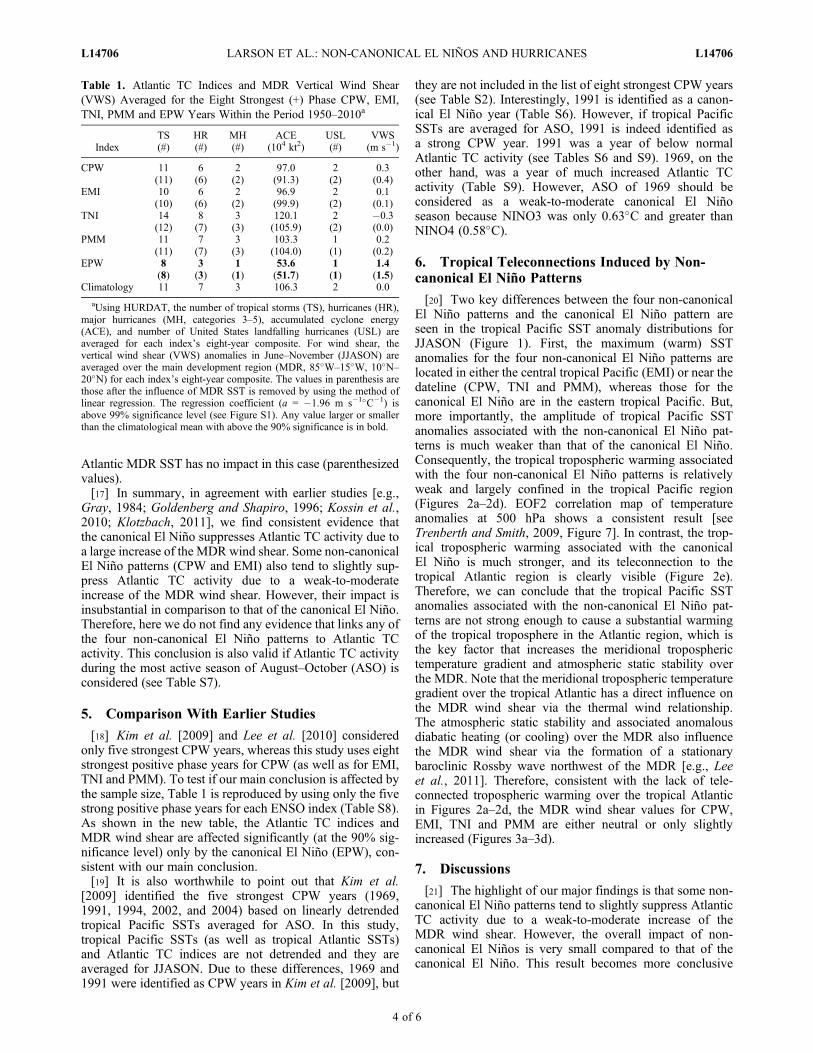
Atlantic MDR SST has no impact in this case (parenthesizedvalues).[17] In summary, in agreement with earlier studies [e.g.,
Gray, 1984; Goldenberg and Shapiro, 1996; Kossin et al.,2010; Klotzbach, 2011], we find consistent evidence thatthe canonical El Niño suppresses Atlantic TC activity due toa large increase of the MDR wind shear. Some non-canonicalEl Niño patterns (CPW and EMI) also tend to slightly sup-press Atlantic TC activity due to a weak-to-moderateincrease of the MDR wind shear. However, their impact isinsubstantial in comparison to that of the canonical El Niño.Therefore, here we do not find any evidence that links any ofthe four non-canonical El Niño patterns to Atlantic TCactivity. This conclusion is also valid if Atlantic TC activityduring the most active season of August–October (ASO) isconsidered (see Table S7).
5. Comparison With Earlier Studies
[18] Kim et al. [2009] and Lee et al. [2010] consideredonly five strongest CPW years, whereas this study uses eightstrongest positive phase years for CPW (as well as for EMI,TNI and PMM). To test if our main conclusion is affected bythe sample size, Table 1 is reproduced by using only the fivestrong positive phase years for each ENSO index (Table S8).As shown in the new table, the Atlantic TC indices andMDR wind shear are affected significantly (at the 90% sig-nificance level) only by the canonical El Niño (EPW), con-sistent with our main conclusion.[19] It is also worthwhile to point out that Kim et al.
[2009] identified the five strongest CPW years (1969,1991, 1994, 2002, and 2004) based on linearly detrendedtropical Pacific SSTs averaged for ASO. In this study,tropical Pacific SSTs (as well as tropical Atlantic SSTs)and Atlantic TC indices are not detrended and they areaveraged for JJASON. Due to these differences, 1969 and1991 were identified as CPW years in Kim et al. [2009], but
they are not included in the list of eight strongest CPW years(see Table S2). Interestingly, 1991 is identified as a canon-ical El Niño year (Table S6). However, if tropical PacificSSTs are averaged for ASO, 1991 is indeed identified asa strong CPW year. 1991 was a year of below normalAtlantic TC activity (see Tables S6 and S9). 1969, on theother hand, was a year of much increased Atlantic TCactivity (Table S9). However, ASO of 1969 should beconsidered as a weak-to-moderate canonical El Niñoseason because NINO3 was only 0.63�C and greater thanNINO4 (0.58�C).
6. Tropical Teleconnections Induced by Non-canonical El Niño Patterns
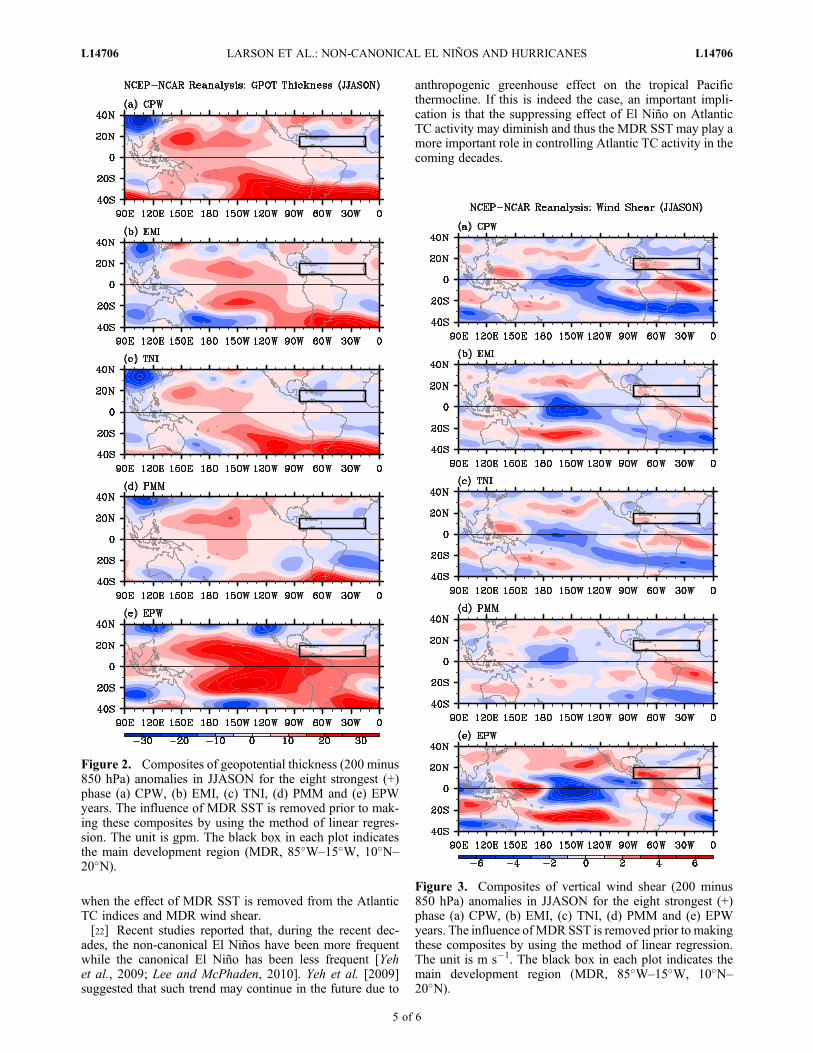
[20] Two key differences between the four non-canonicalEl Niño patterns and the canonical El Niño pattern areseen in the tropical Pacific SST anomaly distributions forJJASON (Figure 1). First, the maximum (warm) SSTanomalies for the four non-canonical El Niño patterns arelocated in either the central tropical Pacific (EMI) or near thedateline (CPW, TNI and PMM), whereas those for thecanonical El Niño are in the eastern tropical Pacific. But,more importantly, the amplitude of tropical Pacific SSTanomalies associated with the non-canonical El Niño pat-terns is much weaker than that of the canonical El Niño.Consequently, the tropical tropospheric warming associatedwith the four non-canonical El Niño patterns is relativelyweak and largely confined in the tropical Pacific region(Figures 2a–2d). EOF2 correlation map of temperatureanomalies at 500 hPa shows a consistent result [seeTrenberth and Smith, 2009, Figure 7]. In contrast, the trop-ical tropospheric warming associated with the canonicalEl Niño is much stronger, and its teleconnection to thetropical Atlantic region is clearly visible (Figure 2e).Therefore, we can conclude that the tropical Pacific SSTanomalies associated with the non-canonical El Niño pat-terns are not strong enough to cause a substantial warmingof the tropical troposphere in the Atlantic region, which isthe key factor that increases the meridional tropospherictemperature gradient and atmospheric static stability overthe MDR. Note that the meridional tropospheric temperaturegradient over the tropical Atlantic has a direct influence onthe MDR wind shear via the thermal wind relationship.The atmospheric static stability and associated anomalousdiabatic heating (or cooling) over the MDR also influencethe MDR wind shear via the formation of a stationarybaroclinic Rossby wave northwest of the MDR [e.g., Leeet al., 2011]. Therefore, consistent with the lack of tele-connected tropospheric warming over the tropical Atlanticin Figures 2a–2d, the MDR wind shear values for CPW,EMI, TNI and PMM are either neutral or only slightlyincreased (Figures 3a–3d).
7. Discussions
[21] The highlight of our major findings is that some non-canonical El Niño patterns tend to slightly suppress AtlanticTC activity due to a weak-to-moderate increase of theMDR wind shear. However, the overall impact of non-canonical El Niños is very small compared to that of thecanonical El Niño. This result becomes more conclusive
Table 1. Atlantic TC Indices and MDR Vertical Wind Shear(VWS) Averaged for the Eight Strongest (+) Phase CPW, EMI,TNI, PMM and EPW Years Within the Period 1950–2010a
IndexTS(#)
HR(#)
MH(#)
ACE(104 kt2)
USL(#)
VWS(m s�1)
CPW 11 6 2 97.0 2 0.3(11) (6) (2) (91.3) (2) (0.4)
EMI 10 6 2 96.9 2 0.1(10) (6) (2) (99.9) (2) (0.1)
TNI 14 8 3 120.1 2 �0.3(12) (7) (3) (105.9) (2) (0.0)
PMM 11 7 3 103.3 1 0.2(11) (7) (3) (104.0) (1) (0.2)
EPW 8 3 1 53.6 1 1.4(8) (3) (1) (51.7) (1) (1.5)
Climatology 11 7 3 106.3 2 0.0
aUsing HURDAT, the number of tropical storms (TS), hurricanes (HR),major hurricanes (MH, categories 3–5), accumulated cyclone energy(ACE), and number of United States landfalling hurricanes (USL) areaveraged for each index’s eight-year composite. For wind shear, thevertical wind shear (VWS) anomalies in June–November (JJASON) areaveraged over the main development region (MDR, 85�W–15�W, 10�N–20�N) for each index’s eight-year composite. The values in parenthesis arethose after the influence of MDR SST is removed by using the method oflinear regression. The regression coefficient (a = �1.96 m s�1�C�1) isabove 99% significance level (see Figure S1). Any value larger or smallerthan the climatological mean with above the 90% significance is in bold.
LARSON ET AL.: NON-CANONICAL EL NIÑOS AND HURRICANES L14706L14706
4 of 6
when the effect of MDR SST is removed from the AtlanticTC indices and MDR wind shear.[22] Recent studies reported that, during the recent dec-
ades, the non-canonical El Niños have been more frequentwhile the canonical El Niño has been less frequent [Yehet al., 2009; Lee and McPhaden, 2010]. Yeh et al. [2009]suggested that such trend may continue in the future due to
anthropogenic greenhouse effect on the tropical Pacificthermocline. If this is indeed the case, an important impli-cation is that the suppressing effect of El Niño on AtlanticTC activity may diminish and thus the MDR SST may play amore important role in controlling Atlantic TC activity in thecoming decades.
Figure 2. Composites of geopotential thickness (200 minus850 hPa) anomalies in JJASON for the eight strongest (+)phase (a) CPW, (b) EMI, (c) TNI, (d) PMM and (e) EPWyears. The influence of MDR SST is removed prior to mak-ing these composites by using the method of linear regres-sion. The unit is gpm. The black box in each plot indicatesthe main development region (MDR, 85�W–15�W, 10�N–20�N).
Figure 3. Composites of vertical wind shear (200 minus850 hPa) anomalies in JJASON for the eight strongest (+)phase (a) CPW, (b) EMI, (c) TNI, (d) PMM and (e) EPWyears. The influence ofMDR SST is removed prior to makingthese composites by using the method of linear regression.The unit is m s�1. The black box in each plot indicates themain development region (MDR, 85�W–15�W, 10�N–20�N).
LARSON ET AL.: NON-CANONICAL EL NIÑOS AND HURRICANES L14706L14706
5 of 6

[23] Acknowledgments. We wish to thank Jay Harris and HailongLiu for their assistance in data acquisition and processing, and two anony-mous reviewers and Greg Foltz for helpful comments and suggestions. Thiswork was supported by the NOAA Ernest F. Hollings undergraduate schol-arship program, and grants from the NOAA’s Climate Program Office andthe National Science Foundation.[24] The Editor thanks two anonymous reviewers for assisting in the
evaluation of this paper.
ReferencesAshok, K., S. Behera, A. S. Rao, H. Y. Weng, and T. Yamagata (2007),El Niño Modoki and its possible teleconnection, J. Geophys. Res., 112,C11007, doi:10.1029/2006JC003798.
Camargo, S. J., K. A. Emanuel, and A. H. Sobel (2007), Use of a genesispotential index to diagnose ENSO effects on tropical cyclone genesis,J. Clim., 20, 4819–4834, doi:10.1175/JCLI4282.1.
Chiang, J. C. H., and A. H. Sobel (2002), Tropical tropospheric temperaturevariations caused by ENSO and their influence on the remote tropical cli-mate, J. Clim., 15, 2616–2631, doi:10.1175/1520-0442(2002)015<2616:TTTVCB>2.0.CO;2.
Chiang, J. C. H., and D. J. Vimont (2004), Analogous Pacific and Atlanticmeridional modes of tropical atmosphere–ocean variability, J. Clim., 17,4143–4158, doi:10.1175/JCLI4953.1.
Goldenberg, S. B., and L. J. Shapiro (1996), Physical mechanisms for theassociation of El Niño and West African rainfall with Atlantic major hur-ricane activity, J. Clim., 9, 1169–1187, doi:10.1175/1520-0442(1996)009<1169:PMFTAO>2.0.CO;2.
Gray, W. M. (1984), Atlantic seasonal hurricane frequency. Part I: El Niñoand 30 mb Quasi-Biennial Oscillation influences, Mon. Weather Rev.,112, 1649–1668, doi:10.1175/1520-0493(1984)112<1649:ASHFPI>2.0.CO;2.
Horel, J. D., and J. M. Wallace (1981), Planetary-scale atmospheric phe-nomena associated with the Southern Oscillation, Mon. Weather Rev.,109, 813–829, doi:10.1175/1520-0493(1981)109<0813:PSAPAW>2.0.CO;2.
Kalnay, E., et al. (1996), The NCEP/NCAR 40-year reanalysis project,Bull. Am. Meteorol. Soc., 77, 437–471, doi:10.1175/1520-0477(1996)077<0437:TNYRP>2.0.CO;2.
Kao, H.-Y., and J.-Y. Yu (2009), Contrasting eastern-Pacific and central-Pacific types of ENSO, J. Clim., 22, 615–632, doi:10.1175/2008JCLI2309.1.
Kim, H.-M., P. J. Webster, and J. A. Curry (2009), Impact of shiftingpatterns of Pacific Ocean warming on North Atlantic tropical cyclones,Science, 325, 77–80, doi:10.1126/science.1174062.
Klotzbach, P. J. (2011), El Niño–Southern Oscillation’s impact on Atlanticbasin hurricanes and U.S. landfalls, J. Clim., 24, 1252–1263, doi:10.1175/2010JCLI3799.1.
Knaff, J. A. (1997), Implications of summertime sea level pressure anoma-lies in the tropical Atlantic region, J. Clim., 10, 789–804, doi:10.1175/1520-0442(1997)010<0789:IOSSLP>2.0.CO;2.
Knight, J. R., C. K. Folland, and A. A. Scaife (2006), Climate impacts ofthe Atlantic multidecadal oscillation, Geophys. Res. Lett., 33, L17706,doi:10.1029/2006GL026242.
Kossin, J. P., and D. J. Vimont (2007), A more general framework forunderstanding Atlantic hurricane variability and trends, Bull. Am.Meteorol. Soc., 88, 1767–1781, doi:10.1175/BAMS-88-11-1767.
Kossin, J. P., S. J. Camargo, and M. Sitkowski (2010), Climate modulationof North Atlantic hurricane tracks, J. Clim., 23, 3057–3076, doi:10.1175/2010JCLI3497.1.
Kug, J.-S., F.-F. Jin, and S.-I. An (2009), Two types of El Niño events: Coldtongue El Niño and warm pool El Niño, J. Clim., 22, 1499–1515,doi:10.1175/2008JCLI2624.1.
Lee, T., and M. J. McPhaden (2010), Increasing intensity of El Niño in thecentral-equatorial Pacific, Geophys. Res. Lett., 37, L14603, doi:10.1029/2010GL044007.
Lee, S.-K., C. Wang, and D. B. Enfield (2010), On the impact of centralPacific warming events on Atlantic tropical storm activity, Geophys.Res. Lett., 37, L17702, doi:10.1029/2010GL044459.
Lee, S.-K., D. B. Enfield, and C. Wang (2011), Future impact of differen-tial inter-basin ocean warming on Atlantic hurricanes, J. Clim., 24,1264–1275, doi:10.1175/2010JCLI3883.1.
Saunders, M. A., and A. S. Lea (2008), Large contribution of sea surfacewarming to recent increase in Atlantic hurricane activity, Nature, 451,557–560, doi:10.1038/nature06422.
Smith, T. M., R. W. Reynolds, T. C. Peterson, and J. Lawrinmore (2008),Improvements to NOAA’s historical merged land-ocean surface temper-ature analysis (1880–2006), J. Clim., 21, 2283–2296, doi:10.1175/2007JCLI2100.1.
Tang, B. H., and J. D. Neelin (2004), ENSO influence on Atlantic hurri-canes via tropospheric warming, Geophys. Res. Lett., 31, L24204,doi:10.1029/2004GL021072.
Trenberth, K. E., and L. Smith (2009), Variations in the three dimensionalstructure of the atmospheric circulation with different flavors of El Niño,J. Clim., 22(11), 2978–2991, doi:10.1175/2008JCLI2691.1.
Trenberth, K. E., and D. P. Stepaniak (2001), Indices of El Niño evolution,J. Clim., 14, 1697–1701, doi:10.1175/1520-0442(2001)014<1697:LIOENO>2.0.CO;2.
Vimont, D. J., and J. P. Kossin (2007), The Atlantic meridional modeand hurricane activity, Geophys. Res. Lett., 34, L07709, doi:10.1029/2007GL029683.
Wang, C., D. B. Enfield, S.-K. Lee, and C. W. Landsea (2006), Influencesof Atlantic warm pool on Western Hemisphere summer rainfall andAtlantic hurricanes, J. Clim., 19, 3011–3028, doi:10.1175/JCLI3770.1.
Yeh, S.-W., J.-S. Kug, B. Dewitte, M.-H. Kwon, B. Kirtman, and F.-F. Jin(2009), El Niño in a changing climate, Nature, 461, 511–514,doi:10.1038/nature08316.
Yulaeva, E., and J. M. Wallace (1994), The signature of ENSO in globaltemperature and precipitation fields derived from the microwavesounding unit, J. Clim., 7, 1719–1736, doi:10.1175/1520-0442(1994)007<1719:TSOEIG>2.0.CO;2.
Zhang, R., and T. L. Delworth (2006), Impact of Atlantic multidecadaloscillations on India/Sahel rainfall and Atlantic hurricanes, Geophys.Res. Lett., 33, L17712, doi:10.1029/2006GL026267.
LARSON ET AL.: NON-CANONICAL EL NIÑOS AND HURRICANES L14706L14706
6 of 6

Table S1. Correlation coefficients between EMI, TNI, PMM and EPW (NINO3) for JJASON. The values in parenthesis are those for ASO. Correlation coefficients above the 95% significance based on student’s t test are in bold. EMI TNI PMM EPW EMI - 0.86
(0.87) 0.53
(0.51) 0.17
(0.23) TNI 0.86
(0.87) - 0.70
(0.66) -0.14
(-0.07) PMM 0.53
(0.51) 0.70
(0.66) - -0.42
-0.40 EPW 0.17
(0.23) -0.14
(-0.07) -0.42
(-0.40) -

Table S2. Hurricane indices for the eight strongest CPW years during 1950-2010. The number of tropical storms (TS), hurricanes (HR), major hurricanes (MH, categories 3-5), accumulated cyclone energy (ACE), and number of United States landfalling hurricanes (USL) obtained from HURDAT are shown. For wind shear, the vertical wind shear (VWS) anomalies in JJASON are averaged over the main development region (MDR, 85°W – 15°W, 10°N – 20°N). The values in parenthesis are those after the influence of MDR SST is removed by using the method of linear regression. The regression coefficient (a = -1.96 m s-1 oC-1) is above 99% significance level (see Figure S1). Year NINO4 TS (#) HR (#) MH (#) ACE (104 kt2) USL(#) VWS (ms-1) 2002 0.96 12
(12) 4
(4) 2
(2) 63.5
(57.1) 1
(1) 1.3
( 1.4) 1994 0.89 7
(9) 3
(4) 0
(1) 28.8
(50.8) 0
(0) 0.0
(-0.5)
2004 0.88 15 (12)
9 (7)
6 (5)
227.3 (183.9)
6 (6)
-1.0 (-0.1)
2003 0.57 16 (13)
7 (5)
3 (2)
180.3 (143.8)
2 (2)
-0.5 ( 0.3)
1986 0.48 6 (9)
4 (6)
0 (1)
41.4 (75.8)
2 (2)
2.1 ( 1.4)
2001 0.46 15 (13)
9 (8)
4 (3)
115.6 (91.6)
0 (0)
-0.3 ( 0.2)
1990 0.45 14 (13)
8 (7)
1 (1)
93.0 (76.3)
0 (0)
-0.3 ( 0.1)
1977 0.44 6 (8)
5 (6)
1 (2)
26.5 (50.8)
1 (1)
1.0 ( 0.5)
Climatology 0.00 11 7 3 106.3 2 0.0

Table S3. Same as Table S2, but for the eight strongest positive EMI years during 1950-2010. Year EMI TS (#) HR (#) MH (#) ACE (104 kt2) USL(#) VWS (ms-1) 1994 1.50 7
(9) 3
(4) 0
(1) 28.8
(50.8) 0
(0) 0.0
(-0.5) 1966 1.38 11
(11) 7
(7) 3
(3) 148.9
(146.3) 2
(2) -0.9
(-0.9) 2004 1.24 15
(12) 9
(7) 6
(5) 227.3
(183.9) 6
(6) -1.0
(-0.1) 1990 1.10 14
(13) 8
(7) 1
(1) 93.0
(76.3) 0
(0) -0.3
( 0.1) 1977 1.05 6
(8) 5
(6) 1
(2) 26.5
(50.8) 1
(1) 1.0
( 0.5) 1991 1.04 8
(10) 4
(5) 2
(3) 39.2
(63.6) 1
(1) 1.6
( 1.0) 1958 0.75 10
(8) 7
(6) 5
(4) 127.2
(100.1) 1
(1) -0.3
(-0.3) 1965 0.74 6
(8) 4
(5) 1
(2) 84.3
(111.3) 1
(1) 0.6
(0.1) Climatology 0.00 11 7 3 106.3 2 0.0

Table S4. Same as Table S2, but for the eight strongest positive TNI years during 1950-2010. Year TNI TS (#) HR (#) MH (#) ACE (104 kt2) USL(#) VWS (ms-1) 1994 1.44 7
(9) 3
(4) 0
(1) 28.8
(50.8) 0
(0) 0.0
(-0.5) 2001 1.33 15
(13) 9
(8) 4
(3) 115.6 (91.6)
0 (0)
-0.3 ( 0.2)
2004 1.23 15 (12)
9 (7)
6 (5)
227.3 (183.9)
6 (6)
-1.0 (-0.1)
1977 1.09 6 (8)
5 (6)
1 (2)
26.5 (50.8)
1 (1)
1.0 ( 0.5)
1966 1.04 11 (11)
7 (7)
3 (3)
148.9 (146.3)
2 (2)
-0.9 (-0.9)
2005 1.03 28 (23)
15 (12)
7 (5)
257.5 (189.7)
6 (6)
-2.2 (-0.7)
1990 1.01 14 (13)
8 (7)
1 (1)
93.0 (76.3)
0 (0)
-0.3 ( 0.1)
2002 0.98 12 (12)
4 (4)
2 (2)
63.5 (57.1)
1 (1)
1.3 ( 1.4)
Climatology 0.00 11 7 3 106.3 2 0.0

Table S5. Same as Table S2, but for the eight strongest positive PMM years during 1950-2010. Year PMM TS (#) HR (#) MH (#) ACE (104 kt2) USL(#) VWS (ms-1) 1992 1.39 7
(8) 4
(5) 1
(1) 77.3
(92.3) 1
(1) 0.7
( 0.3) 1990 1.23 14
(13) 8
(7) 1
(1) 93.0
(76.3) 0
(0) -0.3
( 0.1) 1996 1.12 13
(13) 9
(9) 6
(6) 177.2
(180.0) 2
(2) 0.8
( 0.7) 1958 0.94 10
(8) 7
(6) 5
(4) 127.2
(100.1) 1
(1) -0.3
(-0.3) 2001 0.89 15
(13) 9
(8) 4
(3) 115.6 (91.6)
0 (0)
-0.3 ( 0.2)
1968 0.72 8 (9)
4 (5)
0 (7)
45.9 (69.7)
1 (1)
-0.2 (-0.8)
1986 0.68 6 (9)
4 (6)
0 (1)
41.4 (75.8)
2 (2)
2.1 ( 1.4)
1966 0.67 11 (11)
7 (7)
3 (3)
148.9 (146.3)
2 (2)
-0.9 (-0.9)
Climatology 0.00 11 7 3 106.3 2 0.0

Table S6. Same as Table S2, but for the eight strongest canonical El Niño (EPW) years during 1950-2010. Year NINO3 TS (#) HR (#) MH (#) ACE (104 kt2) USL(#) VWS (ms-1) 1997 2.78 8
(6) 3
(2) 1
(0) 41.4
(19.6) 1
(1) 0.2
( 0.7) 1972 1.71 7
(10) 3
(5) 0
(1) 36.7
(70.0) 1
(1) 3.4
( 2.7) 1982 1.67 6
(8) 2
(3) 1
(2) 31.5
(55.5) 0
(0) 2.7
( 2.1) 1987 1.41 7
(4) 3
(1) 1
(0) 30.2 (0.0)
1 (1)
1.3 ( 2.1)
1965 1.21 6 (8)
4 (5)
1 (2)
84.3 (111.3)
1 (1)
0.6 ( 0.1)
1957 1.08 8 (8)
3 (3)
2 (2)
86.8 (84.9)
1 (1)
-0.2 (-0.2)
2009 0.96 9 (6)
3 (2)
2 (1)
54.6 (22.0)
0 (0)
2.1 ( 2.8)
1991 0.89 8 (10)
4 (5)
2 (3)
39.2 (63.6)
1 (1)
1.6 ( 1.1)
Climatology 0.00 11 7 3 106.3 2 0.0
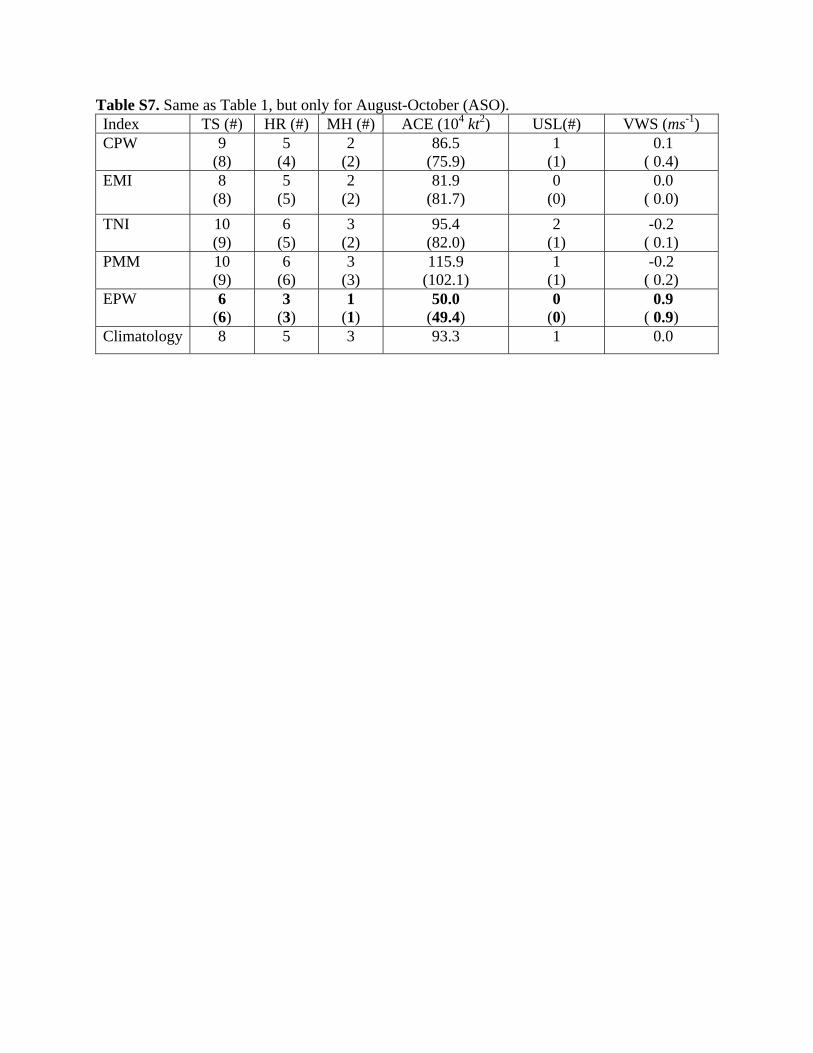
Table S7. Same as Table 1, but only for August-October (ASO). Index TS (#) HR (#) MH (#) ACE (104 kt2) USL(#) VWS (ms-1) CPW 9
(8) 5
(4) 2
(2) 86.5
(75.9) 1
(1) 0.1
( 0.4) EMI 8
(8) 5
(5) 2
(2) 81.9
(81.7) 0
(0) 0.0
( 0.0)
TNI 10 (9)
6 (5)
3 (2)
95.4 (82.0)
2 (1)
-0.2 ( 0.1)
PMM 10 (9)
6 (6)
3 (3)
115.9 (102.1)
1 (1)
-0.2 ( 0.2)
EPW 6 (6)
3 (3)
1 (1)
50.0 (49.4)
0 (0)
0.9 ( 0.9)
Climatology 8 5 3 93.3 1 0.0

Table S8. Same as Table 1, but by using only the five strongest (+) phase years. Index TS (#) HR (#) MH (#) ACE (104 kt2) USL(#) VWS (ms-1) CPW 11
(11) 5
(5) 2
(2) 108.5
(102.3) 2
(2) 0.4
( 0.5) EMI 11
(10) 6
(6) 2
(2) 104.9
(101.6) 2
(2) -0.2
(-0.2)
TNI 11 (10)
7 (6)
3 (3)
109.4 (104.7)
2 (2)
-0.3 (-0.2)
PMM 12 (11)
7 (7)
3 (3)
118.0 (108.1)
1 (1)
0.1 ( 0.3)
EPW 7 (7)
3 (3)
1 (1)
44.8 (50.0)
1 (1)
1.6 ( 1.5)
Climatology 8 5 3 93.3 1 0.0
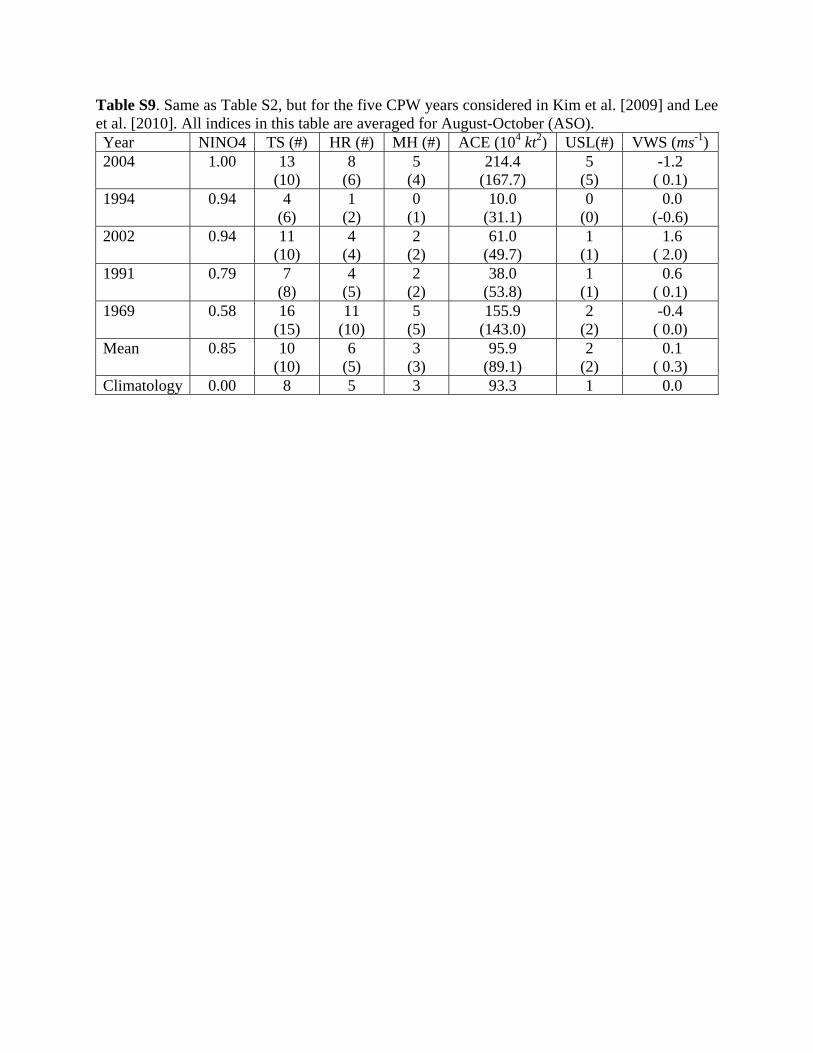
Table S9. Same as Table S2, but for the five CPW years considered in Kim et al. [2009] and Lee et al. [2010]. All indices in this table are averaged for August-October (ASO). Year NINO4 TS (#) HR (#) MH (#) ACE (104 kt2) USL(#) VWS (ms-1) 2004 1.00 13
(10) 8
(6) 5
(4) 214.4
(167.7) 5
(5) -1.2
( 0.1) 1994 0.94 4
(6) 1
(2) 0
(1) 10.0
(31.1) 0
(0) 0.0
(-0.6) 2002 0.94 11
(10) 4
(4) 2
(2) 61.0
(49.7) 1
(1) 1.6
( 2.0) 1991 0.79 7
(8) 4
(5) 2
(2) 38.0
(53.8) 1
(1) 0.6
( 0.1) 1969 0.58 16
(15) 11
(10) 5
(5) 155.9
(143.0) 2
(2) -0.4
( 0.0) Mean 0.85 10
(10) 6
(5) 3
(3) 95.9
(89.1) 2
(2) 0.1
( 0.3) Climatology 0.00 8 5 3 93.3 1 0.0
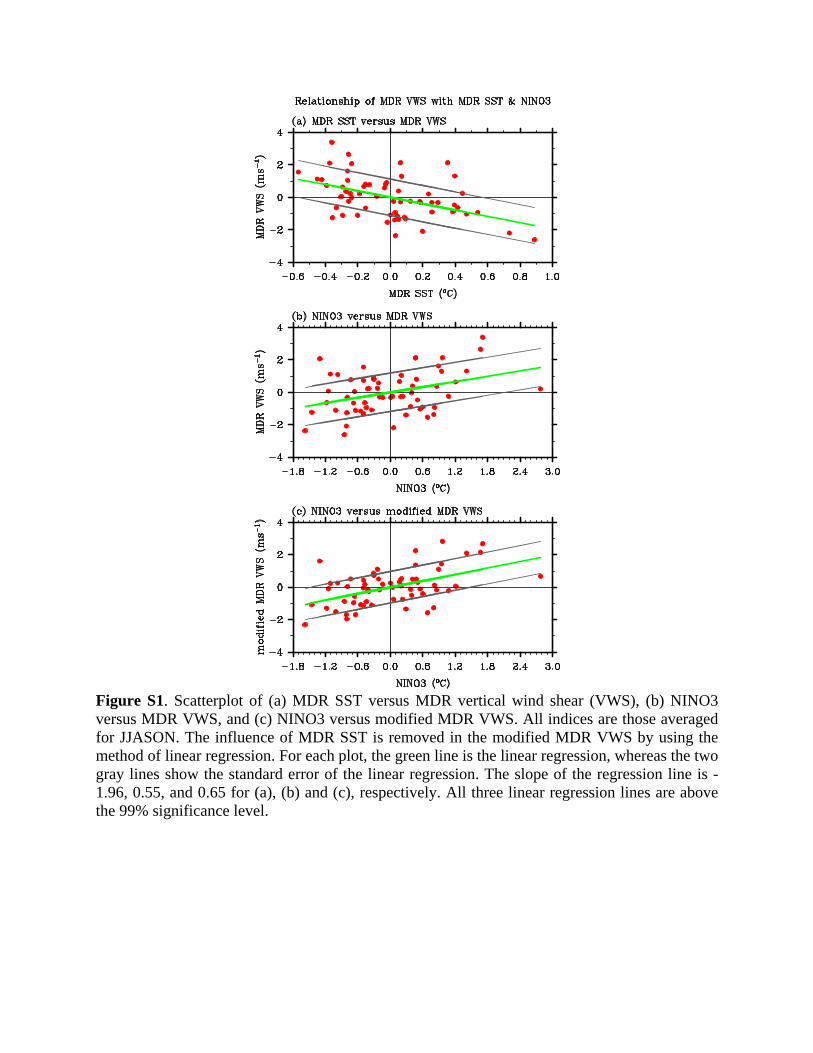
Figure S1. Scatterplot of (a) MDR SST versus MDR vertical wind shear (VWS), (b) NINO3 versus MDR VWS, and (c) NINO3 versus modified MDR VWS. All indices are those averaged for JJASON. The influence of MDR SST is removed in the modified MDR VWS by using the method of linear regression. For each plot, the green line is the linear regression, whereas the two gray lines show the standard error of the linear regression. The slope of the regression line is -1.96, 0.55, and 0.65 for (a), (b) and (c), respectively. All three linear regression lines are above the 99% significance level.
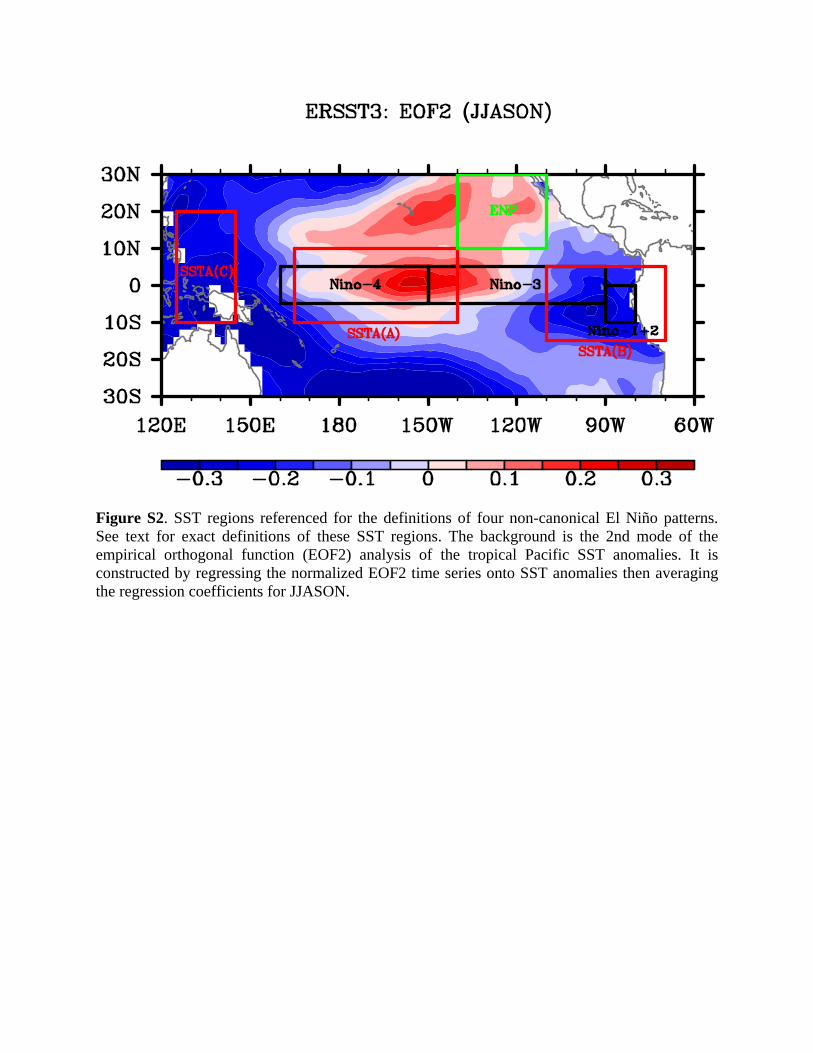
Figure S2. SST regions referenced for the definitions of four non-canonical El Niño patterns. See text for exact definitions of these SST regions. The background is the 2nd mode of the empirical orthogonal function (EOF2) analysis of the tropical Pacific SST anomalies. It is constructed by regressing the normalized EOF2 time series onto SST anomalies then averaging the regression coefficients for JJASON.

Figure S3. Time series of four non-canonical El Niño indices and the canonical El Niño (NINO3) index for JJASON during the period of 1950 - 2010. Each of the four non-canonical El Niño index is normalized by the standard deviation.