improved rice varieties adoption and technical …
TRANSCRIPT

________________________________________________
IMPROVED RICE VARIETIES ADOPTION AND
TECHNICAL EFFICIENCY OF SMALLHOLDER
RICE FARMERS IN OGUN STATE, NIGERIA
By: Bello Lateef Olalekan ________________________________________________
Submitted in fulfilment of the academic requirements of the degree
Master of Science in Agriculture (Agricultural Economics)
_______________________________________________
School of Agricultural Earth and Environmental Sciences
College of Agriculture, Engineering and Science
University of KwaZulu-Natal
Pietermaritzburg
Supervisor: Professor Lloyd Baiyegunhi
_______________________________________________
JULY 2019

ii
DECLARATION
I, Bello Lateef Olalekan, declare that:
(i) The research reported in this thesis is my original research work;
(ii) This thesis has never been submitted for any degree or examination at any other
university or institution of higher learning;
(iii) This thesis does not contain other authors’ data, pictures, tables, graphs or other
information, unless specifically acknowledged as being sourced from those authors.
Where other written sources were quoted:
a. they were rephrased and duly referenced;
b. general information attributed to them were duly referenced; and
c. phrases quoted verbatim were placed in quotation marks and duly referenced;
(iv) This thesis does not contain text, graphics or tables copied from the Internet without
having been specifically acknowledged and the source details mentioned in the reference
section.
Signed: Date: 29 July 2019
Bello Lateef Olalekan
(MSc Candidate)
As the candidate’s main supervisor, I, Professor Lloyd Baiyegunhi, agree to the submission of
this thesis.
Signed: Date: 29 July 2019

iii
ABSTRACT
Rice (Oryza sativa) is an essential food crop and the most consumed staple crop in the majority of
the urban and rural households in Nigeria. Rice consumption in Nigeria is the highest in Africa;
also, the country is one of the largest producers of rice on the continent and simultaneously one of
the largest rice importers in the world (FAO, 2016). The high importation is due to the
inconsistency and variability in production of rice in Nigeria. Rice yield in irrigated and rain-fed
land is 3.0–3.5 mt/ha and 1.5-3.0 mt/ha which is below the potential output of 7-9 mt/ha and 3-6
mt/ha respectively. Low adoption of improved rice varieties (IRVs) is one of the major constraints
leading to this low yield encountered by the resource-poor smallholder farmers. The main objective
of this study was to examine the factors influencing adoption of IRVs and its impact on
productivity and to estimate the differences in technical efficiency among adopters and non-
adopters of IRVs in Ogun State, South West, Nigeria. A multi-stage random sampling technique
was used to select 250 rice farmers and data was collected through a well-structured questionnaire.
The Probit regression model was used to analyse the determinants of IRVs adoption while the
stochastic frontier production function was used to model the determinants of rice output and
technical efficiency.
The results of the probit model showed that education, rice farming experience, access to extension
services, access to credit and seed access had a significant influence on adoption of IRVs. The
estimates of the average treatment effect (ATT) from the PSM method indicated that the adoption
of IRVs increases productivity of smallholder rice farmers by 452kg/ha. The implication of the
results suggests that priority must be given to the use of improved agricultural technology such as
IRVs in order to enhance rice production.

iv
The estimate of the stochastic frontier analysis (SFA) indicates that smallholder rice farmers are
producing below their potential output, however, adopters of IRVs are more technically efficient
than the non-adopters. The mean technical efficiency of adopters and non-adopters of IRVs is 0.97
and 0.84, respectively. The study determined the sources of farmers’ technical inefficiency from a
combined effect of farm-specific, socio-economic, socio-institutional factors and predicted
probability of IRVs. The findings of the study suggest that adoption of IRVs plays a crucial role
in improving the technical efficiency of smallholder rice farmers.
The study, therefore, recommends an agricultural policy aimed at promoting farmers’ education,
through effective extension services, providing sustainable credit facilities and efficient
relationship between farmer-based organizations and seed companies (private, NGOs and
government) to enhance easy accessibility of IRVs by the rural smallholder rice farmers.

ii
TABLE OF CONTENTS
DECLARATION ii
ABSTRACT iii
TABLE OF CONTENTS ii
LIST OF TABLES v
LIST OF FIGURES vi
DEDICATION vii
ACKNOWLEDGEMENT viii
LIST OF ACRONYMS ix
CHAPTER 1 1
INTRODUCTION 1
1.1 Background to the Study 1
1.2 Statement of the Research Problem 5
1.3 Objectives of the Study 7
1.4 Justification for the Study 7
1.5 Outline of the thesis 9
CHAPTER 2 10
LITERATURE REVIEW 10
2.1 Introduction 10
2.2 Rice production in Nigeria 10
2.2.1 Rice production trends in Nigeria 13
2.3 Concepts of agricultural technology adoption 15
2.3.1 Approaches to farm technology adoption measurement 17
2.4 Concepts and impact evaluation of farm technology 18
2.4.1 Techniques for estimating impact of farm technology 19
2.5 Empirical studies on agricultural technology adoption and impact 21
2.6 Agricultural productivity and efficiency 25
2.6.1 Technical efficiency 26
2.6.2 Allocative and economic efficiency 27
2.7 Approaches to efficiency measurement 28
2.7.1 Stochastic frontier analysis 29

iii
2.7.2 Data envelopment analysis (DEA) 33
2.8 Factors affecting agricultural productivity and efficiency 35
2.8.1 Resource use in rice production 35
2.8.2 Factors influencing inefficiency in agricultural production 39
2.8.2.1 Socio-economic factors 40
2.9 Chapter summary 44
CHAPTER 3 45
ADOPTION OF IMPROVED RICE VARIETIES AND ITS IMPACT ON PRODUCTIVITY
AMONG SMALLHOLDER RICE FARMERS 45
3.1 Introduction 45
3.2 Conceptual and analytical framework 45
3.3 Empirical model specification and estimation technique 47
3.4 The study area, sampling and data collection technique 50
3.5 Definition of variables and summary statistics 53
3.6 Empirical results and discussion 55
3.6.1 Determinant of improved rice varieties adoption 55
3.6.2 Impact of improved rice varieties adoption on productivity 58
3.6.3 Impact of heterogeneity among adopters of improved rice varieties 63
3.7 Chapter summary 65
CHAPTER 4 67
DOES ADOPTION OF IMPROVED RICE VARIETIES EXPLAIN TECHNICAL
EFFICIENCY DIFFERENTIALS AMONG SMALLHOLDER RICE FARMERS? 67
4.1 Introduction 67
4.2 Conceptual and analytical framework 67
4.3 Empirical model specification 70
4.4 The study area, sampling and data collection techniques 72
4.5 Definition of variables and summary statistics. 72
4.6 Test of model specification 74
4.7 Empirical results and discussion 76
4.7.1 Stochastic frontier production estimates 76
4.7.2 Technical efficiency level of smallholder rice farmers 79
4.7.3 Effect of improved rice varieties on technical inefficiency 80
4.8 Chapter summary 83

iv
CHAPTER 5 84
SUMMARY, CONCLUSIONS AND RECOMMENDATIONS. 84
5.1 Summary 84
5.2 Conclusion 85
5.3 Policy Recommendations 86
5.4 Limitations of the study and suggestions for further research 87
REFERENCES 88
APPENDICES 107

v
LIST OF TABLES
Table No Title Page
2.1 Characteristics of rice growing environments in Nigeria 12
2.2 Features of rice production systems in Nigeria 12
3.1 Descriptive statistics of explanatory variables used in estimations 53
3.2 Probit model estimates of the determinant of improved rice varieties
adoption
56
3.3 Test of equality of means of variables before and after matching 61
3.4 Overall matching quality indicators before and after matching using
Nearest- neighbour matching
62
3.5 Rosenbaum bound test 62
3.6 Impact of adoption of improved rice varieties on productivity-PSM 63
3.7 Heterogeneous impacts among adopters of improved rice varieties 64
4.1 Summary statistics of variables for the sampled smallholder rice
farmers
73
4.2 Result of the null hypotheses tested 75
4.3 Maximum likelihood estimates of stochastic frontier production model
for smallholder rice farmers
77
4.4 Distribution of technical efficiency among smallholder rice farmers 79
4.5 Maximum likelihood estimates of technical inefficiency model for
smallholder rice farmers
80

vi
LIST OF FIGURES
Figure No Title Page
2.1 Rice paddy production (million metric tonnes) in Nigeria 17
2.2 Rice area (million hectares) harvested in Nigeria 17
2.3 Rice production (milled rice/ tonne) and consumption in Nigeria 18
2.4 World share in consumption of nitrogen fertilizer 37
3.1 Map of Ogun State showing study areas 52
3.2 Propensity score distribution and common support for propensity score
estimation
60
4.1 Technical efficiency of firms in relative input-output space 68

vii
DEDICATION
To God alone can be all the Glory! You are more than enough.

viii
ACKNOWLEDGEMENT
All praise and adoration be to God Almighty. Thank you, Allah, for making me accomplish this
study. During this study, certain wonderful people have exemplified themselves both in
integrity and philanthropy, to you all I say, a very big thank you. The exceptional effort and
patience of my supervisor, Prof Lloyd Baiyegunhi cannot be easily washed away in my
memory, to you Sir, I remain ever grateful. To my parent Mr and Mrs Bello and my guardian
in South Africa Dr (Mr and Mrs) Obagbuwa, whom has been instrumental to my admission into
the University when all hopes seem lost right from the beginning to the end of my sojourn in
this citadel of higher learning, you have been a vessel unto honour, may God bless you and
make you reap the fruits of your labour (Ameen).
I am grateful to all my colleagues Adetoyese, Temitope, Gideon, Unity, Collin, Mekonen,
Humbulani and Ayo for all their advice and contributions to this work. Also, to my Muslim
brothers Sheikh Abdul Rasheed, Abdul Azeez and Abdul Ahmed thanks for the guidance and
motivations, may Allah reward you all.
To my darling wife, Ganiyat Aderonke and our lovely son Abdul Raheem Olamiposi, thank
you for your understanding, you have been a great encouragement and a beautiful garment of
refuge and help. Special thanks to my siblings Lukman, Abdul hammed, Ibrahim and my baby
girl Oyindamola and to all my friends; Adeola, Yusuf, Saheed, Tolulope and Moses thanks for
your word of encouragement, making me happy and being there always, how nice will the world
be if there are more like you.
Finally, to the enumerators and all the rice farmers, your cooperation and understanding are
much appreciated.
ix
LIST OF ACRONYMS
AfDB African Development Bank
ATA Agricultural Transformation Agenda
ATT Average Treatment effect on the Treated
COLS Corrected Ordinary Least Squares
CMP Conditional Recursive Mixed-process
DEA Data Envelopment Analysis
DFA Distribution Frontier Approach
DMUs Decision Making Units
ESR Endogenous Switching Regression
FAO Food and Agricultural Organisation
FBO Farmers-based Organisation
FDH Free Disposal Hull
GPS Generalized Propensity Score
GDP Gross Domestic Product
GR Green Revolution
IITA International Institute of Tropical Agriculture
IRVs Improved Rice Varieties
IPSW Inverse Propensity Score Weighing
IV Instrumental variable
KBM Kernel-Based Matching
LATE Local Average Treatment Effect
NAFPP National Accelerated Food Production Program

x
NERICA New Rice for Africa
NCRI National Cereal Research Institute
NGOs Non-government Organisations
NIRI National and International Research Institute
NNM Nearest Neighbour Matching
NPK Nitrogen Phosphorus Potassium
PSM Propensity Score Matching
Rbounds Rosenbaum bounds
RM Radius Matching
SFA Stochastic Frontier Analysis
SSA Sub Saharan Africa
SVS Seed Voucher System
TEs Technical efficiencies
TFA Thick Frontier Approach

1
CHAPTER 1
INTRODUCTION
1.1 Background to the Study
Agriculture is an important sector that contributes significantly to the Nigerian economy. In the early
1960s, the sector accounted for the largest share of the Gross Domestic Products (GDP). The sector
provides employment opportunities, enhance food security and promote the growth of the country.
However, despite all these contributions to the economy, there has been a major setback in the
agricultural sector leading to a decline in its contribution to the GDP; in the year 1960-1969, the
agriculture’s annual share was 58%, but the contribution to GDP declined to 31% between 1970-
1979, during the oil boom (CBN, 2010; Abba and Isa, 2015). The average contribution to GDP within
the year 1980-2011 was 36.6%, the highest GDP in this periods was 43.6% and 43.9% in 1992 and
2005 while the lowest was 20.6% in 1980 (Ihugba et al., 2013). At present, agriculture accounts for
22.8% of the GDP in Nigeria (NBS, 2018). The decrease in agricultural share to the GDP was due to
the rise in crude oil revenue in the early 1970s. Agricultural sector accounted for 65-70% of the total
value of exports in the 1960s; it reduced to 40% in the 1970s, declined to less than 2% in the late
1990s and 0.60% in 2017 (Olajide et al., 2012; NBS, 2017). Sequel to the drastic decline in
agricultural output over the years, the government had come up with several policies and programs to
revive the agricultural sector and also bridge the high gap between local production and importation
of food commodities such as wheat and rice (FAO, 2017).
Rice is one of the most valuable cereal crops cultivated and consumed all over the world. It is a staple
food in several African nations and constitutes a large portion of the diet on a regular basis (Merem
et al., 2017). Rice is cultivated in mostly all agroecological zones in Nigeria but on a relatively small
2
scale (Ogundele and Okoruwa, 2006). Longtau (2003b) asserted that in Nigeria, rice [grown on 1.77
million hectares (ha)] ranks sixth after sorghum (4.0 million ha), millet (3.5million ha), cowpea (2.0
million ha), cassava (2.0 million ha) and yam (2.0 million ha), but it is still the most consumed staple
crop in most homes in urban and rural areas. Rice consumption in Nigeria is the highest in Africa,
also the country is one of the largest producers of rice on the continent and simultaneously one of the
largest rice importers in the world (FAO, 2016). Nigeria imported 3.4 million metric tonnes (mt) of
rice in 2011, making the country the world’s largest rice importer that year (Ogunya et al., 2017).
Rice production has been expanding at the rate of 6% per annum in Nigeria, with 70% of the
production increase due mainly to land expansion and only 30% being attributed to an increase in
yield (Nguezet et al., 2011).
There have been inconsistency and variability in the production of rice in Nigeria. Production
increased from 2.92 million tonnes in 1995 to 4.18 million tonnes of paddy rice in 2008 but also
reduced to 3.22 million tonnes in 2010 (GRiSP, 2013). FAO (2017) reported that there is a 4% slight
increase of 4.95million tonnes in rice production in 2016 compared to 4.75 million tonnes output in
2015. The output of rice increased not because of the increase in efficiency of the farmers but due to
more farmers engaging in rice production, which invariably led to the expansion of land area under
rice cultivation. Despite the increase in rice production, yields are still low. In Nigeria, rice yield in
the irrigated land is 3.0 -3.5 metric tonnes per hectare (mt/ha) compared with the potential of 7–9
mt/ha, while in the rainfed lowland environment, rice yield is 1.5–3.0 mt/ha compared to a potential
of 3.0–6.0 mt/ha. Also in the upland areas, yields range from 1.0 to 1.7 mt/ha compared with a
potential of 2.0–4.0 mt/ha (GRiSP, 2013).
To resolve the issue of underproduction, a series of research has been conducted towards providing
agricultural technology to enhance rice productivity. Mulugeta and Hundie (2012), asserted that new

3
agricultural technologies and improved practices play a major role in increasing agricultural
production which in turn enhances national food security in developing countries. Evidence of success
in the Green Revolution program in Asia has led to an effort directed towards the adoption of
improved agricultural technology in increasing agricultural productivity in Africa (Awotide et al.,
2016). In view of this backdrop, the West African countries established the West African Rice
Development Association (WARDA) in 1971 with the support of international organizations (Oladele
and Somorin, 2008). The aim of WARDA was to implement the adoption of improved agricultural
technologies (focusing on rice technologies) developed in Asia to improve food security and alleviate
poverty in West Africa.
In respect of the significant contribution of rice to consumers and farm households, the government
of Nigeria has prioritized the development of improved varieties of the crop to boost its productivity
(Awotide et al., 2016). For example, research institutes such as National Cereal Research Institute
(NCRI), International Institute of Tropical Agriculture (IITA) and International Rice Research
Institute (IRRI) have developed over 52 varieties of rice in the past and still working on more
(Ologbon et al., 2012). The rice varieties developed (such as FARO 15, 44, SIPPI, ITA 306), possess
numerous qualities which include adaptive features to different rice environments (production
systems) in Nigeria such as rain-fed upland, rainfed lowland, irrigated low land, deep inland water
and mangrove swamp. Also, some IRVs are developed as flood and drought-tolerant varieties,
suitable for farmers in high rainfall and low rainfall ecological zones in Nigeria. Apart from the
adaptive features, the most important features of the IRVs are the high yielding qualities; with a
potential yield ranging from 2-8 paddy tonnes/ha and the maturity period ranges from 95-140days
(Ologbon et al., 2012).

4
The introduction of improved varieties has made rice cultivable in mostly all agroecological zones of
the country. However, despite the intensive research towards enhancing the productivity of rice, there
is still a high yield gap. An explanation to this is that Nigerian agricultural sector dominated by
resource-poor smallholder farmers is characterized by low level of technology adoption. It is expected
that the adoption of IRVs and improved management practices would increase productivity and lower
the cost of production for farmers (Awotide et al., 2016).
Ogundele and Okoruwa (2006) observed that the quantity of seeds sowed by farmers adopting IRVs
was low compared to farmers that planted traditional varieties but there was a yield gap between both
groups of farmers; farmers planting traditional varieties having a lower yield than IRVs adopters. This
‘gap’ refers to the difference in productivity on ‘best practice’ in farm operations with comparable
resources and under similar condition (Abedullah et al., 2007). Therefore, the low level of
productivity reflects a low level of technical efficiency, i.e., the ability to get maximum output from
a given set of input. One of the enormous challenges of achieving food production for the growing
population is how to raise productivity and efficiency in the agricultural sector (Osawe et al., 2008).
However, the efficiency approach emphasizes the crucial need for improving the labour productivity
of both men and women in any economic system (Rahman, 2008).
Determining the factors influencing adoption of IRVs and estimating the difference between actual
and technical feasible output among smallholder farmers will have a great impact in increasing food
and agricultural production through improvements in productivity (Abedullah et al., 2007). Generally,
it is believed that resources are underutilized in the agricultural sector especially in the
underdeveloped countries. The major concern of farmers is to make a profit from the business which
solely depends on the resource use efficiency. Measurement of production efficiency in agricultural

5
production especially in developing countries like Nigeria helps to identify the source(s) of
inefficiency, which can serve as a guide for optimal utilization of resources (Betonio et al., 2016).
1.2 Statement of the Research Problem
Nigeria has a land area of 3.4 million hectares potentially suitable for rice production, but only about
1.7 million hectares is being utilized. In addition, less than 50,000 hectares of land is used to cultivate
irrigated rice out of 3.14 million hectares of land suitable for irrigation (GRiSP, 2013). The small
number of hectares under cultivation is an indication that food sufficiency through rice production
has not yet been realized as rice production is left in the hand of smallholders whose output is
inadequate and paddy processing is substandard (Longtau, 2003b). Nigeria’s rice is produced by
more than 90% of resource-poor smallholder farmers, while the remaining 10% is produced by
corporate or commercial farmers. Also, about 95% of rice processors are in small-scale with low-
capacity and obsolete mills (GRiSP, 2013). Despite the dominance and important role played by
smallholder farmers in rice production, they are still faced with some challenges which includes poor
distribution of agricultural inputs such as quality seed, lack of credit facilities, lack of irrigation
facilities, low fertilizer application, unavailability of appropriate small farm machinery for harvest
and post-harvest operation and poor extension services (GRiSP, 2013), which have farmers have
contributed to the low productivity of the farmers.
Poverty could be alleviated through small-scale based agricultural growth through the adoption of
improved agricultural technology. According to Awotide et al. (2016), agricultural innovations played
a significant role in reducing poverty, lowering per-unit costs of production and increasing incomes
of rural farmers. Adoption of IRVs has been found in the literature to have significant and positive
impacts on welfare, poverty reduction and productivity of rice farmers (Adekambi et al., 2009;
Nguezet et al., 2011; Awotide et al., 2016). However, the adoption of improved rice technologies in

6
Nigeria has been low over the years due to the challenges encountered by farmers. Ogunya et al.
(2017) noted that unavailability of fertilizer and improved seeds are the major constraints affecting
adoption of improved rice technologies in Ogun State, South west, Nigeria. Awotide et al. (2016) also
observed that high cost of seed and excessive distance to the source of seed are the major challenges
faced by farmers in accessing IRVs in Nigeria. The disparity in the levels of technology adoption has
been identified as a major setback in rice-based production systems in most developing economies
especially in Nigeria which in turn has led to inefficiency among rice farmers (Ologbon et al., 2012;
Ogunya et al., 2017).
Rice is an important crop that has attracted several studies in Nigeria. Some studies focused on the
consumption and marketing of rice (Adeyeye et al., 2010; Bamidele et al., 2010); whilst others
focused on resource use efficiency (Goni et al., 2007; Amaechina and Eboh, 2017); technical
efficiency (Ayinde et al., 2009; Kadiri et al., 2014) and adoption of improved rice variety (Bzugu et
al., 2010; Awotide et al., 2012; Adedeji et al., 2013). These studies have been conducted in different
regions of Nigeria, however, there is still a deficit in research on adoption of improved rice varieties
and technical efficiency differentials among smallholder rice farmers in Ogun State, Nigeria.
Therefore, there is a need for information on adoption of improved rice varieties and technical
efficiency of smallholder rice farmers in the study area. It is against this backdrop that these pertinent
research questions are raised:
(i) What are the determinants of adoption of improved rice varieties and its impact on
productivity among smallholder rice farmers in the study area?
(ii) Are there differentials in technical efficiency among improved rice varieties adopters and
non-adopters smallholder rice farmers in the study area?

7
1.3 Objectives of the Study
The main objective of the study is to analyse the factors influencing adoption of improved rice
varieties, and technical efficiency differentials among smallholder rice farmers in Ogun State,
Nigeria.
The specific objectives of the study are to;
(i) examine the determinants of adoption of improved rice varieties and its impact on
productivity among smallholder rice farmers,
(ii) estimate differentials in technical efficiency among improved rice varieties adopters and
non-adopters.
1.4 Justification for the Study
The production of rice (quantity of rice produced) has been inconsistent in mostly all the
agroecological zones of Nigeria. This has made the demands for rice exceed the local production
which invariably leads to the high rate of rice importation in the country. Increasing domestic rice
production to satisfy the growing rice consumption and to also reduce rice importation has become a
top priority to the Nigeria Government and great concern in the global world (Ayinde et al., 2009).
Due to the high dependence on foreign rice which places a huge burden on the country’s foreign
reserves, the Nigeria Government has contributed largely to rice research and developmental
programs to boost rice production. Programs such as the National Accelerated Food Production
Program (NAFPP), Green Revolution (GR), African Rice Initiative (ARI) and Agricultural
Transformation Agenda (ATA) among others were introduced to attain self-sufficiency in rice
production. Some of these programs such as ARI promotes the distribution of IRVs to the rice farmers.
However, there is still a low level of awareness and adoption of IRVs among rice farmers. Nguezet
et al. (2011) noted that 6 years after the dissemination of an IRV (New rice for Africa [NERICA]),

8
the level of farmer’s awareness and adoption is still low. According to Ologbon et al. (2012)
production of rice can be increased to a sustainable level in Nigeria when farmers in all agroecological
region adopt and cultivate IRVs with appropriate management practices.
The decision of the smallholder rice farmers to use these IRVs could be based on different factors.
These include the ability of the farmers to understand the costs and benefits as well as other attributes
of the technology. Also, constraint such as labour, capital and credit could also influence farmer’s
decision in adopting a technology.
According to Just and Zilberman (1988) and Ghimire et al. (2015), the adoption of high yielding crop
varieties such as IRVs could increase the productivity of smallholder rice farmers, stimulates the
growth of agro-processing enterprise and facilitates the transition from a low productive subsistence
agriculture to a high productive agro-industrial economy which in turns boost the agricultural sector
contribution to the economy and increase exportation of food commodity. Therefore, for rice
production in Nigeria to be increased to meet the demands of the people and exportation, there is a
need for empirical research on adoption of IRVs and assessment of factors that contribute to
inefficiency of smallholder rice farmers to generate sustainable information to be addressed in policy
making to enhance adoption of IRVs which would in turn improves productivity and efficiency in
rice production.
Recently, there is an increasing rate of smallholder farmers engaging in rice production due to the
current ban placed by the Nigeria government on the importation of rice. Access to productive
resources, adoption of improved technologies (including IRVs) and understanding the appropriate use
and strategic combination of input for rice production by smallholder farmers could lead to an increase
in yield and growth of the sector on the economy. This could also lead to the reduction of poverty
among the rural poor smallholder farmers. The study, therefore, provides useful information for the
9
Nigerian government and policymakers on how to formulate policies and strategies that will enhance
adoption of improved rice varieties and technical efficiency of smallholder farmers by making the
appropriate decision in the combination of resources to achieve the desired output.
The study contributes to general knowledge on the factors influencing adoption of IRVs, productivity
and inefficiency among smallholder rice farmers. The study also contributes to impact evaluation
literature by providing insights on the impact of adoption of improved agricultural technology on
smallholder farmers.
1.5 Outline of the thesis
Chapter 1 of the thesis includes the introduction, background, research problem, objectives and
justification of the study. In chapter 2, literature review of theories and empirical studies relevant to
the study are presented while in chapter 3 results of the first objective of the study which is adoption
of improved rice varieties (IRVs) and its impact on productivity was presented using probit model
and propensity score matching estimation technique. In Chapter 4, the differences in technical
efficiency among adopters and non-adopters of IRVs was estimated using stochastic frontier analysis.
In chapter 5, a summary, conclusion and policy recommendations, based on the empirical results were
presented.

10
CHAPTER 2
LITERATURE REVIEW
2.1 Introduction
This chapter reviews relevant literature in relation to the background of the research problem and the
objective of the study discussed in Chapter 1. The chapter starts with an overview of rice production
in Nigeria followed by explanations and discussion of some key concepts used in the study which
include adoption, impact, productivity and efficiency. Theoretical and empirical evidence on
measurement of adoption and impact of agricultural technology were documented. Subsequent
discussions focused on the types of efficiency with preference to technical efficiency. The different
approaches of measuring efficiency are discussed, followed by a discussion on the empirical
application of stochastic frontier analysis and data envelopment analysis.
2.2 Rice production in Nigeria
Nigeria has favourable soil suitability that supports the cultivation of rice, thus rice is grown in almost
all agro-ecological zones of the country. There are various rice varieties grown across various
ecological zones in Nigeria ranging from the traditional varieties to the improved varieties. The main
rice varieties cultivated before the development of improved varieties are Oryza glabarima and Oryza
sativa. The cultivation of rice in Nigeria started in 1500 BC with the cultivation of indigenous red
grain species Oryza glabarrima in the Niger Delta belt of the country (Ologbon et al., 2012). The
white grain species (Oryza sativa) was introduced in the 1850’s through missionary activities in
Abeokuta, Ogun State, and to other region in Nigeria such as Epe area of Lagos in 1970’s, Abakaliki
and Ogoja in the South after the second world war in 1945, Shaki area of Oyo State in 1945, Oshogbo
area of Osun State in 1954 and Niger Delta region in the early 1960’s (Longtau, 2003b). The improved
varieties such as the New Rice for Africa (NERICA) are hybrids (between Oryza glabarima and

11
Oryza sativa) that are developed through the collaboration between local and international research
institutes.
According to Oladele and Somorin (2008), research on improved varieties of rice in Nigeria started
in 1953 with the establishment of federal rice station (now NCRI) at Badegi in Niger State. The aim
was to produce rice varieties of improved grain quality, uniform grain shape and sizes that will be
suitable for less breakage during milling. The research institute produced 13 improved varieties of
rice, comprising 2 uplands, 8 shallow swamps and 3 deep flooded rice between 1954 and 1970.
Research activities from 1971 concentrated on developing high yielding and disease-resistant
varieties, efficient use of nutrients and good soil management which were achieved through the
adaptation and release of the new varieties.
Rice is grown under different production systems in Nigeria which include rain-fed upland, rain-fed
lowland, irrigated low land, deep inland water, Hydromorphic and mangrove swamp. The
characteristic features of rice growing environment and the features of rice production systems in
Nigeria is presented in Table 2.1 and Table 2.2 respectively.

12
Table 2. 1: Characteristics of rice growing environments in Nigeria
Source: Longtau (2003b)
Rain-fed upland (RU), Rain-fed lowland (RL), Irrigated low land (IL), Deep inland water (DW), Hydromorphic (H) and
mangrove swamp (M).
Table 2. 2: Features of rice production systems in Nigeria
Source: Longtau (2003b)
Agro-climatic
zone
Agro-ecological
zone
Length of
growing
period
(Days)
Annual
Rainfall
(mm)
Rainy
Season
Rice
Growing
Season
Arid Sahel <75 <550 Jul-Aug IL, DW
Semi-arid Sudan Savannah 75-150 550-900 Jul-Sept IL, RU, RL, DW
Sub-humid Northern Guinea
Savannah
151-180 900-1200 Jul-Oct RU, RL, DW, H
Sub-humid Southern Guinea
Savannah
211-270 1200-1500 Jun-Oct RU, RL, DW, H
Sub-humid Derived Savannah 211-270 1500-2000 May-Oct IL, RU, RL, H
Humid Humid forest >270 >2000 Mar-
Nov
IL, RU
Mid- altitude Moist savannah 181-270 1200-1500 April-
Oct
RU, RL
Type Characteristics Geographical spread
Upland Rain-fed rice grown on free-draining fertile soils.
This is also called dry uplands.
Widespread, except coasts, high rain
forests and Sahel. They are found in
Ogun, Osun and Oyo state.
Hydromorphic Rain-fed rice grown on soils with shallow ground
water table or an impermeable layer. This is also
called wet uplands.
Very widespread at the fringes of
streams and intermediate zone
between upland and swamps of rivers
in the Savannah. Found in Anambra,
Ebonyi, and Bayelsa state.
Lowland Rain-fed or irrigated rice in aquatic conditions or
medium ground water table. Water covers the soil
completely at some stage during the cropping
season. These are called shallow swamps or
fadama
Very widespread from high rain
forest to Sahel. Found in Ogun, Osun
and Oyo state.
Deep Inland
Water
Rain-fed rice grown on soils with deep water
tables. The rice crop floats at some stage and
harvesting may be done from a canoe. These are
also called deep fadamas or floodplains
Found in the Sokoto-Rima Basin and
Chad Basin, floodplains of the Niger,
Benue, Kaduna, Gbako, Hadejia and
Komadugu-Yobe.
Mangrove
Swamps
Rice grown at the coast or swamps of the high rain
forest.
Coastal areas and Warri area in Delta
state.
13
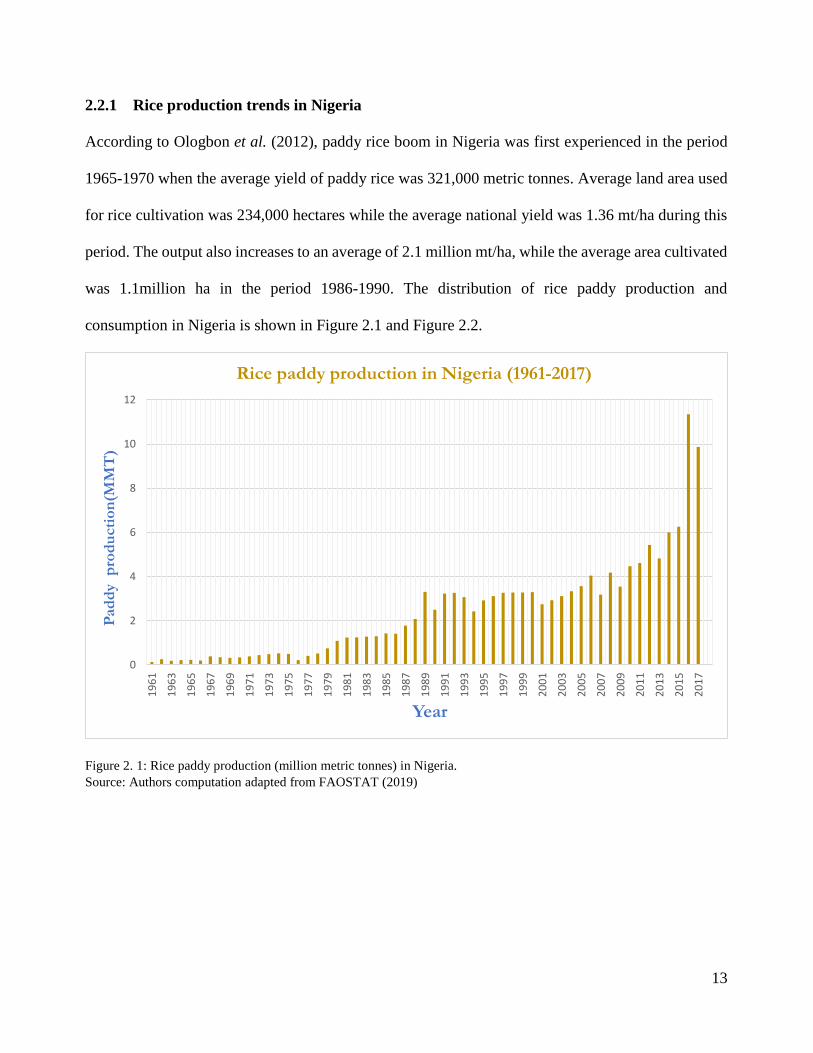
2.2.1 Rice production trends in Nigeria
According to Ologbon et al. (2012), paddy rice boom in Nigeria was first experienced in the period
1965-1970 when the average yield of paddy rice was 321,000 metric tonnes. Average land area used
for rice cultivation was 234,000 hectares while the average national yield was 1.36 mt/ha during this
period. The output also increases to an average of 2.1 million mt/ha, while the average area cultivated
was 1.1million ha in the period 1986-1990. The distribution of rice paddy production and
consumption in Nigeria is shown in Figure 2.1 and Figure 2.2.
Figure 2. 1: Rice paddy production (million metric tonnes) in Nigeria.
Source: Authors computation adapted from FAOSTAT (2019)
0
2
4
6
8
10
12
19
61
19
63
19
65
19
67
19
69
19
71
19
73
19
75
19
77
19
79
19
81
19
83
19
85
19
87
19
89
19
91
19
93
19
95
19
97
19
99
20
01
20
03
20
05
20
07
20
09
20
11
20
13
20
15
20
17
Pad
dy
pro
du
cti
on
(MM
T)
Year
Rice paddy production in Nigeria (1961-2017)

14
Figure 2. 2: Rice area (million hectares) harvested in Nigeria.
Source: Authors computation adapted from FAOSTAT (2019)
Nigeria is yet to be self-sufficient in rice production, although there is an increase in output over the
years, it remains behind the increasing demand of the populace. Bamiro and Aloro (2013) reported
that Nigeria experienced a decreasing trend in rice self-sufficiency in the 1980s, with a decline in
production of 49.9% from 98.9% in the 1970s and further to 30% in early 1990s. The decline in self-
sufficiency in the 1980s was due to the oil boom in the late 70s which diverted the attention of the
government from the agriculture sector to the oil sector. The revenue from crude oil enhances the
GDP of the country which in turn has a positive effect on the income level of the people, which also
increase their preference to the staple crop (rice) among other food.
The demand for rice has continued to exceed production due to factors such as an increase in
population and rural-urban migration (Cadoni and Angelucci, 2013; Amaechina and Eboh, 2017).
The demand for rice was estimated to be 6.3 million tonnes in 2016 while the national supply was 2.3
million tonnes (FMARD, 2016). The quantity of milled rice production and consumption is presented
in Figure 2.3.
0
1
2
3
4
5
6
19
61
19
63
19
65
19
67
19
69
19
71
19
73
19
75
19
77
19
79
19
81
19
83
19
85
19
87
19
89
19
91
19
93
19
95
19
97
19
99
20
01
20
03
20
05
20
07
20
09
20
11
20
13
20
15
20
17A
rea H
arv
est
ed
(h
a)
Year
Rice area harvested in Nigeria (1961-2017)

15
Figure 2. 3: Rice production (milled rice/ tonne) and consumption in Nigeria (1960-2015)
Source: Ayinde et al. (2016)
The huge gap between demand and national production was bridge by the importation of rice into the
country. The importation of rice also increased over the years from 600,000 tonnes in 1981 to one
million tonnes in 1982 and in the year 2011 Nigeria was the largest rice importer in the world with an
estimate of 3.4 million tonnes rice importation (Bamiro and Aloro, 2013; Ogunya et al., 2017).
2.3 Concepts of agricultural technology adoption
Agriculture serves as a source of livelihood for most rural dweller in developing countries like
Nigeria, and therefore development, adoption and diffusion of new agricultural technology offer an
opportunity to increase productivity, efficiency and farmers income substantially (Feder et al., 1985).
Economists and researchers have been attracted to technology innovations in agriculture and they
have tried to explain farm technology adoption.
Rogers and Shoemaker (1971) defined adoption as the decision to apply an innovation and
continuously utilizing it. However, adoption is not a permanent behaviour. This implies that an
individual may decide to discontinue the use of an innovation for a variety of personal, institutional,
and social reasons one of which might be the availability of another practice that is better in satisfying

16
farmers’ needs (Mulugeta and Hundie, 2012). Adoption process is a mental process an individual pass
through from first hearing about an innovation to final adoption (Rogers, 2003). This decision-
making process comprises a sequence of stages with a distinct type of activity taking place during
each stage. According to Rogers (2003) adoption process passes through five main stages;
i. Awareness: the farmer is exposed to new technology but doesn’t have complete information
about it. The farmer knows little or nothing about its special qualities its potential usefulness
and how it would work.
ii. Interest stage: The farmer develops an interest in the technology and seeks additional
information about it.
iii. Evaluation stage: The farmer applies the new technology to his present and the anticipated
future situation on expected returns and decides whether to try it or not.
iv. Trial stage: The farmer experiments the new technology (on a relatively small-scale to assess
its suitability in practice). Here he put the changes in practice i.e. he must learn how, when,
where, how much, etc. For example, a rice farmer may decide to use a plot of land to cultivate
an Improve Rice Variety (IRV) from his 10 plots of rice farm as an experiment. The plots of
land allocated for IRV could be increased if the experiment was successful and the farmer is
convinced of the benefits of the IRV.
v. Adoption stage: the farmer is totally convinced and thus make cultivate IRV on all the farm
plots which signify a full-scale adoption.
Feder et al. (1985) emphasized the need for a quantitative definition of adoption for theoretical and
empirical analysis. They conceptualize adoption in two forms namely; individual (farm-level) and
aggregate adoption. Farm-level adoption is defined as the degree of utilization of new technology in
long-run equilibrium when the farmer has full information about the new technology and its benefit.

17
Aggregate adoption, on the other hand, is the application of new technology within a geographical
area. The spread of this new technology within a locality or region is known as “diffusion”. Rogers
(1995) defined diffusion as the process by which an innovation is communicated through certain
channels over time among the members of a social system.
2.3.1 Approaches to farm technology adoption measurement
Several scholars across the world have over the years used different approaches (models) to analyse
the determinant of agricultural technology adoption. Many studies (Asfaw et al., 2012; Willy et al.,
2014; Ghimire et al., 2015; Khonje et al., 2015; Ali and Behera, 2016; Awotide et al., 2016; Danso-
Abbeam and Baiyegunhi, 2017) have used models such as Probit, Logit, Tobit, Heckman and Double
hurdle model to determine factors influencing adoption of agricultural technology.
Probit and logit are dichotomous choice models classified as a quantal response (all or nothing) and
are usually used for qualitative and categorical data. For example, they are used to measure
technologies that are not divisible such as the utilization of a tractor which is dichotomous (use or no
use) and assumes that factors influencing adoption decision can be personal or external (Danso-
Abbaem, 2018). Probit and logit models are based on normal and logistic cumulative distribution
functions, respectively. Both Probit and Logit model are similar, but the main difference is that the
logistic distribution has slightly fatter tails (Lopes, 2010). The drawback of the dichotomous model
is that they can only measure the probability of adoption but cannot explain the intensity of adoption.
For example, a dichotomous measure of IRV adoption is not adequate to determine the intensity of
adoption about the quantity of IRV a farmer used per plot or hectare.
Tobit model developed by Tobin (1958) is a hybrid of the discrete and the continuous dependent
variable and shows the link between a non-negative exogenous variable and an independent variable
(or vector). Tobit model is employed when the dependent variable is constrained or censored. It is
18
mostly used to determine the factors influencing both the probability and intensity of adoption thereby
estimating the joint effect. However, the drawback of the Tobit model is that probability and intensity
may not be joint decisions.
In providing a solution to this drawback, Heckman (1976) developed a two-step process model
(Heckman model) to estimate the probability (discrete decision) and intensity (continuous decision)
separately. The model involves estimation of a probit model for the probability of a decision, followed
by the insertion of a correction factor (the inverse mills ratio) calculated from the probit model into
the second model which is Ordinary Least Square (OLS) (Bushway et al., 2007). The OLS is used to
estimate the continuous decision. Heckman models help to resolve the endogeneity resulting from
sample selection but do not account for independent variables that are endogenous for other reasons
(Certo et al., 2016). However, the double-hurdle models allow for two independent decisions made
by the production units. The double-hurdle model has two separate hurdle equations which determine
the adoption decision and intensity of use of a technology with an assumption of independence
between the stochastic error terms (Beshir, 2014). In relation to this assumption, the double-hurdle
is like the combination of a binary model (probit or logit) and truncated regression model (Danso-
Abbaem, 2018).
2.4 Concepts and impact evaluation of farm technology
Impact can be defined as the attainment of goals of intervention. Impact evaluation is an assessment
of the significance (outcome) of an intervention. Impact evaluation has involved different methods
and approaches to determine and establish a causal link between the intervention and its outcome.
According to Kedir (2017), there are two common interrelated challenges encountered by impact
evaluation, which are; estimating a viable counterfactual and attributing the impact to an intervention.

19
Evaluating the impact of a developed farm innovation technology (such as IRVs) on farmers’
livelihood is important in determining the converse effects of the technology (Asfaw et al., 2012).
The measurement of impact requires a valid counterfactual (control group) of what those outcomes
would have been in the absence of adopting the technology compared with the adopters of the
technology (treatment group). The comparability of both control and treatment group is done with
respect to observed and unobserved characteristics to ensure that outcome effect of the variable of
interest such as productivity and income for the treatment group is solely due to the adoption of the
technology.
The fundamental problem that occurs in the measurement of impact evaluations is selection bias and
endogeneity. This may be due to the non-random selection of treatment groups. When this occurs the
decision to adopt a technology may be influenced by both inherent and non-observable characteristics
(such as farmers’ motivation and risk attitude) and observable heterogeneity that may be correlated
with the outcome variable (Danso-Abbaem, 2018). The next section discusses the various techniques
of measuring impact evaluations.
2.4.1 Techniques for estimating impact of farm technology
Theoretically, impact evaluation could be estimated using three main methods, such as the
randomization/pure experimental design; non-experimental design and quasi-experimental design
(Kedir, 2017). These methods involved the use of econometrics approach to providing a solution to
selection bias and endogeneity in cross-sectional data. These econometrics techniques include
Instrumental variable (IV), Endogenous Switching Regression (ESR), Conditional Recursive Mixed-
process (CMP), Generalized Propensity Score (GPS) matching in a continuous treatment framework
and Propensity Score Matching (PSM). The Propensity score matching technique is used in this study
and will be discussed in the next section.

20
i) Propensity score matching (PSM)
Rosenbaum and Rubin (1983) initiated the basic idea of propensity score matching. The authors
observed that self-selection bias can be removed through adjustment in propensity scores of treated
and untreated groups. The propensity score matching method has been widely used in agricultural
research to evaluate the impact of agricultural technology adoption on the outcome variable. PSM
helps to address self-selection problem by matching the treatment to the control groups that have
similar characteristics using propensity score.
The propensity score assumes a conditional independence, which considers the decision to adopt as a
random condition on observed covariates. The PSM also assumes common support condition, which
involves comparison in covariates between treated and control groups. In this situation among the
farmers that are compared have a similar probability of being both an adopter and non-adopter. If
both conditional independence and common support assumptions are met, thus the average treatment
effect on the treated (ATT) can be calculated. The average treatment effect is defined as the mean
difference between the treatment group matched with the control group who are balanced on the
propensity scores and fall within the regions of common support.
The PSM technique is estimated in a two-step procedure; firstly, the use of probit or logit model to
calculate the propensity score for each farmer while in the second stage, each adopter is matched with
non-adopter with similar propensity score to estimate ATT (Abadie and Imbens, 2006). Thus, PSM
ensures that the estimated technology effect is only due to the treatment (adoption) and not because
of other covariates by taking care of self-selection bias. However, the estimated treatment effect could
have hidden bias due to unobserved heterogeneity (Willy et al., 2014). The next section discusses on
instrumental variable.

21
ii) Instrumental variable (IV) estimation
The instrumental variable (IV) estimation underlies the assumptions about the structure of the cause-
effect relationship and about the correlations between treatment participation and outcomes (Zeng,
2014). IV approach is designed to deal with the problem of observed and unobserved biases and
endogeneity. IV involves introducing a variable (instrument) that is highly correlated with the
treatment participation but uncorrelated with unobserved characteristics affecting outcomes. An IV
plays an important role in inducing a change in the behaviour of the treated group (adopters) in a way
that it will influence the response variable. However, if instruments are not selected carefully, weak
instrument can result in bias of estimates if the instruments are correlated with unobserved
characteristics affecting the outcome. This drawback can be address by testing for weak instrument.
The main strategies to deal with identification of average treatment effects within the framework of
IV approach include Local Average Treatment Effects (LATE) and Endogenous Switching
Regression (ESR) (Danso-Abbaem, 2018).
2.5 Empirical studies on agricultural technology adoption and impact
Literature in agricultural production across the world has provided evidence on the significance of
agricultural technology adoption in increasing productivity and efficiency of farmers which in turn
lead to increase in income and improvement in the livelihood of farmers. Mulugeta and Hundie (2012)
employed the propensity score matching to analyse the impact of improved wheat technologies on
households’ food consumption in South-eastern Ethiopia. The results indicated that wheat
technologies had a robust and positive impact on farmers’ food consumption levels. The authors found
out that the level of food consumption of farmers was higher by 21% for the adopters. The mean food
consumption for adopters was 2694kcal compared to 2217kcal for non-adopters. The study identified
factors affecting adoption of improved wheat technologies to be age, education, farm experience,
22
participation in off-farm activities, access to credit, extension contact, and livestock holding. Willy et
al. (2014) applied propensity score matching and exogenous switching regression to estimate the joint
effect of multiple soil conservation practices among smallholder farmers in the Lake Naivasha basin
area of Kenya. The findings indicate that there is a significant positive effect of implementing multiple
soil conservation practices on crop productivity.
In analysing the impact of modern technologies on farm productivity in Philippine. Villano et al.
(2015) employed propensity score matching and stochastic frontier to estimate the impact of modern
rice technologies on farm productivity while disentangling technology gaps from managerial gaps.
The empirical results indicated that the adoption of certified seeds has a significant and positive
impact on productivity, efficiency and net income in rice farming. Khonje et al. (2015) utilized
propensity score matching and endogenous switching regression models to analyse the adoption and
impacts of improved maize varieties in Eastern Zambia. The findings show that the adoption of
improved maize leads to significant gains in crop incomes, consumption expenditure, and food
security. The results also show that that improved maize varieties have significant poverty-reducing
impacts in eastern Zambia. In a similar study, Mmbando et al. (2015) employed propensity score
matching, and endogenous switching regression techniques to examine the welfare impacts of
smallholder farmers’ participation in maize and pigeon pea market in Tanzania. The results indicated
that maize and pigeon pea market participation and the level of participation had a positive and
significant influence on the welfare of rural households. The result further shows that maize and
pigeon pea market participation increased consumption expenditure per capita in the range of 19.2–
20.4 % and 28.3–29.4 %, respectively.
Abate et al. (2016) used a propensity score matching technique to evaluate the effects of institutional
financial services on farmers’ adoption of agricultural technology in Ethiopia. The results reveal that

23
access to institutional finance has a significant positive impact on both the adoption and extent of
technology use. Ali and Behera (2016) analyzed the factors influencing farmers' adoption of
energy-based water pumps and impacts on crop productivity and household income in Pakistan,
using a multivariate probit model and propensity score matching approach. The empirical
results indicated that educated, younger, and wealthier farmers are more likely to adopt alternate
energy-based water pumps for irrigation. Furthermore, access to credit facilities and frequent
hours of load shedding were identified as the major factors influencing a farmer's decision to
adopt alternative energy-based water pumps rather than relying on electricity.
In assessing the adoption of agrochemical management practices among smallholder cocoa farmers
in Ghana. Danso-Abbeam and Baiyegunhi (2017) employed multivariate probit and tobit models to
examine the determinants of agrochemical inputs adoption and the extent of adoption, respectively.
The result of the study showed that agrochemical management practices are complementary, and the
adoption of an agrochemical input is conditional on the adoption of others. Factors such as
household characteristics, household assets, institutional variables, and the perception of soil fertility
status and the incidence of pests and diseases were found to influence the adoption of individual
agrochemical inputs. The result also indicated that the intensity of agrochemical adoption is also
influenced by extension services and farmers’ visits to demonstration farms.
Adoption of agricultural technology has attracted many studies (Saka and Lawal, 2009; Awotide et
al., 2013; Nguezet et al., 2013; Oladeji et al., 2015) in Nigeria over the years. Saka and Lawal (2009)
employed adoption index, logit model and stochastic frontier model to examine the determinants of
adoption and productivity of improved rice varieties in South-western Nigeria. The results show that
farmers responded to an intervention program that promotes the use of improved rice varieties with
an adoption rate of 68.7% which leads to an increase of 19.4% in production. The rice yield of

24
farmers adopting IRVs (1.90 tonnes/ha) was significantly higher than that of non-adopters (1.07
tonnes/ha). The estimated average technical efficiency score of the rice farmers was 78.4%,
indicating that rice farmers have the potential to increase their productivity by increasing their farm
size, the quantity of improved seed and fertilizer in south-western Nigeria.
Applying the Average Treatment Effect (ATE), Nguezet et al. (2013) examined the actual and
potential adoption rates and determinants of improved rice variety (New Rice for Africa (NERICA))
among rice farmers in Nigeria. The results indicated that the potential NERICA adoption rate in
Nigeria will be 54% if the entire population is aware and up to 62% if they have access to NERICA
seed. They also found that the actual observed adoption rate (19%) implies a population adoption
gap of 35% and 43% because of lack of awareness and access to NERICA seed, respectively.
Oladeji et al. (2015) utilized probit regression and Heckman two-stage sample selection model to
examine the determinants of awareness and adoption of Improved Rice Varieties (IRVs) in North
Central, Nigeria. The empirical results show that 95.3% of the sampled households were aware of
improved rice varieties while 87.25% had grown at least one of the IRVs at the time of visit. They
also found out that access to credit, access to media, farm size, gender, household size and
agricultural income significantly influence the probability and intensity of adoption of IRVs. In
another study, Awotide et al. (2013) employed inverse propensity score weighing (IPSW) and the
local average treatment effect (LATE) to estimate the impact of seed vouchers on poverty reduction
among smallholder rice farmers in Nigeria. The findings revealed that the Seed Voucher System
(SVS) has a positive and statistically significant impact on annual household income and per capita
consumption expenditure.

25
The above studies reviewed shows that there have not been sufficient studies evaluating the impact
of IRVs adoption on productivity in Nigeria. Therefore, this study aims to contribute to the gap in
impact of adoption of agricultural technology in Nigeria.
2.6 Agricultural productivity and efficiency
Production system and efficiency in resource use in the farm determine the nature and amount of
agricultural resources that would be made available for farmers to enhance their productivity.
According to Coelli et al. (2005), the terms productivity and efficiency are often used interchangeably,
but they are not precisely the same thing. Productivity is an absolute concept which includes partial
factor productivity and total factor productivity and is measured by the ratio of outputs to inputs. The
total productivity is a productivity measure that involves all factors of production while the partial
productivity measures are in terms of specific inputs such as capital, labour and land productivity.
Productivity is a measure of how efficient and effective resources are used as inputs to produce
products and services needed by society in the long run. The increase or decrease in production can
be attributed to the factor used. Thus, if production increases more than the factor used then this is
referred to as increased productivity, but not efficiency. A firm may be technically efficient, but still
not able to enhance its productivity through other sources such as scale economies. Thus, efficiency
is one of the sources of productivity changes just like technological changes when the time is
incorporated. When a firm (farm or other agro-allied enterprises) increases its productivity from one
period to another, the increment may not be due to efficiency improvement alone but may have been
due to technological change or exploitation of scale economies or from some combination of these
three factors (Coelli et al., 2005).
Efficiency is a relative concept and is measured by comparing the actual ratio of outputs to inputs
with the maximum ratio of outputs to inputs (Dao, 2013). Efficiency measurement begins with the

26
seminal work of Farrel (1957) who defined a measure of a firm efficiency. According to Farrel (1957),
efficiency of a firm is defined as the ability to produce the largest possible output from a given set of
inputs. He further explained that this definition is accepted provided that all inputs and outputs are
correctly measured. Farrel (1957) disintegrates efficiency into economic efficiency, technical
efficiency and allocative efficiency. Efficiency is an important economic concept for the measurement
of economic performance of a production unit. Production efficiency is concerned with the relative
performance of the process used in transforming inputs into outputs.
According to Ọlayide and Heady (1982), agricultural productivity is a measure of efficiency since the
aggregate productivity of an economic system is proportional to the efficiency of production of the
components within the systems. Among other scholars, Bravo-Ureta et al. (2007) identified the
importance of an economic concept of farm efficiency and the use of frontier production models to
compare the efficiency of farms. They were able to achieve this by reviewing the concepts, models
and measurement of technical efficiency and production frontier technology stimulated by Farrel
(1957). Therefore, this thesis applies a frontier production approach (best practice frontier) to explore
the technical efficiency of smallholder rice farmers. The next section explains the different types of
efficiency such as technical efficiency and allocative or economic efficiency.
2.6.1 Technical efficiency
According to Briec (1997), the research of productive efficiency originated with the work of
Koopmans (1951), Debreu (1951), and Farrel (1957). In economic literature, there are two main
definitions of technical efficiency. According to Koopmans (1951) who first explain technical
efficiency, a producer is technically efficient if an increase in an output requires a reduction in at least
one other output or an increase in at least one input, and if a reduction in any input requires an increase
in at least one other input or a reduction in at least one output. Debreu (1951) introduced an output-
27
oriented technical efficiency which he called a coefficient of resource utilization. The output-oriented
technical efficiency considers a firm to produce a maximum output without an increase in the use of
a given set of input. Farrel (1957) later implemented the Debreu measure and provided the
measurement of input-oriented technical efficiency which considers the minimal utilization of inputs
by a firm without a reduction in its output. The second definition of technical efficiency by Debreu
(1951)and Farrel (1957) known as Debreu-Farrell measure is defined as one minus the maximum
equi-proportionate reduction in all inputs that still allows the production of given outputs, a value of
one indicates technical efficiency and a score less than unity indicates the severity of technical
inefficiency. Technical efficiency is the degree in which a farmer produces maximum output from a
given set of inputs or uses the minimum amount of inputs to produce a given level of output (Cooper
et al., 2004). A farmer is said to be technically efficient if he produces the highest level of output with
a given set of input i.e. ability to operate on the production frontier
2.6.2 Allocative and economic efficiency
Allocative efficiency also termed as price efficiency, is the ability of a firm to use the inputs in optimal
proportions, given their respective prices (Cooper et al., 2004). This is the degree at which the farmer
maximizes his profit by utilizing his resources (input) with respect to the price of the input. Coelli et
al. (2005) explain allocative efficiency as an input selection which involves selecting the mix of inputs
(e.g. labour and capital) that produces a given quantity of outputs at a minimum cost (given the input
price which prevails).
Economy efficiency is the combination or product of technical and allocative efficiency, which is also
referred to as overall efficiency (Farrel, 1957). Nargis and Lee (2013) explained that economic
efficiency is different from technical and allocative efficiency, even though it is the product of both.
They define Economic efficiency as the ability of a production unit to produce a well-specified output

28
at minimum cost. An economically-efficient firm should be both technical and allocative efficient.
The concept of economic efficiency denotes that the firm is concerned about maximizing profit and
minimizing cost for a given level of output. Therefore, the firms or farms strive to achieve a substantial
level of production by either reducing the cost of output or increasing the output with a certain level
of costs. The next section explains the techniques used in measuring efficiency level.
2.7 Approaches to efficiency measurement
The frontier function models have been used extensively to measure the level of
efficiency/inefficiency of farms. The different frontier models that have been developed based on
Farrell’s work can be categorized into parametric and non-parametric. The parametric approach is
composed of the stochastic frontier approach (SFA), the thick frontier approach (TFA) and the
distribution-free approach (DFA). Non-parametric models encompass of data envelopment analysis
(DEA) and the free disposal hull (FDH). DEA is a linear programming technique, which uses data on
inputs and outputs to construct a best practice production frontier over the data. The main difference
between the parametric and non-parametric is that the parametric approach specifies a functional form
i.e. the random errors and the probability distribution for the inefficiency while the non-parametric
does not. In addition, the parametric approach relies on econometric techniques, which include
stochastic frontier analysis and simple regression analysis while the non-parametric approach uses
mathematical programming techniques.
The stochastic frontier analysis (SFA) and the data envelopment analysis (DEA) are the most
commonly used parametric and non-parametric approach. However, there is no agreement by
researchers on the best method for measuring efficiency. This study focuses on the stochastic frontier
analysis which is discussed in the next section.
29
2.7.1 Stochastic frontier analysis
Stochastic frontier production function was independently proposed by Aigner et al. (1977) and
Meeusen and Van Den Broeck (1977). The model has been reviewed and developed in the work of
Forsund et al. (1980); Schmidt (1986); Bauer (1990); Battese (1992) and Greene (1993). The
stochastic frontier production function allows for technical inefficiencies of production of firms
involved in producing an output. The model also acknowledges the fact there are other sources of
inefficiency that is beyond the control of producers that can affect output. Kumbhakar et al. (1991);
Reifschneider and Stevenson (1991) and Huang and Liu (1994) improved the models for the technical
inefficiency effects involved in stochastic frontier functions. The parameters of the stochastic frontier
and the inefficiency model are estimated simultaneously, given proper distributional assumptions
associated with cross-sectional data on the sample firms. Stochastic frontier analysis (SFA) uses the
maximum likelihood estimation or corrected ordinary least squares (COLS) technique to estimate the
frontier function in a given sample (Richmond, 1974). This depends on whether an explicit
distribution for the error term of the efficiency component is assumed or not (Bravo-Ureta and
Pinheiro, 1993). Explicit, exponential, gamma or half-normal distributions are commonly used when
assumptions are made (Alemu et al., 2017).
The main advantage of SFA is its ability to distinguish deviations from production function as
comprising both random error and inefficiency components. This provides a distinction between a
random symmetrical component which accounts for measurement errors in the output variable and
stochastic effects (e.g. weather influences) and a symmetric deviation component which represents
the inefficiency (Bezat, 2009). However, the stochastic frontier model also has its drawback. The
main disadvantage is that there is no a priori justification for the selection of any distributional form

30
for the inefficiency component of the error term (Greene, 1990). Also, the wrong choice of production
function may influence the result of the analysis.
The model used in this study has a high application preference than the data envelopment analysis in
an agricultural research context. The main reason is that the DEA attributes all deviation from the
frontier is due to farmers’ inefficiency which is not acceptable because in agricultural production
there are some factors that are beyond the farmers control such as weather, pest and diseases (Mango
et al., 2015). Several studies (Battese and Coelli, 1995; Longtau, 2003a; Ogundari, 2008; Mango et
al., 2015) have used the stochastic frontier model to estimate technical efficiency in their empirical
studies.
The measurement of efficiency in agricultural production has remained an important area of research
in both developing and developed countries. Farrell’s (1957) paper has led to several empirical studies
of efficiency measures to evaluate the performance of farms. The first application of the stochastic
frontier model to farm level data was done by Battese and Corra (1977) who estimated deterministic
and stochastic Cobb-Douglas production frontiers for the grazing industry in Australia. The variance
of the farm effects was found to be a highly significant proportion of the total variability of the
logarithm of the value of sheep production in all states. However, their study did not directly address
the technical efficiency of farms.
Bagi (1984) used the stochastic frontier Cobb-Douglas production function model to analyse the
differences in technical efficiencies of small and large crop and mixed enterprise farms in West
Tennessee. The study found that the variability of farm effects was highly significant. The average
technical efficiency of mixed enterprise farms was found to be smaller (76%) than for crop farms
(85%). Battese and Coelli (1995)employed the Cobb-Douglass stochastic frontier to estimate the
source of technical inefficiency on paddy rice farms in Aurepalle India using panel data for ten years.

31
They concluded that older farmers where more inefficient than the younger ones, also farmers with
greater years of schooling were more efficient but declined over a period of ten years. In a study by
Sharma and Leung (1998) on technical efficiency of carp production in Nepal. The estimated average
technical efficiency is 77% with intensive farms being more efficient than extensive farms. They also
concluded that the adoption of regular fish, water, and feed management activities has a strong
positive effect on technical efficiency.
Seyoum et al. (1998) used a translog stochastic production frontier to analyse technical efficiency of
maize producers in Eastern Ethiopia for farmers within and outside the Sasakawa Global 2000 project.
The mean technical efficiency of farmers within the SG 2000 project was estimated to be 0.937 while
the estimate of the farmers outside the project was 0.794. They concluded in the study that younger
farmers are more technically efficient than older farmers. Also, farmers with more years of school
were more technically efficient. However, those that obtained information from extension advisers
tended to reduce the technical inefficiency.
Abdulai and Eberlin (2001) employed the translog stochastic frontier model to estimate the technical
efficiency of maize and beans in Nicaragua. The average technical efficiency was 69.8 and 74.2%
for maize and beans, respectively. Also, the human capital, access to formal credit and farming
experience contribute positively to production efficiency, while farmers’ participation in off-farm
employment tended to reduce production efficiency. Fleming and Coelli (2004) employed the
stochastic frontier model to assess the performance of a nucleus estate and smallholder scheme for oil
palm production in West Sumatra. The mean technical efficiency of the farmers was 0.66 which
suggests that 0.34 of oil palm yield was lost due to inefficiency. Al-Hassan (2008) used translog
stochastic frontier analysis to analyse the technical efficiency of rice farmers in Northern Ghana. The
rice farmers were found to be technically inefficient, producing below the frontier with an average
32
efficiency level of 53%. Khai and Yabe (2011) used a Cobb-Douglass stochastic production frontier
to analyse technical efficiency of rice production in Vietnam. The mean technical efficiency of the
farmers was 81.6% which suggests that 18.4% of paddy rice was lost due to inefficiency.
In measuring the technical efficiency of smallholder maize production in Zimbabwe. Mango et al.
(2015) used a Cobb-Douglas stochastic frontier production function to determine the production
elasticity coefficients of inputs, technical efficiency and the determinants of efficiency. The technical
efficiency analysis suggests that about 90% of farmers in the sample were between 60 and 75%
efficient, with an average efficiency of 65%. The significant determinants of technical efficiency were
the gender of the household head, household size, frequency of extension visits, farm size and the
farming region. The results imply that the average efficiency of maize production could be improved
by 35% through better use of existing resources and technology. Alemu et al. (2017) employed the
Cobb-Douglas stochastic frontier model to estimate the technical efficiency of apple production in
Ethiopia. The average technical efficiency was 40% and 52% for production of apple fruits and
seedlings which suggest that 60% and 48% of apple fruits and seedlings were lost due to inefficiency.
The stochastic frontier analysis has been applied in agricultural empirical studies in Nigeria. Udoh
(2000) used the Maximum Likelihood Estimation of the stochastic production function to examine
the land management and resource use efficiency in South-Eastern Nigeria. The study found a mean
output-oriented technical efficiency of 77%. Amaza and Olayemi (2002) investigated technical
inefficiency in food crop production among farmers in Gombe State, Nigeria. The average technical
efficiency was 69%. In analysing the resource use efficiency of urban farmers in Uyo, South Eastern,
Nigeria. Umoh (2006) employed the Maximum Likelihood Estimation stochastic production frontier
approach. The average technical efficiency of urban farmers is 72%. Idiong (2007) estimated the
farm level technical efficiency of small-scale Swamp Rice Production in Cross River State of Nigeria,

33
using the Cobb-Douglass stochastic frontier production approach. The results show that the rice
farmers were not fully technically efficient. The mean efficiency obtained was 77% indicating that
there was a 23% allowance for improving efficiency. The result also shows that farmers’ educational
level, membership of cooperative/farmer association and access to credit significantly influenced the
farmers’ efficiency positively. Ogundari (2008) estimated the technical efficiency of rice farmers in
Nigeria, using the translog stochastic frontier approach. The mean technical efficiency of the farmers
was 0.75 which suggests that 0.25 of rice yield was lost due to inefficiency.
Omonona et al. (2010) used the Cobb-Douglass stochastic frontier production function to analyse the
technical efficiency of cowpea farmers in southwest Nigeria. The farmers’ average technical
efficiency is 87%, which suggest an appreciable use of inputs in productivity. The average technical
efficiency of the irrigated and rain-fed rice farmers was 76% and 71% respectively. Abba and Isa
(2015) applied the Cobb-Douglass stochastic frontier model to estimate the technical efficiency of
rice farmers in Adamawa state, Nigeria. They estimated the average technical efficiency of irrigated
and rain-fed rice farmers to be 76% and 71% respectively. Okoye et al. (2016) analysed the
differentials in technical efficiency among smallholder cassava farmers in Central Madagascar using
a Cobb Douglas stochastic frontier production approach. The average technically efficiency of the
farmers was 79%, suggesting that opportunities still exist for increasing efficiency among the farmers.
The next section continues with the other approach of measuring efficiency.
2.7.2 Data envelopment analysis (DEA)
Among other scholars, Charnes et al. (1978) were the first to introduce DEA in estimating efficiency
based on seminal work by Farrel (1957). Charnes et al. (1978) developed DEA to analyse the
performance of public sector organization whose goals are not profit maximization (Oberholzer and
Van der Westhuizen, 2009). DEA is a linear programming technique used to estimate a non-

34
parametric production frontier for the peer decision-making units (DMUs). It gives a piece-wise linear
frontier that “envelopes” the observed input and output data (Coelli et al., 2002). In agricultural
context, the DMUs are the farmers.
DEA model can be input and output oriented based on DMUs (De Koeijer et al., 2002). If the DMUs
have more control over inputs variable than the output variables, the DEA model should be input
model if otherwise, it should be output model. The DEA estimates the efficiency of a farm as the ratio
of its weighted output to its weighted input where the ratio of the farm is not greater than 1 (Mardani
and Salarpour, 2015).
The main advantage of DEA is that it does not require a specific functional form for the frontier to be
specified. Also, it can be used in estimating technical, allocative, cost and scale efficiency. However,
DEA has a drawback of attributing all deviations from the production frontier to inefficiencies of the
farmers which denotes that it doesn’t account for random error (such as measurement error, pest and
diseases).
DEA has been applied to many agricultural studies. Llewelyn and Williams (1996), analyse the
technical, pure technical and scale efficiencies of food crops in Indonesia using DEA. They estimated
the efficiencies for three production seasons which are the rainy, middle and dry season. The results
indicated that average overall technical efficiency, pure technical efficiency and scale efficiency of
farms was estimated to be 98.1%, 98.8% and 99.2% during the rainy season; 95.5% and 97.7%, 97.7%
during the middle season and 97.7%, 98.9% and 98.7% during the dry season. They further observed
that majority of the farmers are efficient but farmers that are operating inefficiently do so more
because of scale inefficiencies rather than technical inefficiency.
Coelli et al. (2002) employed DEA to estimate the technical, allocative, cost and scale efficiencies of
rice cultivation in Bangladesh. They estimated the efficiencies for two production seasons (dry and

35
wet season). The mean technical, allocative, cost and scale efficiencies during dry season was
estimated to be 69.4%, 81.3%, 56.2%, 94.9 and 66.2%, 78.0%, 51.7%, 93.3 % for the wet season.
Solomon et al. (2015) applied DEA to examine gender differentials in scale and technical efficiencies
among improved wheat variety growers in Ethiopia. The DEA results indicated that the women
farmers are more efficient than the men farmers with an average technical efficiency of 80.8% and
70%, and average scale efficiency of 78% and 81.6% respectively
2.8 Factors affecting agricultural productivity and efficiency
This section aims to discuss the factors influencing agricultural productivity and efficiency. The
determinants of agricultural productivity and efficiency are categorized into production factors and
inefficiency factors. The production factors are the resources used in agricultural production while
the inefficiency factors are variables that contribute to the inefficiency of the farmers such as socio-
economic and socio-institutional factors are. The determinants are discussed in detail in the next
section;
2.8.1 Resource use in rice production
Agricultural resources used in producing a farm output includes land, fertilizer, seed, agrochemicals
and labour. The efficient combination of these resources yields the desired output. This section
reviews literature on resource use in rice production.
i) Land
According to Kagoda (2008), land is the most valuable form of property in agrarian societies because
of its economic, political and ritual importance. Land is one of the most important resources used in
agricultural production because other resource depends on land for an output to be produced. The size
of land area used in farming has an influence on output. Efficient use of land combined with other
farm inputs will enhance the productivity of rice. For instance, (Abadie and Imbens, 2006); Tu et al.

36
(2018), indicated that farm size increases the technical efficiency of rice farmers in Vietnam. They
reported that rice farmers were efficient in the utilization of farmland even though agricultural land
ownership were limited to 3 hectares per household by Vietnamese land law. Some empirical studies
in Nigeria (Ogundele and Okoruwa, 2006; Ogundari et al., 2010; Akighir and Shabu, 2011; Ohen and
Ajah, 2015; Amaechina and Eboh, 2017) has also found farm size to be significant and positively
related to rice yield.
ii) Fertilizer
The depletion of large quantities of soil nutrients has been caused by smallholder farmers without
sufficient quantities of organic or inorganic fertilizer to replenish the soil over the decades (Sanchez,
2002). Soil nutrients depletion can be overcome using mineral fertilizers. The deficit in mineral
fertilizer application by resource-poor small-scale farmers is due to the high cost. Sanchez (2002),
reported that fertilizer cost in Africa is between two to six times the cost in Europe, North America
or Asia which result in Africa being one of the lowest fertilizer consumption continents. The quantity
of fertilizer usage also varies across different African countries, for example, GRiSP (2013) reported
that fertilizer application rate of 13kg/ha used by farmers in Nigeria is one of the lowest in sub-
Saharan African (SSA).
Figure 2. 4: World share in consumption of nitrogen fertilizer
Source: FAO (2011).

37
Ahmed et al. (2017) in a study comparing rice production in Nigeria to China, observed that the yield
in rice production in China is higher than that of Nigeria due to increase in the use of chemical
fertilizers. Other empirical studies conducted in different part of the world including Africa has shown
that fertilizer has a significant and positive relation to rice yield (Akighir and Shabu, 2011; Hussain,
2013; Villano et al., 2015; Ishani et al., 2016). In contrary to these studies, Llewelyn and Williams
(1996) observed a negative relationship between fertilizer and yield of crop (including rice) farmers
in Indonesia. They explain that the farmers using high quantity of fertilizer are less efficient and this
may be due to a high fertilizer subsidy during the study period and thus the farmers might be using
above the recommended rate. In a similar study, Abedullah et al. (2007) found fertilizer to be
significant and negatively related to rice yield in Pakistan. They argued that this is due to an
inappropriate combination of different fertilizer nutrients (NPK, P, 𝑃2𝑂5) rather than over utilization
of fertilizer because the total amount of fertilizer (NPK) used by the farmers is below the
recommended rate.
iii) Seed
According to Cassman (1999), the gap between average yields achieved by farmers and potential
yield is determined by the quality of crop varieties or hybrids and the efficiency of farmers on crop
and soil management practices. Seeds used in rice production are classified into two, which are local
and improved varieties. Different varieties of rice seeds have been developed over the years. Rice
seed varieties are planted based on their adaptive features to the different production system.
However, accessibility to high yielding rice seeds variety will enhance productivity and efficiency in
rice production. Ishani et al. (2016) conducted a study on resource use efficiency in rice production
in India, they observe that a percentage increase in the quantity of seed sown will result in 10%
increase in rice yield. Ogundele and Okoruwa (2006) observed that farmers with improved seed have

38
a higher yield than farmers that planted local rice seed in Nigeria. Ogundari et al. (2010) also provide
evidence that seed has a positive and significant impact on the yield of rain-fed rice farmers in Nigeria.
In contrary Huynh-Truong (2009), observe that an increase in the quantity of seed will decrease the
yield of rice farmers in Vietnam. This is because of the adoption of advanced rice farming practices
in the area which are intended to minimize the quantity and cost of input used in production to
maximize output. For example, practicing row seeding will lead to a reduction in the quantity of seed
sowed by 80 – 120kg/ha which in turn reduces labour requirement also.
iv) Agrochemicals
The occurrence of weeds, pests and diseases along with soil fertility depletion is a major biophysical
cause of low per capita food production in Africa (Sanchez, 2002). One of the production challenges
encountered by rice farmers is the invasion of weeds, pests and diseases on rice plot which might be
caused by poor farm management practices. Agrochemicals such as pesticide and herbicide are
important inputs used in rice production to enhance productivity and efficiency. Ogundari (2008)
conducted a study on resource-productivity, allocative efficiency and determinants of technical
efficiency of rain-fed rice farmers in Nigeria, the study showed that herbicide is statistically
significant and positively related to rice yield. The study also found out that herbicide contributed
most among other inputs to paddy rice yield of the farmers. In contrary, Heong et al. (1994), observed
that application of insecticide does not increase rice yield in Philippines and Vietnam. They observed
that the insecticide used does not affect the leaf borers hence not effective in enhancing rice
production. Similarly, Nimoh et al. (2012) also found agrochemicals application to be statistically
significant and negatively related to rice yield in Ghana.

39
v) Labour
Labour is an important resource used in rice production process. The advancement of technology has
resulted in the substitution of human labour for machinery to perform different farm operations in
most developed countries. Despite this, human labour cannot be eradicated because they are needed
to operate these machines. However, in many African countries where there is low use of machinery
on farms, small scale farmers depend on labour forces to carry out their farm operations such as land
clearing, ridging, seed planting, agrochemicals application and harvesting. In agriculture, human
labour comprises of family and hired labour. Family labour are members of the farmers’ household
while hired labour are individuals paid to work on the farm. Hired labour can be of two forms the
skilled and unskilled labour. The skilled labourers are used in some sensitive production process such
as agrochemicals application and use of farm technology while unskilled labourers are used in other
manual farm operations such as weeding and harvesting. Family labour is more used by resource-
poor farmers than hired labour because of the high cost of hired labour (Masterson, 2007).
The efficient utilization of human labour has effect on rice productivity. Empirical studies (Al-
Hassan, 2008; Huynh-Truong, 2009; Khai and Yabe, 2011; Villano et al., 2015) has provided
evidence that labour had a statistically significant and positive impact on rice yield in Africa and Asia.
Khai and Yabe (2011) observed that labour is one of the most important factors having positive effect
on technical efficiency level of rice farmers in Vietnam.
2.8.2 Factors influencing inefficiency in agricultural production
The inefficiency factors are variables influencing the level of efficiency and productivity of the
farmers. The inefficiency factors can be categorised into socio-economic and socio-institutional
factors. Literature on inefficiency variables are discussed below.

40
2.8.2.1 Socio-economic factors
The socio-economic variables found to influence the level of technical efficiency of rice farmers in
literature include age, gender, household size and farming experience.
i) Age
The age of farmers is important in determining the farmer’s efficiency level. A positive or negative
impact on efficiency depends on whether older farmers are more experienced or slower in adopting
new technologies than younger farmers (Tipi et al., 2009). Abedullah et al. (2007) found age to be
positive and significantly influence the technical inefficiency of rice farmers in Pakistan. This implies
that older rice farmers are technically inefficient than young farmers. This is maybe due to the reason
that they are physically less active in performing different farm operations. In estimating gender
differences among men and women rice farmers in Nigeria, Oladeebo and Fajuyigbe (2007) observed
age to be negatively related to the inefficiency of both men and women farmers. They explained that
young rice farmers are more efficient than older farmers because they are likely to be more
progressive and willing to adopt new practices which in turn enhances their technical efficiency in
rice production.
ii) Gender
Gender difference in farm productivity and efficiency in subsistence farming has been an issue of
interest in public policy in developing countries (Dossah and Mohammed, 2016). Determining the
efficiency level of both male and female farmers is significant in enhancing food security in Africa
where there is high disparity in cultural and religious believe. Addison et al. (2016) reported that
female farmers are more technically inefficient than male rice farmers in Ghana. This finding is also
consistent Adesina and Djato (1997) who observed that inefficiency of women rice farmers was due
to constraints in accessing productive inputs. In a similar study, Omondi and Shikuku (2013) provide

41
evidence that male farmers are more efficient than female rice farmers in Kenya. Kinkingninhoun-
Mêdagbé et al., (2010) observe a significant difference in paddy rice yield of men and women rice
farmers in Benin. However, they indicated that there is no significant difference in technical efficiency
of men and women farmers. They further explained that the higher productivity of men farmers than
their female counterpart is due to the possession of larger land holding size allocated for rice farming
by men farmers.
iii) Household size
The significance of household size in agriculture cannot be overemphasized. Household size
contributes largely to subsistence farming in most Sub-Saharan countries where farmers depend on
household members for about 80% of labour required for farm operations due to high cost of the hired
labour (Ogundele and Okoruwa, 2006). Empirical studies (Oladeebo and Fajuyigbe, 2007; Al-
Hassan, 2008; Ayinde et al., 2009; Nwosu et al., 2015) provide evidence that household size increases
efficiency and productivity of rice farmers. For example, Nwosu et al. (2015) provide evidence that
household size is significant and has a positive relationship with paddy rice output and farmers’
income in Nigeria. In contrary, Ayinde et al. (2009) observed that household size has a negative
influence on technical efficiency of rice production in Nigeria.
iv) Farmers experience
Empirical studies (Bozoğlu and Ceyhan, 2007; Bäckman et al., 2011; Omondi and Shikuku, 2013; Tu
et al., 2018) indicated that farmers experience has a positive influence on technical efficiency. For
example, Bäckman et al. (2011) provide evidence that rice farmers with more farming experience are
more technically efficient than farmers with less farming experience in Bangladesh. However, Huynh-
Truong (2009) observed that farming experience is positive and significant in explaining technical
inefficiency of rice farmers in Vietnam. This implies that farming experience does not contribute to

42
increasing the efficiency level of the farmers. The author explained the reason for this was that farmers
with high farming experience neglected the traditional farm practices and might follow the innovation
on advanced farm technologies taught by agricultural technicians inappropriately.
2.8.2.2 Socio-institutional Factors
This section discusses literature on socio-institutional factors that influence technical inefficiency.
The socio-institutional variables include education, extension service and farmer-based organisation.
i) Education
The role of education in enhancing farmers’ productivity and efficiency is widely known because it
enables farmers to understand the socio-economic conditions guiding their farming operations and to
learn how to collect, retrieve, analyse and disseminate information (Al-Hassan, 2008). In estimating
technical efficiency of rice farmers in Northern Ghana, Al-Hassan (2008), observe that education is
significant in increasing the efficiency level of irrigated and non-irrigated rice farmers. The author
explained that farmers with high level of education can form farmer’s organisation which in turns
enable them to have easy access to credit facilities from government or non-governmental
organisation.
Khai and Yabe (2011) provide evidence that primary school and secondary school education is
positive and significantly influence the technical efficiency of rice farmers in Vietnam. They
explained that farmers with secondary education level and above are more productive than those
without education or primary education level. Llewelyn and Williams (1996) found out that high
school education has a significant and positive relationship with the efficiency level of rice farmers
during the rainy, middle and dry season in Indonesia. Ogundele and Okoruwa (2006), also indicated
that education decreases the inefficiency level of rice farmers in Nigeria.

43
ii) Extension services
Extension services are important in small and large-scale farming as it provides relevant information
to farmers that in turns enhances their productivity and efficiency. Al-Hassan (2008), provide
evidence of a negative relationship between extension contact and technical inefficiency of the
farmers. This implies that farmers that have contact with extension agent are more technically efficient
than farmers with no contact. He explained further that extension contact increases technical
efficiency because farmers are able to adopt modern farm techniques involved in different rice
farming operation such as land preparation, seed planting and application of agrochemicals.
Conversely, Oladeebo and Fajuyigbe (2007) observe a significant and positive relation between
extension contact and technical inefficiency of upland men and women rice farmers in Nigeria. They
explained that inefficiency of farmers that have access to extension agent might be due to the farmers
not adhering to instructions or slow in adopting innovations taught by the extension agent.
iii) Farmer-based organisation
Farmers’ organisation plays a crucial role in enhancing the productivity of farmers as it provides
farmers with relevant information related to farming operations and serves as a link in accessing credit
facilities and productive inputs from government and non-governmental organization (NGO). Several
studies (Kuwornu et al., 2013; Abba and Isa, 2015; Danso-Abbeam et al., 2015) had observed the
relationship between farmer-based organisation and efficiency of farmers. For example, Abba and Isa
(2015) observed farmer association to be significant in reducing the technical inefficiency of rice
farmers under irrigation production system in Nigeria. In contrary, Kuwornu et al. (2013) indicated
that members of farmer-based organisation are technically inefficient than non-members of a farmer-
based organization in Ghana. The authors explained that the reason for this might be due to members
focusing more on other activities in meetings such as how to acquire inputs from government and

44
NGOs rather than learning improved farming practices during their meetings. However, Chiona et al.
(2014) observe no significant relationship between farmers association and technical inefficiency of
smallholder farmers in Zambia.
2.9 Chapter summary
Agricultural technology such as IRV adoption is important in reducing hunger and promoting food
security in SSA including Nigeria. This chapter presented an overview of rice production in Nigeria
and the relevant concepts related to the study. A review of approaches and econometric techniques
for measuring adoption and technical efficiency were also presented. The Chapter indicated the
advantages and drawbacks of the econometric techniques. In farm impact technology adoption
literature, it was deduced that the two major estimation techniques used are; Instrumental Variable
and PSM. The two important efficiency estimation techniques (SFA and DEA) were also discussed,
emphasising more on the SFA. The Chapter explains the link and differences between Agricultural
productivity and efficiency. The Chapter concludes with the review of resource use in rice production
and some important variables influencing farm technology adoption, productivity and efficiency.

45
CHAPTER 3 ADOPTION OF IMPROVED RICE VARIETIES AND ITS IMPACT ON
PRODUCTIVITY AMONG SMALLHOLDER RICE FARMERS
3.1 Introduction
In this chapter, the methodologies and the empirical results regarding the factors influencing the
adoption of improved rice varieties (IRVs) and its impact on productivity of smallholder rice farmers
are presented and discussed. The rest of the chapter is structured as follows: Section 3.2 presents the
conceptual framework, estimation techniques and the description of variables used in the empirical
models. Section 3.3 constitutes the description of the study area, data collection, and sampling
techniques. In section 3.4, the empirical results and discussions are presented while section 3.5
concludes the chapter with a summary of the results as well as policy recommendation.
3.2 Conceptual and analytical framework
Agriculture serves as a source of livelihood for must rural dwellers in developing countries like
Nigeria, and therefore development, adoption and diffusion of new agricultural technology offer an
opportunity to increase productivity, efficiency and farmers income substantially (Feder et al., 1985).
Smallholder farmers in Nigeria are involved in a series of decision making (which include adoption
of farm technology) during production. Rogers and Shoemaker (1971) defined adoption as the
decision to apply an innovation and continuous utilization of it. Adoption of IRVs coupled with
combining efficient production input and best management practices could enhance productivity
(reducing the gap between potential and actual output) and income of smallholder rice farmers in
Nigeria.

46
Following Baiyegunhi et al. (2019) and Khonje et al. (2015) the decision to adopt technology (IRVs)
can be analysed and modeled in a random utility framework. The model assumes that a utility
maximizing farmer will adopt an IRV if the expected net utility (rice yield) from adoption (𝑈𝑖𝐴) is
greater than non-adoption(𝑈𝑖𝑁). If 𝑁∗ denotes the expected net utility, a farmer will choose to adopt
IRVs if 𝑁∗ = 𝑈𝑖𝐴 − 𝑈𝑖𝑁> 0. The net utility is unobserved and can be expressed as a function of
observable elements in the latent variable model below:
𝑁𝑖∗ = 𝑍𝑖𝛼 + 휀𝑖 , with 𝑁𝑖 = 1, if 𝑁𝑖
∗ > 0 (3.1)
where 𝑁𝑖 is a binary dummy variable that equals 1 if farmer 𝑖 adopts IRVs and 0 otherwise; 𝛼 is a
vector of parameters to be estimated; 𝑍𝑖 is a vector of household and farm characteristics and 휀𝑖 is the
random error term. The farmers’ performance indicator is the net yield of paddy rice. The treatment
variable was a binary indicator of whether a farmer adopts IRVs or not.
Evaluating the impact of a developed farm innovation technology (such as IRVs) on farmers’
productivity is important in determining the converse effects of the technology (Asfaw et al., 2012).
The measurement of impact requires a valid counterfactual (control group) of what those outcomes
would have been in the absence of adopting the technology compared with the adopters of the
technology (treatment group). The comparability of both control and treatment group is done with
respect to observed and unobserved characteristics to ensure that outcome effect of the variable of
interest (productivity) for the treatment group is solely due to the adoption of the technology.
The fundamental problem that occurs in the measurement of impact evaluations is selection bias and
endogeneity. This may be due to the non-random selection of treatment groups. When this occurs the
decision to adopt a technology may be influenced by both inherent and non-observable characteristics
(such as farmers’ motivation and risk attitude) and observable heterogeneity that may be correlated
with the outcome variable (Danso-Abbaem, 2018). The potential selection bias can be addressed by

47
Propensity Score Matching (PSM) techniques estimating the average treatment effect (ATT). PSM
ensures that the estimated technology effect is only due to the treatment (adoption) and not because
of other covariates by taking care of self-selection bias.
3.3 Empirical model specification and estimation technique
This study used the propensity score matching (PSM) to estimate the impact of adoption of IRVs on
smallholder rice farmers’ yield. The basic idea of PSM was introduced by Rosenbaum and Rubin
(1983) who observed that self-selection bias can be removed through adjustment (matching) using
propensity score between the treated (adopters) and untreated (non-adopters) groups. PSM has been
applied in many studies (Asfaw et al., 2012; Willy et al., 2014; Khonje et al., 2015; Villano et al.,
2015; Ali and Behera, 2016) to control for self-selection bias.
In this study, self-selection problem (bias) may occur since adoption of IRVs by farmers is not random
but based on factors influencing farmers’ decision. Thus, farmers who adopt IRVs may systematically
differ from non-adopters based on several factors such as farm-specific, and socio-economic
characteristics which might influence the rice yield of farmers. In order to estimate the impact of IRVs
on the productivity of smallholder farmers the self-selection bias problem must be addressed (Willy
et al., 2014). The self-selection problem is solved by implementing PSM which involves the use of
a binary choice model to generate a propensity score for each farmer in the study. In PSM, each
farmer receiving treatment (adopters) is matched with untreated farmers (non-adopters) based on
observable covariates in a quasi-experimental approach to mimic random assignment to treatment and
then measure the average differences in the productivity (rice yield) between the adopters and non-
adopters of IRVs. The PSM can be expressed as;
𝑝(𝑋) = Pr[𝐷 = 1|𝑋] = 𝐸[𝐷|𝑋]; 𝑝(𝑋)=𝐹{ℎ(𝑋𝑖)}, (3.2)

48
where 𝑝(𝑋) is a propensity score, and Pr is the probability of adopting IRVs (taking a treatment, 𝐷 =
1 and 0 otherwise) conditional on the vector of observed covariates (pre-treatment characteristics), 𝑋
and {.}F can be a normal or logistic cumulative distribution.
A probit model was employed in the study to estimate the predicted probabilities (propensity scores)
of adopting IRVs. Following Greene (2003); Verbeek (2008) and Willy et al. (2014)the probit model
is expressed as;
𝑃𝑟(𝐷 = 1|𝑋) = 𝐺(𝑧) = ∫ ∅(𝑧)𝑑𝑍𝑋′𝛽
−∞= 𝝓(𝑋′𝛽) (3.3)
where 𝐺(𝑧) is a function taking values between 0 and 1, ∅ is the standard normal probability density
function, 𝑧 is the vector of covariates and 𝝓 is the standard normal cumulative distribution function.
The probabilities were estimated using the maximum likelihood method specified as;
ln 𝐿 = ∑ ln[1 − 𝝓(𝑋′𝛽)] + ∑ ln 𝝓(𝑋𝑖′𝛽) 𝑦𝑖=1𝑦𝑖=0 (3.4)
The empirical probit model estimated is expressed below;
𝑌𝑖∗ = +𝑢𝑖 , 𝑢𝑖~𝑁(0, 1), 𝑖 = 1 … . , 𝑁 𝑎𝑛𝑑 𝑌𝑖 = {
1 𝑖𝑓 𝑌𝑖∗ > 0
0 𝑖𝑓 𝑌𝑖∗ < 0
(3.5)
where 𝑌𝑖∗ is a latent variable representing the decision to adopt IRVs, 𝑌𝑖 is the observed status of
adopting IRVs for each farmer, 𝑋 is a matrix of explanatory variables which include farmer and
farmer and farm characteristics, socio-economic and institutional factors, the 𝛽𝑠 are the parameters
to be estimated and 𝑢𝑖 is a normally distributed error term.
The predicted probabilities obtained by estimating the model above (equation 3.5) are used as
propensity for matching the samples of IRVs adopters and non-adopters. After propensity scores
estimation, a matching algorithm was used to match each adopter with a non-adopter with similar
propensity score. This study employed three matching methods, nearest neighbour matching (NNM),
Kernel-based matching (KBM) and radius matching (RM) techniques to estimate the impact of IRVs

49
on yield of the smallholder rice farmers. The nearest neighbour matching methods consist of matching
each adopter farmer with the non-adopter farmer that has the closest propensity matching score. It can
be applied with or without replacement of observations. The NNM may result in bad matching if the
closest neighbour is far away. This can be corrected using a radius matching technique which imposes
a maximum tolerance on the difference in propensity scores (Mulugeta and Hundie, 2012). However,
some treated units may not be matched if the dimension of the radius is too small to control units. The
kernel based matching methods involves matching all adopter farmers with a weighted average of all
non-adopter farmers using the weight that is inversely proportional to the distance between the
propensity scores of the farmers in adopter and non-adopters group (Becerril and Abdulai, 2010). The
common support was imposed to construct the matching estimates. The common support condition
involves selecting comparable observations from the adopters and non-adopters groups in the
analysis. Thus, all the observations outside the common support were excluded from the analysis in
the study.
The balancing property of the sample was necessary to be observed in the analysis to ensure that all
farmers within the common support area have the same distribution of observable characteristics,
irrespective of whether the farmer adopts IRVs or not (Villano et al., 2015). The balancing property
indicates the matching quality of the samples. This study employed the standardized bias method to
observe the matching quality, which calculates the bias in the mean difference of covariates for the
adopter and non-adopter groups after matching. If the average bias in mean difference is less than 5%,
it denotes the samples are matched well. After the propensity scores have been estimated, the causal
effect of adoption of IRVs on rice yield was calculated using the average treatment effect on the
Treated (ATT). The average treatment effect is defined as the mean difference between the treatment
50
group matched with the control group who are balanced on the propensity scores and fall within the
regions of common support. The ATT is specified as follows;
𝐴𝑇𝑇 = 𝐸(𝑌1|𝐷 = 1) − 𝐸(𝑌0|𝐷 = 0) (3.6)
where 𝑌1 and 𝑌0 are rice productivity measured as rice yield in kg/ha for adopter and non-adopter
farmers, 𝐷 is a dummy variable which takes two values: 𝐷 = 1 if farmers adopt IRVs and 𝐷 = 0 if
farmers did not adopt IRVs.
The study tested for sensitivity of the estimated ATT to hidden bias due to unobserved heterogeneity
using the Rosenbaum (2002) bounds sensitivity test. The bounds test indicates the point at which the
estimated results would no longer be valid i.e. how robust the ATT is to unobserved heterogeneity
(Willy et al., 2014). The sensitivity bounds test approach has been used in previous impact evaluation
studies (Abebaw and Haile, 2013; Willy et al., 2014; Tilahun et al., 2016) to test for hidden bias in
impact estimates.
Finally, the study examined how the estimated impacts of adoption of IRVs vary across farm
households by regressing ATT of the individual outcome indicators generated from the PSM on some
socioeconomic factors of the smallholder farmers using the ordinary least squares (OLS).
3.4 The study area, sampling and data collection technique
The study was carried out in Ogun State because it is one of the major rice producing states in south
west Nigeria. The state has twenty local government, which are grouped into 4 agricultural zones
namely Abeokuta, Ikene, Ijebu and Ilaro. The state is covered by tropical rain forest and has wooded
savanna in the northwest. The major occupation of the inhabitants is farming. The major food crops
produced are rice, maize, cassava, yam and banana.

51
A multi-stage random sampling technique was employed to select 250 smallholder rice farmers
interviewed for the study. In the first stage, five major rice producing local government areas (LGAs)
namely (Obafemi Owode, Ifo, Yewa north, Ewekoro and Ogun waterside) were purposively selected
based on prior knowledge that smallholder farmers in the LGAs are actively involved in rice
production. In the second stage, five rice growing communities/villages were randomly selected in
each of the five LGAs. In the third stage, 10 household heads who are smallholder rice farmers were
randomly selected from each of the communities/villages to make a total sample of 250 respondents
for the study. Farmers that cultivate at least one IRV were considered adopters while non-adopters
are those that did not cultivate any IRVs. Primary data was obtained from these sampled respondents
through the administration of structured questionnaire consisting of open and close-ended questions
relating to socio-economic characteristics of respondents, factors of production such as land, labour,
materials such as fertilizers, seed, agrochemicals and marketing information like procurement of input
and sales of paddy rice. A pre-test of the questionnaire was done, and some few modifications were
made in the questionnaire to get more relevant information and enhance the reliability of the data.

52
Figure 3.1: Map of Ogun state showing the study areas.

53
3.5 Definition of variables and summary statistics
The definitions of variables and summary statistics of the sampled farm household in the study are
presented in Table 3.1
Table 3.1: Descriptive statistics of explanatory variables used in estimations.
Source: Field Survey, 2017. Note: SD denotes standard deviation, ***, **, and * denote significance levels at
1%, 5%, and 10.
The results from Table 3.1 showed that the proportion of male-headed households (0.65) in the
adopters’ group are significantly higher than that in the non-adopters sample (0.52). Adopters and
non-adopters of IRVs have a similar average age of 48 years respectively, which implies that most of
the sampled farmers are within their active and productive age. The education level for both adopters
and non-adopters is relatively low; with an average of 5 years of formal education for both groups.
Rice farming experience of adopters and non-adopters were also found to be similar; consisting of
about 15 years of rice farming experience for both groups.
Variable Full sample
(𝒏 = 𝟐𝟓𝟎)
Adopters
(𝒏 = 𝟏𝟏𝟎)
Non-adopters
(𝒏 = 𝟏𝟒𝟎)
T-test
(χ2)
Mean SD Mean SD Mean SD
Socioeconomic characteristics
Gender (1=male, 0 = female) 0.58
0.65
0.52
2.13**
Age (year) 48.22 8.27 48.38 7.80 48.09 8.66 0.27
Formal education (year) 5.35 5.96 5.27 5.96 5.41 5.98 0.84
Rice farming experience (years) 15.28 5.12 15.45 5.38 15.14 4.92 0.48
Farm size (hectare) 2.23 0.58 2.26 0.54 2.20 0.62 0.82
Off-farm income (1=yes, 0= no) 0.53 0.55 0.51 0.74
Institutional/Policy variables
FBO membership (1=yes, 0= no) 0.67
0.75
0.61
2.21**
Access to extension (1=yes, 0= no) 0.28
0.49
0.11
3.77***
Access to credit (1=yes, 0= no) 0.36
0.55
0.22
5.59***
Access to seed (1=yes, 0= no) 0.76 0.99 0.57 8.73***

54
Adopters of IRVs have larger farm size than non-adopters but not statistically significant. Farmers
with larger farm size can allocate more land for cultivation of improved varieties. Thus, farmers who
have more land have a comparative advantage over their counterpart in adopting IRVs. Other
empirical studies (Smale and Mason, 2013; Khonje et al., 2015) also found similar results. Khonje et
al. (2015) noted that adopters of improved maize varieties have larger land than non-adopters.
Farmers-based organisation/groups/cooperative (FBO) is often suggested as an important institutional
factor where farmers share and access information relating to agricultural activities. Membership in
FBO differs significantly between adopters and non-adopters (75% vs 61%) respectively.
The smallholder farmers in the study area have limited access to extension service; on average, about
28% of the sampled farmers have access to the extension agent. However, adopters of IRVs differs
significantly than non-adopters in having access to extension agent. The low access to extension
service might influence the level of awareness and adoption of IRVs among smallholder rice farmers
in the study area. Similarly, majority (64%) of the farmers does not have access to credit. The
constraint in accessing credit could affect IRVs adoption and productivity because smallholder
farmers are known to be resource constraint with low income. Accessibility to credit could help
farmers to purchase adequate quantity of inputs needed for farm operations.
About 76% of the sampled smallholder rice farmers have access to seed. However, access to IRVs
seed is significantly higher among adopters of IRVs than non-adopters of IRVs. Khonje et al. (2015)
posited that efforts aimed at promoting modern agricultural technologies adoption (such as IRVs)
should be geared towards increasing farmers’ access to institutional supports services such as
extension, input supply and credit.

55
About 53% of the smallholder rice farmers generate income from off-farm activity; on average, about
55% and 51% of IRVs adopter and non-adopters engaged in off-farm activity.
3.6 Empirical results and discussion
This section presents and discusses the empirical findings concerning the determinants of adoption of
improved rice varieties and its impact on productivity.
3.6.1 Determinant of improved rice varieties adoption
In explaining the different effect of explanatory variables on the dependent variable, the estimated
coefficients and the marginal effects of the probit estimates are indicated in Table 3.2. The likelihood
ratio (LR) chi-square value, the probability of chi-square, and pseudo-R-square values reported at the
bottom of Table 3.2 show that the model specification provides a reasonably good fit for the data. The
estimated marginal effects were used to interpret the results because the coefficient of parameters is
not suitable for interpreting magnitudes in probability models. The sign of the marginal effect values
indicates the direction of the influence of the explanatory variables on the dependent variable
(adoption of IRVs) while the magnitude shows the size of the probability of effects (Danso-Abbaem,
2018).
The estimated parameters of the probit model of the determinant of adoption of improved rice varieties
are presented in Table 3.2.

56
Table 3.2: Probit model estimates of improved rice varieties adoption
Source: Field Survey, 2017. ***, **, * denote significance level at 1%, 5% and 10%.
The estimated coefficient of education is positive and statistically significant for the probability of
IRVs adoption. The partial effect of a unit increases in level of education on conditional probability
of adopting IRVs is 0.028, which suggests that the likelihood of adopting IRVs increases by about
2.8% with an additional year of smallholder rice farmer’s education. This implies that the more
educated farmers are; the more they are likely to adopt IRVs. This is because educated farmers might
be able to access, understand, process and interpret information efficiently than the uneducated
farmers. This result is consistent with Asfaw et al. (2012) and Ghimire et al. (2015).
The estimated coefficient for rice farming experience is positive and statistically significant for the
probability of IRVs adoption. The partial effect of a unit increase in rice farming experience on
conditional probability of IRVs adoption is 0.016, which suggest that an additional year of rice
farmers’ experience will cause a 1.6% increase in IRVs adoption. Rice farming experience increases
IRVs adoption because the experienced farmers are more likely to have practical knowledge about
the inherent benefit of a farm technology than the unexperienced farmers. Similar results were
Variable Estimated coefficient Standard error Marginal effect
Gender 0.062 0.213 0.024
Age -0.111 0.012 -0.001
Education 0.070*** 0.022 0.028
Farm size 0.207 0.179 -0.044
Rice farming experience 0.039* 0.022 0.016
FBO Membership 0.323 0.255 0.127
Access to extension service 0.465** 0.215 0.183
Access to credit 1.254*** 0.223 0.454
Access to seed 2.450*** 0.492 0.553
Off farm income 0.207 0.212 0.082
Constant -4.023*** 0.899
Pseudo R2 0.3725
LR χ2 (10) 127.75***
57
reported by Tiamiyu et al. (2009) for IRVs adoption in Nigeria and for improved groundnut varieties
in Malawi (Simtowe et al., 2012).
As expected, access to extension agent was associated with increasing probability of IRVs adoption.
The partial effect of an increase in access to extension on conditional probability of IRVs adoption is
0.183, which suggest a 18.3% increase in probability of IRVs adoption by smallholder rice farmers.
Agricultural extension is an important socio-institutional factor that involves building human capital
development of farmers through teaching, training and giving information on farm operations and
exposing the farmers to farm technologies such as IRVs which in turn have an impact on increasing
the productivity of the farmers (Asfaw et al., 2012). This implies that farmers that have access to
extension agent are more likely to have awareness and information about the benefit of modern
agricultural technologies which would in turn have a positive influence on their decision to adopt the
technology. The positive influence of access to extension variable is in line with the findings of
Ghimire et al. (2015) for IRVs adoption in Nepal and Khonje et al. (2015) for improved maize
varieties in Zambia.
The results further show that access to credit and seed increases the likelihood of IRVs adoption. The
partial effect of an increase in access to credit on conditional probability of IRVs adoption is 0.454,
which suggest a 45.4% increase in probability of IRVs adoption by smallholder rice farmers. This
implies that farmers that have access to credit are more likely to adopt IRVs. Accessibility of credit
could ease adoption of modern agricultural technologies such as IRVs because farmers would have
funds to purchase these critical inputs such as IRVs, which will in turn enhance productivity. This
result is in consonance with other findings such as Danso-Abbaem (2018) who reported that access
to credit had a positive and significant effect on adoption of fertilizer among cocoa farmers in Ghana
and for IRVs adoption in North central Nigeria (Oladeji et al., 2015).
58
The estimated coefficient for access to seed is positive and statistically significant for the probability
of IRVs adoption. The partial effect of an increase in access to seed on conditional probability of
IRVs adoption is 0.553, which suggest a 55.3% increase in probability of IRVs adoption by
smallholder rice farmers. A plausible explanation to the positive relationship between access to seed
and IRVs adoption is that availability of IRVs seed in local agro allied stores close to the farmers
would ease the purchase and cultivation of IRVs. However, during the scheduled interview of the
sampled farmers, it was noted that most of the farmers travelled a long distance to purchase seed while
some used seeds stored from previous seasons and others buy seeds from the local market. The use
of uncertified and low-quality seeds could have a negative influence on the yield of farmers. The
positive effect of access to seed variable is in agreement with other findings such as Asfaw et al.
(2012) for improved pigeon pea and cowpea adoption in Tanzania and Ethiopia, and Ghimire et al.
(2015) for IRVs adoption in Nepal.
Other variables in the probit model such as membership in farmer-based organisation and farm size
are not significant but have a positive influence on adoption of IRVs.
3.6.2 Impact of improved rice varieties adoption on productivity
To estimate the impact of adoption of IRVs on the treated groups with PSM, the study performed two
diagnostic tests to ensure quality of the matching process after predicting the propensity scores for
both adopters and non-adopters of IRVs. First, we compare the situation before and after matching to
ensure that there are no remaining differences in covariates conditioning on propensity score.
Following Caliendo and Kopeinig (2008) and Sianesi (2004), we compared the Pseudo-R2 generated
before and after matching. The Pseudo-R2 shows how well the independent variables included in the
model explain the probability of IRVs adoption. After matching, there should be non-existence of
significant differences in the distribution of the independent variables for both adopters and non-

59
adopters, which will lead to small Pseudo-R2 value and the rejection of the joint significance of the
covariates. Thus, t-test was employed to evaluate the quality of the matching to ensure that the
distribution of covariates is equal between the treated and control samples independent of the
treatment (Willy et al., 2014). Second, we check for hidden biases that may arise from unobserved
characteristics that may concurrently affect both adoption of IRVs and productivity. We employed
Rosenbaum (2002) sensitivity analysis procedure to evaluate the effect of the hidden biases on the
magnitude of the impacts obtained. Once these two quality conditions are satisfied, the matched
comparison group is considered as plausible counterfactual and the estimates are reliable (Ali and
Abdulai, 2010).
The density distribution of the propensity scores of adopters and non-adopters of IRVs is presented
in Figure 3.1. The figure shows that common support condition was satisfied, as there was
considerable overlap in the distribution of propensity scores for adopters and non-adopters of IRVs.
The upper and bottom part of the histogram revealed the distribution of the propensity scores of the
adopters and non-adopters. The distribution densities of the scores are shown on the y-axis (vertical
axis).

60
Figure 3.2: Propensity score distribution and common support for propensity score estimation. Note: Treated: On support indicates adopters of IRVs have a suitable comparison group (non-adopters), while
Treated: Off-support indicates the adopters of IRVs that did not have a suitable comparison group (non-adopters).
Source: Field Survey, 2017.
In ensuring the reliability of the estimates in Table 3.3, the test of balancing property based on nearest-
neighbour matching technique (considering only those observations that were on common support)
was conducted to ensure that adopters and non-adopters of improved rice varieties have similar pre-
exposure characteristics. The test of balancing property of mean equality across the covariates is
presented in Table 3.3.
0 .2 .4 .6 .8Propensity Score
Untreated Treated: On support
Treated: Off support

61
Table 3.3: Test of equality of means of variables before and after matching
Variables
Unmatched sample Matched sample
%
reduction
bias
Adopters
Non-
adopters
Diff:
p-value
Adopters
Non-
adopters
Diff:
p-value
Gender 0.65 0.52 0.034** 0.66 0.64 0.846 90.5
Education 5.27 5.41 0.860 5.37 4.50 0.273 90.8
Age 48.38 48.09 0.785 4.62 4.61 0.941 83.2
Farm Size 2.26 2.20 0.411 2.26 2.12 0.694 52.0
Rice farming
experience
15.46 15.14 0.634 15.59 14.82 0.371 -147.3
FBO
Membership
0.75 0.61 0.028** 0.74 0.72 0.711 82.8
Access to
extension
0.49 0.11 0.152 0.48 0.10 0.541 63.6
Access to credit 0.55 0.22 0.000*** 0.38 0.49 0.178 65.2
Access to seed 0.99 0.57 0.000*** 0.99 0.99 1.000 100.0
Off-farm income 0.55 0.51 0.458 0.56 0.53 0.728 38.1 Source: Field Survey, 2017. Note: ***, ** denote significance level at 1% and 5%.
The t-statistics obtained in Table 3.3 (p > 0.1) shows that satisfactory matching quality was achieved
for all covariates included in the model. Thus, there is no significant difference between the mean
covariates after matching, which implies that farmers that adopt IRVs and their counterparts that did
not adopt IRVs are comparable and thus have similar characteristics. Therefore, the two groups have
same features regarding gender, education, age, farm size, rice farming experience, membership in
the farmer-based organization, access to extension service, access to credit, access to seed, and off-
farm income.
The summary of the covariates balancing test is presented in Table 3.4. The p-values of the likelihood
ratio test indicate that the joint significant cannot be rejected before matching (p-value = 0.000) but
rejected after matching (p-value = 0.544). There is also a substantial reduction in the value of the
Pseudo R2, from 0.372 before matching to 0.045 after matching.

62
Table 3.4: Overall matching quality indicators before and after matching using Nearest-
neighbour matching
Source: Field Survey, 2017. Note: ***, denotes significance level at 1%.
The standardized mean bias also reduced considerably from 38.0 before matching to 4.21 after
matching leading to a total bias reduction of 68.75. The high total bias reduction, the low standardized
mean bias, and the insignificant p-value of LR after matching show that the matching process has
been successful; hence, the PSM is appropriate to assess the impact of IRVs on farm productivity in
the study area (Danso-Abbeam and Baiyegunhi, 2019).
The results of the rbounds test are shown in Table 3.5 to check the robustness of the estimates to
unobservable covariates.
Table 3.5: Rosenbaum bound test
Note: The numbers in bold refer to the Rosenbaum bounds critical gamma cut-off value
The rbounds test suggest that the estimates are found to be unbiased. The estimates are found to be
robust or insensitive to an unobserved bias that would have increased the odds of adoption of IRVs
by at least 4.5 folds. This is because an increase in the critical value to 4.5 produces an upper bound
significant level of 0.051. This result suggests that the inferences made concerning impact of IRVs
Sample
Pseudo R2
LR (χ2)
P>(χ2)
Mean
standardized Bias
Bias
Total %
bias
reduction
Unmatched
(before matching)
0.372
127.75
0.000***
38.0
161.3
Matched
(after matching)
0.045
8.87
0.544
4.21
50.4
68.75
Wilcoxon statistics
Gamma(Γ) Upper bound significance level Lower bound significance level
1 0.000 0.000
1.5 0.004 0.000
2 0.000 0.000
2.5 0.000 0.000
3 0.002 0.000
3.5 0.008 0.000
4 0.023 0.000
4.5 0.051 0.000
5 0.092 0.000

63
on productivity is insensitive to hidden biases and that an increase in productivity is because of
improved varieties adoption rather than differences in some unobserved variables or factors.
The propensity score matching (PSM) estimates of improved rice varieties (IRVs) adoption impact
on productivity are presented in Table 3.6. The impacts were estimated using the kernel, radius and
nearest neighbours matching methods to ensure robustness.
Table 3.6: Impact of adoption of improved rice varieties on productivity-PSM
Source: Field Survey, 2017. *** denotes significance level at 1%.
The PSM (KBM, RM and NNM) results presented in Table 3.6 indicated that adoption of IRVs had
a positive and statistically significant effect on productivity (rice yield). The estimated average impact
of IRVs on yield ranges from about 388kg/ha to about 531kg/ha depending on the estimation
technique. Thus, the average rice yield for non-adopters would be about 452kg/ha more if the farmers
had adopted IRVs
3.6.3 Impact of heterogeneity among adopters of improved rice varieties
The estimated ATT reported in Table 3.3 assumes no variation in the impact of IRVs adoption for all
smallholder rice farmers in the treatment group (adopters). However, there are differences in impact
among treatment group because of differences in their socio-economic characteristics. The study
analyses the existence of heterogeneity of the impact of IRVs adoption across the various socio-
economic and institutional variables using ordinary least square (OLS) techniques.
Matching estimators ATT for outcome variables t-test
Kernel-based matching (KBM) 439.599 (69.642) 6.312***
Radius matching (RM) 387.868 (46.992) 8.254***
Nearest neighbour matching (NNM) 531.136 (101.811) 5.217***

64
Table 3.7: Heterogenous impacts among adopters of improved rice varieties
Source: Field Survey, 2017. ***, **, * denote significant level at 1%, 5% and 10%.
The results presented in Table 3.7 shows that productivity has heterogenous effect among IRVs
adopters. The estimated results show that gender, farm size, membership in farmer-based
organisation, and off-farm income were positive and statistically significant for rice yield among IRVs
adopters. This implies that IRVs adoption increases productivity among male smallholder rice
farmers, farmers with large farm size, who are members of FBO and farmers who get income from
off-farm activity.
The positive and significant effect of gender on IRVs adopters’ productivity implies that male
adopters of IRVs are more productive than their female counterpart. This is because male farmers
tend to own more vital production input such as land and capital than their female counterpart. This
result is in line with (Kinkingninhoun-Mêdagbé et al., 2015).
Farm size exerts a positive and significant influence on productivity of IRVs adopters. This implies
that adopters of IRVs with large farm size have more yield per hectare (ha) than IRVs adopters with
small farm size. An increase or expansion of farm size for crop production is expected to enhance
productivity of farmer because returns on adoption are scale dependent (Baiyegunhi et al., 2019). The
Variable Estimated coefficient Standard error
Gender 0.077*** 0.021
Education 0.001 0.002
Age -0.002 0.013
Farm size 0.163*** 0.019
Rice farming experience 0.001 0.002
Membership in FBO 0.076*** 0.022
Access to extension 0.001 0.019
Access to credit 0.006 0.019
Access to seed 0.081 0.102
Off-farm income 0.055*** 0.198
Constant -0.214 0.129
N 110
R2 0.598
F 14.70***
65
positive influence of farm size on productivity of IRVs adopters is in consonance with the findings of
Ojo et al. (2019) who reported a positive relationship between farm size and rice yield in south
western Nigeria.
Membership in farmer-based organisation is positive and significantly influence productivity among
IRVs adopters, which implies that IRVs adopters who have membership in farmer-based organisation
are more productive than those with no membership. A plausible explanation for this is that farmers
that belong to farmer-based organisation gets important information about improved farm
technologies, farm input subsidy, credit, marketing among others than farmers with no membership
in farmer-based organisation. This result is in consistent with Baiyegunhi et al. (2019).
Furthermore, the results show that off-farm income has a positive and significant influence on
productivity among IRVs adopters. This implies that adopters of IRVs that engages in off-farm
income activities have more yield that does that engages in only farm income activities. This is
because farmers who are involved in off-farm activities can buy adequate quantities of inputs such as
IRVs needed for their farm operations, as their engagement in off-farm income activities can
overcome farm-related financial constraints. This finding is in tandem with Danso-Abbeam et al.
(2017).
3.7 Chapter summary
The chapter examines the determinants of IRVs adoption among smallholder rice farmers and the link
between IRVs adoption and rice productivity. The results of the probit regression model showed that
some socio-economic and institutional characteristics of the farmers such as education, rice farming
experience, access to extension service, access to credit and seed access are statistically significant
determinants of IRVs adoption.

66
The econometric approach (PSM) used to analyse the impact of IRVs, shows that adoption of IRVs
had a significant positive influence on rice productivity. The estimates of the average treatment effect
(ATT) from the PSM method revealed that average rice yield for adopters would be about 452kg/ha
less if the smallholder rice farmers had not adopted IRVs. Therefore, the findings support the view
that adoption of IRVs is important in increasing rice productivity which in turn increases income and
reduces poverty among smallholder rice farmers. The positive impacts of IRVs adoption on
productivity suggest that, to boost rice production in the study area, priority must be given to the use
of improved agricultural technology such as IRVs.

67
CHAPTER 4 DOES ADOPTION OF IMPROVED RICE VARIETIES EXPLAIN
TECHNICAL EFFICIENCY DIFFERENTIALS AMONG SMALLHOLDER
RICE FARMERS?
4.1 Introduction
This chapter provides the empirical findings on differentials in technical efficiency among adopters
and non-adopters of improved rice varieties (IRVs) smallholder farmers in Ogun State, Nigeria. The
methodologies, conceptual and analytical framework and estimation techniques for measuring
technical efficiency differentials among smallholder rice farmers are discussed. In addition, the
empirical findings from the study and chapter summary are also provided.
4.2 Conceptual and analytical framework
The theory of technical efficiency has remained an important measurement in estimating farm level
performance. Farrel (1957) seminal work led to the theoretical framework of technical efficiency.
Farrel (1957) defined technical efficiency of a firm as the ratio of input to output. Studies such as
Kumbhakar et al. (1991) and Battese (1992)starts with the measurement of farm technical efficiency.
In an agricultural context, technical efficiency is used to measure the ability of a farmer to produce
maximum output from a given set of resources or input. A farmer’s level of technical efficiency is
characterized by the relationship between observed production and some potential production
(Greene, 1980; Ogundele and Okoruwa, 2006). The technical inefficiency results from farmer’s
inability to produce the highest possible output from a given set of inputs used. Given the relationship
of inputs in a production function, a technically efficient farmer will operate at its frontier production
function. The farmer is technically inefficient if he operates below the frontier. Figure 4.1 shows a
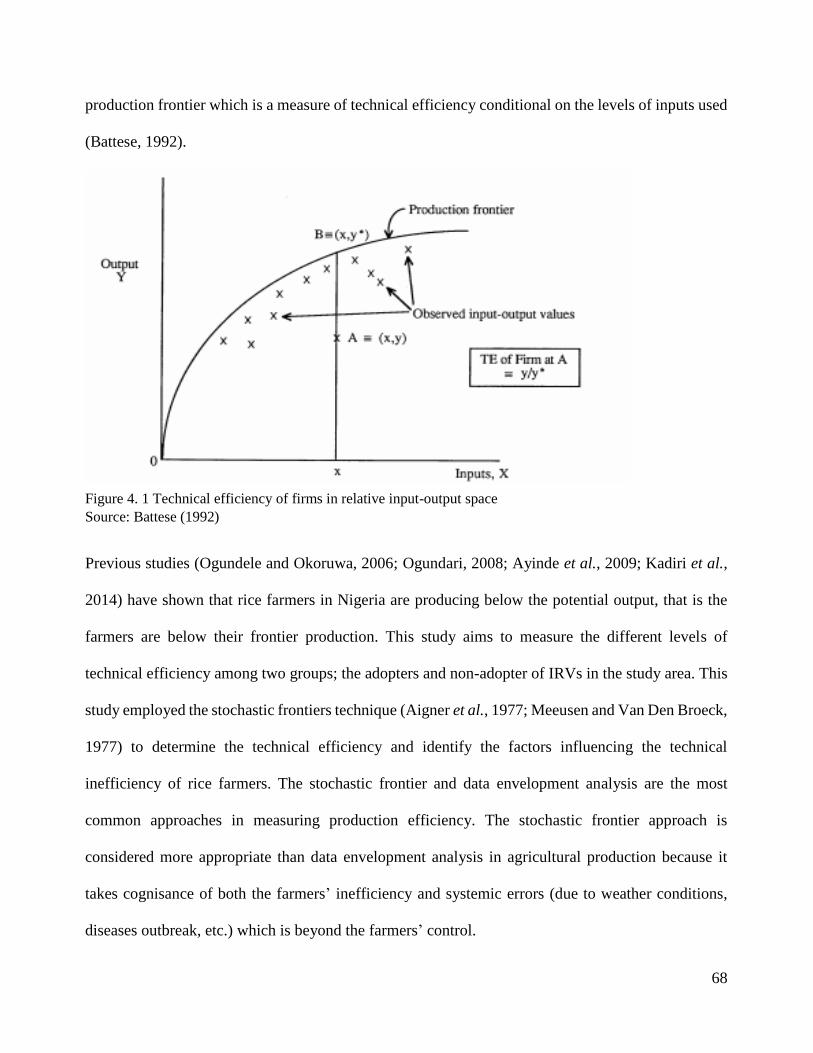
68
production frontier which is a measure of technical efficiency conditional on the levels of inputs used
(Battese, 1992).
Figure 4. 1 Technical efficiency of firms in relative input-output space
Source: Battese (1992)
Previous studies (Ogundele and Okoruwa, 2006; Ogundari, 2008; Ayinde et al., 2009; Kadiri et al.,
2014) have shown that rice farmers in Nigeria are producing below the potential output, that is the
farmers are below their frontier production. This study aims to measure the different levels of
technical efficiency among two groups; the adopters and non-adopter of IRVs in the study area. This
study employed the stochastic frontiers technique (Aigner et al., 1977; Meeusen and Van Den Broeck,
1977) to determine the technical efficiency and identify the factors influencing the technical
inefficiency of rice farmers. The stochastic frontier and data envelopment analysis are the most
common approaches in measuring production efficiency. The stochastic frontier approach is
considered more appropriate than data envelopment analysis in agricultural production because it
takes cognisance of both the farmers’ inefficiency and systemic errors (due to weather conditions,
diseases outbreak, etc.) which is beyond the farmers’ control.

69
Following Battese (1992), the stochastic frontier production model is specified as:
𝑌𝑖 = 𝑓(𝑋𝑖, 𝛽)exp (𝑉𝑖 − 𝑈𝑖) (4.1)
where 𝑖 = 1, 2…, n and 𝑌𝑖 represent the possible production level for the 𝑖th farmer; 𝑓 (𝑋𝑖, 𝛽)
is a suitable function (e.g., Cobb-Douglas or Translog) of the vector, iX is the vector of inputs
quantities used by the 𝑖th farmer, β is a vector of unknown parameters to be estimated, iV is the
random error that is due to factors beyond the control of farmers e.g. weather and disease outbreak.
The distribution of the random error component iV is assumed to be independently and identically
distributed as N (0, 𝜎𝑣2) and independent of iU . isU are non-negative random variables, associated
with technical inefficiency of production, which are assumed to be independently distributed, such
that iU is obtained by truncation (at zero) of the normal distribution with mean iZ and 𝜎𝑢2 variance.
Following Battese and Coelli (1995), the technical inefficiency effect, iU in stochastic frontier
production model (equation 1) can be expressed as;
iU = iZ + 𝑊𝑖 (4.2)
where iZ is a vector of explanatory variables associated with technical inefficiency of production of
farms, δ is a vector of unknown coefficient, the random variable 𝑊𝑖 is defined by the truncation of
the normal distribution with zero mean and variance σ2, such that the point of truncation is iZ i.e.
𝑊𝑖 ≥ iZ .
The technical efficiency production of the ith farm is expressed as;
)exp(),(
)exp(),()exp(
*
ii
iii
i
i
iUXf
UVXf
Y
YUTE
(4.3)
70
where 𝑌𝑖 is the observed output and 𝑌𝑖∗ is the frontier production, if the ratio of 𝑌𝑖 and 𝑌𝑖
∗ equals 1 it
means the farm is 100% technical efficient i.e. TE = 1. Also, if iU = 0, it means there is no indication
of inefficiency, the farm is on frontier meaning it obtains its maximum output from a given set of
input. If 𝑈𝑖 > 0 𝑜𝑟 𝑇𝐸 < 1 then production lies below the frontier, indicating an existence of
inefficiency in the farm.
The maximum likelihood single-stage estimation procedure for estimating the frontier model
(equation 4.1), inefficiency model (equation 4.2) and the farm-specific technical efficiency defined
by the measure of efficiency of technical efficiency model (equation 4.3) are estimated using the
computer software Frontier version 4.1 (Coelli, 1994).
The likelihood function is expressed in terms of variance parameters (Battese and Coelli, 1995);
𝜎𝑠2 = 𝜎𝑣
2 + 𝜎𝑢2 (4.4)
𝛾 = 𝜎𝑢
2
𝜎𝑠2
(4.5)
where 𝜎𝑠2 is the total variance, 𝜎𝑣
2 is the variance of stochastic error, 𝜎𝑢2 is the variance of inefficiency
and 𝛾 is the ratio of the variance of inefficiency to the total summation of the variance of the stochastic
component. The value of 𝛾 ranges from 0 to 1, if 𝛾 = 1 it implies that the variation from the frontier
is due to inefficiency and if 𝛾 = 0, it indicates the variation from the frontier is due to the stochastic
error. Therefore, for 0 < 𝛾 < 1, the variation in output is attributed to both stochastic error and
technical inefficiency of the farmer.
4.3 Empirical model specification
This study employed the Cobb-Douglas functional form to estimate the stochastic frontier production
function for adopters and non-adopters of IRVs in the study area because the test of hypotheses proved

71
that the translog functional form was inadequate to represent the data obtained from both groups of
smallholder rice farmers (adopters and non-adopters of IRVs). The Cobb-Douglas production
function has been used to represent the stochastic frontier function previously by many studies
(Simonyan et al., 2011; Abba and Isa, 2015; Dang, 2017). The Cobb-Douglas Production function is
linear in its activities, imposes severe restrictions on parameters to be estimated, constant elasticity of
substitution and constant return to scale.
The Cobb-Douglas stochastic frontier model is specified as follows;
ln 𝑌𝑖 = 𝛽0 + ∑ 𝛽𝑗5𝑗=1 ln 𝑋𝑗𝑖 + 𝑉𝑖 − 𝑈𝑖 (4.6)
where ln = natural logarithm, Y= total quantity of rice produced, i = ith rice farmer for i = 1, 2, 3…
250, 𝑋𝑗𝑖 =amount of input j used by i-th rice farmer. Where, 𝑋1= farm size, 𝑋2 = labour used (man-
days/ha), 𝑋3=seed (kg)/Ha; 𝑋4 = fertilizer (kg)/Ha; 𝑋5= agro-chemicals (kg/Ha or L/Ha); 𝛽𝑗=
regression coefficient of the explanatory variables in the estimated stochastic production function; 𝑉𝑖
= random errors from the stochastic frontier production and 𝑈𝑖= a vector of non-negative technical
inefficiency component of the error term.
Following Asante et al. (2014), the study estimated the effect of IRVs adoption on technical efficiency
by estimating the predicted probability of IRVs adoption (the propensity score) from the results of the
probit model in Chapter 3. The propensity score was then included as an explanatory variable with
other farm specific, socio-economic and institutional variables in the pooled stochastic frontier
inefficiency model. The main advantage of using this approach is that it corrects for endogeneity in
IRVs adoption before including it as an explanatory variable in the technical inefficiency estimation.
The significance and sign on the coefficient of the predicted IRVs scores is an indication of whether
IRVs adoption has a negative or positive effect on technical efficiency of the smallholder rice farmers.

72
The technical inefficiency model is specified as;
𝑈𝑖 = 𝛿0 + ∑ 𝛿𝑗
7
𝑗=1
𝑍𝑗𝑖 (4.7)
where 𝑈𝑖= technical inefficiency of the 𝑖-th; 𝛿𝑗 = regression coefficients of the explanatory variables
in the estimated technical inefficiency model, 𝑗 =1, 2……7; 𝑍1= Gender, a dummy variable which
takes the value of unity for male and zero for female; 𝑍2= educational attainment (years); 𝑍3= Rice
farming experience (years); 𝑍4 = membership in farmer-based organisation, a dummy variable which
takes the value of unity for member and zero for non-member; 𝑍5= Access to extension services, a
dummy variable which takes the value of unity for access and zero for non-access; 𝑍6= Record-
Keeping a dummy variable which takes the value of unity for farm record and zero for no farm record;
𝑍7 = Predicted IRVs (propensity scores).
4.4 The study area, sampling and data collection techniques
The study area, sampling and data collection technique used for this study are the same as described
in Chapter 3.
4.5 Definition of variables and summary statistics.
The descriptive statistics of sampled farm households are presented in Table 4.1. The variables
described are inputs used in rice production, farm-specific, socio-economic and institutional factors.

73
Table 4. 1: Summary statistics of variables for the sampled smallholder rice farmers
Source: Field Survey, 2017. Note: SD denotes standard deviation.
The results presented in Table 4.1 show that the average yield of rice produced by adopters and non-
adopters of IRVs was 481.82kg/ha and 308.93kg/ha respectively. The yield of both groups of farmers
is below the potential average yield of 2mt/ha and average national yield of 1.4mt/ha for rain-fed
upland rice production system in Nigeria (GRiSP, 2013). Adopters and non-adopters of IRVs have a
similar average farm size of 2.26ha and 2.20ha respectively.
The average labour (family and hired) used was 210.45 man-days/ha and 202.79 man-days/ha for
adopters and non-adopters of IRVs respectively. The implication of high man-days recorded for
labour of both adopters and non-adopters indicates the high dependency rate of human labour for most
of the farm operations. This shows that Nigerian agriculture is labour intensive with low level of
mechanized farming.
Variables Pooled (All)
(n=250)
Adopters
(n=110)
Non-adopters
(n=140)
Mean SD Mean SD Mean SD
Production function model
Yield (kg/ha) 385.00 147.21 481.82 136.42 308.93 104.79
Farm size (ha) 2.27 0.58 2.26 0.54 2.20 0.62
Labour (man-days/ha) 206.16 50.68 210.45 46.71 202.79 53.52
Seed (Kg/ha) 67.82 5.00 68.32 4.65 67.43 5.24
Fertilizer(kg/ha) 234.60 51.02 234.55 54.92 234.64 47.94
Agrochemical (ltr/ha) 7.27 1.75 7.37 1.81 7.19 1.70
Inefficiency effects model
Gender (dummy) 0.58 0.65 0.52
Education (year) 5.35 5.96 5.27 5.96 5.41 5.98
Rice farming experience (year) 15.28 5.12 15.45 5.38 15.14 4.92
FBO membership (dummy) 0.67 0.75 0.61
Farm record (dummy) 0.60 0.61 0.59
Extension access (dummy) 0.28 0.49 0.11
74
The adopters used IRVs seed for their production while the non-adopters planted the traditional rice
varieties. The average amount of seeds used by adopters and non-adopters was estimated to be
68.32kg/ha and 67.43kg/ha respectively. The quantity of seed used by majority of the rice farmer
(both adopters and non-adopters) in the study area was below the recommended seed rate of 100kg/ha
for rain-fed (upland and lowland) rice production system (IRRI, 1995). This influences the yield of
rice produced by the farmers.
The adopters and non-adopters of IRVs used an average fertilizer rate (NPK/urea) of 234.55kg/ha and
234.64kg/ha respectively. The fertilizer rate used by both groups was also below the recommended
rate of 250-350kg/ha for upland and lowland swamp production system. This also has a significant
impact on yield. The average agrochemicals used (comprising of pesticides and herbicides) by
adopters and non-adopters of IRVs was estimated to be 7.37ltr/ha and 7.19ltr/ha respectively.
The male farmers constitute 65% and 52% of adopter and non-adopters of IRVs. The average years
of schooling for adopters was 5.27 years while that of non-adopters was 5.41 years. Both adopters
and non-adopters of IRVs have similar average rice farming experience of 15.45 and 15.14 years
respectively. About 60% of the smallholder rice farmers keep farm record, with 61% and 59% of
adopters and non-adopters keeping farm record. The majority (72%) of the smallholder rice farmers
do not have access to extension agent, with 49% and 11% of IRVs adopters and non-adopters having
access to extension agent.
4.6 Test of model specification
The generalized likelihood ratio test was used to test three null hypotheses in the study. The test of
hypotheses was conducted for the pooled, adopters and non-adopters of IRVs separately.
The hypotheses are as follows;
1. 𝐻01: 𝛽𝑗𝑖 = 0, the best functional form that fits the data is Cobb Douglass
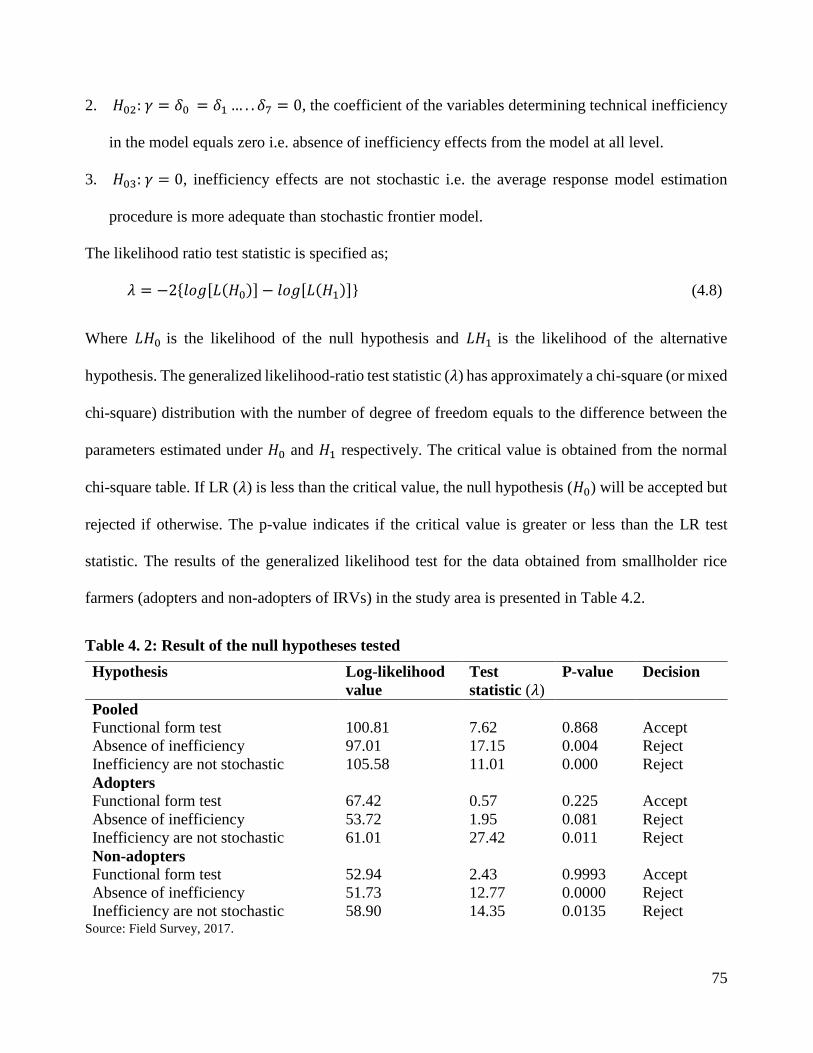
75
2. 𝐻02: 𝛾 = 𝛿0 = 𝛿1 … . . 𝛿7 = 0, the coefficient of the variables determining technical inefficiency
in the model equals zero i.e. absence of inefficiency effects from the model at all level.
3. 𝐻03: 𝛾 = 0, inefficiency effects are not stochastic i.e. the average response model estimation
procedure is more adequate than stochastic frontier model.
The likelihood ratio test statistic is specified as;
𝜆 = −2{𝑙𝑜𝑔[𝐿(𝐻0)] − 𝑙𝑜𝑔[𝐿(𝐻1)]} (4.8)
Where 𝐿𝐻0 is the likelihood of the null hypothesis and 𝐿𝐻1 is the likelihood of the alternative
hypothesis. The generalized likelihood-ratio test statistic (𝜆) has approximately a chi-square (or mixed
chi-square) distribution with the number of degree of freedom equals to the difference between the
parameters estimated under 𝐻0 and 𝐻1 respectively. The critical value is obtained from the normal
chi-square table. If LR (𝜆) is less than the critical value, the null hypothesis (𝐻0) will be accepted but
rejected if otherwise. The p-value indicates if the critical value is greater or less than the LR test
statistic. The results of the generalized likelihood test for the data obtained from smallholder rice
farmers (adopters and non-adopters of IRVs) in the study area is presented in Table 4.2.
Table 4. 2: Result of the null hypotheses tested
Source: Field Survey, 2017.
Hypothesis Log-likelihood
value
Test
statistic (𝜆)
P-value Decision
Pooled
Functional form test 100.81 7.62 0.868 Accept
Absence of inefficiency 97.01 17.15 0.004 Reject
Inefficiency are not stochastic 105.58 11.01 0.000 Reject
Adopters
Functional form test 67.42 0.57 0.225 Accept
Absence of inefficiency 53.72 1.95 0.081 Reject
Inefficiency are not stochastic 61.01 27.42 0.011 Reject
Non-adopters
Functional form test 52.94 2.43 0.9993 Accept
Absence of inefficiency 51.73 12.77 0.0000 Reject
Inefficiency are not stochastic 58.90 14.35 0.0135 Reject

76
From the Table 4.2, the first null hypothesis for smallholder rice farmers was accepted since the
generalized likelihood-test was not statistically significant from zero. This indicates that the Cobb-
Douglass frontier function best fits the data. The generalized likelihood-test was statistically
significant from zero and the second hypothesis was rejected for the pooled, adopters and non-
adopters of IRVs indicating that there is presence of technical inefficiency in the model. Similarly,
the third hypothesis was also rejected, revealing that the frontier production function was more
appropriate than the traditional average response function for the pooled and both categories of
farmers.
4.7 Empirical results and discussion
In this section, the empirical findings on the factors influencing rice yield, technical inefficiencies and
level of technical efficiency of smallholder rice farmers are discussed.
4.7.1 Stochastic frontier production estimates
The result of the maximum likelihood estimates of the Cobb-Douglass stochastic frontier production
model for the pooled, adopters and non-adopters of IRVs is presented in Table 4.3. The pooled
estimate is for the total sampled smallholder rice farmers, i.e., the combination of both adopters and
non-adopters IRVs.

77
Table 4. 3: Maximum likelihood estimates of stochastic frontier production model for
smallholder rice farmers
Source: Field Survey, 2017. ***, ** and * denote significance level at 1%, 5% and 10%.
The result from Table 4.3 shows that farm size, labour, seed and fertilizer contributed significantly to
the technical efficiency of the smallholder rice farmers. The regression coefficient denotes the output
elasticity in a Cobb-Douglas production function. The estimated sigma squared of 0.0575, 0.0475 and
0.074 for the pooled, adopters and non-adopters of IRVs shows a good fit and the appropriateness of
the specified distribution of assumption of the composite error term, rather than the average response
specification. The estimated gamma value for adopters and non-adopters is 0.81 and 0.92 which
indicates that 81% and 92% of the variation in paddy rice output among adopters and non-adopters
of IRVs was due to technical inefficiency while 19% and 8% of the variation in paddy rice yield
among adopters and non-adopters of IRVs was due to random factors which are beyond the farmers
control which could be unfavourable weather condition, pest and disease infestation.
The estimated coefficient of seed and fertilizer are the statistically significant variables for the
adopters of IRVs while farm size, labour and fertilizer are the statistically significant variables for
non-adopters of IRVs. The estimated coefficient of seed (1.01) indicates that a percentage increase in
Variable Parameter Pooled (All) Adopters Non-adopters
Coefficient t-ratio Coefficient t-
ratio
Coefficient t-ratio
Constant 𝛽0 0.155 7.17*** 0.010 0.52 0.186 7.17***
Farm size 𝛽1 -0.098 -0.29 -0.105 -0.20 1.021 2.10**
Labour 𝛽2 0.211 1.53 -0.056 -0.29 0.349 2.05**
Seed 𝛽3 0.782 2.39** 1.010 1.94* -0.314 -0.70
Fertilizer 𝛽4 0.347 3.78*** 0.282 2.24** 0.316 2.29***
Agrochemicals 𝛽5 0.006 0.06 -0.122 -0.91 -0.088 -0.59
Variance
Parameters
Sigma squared 𝜎𝑠2 0.0575 0.0475 0.074
Gamma 𝛾 0.8070 0.8135 0.918
Log-likelihood
function
LLF
97.01
53.71
51.73

78
the quantity of seed planted will lead to 1.01% increase in paddy rice output for adopters of IRVs.
This implies that the use of IRVs seed has a significant and positive influence on productivity of rice
farmers. However, the coefficient of seed (traditional variety) for non-adopters of IRVs is not
significant in explaining the output of the farmers. The possible explanation of a significant positive
relationship between IRVs seed and yield is that the farmers are planting below the recommended
rate of 100kg/ha for upland and lowland rice production system as posited by IRRI (1995). Therefore,
an increase in the use of IRVs up to the recommended rate will enhance rice yield of adopters of IRVs.
This result is consistent with Mango et al. (2015) who observed that seed have a positive influence
on maize yield in Zimbabwe.
The estimated coefficient of fertilizer (0.28 and 0.32) for adopters and non-adopters exert a significant
positive effect on paddy rice output. This implies that a percentage increase in quantity of fertilizer
will lead to 0.28% and 0.32% increase in paddy rice yield of adopters and non-adopters of IRVs. This
could be attributed to the fact that both adopters and non-adopters applied below the fertilizer
recommended rate of 250-300kg/ha in upland and lowland swamp rice production system (Ogundele
and Okoruwa, 2006; GRiSP, 2013). The significant positive effect of fertilizer is consistent with the
study of Zahidul Islam et al. (2012) who reported a positive effect of fertilizer on rice yield of both
traditional and high yielding rice varieties adopters in Bangladesh. The result is also in line with that
of Abba and Isa (2015) who observed that fertilizer has a positive and significant influence on rice
yield in both irrigated and rain-fed production system in Nigeria.
The results further showed that farm size and labour have a positive and statistically significant
influence on paddy rice yield of non-adopters of IRVs. The estimated coefficient of farm size (1.02)
indicates that a percentage increase in land area allocated for rice production will lead to 1.02%
increase in paddy rice yield of IRVs non-adopters. This implies that expansion of farm size plays a

79
crucial role in enhancing farm productivity. This result conforms to that of Oladeebo and Fajuyigbe
(2007) for rice production in Nigeria, Danso-Abbeam et al. (2012) for cocoa production in Ghana and
Asekenye et al. (2016) for groundnut production in Kenya and Uganda.
The statistically significant and positive elasticity of 0.35 for labour indicates that rice yield of IRVs
non-adopters will rise by 0.35% with a percentage increase in labour. This implies that an increase in
labour employed for farm operation will lead to an increase in rice yield. A possible reason for this is
that crop production such as rice is labour intensive and resource constraint smallholder farmers are
known to be highly dependent on manual labour to carry out most of their farm operations. This
finding is consistent with Ogundari et al. (2010) and Mango et al. (2015)
4.7.2 Technical efficiency level of smallholder rice farmers
The predicted technical efficiencies (TEs) of smallholder rice farmers from the maximum likelihood
estimation are presented in Table 4.4.
Table 4. 4: Distribution of technical efficiency among smallholder rice farmers TEs Pooled Adopters Non-adopters
Indices Frequency Percentage Frequency Percentage Frequency Percentage
<0.75 4 1.60 1 0.91 29 20.71
0.75-<0.85 8 3.20 6 5.45 29 20.71
0.85-<0.95 65 26.00 17 15.45 73 52.14
0.95-≤1 173 67.20 86 78.18 9 6.43
Total 250 100 110 100 140 100
Mean 0.95 0.97 0.84
Minimum 0.61 0.69 0.42
Maximum 1 1 0.97
Standard deviation 0.06 0.06 0.11
Source: Field Survey, 2017.
The results presented in Table 4.5 revealed that the average technical efficiency of the smallholder
rice farmer is 95%. The technical efficiency indices of IRVs adopters ranges from 69% to 100% with
an average of 97%. This implies that if the average farmer among the sampled adopters of IRVs had
achieved the technical efficiency level of his/her most efficient peer farmer, then he/she would have

80
realised an output gain of 3% (1 − [97/100]). Similarly, the most inefficient farmer among adopters
of IRVs would have increased his/her output by as much as 31% (1 − [69/100]).
The technical efficiency indices of IRVs non-adopters ranges from 42% to 97% with an average of
84%. This implies that if the average farmer among the sampled non-adopters of IRVs had achieved
the technical efficiency level of his/her most efficient peer farmer, then he/she would have realised
an output gain of 13.4% (1 − [84/97]).Similarly, the most inefficient farmer among non-adopters of
IRVs would have increased his/her output by as much as 42.3% (1 − [42/97]).
The average technical efficiency indices of both groups of farmers imply that the adopters and non-
adopters of IRVs produced 97% and 84% paddy rice output respectively, at the current level of farm
practice and input available. In addition, both adopters and non-adopters of IRVs are producing below
3% and 16% of the potential frontier output. Thus, there is an opportunity for the adopters and non-
adopters of IRVs to increase their production by 3% and 16% respectively through the efficient
utilization of production resources/inputs and adoption of improved farm technologies for rice
production.
Furthermore, the result shows that there is a significant difference between IRVs adopters and non-
adopters; with adopters of IRVs being more technically efficient than non-adopters.
4.7.3 Effect of improved rice varieties on technical inefficiency
The result of the maximum likelihood estimates of inefficiency model is presented in Table 4.5. A
positive sign on a coefficient of the parameter denotes the variable reduces technical efficiency while
a negative sign on a coefficient of the parameter means the variable increases technical efficiency.

81
Table 4.5: Maximum likelihood estimates of technical inefficiency model for smallholder rice
farmers Variables Para-
meter
Pooled (All)
Adopters Non-adopters
Coeff. t-ratio Coeff. t-ratio Coeff. t-ratio
Constant 𝛿0 -4.396 -19.24*** -4.043 -26.78*** -4.928 -10.54***
Gender 𝛿1 -2.187 -5.12*** -0.443 -0.34 -1.275 -2.50**
Education 𝛿2 -0.004 -0.17 -5.131 -0.02 -0.004 -0.16
Rice farming experience 𝛿3 -0.043 -1.66* -0.247 -3.94*** -0.083 -3.06***
FBO membership 𝛿4 -0.822 -2.44** -27.704 -0.02 -0.548 -1.53
Farm record 𝛿5 -0.622 -1.56 -5.846 -0.94 -0.565 -1.54
Extension access 𝛿6 1.506 3.83 30.584 0.02 1.072 2.63***
Predicted IRVs scores 𝛿7 -2.121 -3.92*** - - - -
Source: Field Survey, 2017. Coeff. denotes coefficient. ***, ** and * denotes significance level at 1%, 5% and 10%.
The result from table 4.5 shows that the predicted probability of IRVs exerts a negative and significant
effect on technical inefficiency of smallholder rice farmers. This result suggests that adoption of IRVs
enhances the technical efficiency of smallholder rice farmers, which implies that IRVs adopters are
more technically efficient than non-adopters. This result conforms to the result in table 4.4 indicating
the differentials in technical efficiency level of adopters and non-adopters. The finding therefore,
suggests that adoption of IRVs is important in improving the technical efficiency of smallholder rice
farmers. This finding is in consonance with Asante et al. (2014) who observed a positive and
significant effect of adoption of yam minisett technology on technical efficiency of yam farmers in
Ashanti region of Ghana.
The results presented in Table 4.5 also revealed that other variables such as gender, rice farming
experience, membership in farmer based-organisation, access to extension contributed significantly
to smallholder rice farmers’ technical inefficiency. The statistically significant variables for IRVs
adopters is only rice farming experience while gender, rice farming experience and access to extension
service are statistically significant for non-adopters of IRVs.
82
The estimated coefficient of rice farming experience is negative and statistically significant for both
adopters and non-adopters of IRVs which implies that the more experienced farmers are less
technically inefficient than others. A possible reason could be that farmers with longer years of rice
farming are able to observe and learn from their past production operations to improve subsequent
production. This finding conform to that of Asante et al. (2014) and Danso-Abbeam et al. (2015).
Gender has a significant and negative influence on technical inefficiency of IRVs non-adopters, which
implies that the male farmers are more technically efficient than the female farmers. A plausible
explanation for this is that the farm production decision in often made by majority of men and they
are also in control of vital input such as land, labour and capital. This result is consistent with Mango
et al. (2015) who observed that men headed-maize farmers are more efficient than their women
counterparts farmers in Zimbabwe.
Surprisingly, the coefficient for access to extension services was positive and statistically significant
for technical inefficiency of non-adopters of IRVs. This implies that non-adopters of IRVs with access
to extension services are more technically inefficient compared with those without access to extension
services. A possible reason could be that either the extension services offer poor service to the farmers
or the farmers did not adhere to the instructions and innovations offered to them on their farm
practices. This could also influence the decision of the farmers not to adopt IRVs. This finding is in
consonance with Ojo et al. (2019) who reported a negative relationship between access to extension
service and productivity of rice farmers in South West Nigeria. The result is also in line with Oladeebo
and Fajuyigbe (2007) and Kuwornu et al. (2013) but contrary with Mango et al. (2015) and Abdulai
et al. (2017).
The negative and significant value for the estimated coefficient of membership in farmer-based
organisation for the smallholder rice farmers (pooled) implies that farmers with membership in

83
farmer-based organization are more technically efficient than others with no membership. This is
because farmers obtain some benefits through farmer-based organisation such as access to credit for
financing the farm, access to farm inputs from NGOs and government and useful information relating
to farm operations. This result is consistent with Danso-Abbeam et al. (2015) who observed that
membership in farmer-based organization negatively influenced technical inefficiency of smallholder
groundnut farmers in Northern region of Ghana.
4.8 Chapter summary
This chapter analysed the differentials in technical efficiency among adopters and non-adopters of
IRVs in Ogun state, Nigeria, using the stochastic frontier model. The results of the study showed that
production inputs such as farm size, fertilizer, seed and labour influence the productivity of
smallholder rice farmers. The study also revealed that factors such as gender, rice farming experience,
membership in farmer-based organisation, access to extension influence and IRVs adoption influence
the technical inefficiency of the rice farmers.
The estimated technical efficiency score of both groups of smallholder rice farmers indicated that the
farmers are producing below the potential output. The study also revealed that IRVs adopters are more
technically efficient than non-adopters. Therefore, adoption of IRVs with good management and
cultural farm practice will enhance the technical efficiency of smallholder rice farmers in Ogun state,
Nigeria.

84
CHAPTER 5 SUMMARY, CONCLUSIONS AND RECOMMENDATIONS.
5.1 Summary
Rice (Oryza sativa) is grown in almost all agro-ecological zones of Nigeria due to its adaptability to
the country’s fertile land. Despite the huge land area suitable for rice production, less than half of the
land is utilized. This has resulted in variability and inconsistency in the production of rice in the
country. Moreover, rice is produced by over 90% of resource-poor smallholder farmers. Despite the
dominance and important role played by smallholder farmers in rice production, they still encounter
numerous challenges. Among the challenges faced is lack of credit facilities and accessibility to
productive inputs such as fertilizer, agrochemicals and IRVs. The challenges faced by smallholder
farmers have contributed to their low productivity. The low productivity has also been attributed to
low adoption of improved rice varieties (IRVs). Although, the government has put in place different
intervention programs and policies to increase in the national rice output in recent years yet domestic
production has not been able to suffice the increasing demand, which in turn intensify the importation
of rice in the country. However, rice yield per hectare is still below the potential output. Adoption of
IRVs and understanding the appropriate utilization and combination of inputs is essential in increasing
the productivity and efficiency of rice farmers. Nevertheless, there is an empirical gap in adoption of
IRVs and technical efficiency in the literature of Nigerian rice sector.
The study’s general objective was to analyse the adoption of improved rice varieties and technical
efficiency among smallholder rice farmers. The first objective was to examine the determinants of
adoption of IRVs and its impact on productivity of smallholder rice farmers. The second objective

85
was to estimate the differences in technical efficiency among adopters and non-adopters of IRVs
smallholder rice farmers.
This study was conducted in Ogun State, South West, Nigeria. Data were obtained in 2017 using a
structured questionnaire administered to 250 rice farmers through multi-stage random sampling
techniques. Datasets were analysed using descriptive and econometric techniques.
5.2 Conclusion
In Chapter three, the determinants of adoption of IRVs and its impact on productivity was analysed.
The empirical results from the probit model indicate that education, rice farming experience, access
to extension service, access to credit and access to seed had positive and statistically significant effects
on the adoption of IRVs. The estimates of the PSM revealed that adoption of IRVs had a significant
influence on productivity (rice yield). Thus, the findings of the study suggest that priority must be
given to improved agricultural technology such as IRVs to boost rice production in the study area.
The empirical results from the stochastic frontier analysis in Chapter 4 indicate that the smallholder
farmers are producing below their potential production output but adopters of IRVs are more
technically efficient than the non-adopters. The study also observed that there are some vital
production inputs such as fertilizer and seeds that are under-utilized by the smallholder rice farmers
have a statistically significant and positive influence on rice yield. Appropriate utilization of these
inputs at the recommended rate could increase the efficiency and productivity of the farmers.
In addition, adoption of IRVs and combined effect of some socio-economic and socio-institutional
factors were found to be the sources of technical inefficiency of the smallholder rice farmers.
It can be concluded from this study that adoption of IRVs plays a vital role in enhancing productivity
and technical efficiency of smallholder rice farmers.

86
5.3 Policy Recommendations
In view of this study, some essential findings have emerged that are pertinent for policy implication
and recommendations towards enhancing the productivity and efficiency of rice production in Ogun
State and Nigeria.
The study recommends that the ministry of agriculture strengthen the extension services by recruiting
and training an adequate number of extension agents across the agricultural zones and local
government area of the state. This will enhance regular visit and efficient delivery of extension service
(which includes educating the farmers on the benefits of IRVs). Furthermore, availability/recruitment
of non-governmental organisations (NGOs) and private organisation extension agents to supplement
government extension agents will enhance awareness and adoption of IRVs in the study area.
Based on the findings that the farmers are using below the recommended rate of fertilizer and seed.
There is a need for the provision of substantial and sustainable credit facilities by the government and
private institutions to the smallholder farmers to enhance adoption of IRVs and the purchase of
adequate quantities of the inputs needed for the production process.
Farmer-based organisation has been observed to have a positive influence on both adoption of IRVs
and technical efficiency of the smallholder rice farmers, therefore the study suggests that extension
agents should sensitize the farmers on the benefits of joining a farmer-based organization such as easy
accessibility to production inputs, including IRVs. In communities where there is no farmer based-
organisation, the extension agent should help them form some.
Policymakers need to encourage an efficient relationship between farmer-based organisations and
seed companies (private, NGOs and government) to enhance easy accessibility of IRVs by the rural
smallholder rice framers.
87
5.4 Limitations of the study and suggestions for further research
Rice is produced in different regions in Nigeria where there is diversity in cultures, religion and socio-
economic characteristics of the people. The study is limited to a state in South West, Nigeria due to
time and financial constraint for data collection. Therefore, the study recommends that further
research of this kind should be conducted in more rice producing areas across the country. A larger
sample size of the respondent is also suggested to generate more information that can be generalized
about Nigeria.
Furthermore, this study did not focus on a specific improved rice variety cultivated by the smallholder
farmers but focused on all type of IRVs planted in the study area. The study suggests that further
studies could consider the adoption and technical efficiency among adopters and non-adopters of
a/some specific IRVs. This could shed light on the need to focus on some specific IRVs that could
increase the production of rice in the country.

88
REFERENCES
Abadie, A. and Imbens, G.W. 2006. Large sample properties of matching estimators for average
treatment effects. Econometrica 74 (1):235-267.
Abate, G.T., Rashid, S., Borzaga, C. and Getnet, K. 2016. Rural finance and agricultural technology
adoption in Ethiopia: does the institutional design of lending organizations matter? World
Development 84:235-253.
Abba, M.W. and Isa, A.H.M. 2015. Technical efficiency of small scale rice production in Adamawa
state, Nigeria. Paper presented at the International Conference on Chemical, Food and
Environment Engineering (ICCFEE'15), Dubai (UAE).
Abdulai, A. and Eberlin, R. 2001. Technical efficiency during economic reform in Nicaragua:
evidence from farm household survey data. Economic Systems 25 (2):113-125.
Abdulai, S., Nkegbe, P.K. and Donkor, S.A. 2017. Assessing the economic efficiency of maize
production in Northern Ghana. Ghana Journal of Development Studies 14 (1):123-145.
Abebaw, D. and Haile, M.G. 2013. The impact of cooperatives on agricultural technology adoption:
Empirical evidence from Ethiopia. Food Policy 38:82-91.
Abedullah, Kouser, s. and Mushtaq, k. 2007. Analysis of technical efficiency of rice production in
Punjab (Pakistan): Implications for future investment strategies. Pakistan Economic and
Social Review 45 (2):231-244.
Addison, M., Ohene-Yankyera, K. and Fredua-Antoh, E. 2016. Gender Role, Input Use and Technical
Efficiency among Rice Farmers at Ahafo Ano North District in Ashanti Region of Ghana.
Journal of Food Security 4 (2):27-35

89
Adedeji, T., Nosiru, M., Akinsulu, A., Ewebiyi, I., Abiona, B. and Jimoh, T. 2013. Adoption of new
rice for Africa (NERICA) technology in Ogun State, Nigeria. Journal of Development and
Agricultural Economics 5 (9):365-371.
Adekambi, S.A., Diagne, A., Simtowe, F. and Biaou, G. 2009. The impact of agricultural technology
adoption on Poverty: The case of NERICA rice varieties in Benin. Contributed paper
prepared for presentation at the International Association of Agricultural Economists’ 2009
Conference, Beijing, China, August 16-22, 2009.
Adesina, A.A. and Djato, K.K. 1997. Relative efficiency of women as farm managers: Profit function
analysis in Côte d'Ivoire. Agricultural Economics 16 (1):47-53.
Adeyeye, J., Navesero, E., Ariyo, O. and Adeyeye, S. 2010. Consumer preference for rice
consumption in Nigeria. Journal of Humanities, Social Science and Creative Arts 5 (1):28-38.
Ahmed, A.-G., Xu, S., Yu, W. and Wang, Y. 2017. Comparative Study on factors Influencing Rice
Yield in Niger State of Nigeria and Hainan of China. International Journal of Agricultural
and Food Research 6 (1):15-25.
Aigner, D., Lovell, C.K. and Schmidt, P. 1977. Formulation and estimation of stochastic frontier
production function models. Journal of Econometrics 6 (1):21-37.
Akighir, D.T. and Shabu, T. 2011. Efficiency of resource use in rice farming enterprise in Kwande
Local Government Area of Benue State, Nigeria. International Journal of Humanities and
Social Science 1 (3):215-220.
Al-Hassan, S. 2008. Technical efficiency of rice farmers in Northern Ghana. African Economic
Research Consortium (AERC) Research Paper 178.
Alemu, S.H., van Kempen, L. and Ruben, R. 2017. Explaining technical inefficiency and the variation
in income from apple adoption in highland Ethiopia: The role of unequal endowments and

90
knowledge asymmetries. Journal of Agriculture and Rural Development in the Tropics and
Subtropics (JARTS) 118 (1):31-43.
Ali, A. and Abdulai, A. 2010. The adoption of genetically modified cotton and poverty reduction in
Pakistan. Journal of Agricultural Economics 61 (1):175-192.
Ali, A. and Behera, B. 2016. Factors influencing farmers׳ adoption of energy-based water pumps and
impacts on crop productivity and household income in Pakistan. Renewable and Sustainable
Energy Reviews 54:48-57.
Amaechina, E.C. and Eboh, E.C. 2017. Resource use efficiency in rice production in the lower
Anambra irrigation project, Nigeria. Journal of Development and Agricultural Economics 9
(8):234-242.
Amaza, P.S. and Olayemi, J. 2002. Analysis of technical inefficiency in food crop production in
Gombe State, Nigeria. Applied Economics Letters 9 (1):51-54.
Asante, B.O., Villano, R.A. and Battese, G.E. 2014. The effect of the adoption of yam minisett
technology on the technical efficiency of yam farmers in the forest-savanna transition zone of
Ghana. African Journal of Agricultural and Resource Economics 9 (2):75-90
Asekenye, C., Bravo-Ureta, B.E., Deom, M., Kidula, N., Okello, D.K., Okoko, N. and Puppala, N.
2016. Productivity gaps among groundnut farmers in Kenya and Uganda: A stochastic
production frontier analysis. African Journal of Agricultural and Resource Economics 11
(2):85-100.
Asfaw, S., Shiferaw, B., Simtowe, F. and Lipper, L. 2012. Impact of modern agricultural technologies
on smallholder welfare: Evidence from Tanzania and Ethiopia. Food Policy 37 (3):283-295.
91
Awotide, B.A., Karimov, A., Diagne, A. and Nakelse, T. 2013. The impact of seed vouchers on
poverty reduction among smallholder rice farmers in Nigeria. Agricultural Economics 44
(6):647-658.
Awotide, B.A., Karimov, A.A. and Diagne, A. 2016. Agricultural technology adoption,
commercialization and smallholder rice farmers’ welfare in rural Nigeria. Agricultural and
Food Economics 4 (3):1-24.
Awotide, B.A., Wiredu, A., Diagne, A. and Ojehomon, V. 2012. Wealth status and improved rice
varieties adoption among smallholder farmers in Nigeria. OIDA International Journal of
Sustainable Development 5 (9):11-27.
Ayinde, A.F., Kwaghe, P.V., Agbiboa, D.E. and Jijji, S.A. 2016. Political settlement analysis of
employment Creation in agriculture and agro‐industries in Nigeria. Partner for African Social
and Governance Research (PASGR) Working Paper 015.
Ayinde, O.E., Adewumi, M.O. and Ojehomon, V.E. 2009. Determinants of technical efficiency and
varietal–gap of rice production in Nigeria: A meta-Frontier model approach. A paper
presented at the International Association of Agricultural Economics conference, Beijing,
China.
Bäckman, S., Islam, K.Z. and Sumelius, J. 2011. Determinants of technical efficiency of rice farms
in North-Central and North-Western regions in Bangladesh. The Journal of Developing Areas
45:73-94.
Bagi, F.S. 1984. Stochastic frontier production function and farm-level technical efficiency of full-
time and part-time farms in west Tennessee. North Central Journal of Agricultural Economics
6 (1):48-55.

92
Baiyegunhi, L.J.S., Majokweni, Z.P. and Ferrer, S.R.D. 2019. Impact of outsourced agricultural
extension program on smallholder farmers’ net farm income in Msinga, KwaZulu-Natal,
South Africa. Technology in Society 57 (2019): 1-7.
Bamidele, F., Abayomi, O. and Esther, O. 2010. Economic analysis of rice consumption patterns in
Nigeria. Journal of Agricultural Science and Technology 12 (1):1-11.
Bamiro, O.M. and Aloro, J.O. 2013. Technical efficiency in swamp and upland rice production in
Osun State. Scholarly Journal of Agricultural Science 3 (1):31-37.
Battese, G.E. 1992. Frontier production functions and technical efficiency: a survey of empirical
applications in agricultural economics. Agricultural Economics 7 (3-4):185-208.
Battese, G.E. and Coelli, T.J. 1995. A model for technical inefficiency effects in a stochastic frontier
production function for panel data. Empirical Economics 20 (2):325-332.
Battese, G.E. and Corra, G.S. 1977. Estimation of a production frontier model: with application to the
pastoral zone of Eastern Australia. Australian Journal of Agricultural Economics 21 (3):169-
179.
Bauer, P.W. 1990. Recent developments in the econometric estimation of frontiers. Journal of
Econometrics 46 (1-2):39-56.
Becerril, J. and Abdulai, A. 2010. The impact of improved maize varieties on poverty in Mexico: a
propensity score-matching approach. World Development 38 (7):1024-1035.
Beshir, H. 2014. Factors affecting the adoption and intensity of use of improved forages in North East
Highlands of Ethiopia. American Journal of Experimental Agriculture 4 (1):12-27.
Betonio, K.J.P., Cugat, N.M.T., Indanan, A.R., Entero, O.M.M. and Murcia, J.V.B. 2016.
Determining technical efficiency of cutflower farms in Kapatagan, Digos city, Davao del Sur,
Philippines. Proceedings of the Annual Vietnam Academic Research Conference on Global
Business, Economics, Finance & Social Sciences (AP16Vietnam Conference).

93
Bezat, A. 2009. Comparison of the deterministic and stochastic approaches for estimating technical
efficiency on the example of non-parametric DEA and parametric SFA methods. Metody
Ilościowe W Badaniach Ekonomicznych 10 (1):20-29.
Bozoğlu, M. and Ceyhan, V. 2007. Measuring the technical efficiency and exploring the inefficiency
determinants of vegetable farms in Samsun province, Turkey. Agricultural Systems 94
(3):649-656.
Bravo-Ureta, B.E. and Pinheiro, A.E. 1993. Efficiency analysis of developing country agriculture: a
review of the frontier function literature. Agricultural and Resource Economics Review 22
(1):88-101.
Bravo-Ureta, B.E., Solís, D., López, V.H.M., Maripani, J.F., Thiam, A. and Rivas, T. 2007. Technical
efficiency in farming: a meta-regression analysis. Journal of Productivity Analysis 27 (1):57-
72.
Briec, W. 1997. A graph-type extension of Farrell technical efficiency measure. Journal of
Productivity Analysis 8 (1):95-110.
Bushway, S., Johnson, B.D. and Slocum, L.A. 2007. Is the magic still there? The use of the Heckman
two-step correction for selection bias in criminology. Journal of Quantitative Criminology 23
(2):151-178.
Bzugu, P., Mustapha, S. and Zubairu, E. 2010. Adoption of NERICA 1 rice variety among farmers in
Jalingo local government area of Taraba state, Nigeria. Journal of Environmental Issues and
Agriculture in Developing Countries 2 (2):132-139.
Cadoni, P. and Angelucci, F. 2013. Analysis of incentives and disincentives for rice in Nigeria.
Technical Notes Series, MAFAP, FAO, Rome.
Caliendo, M., and Kopeinig S. (2008). Some practical guidance for the implementation of
propensity score matching. Journal of Economic Surveys 22 (1): 31–72.
94
Cassman, K.G. 1999. Ecological intensification of cereal production systems: yield potential, soil
quality, and precision agriculture. Proceedings of the National Academy of Sciences 96
(11):5952-5959.
Central Bank of Nigeria (CBN) 2010. Statistical Bulletin. Abuja, Nigeria.
Certo, S.T., Busenbark, J.R., Woo, H.s. and Semadeni, M. 2016. Sample selection bias and Heckman
models in strategic management research. Strategic Management Journal 37 (13):2639-2657.
Charnes, A., Cooper, W.W. and Rhodes, E. 1978. Measuring the efficiency of decision making units.
European Journal of Operational Research 2 (6):429-444.
Chiona, S., Kalinda, T. and Tembo, G. 2014. Stochastic frontier analysis of the technical efficiency
of smallholder maize farmers in Central Province, Zambia. Journal of Agricultural Science 6
(10):108.
Coelli, T. 1994. A Guide to Frontier 4.1: A computer programme for stochastic frontier production
and cost function estimation; Department of Econometrics, University of New England.
Armidale, NSW 2351.
Coelli, T., Rahman, S. and Thirtle, C. 2002. Technical, allocative, cost and scale efficiencies in
Bangladesh rice cultivation: a non‐parametric approach. Journal of Agricultural Economics
53 (3):607-626.
Coelli, T.J., Rao, D.S.P., O'Donnell, C.J. and Battese, G.E. 2005. An introduction to efficiency and
productivity analysis. Springer Science & Business Media.
Cooper, W.W., Seiford, L.M. and Zhu, J. 2004. Data envelopment analysis. Handbook on Data
Envelopment Analysis. Springer.

95
Dang, N.H. 2017. Estimation of Technical Efficiency and Its Determinants of White Maize
Production in Vinh Long Province: A Stochastic Production Frontier Approach. Review of
Integrative Business and Economics Research 6 (4):341-352.
Danso-Abbaem, G. 2018. Agrochemical management practices, meta-technical efficiency and
household welfare: evidence from Ghana’s cocoa industry. PhD Dissertation, Department of
Agricultural Economics, University of KwaZulu-Natal, Pietermaritzburg, South Africa.
Danso-Abbeam, G., Abban, B.A. and Donkoh, S.A. 2017. Off-farm participation and technical
efficiency among smallholder farmers in the Northern region, Ghana. Applied Studies in
Agribusiness and Commerce-APSTRACT 11 (1-2):35-44.
Danso-Abbeam, G., Aidoo, R. and Ohene-Yankyera, K.A.K. 2012. Technical efficiency in Ghanas
cocoa industry: Evidence from Bibiani-Anhwiaso-Bekwai District. Journal of Development
and Agricultural Economics 4 (10):287-294.
Danso-Abbeam, G. and Baiyegunhi, L.J.S. 2017. Adoption of agrochemical management practices
among smallholder cocoa farmers in Ghana. African Journal of Science, Technology,
Innovation and Development 9 (6):717-728.
Danso-Abbeam, G. and Baiyegunhi, L.J. 2019. Does fertiliser use improve household welfare?
Evidence from Ghana’s cocoa industry. Development in Practice 29 (2):170-182.
Danso-Abbeam, G., Dahamani, A.M. and Bawa, G.A. 2015. Resource-use-efficiency among
smallholder groundnut farmers in Northern Region, Ghana. American Journal of
Experimental Agriculture 6 (5):290-304.
Dao, G.T.N. 2013. An Analysis of the technical efficiency of crop farms in the northern region of
Vietnam. PhD Dissertation, University of Canberra, Australlia.
96
De Koeijer, T., Wossink, G., Struik, P. and Renkema, J. 2002. Measuring agricultural sustainability
in terms of efficiency: the case of Dutch sugar beet growers. Journal of Environmental
Management 66 (1):9-18.
Debreu, G. 1951. The coefficient of resource utilization. Econometrica, 19 (3): 273-292.
Dossah, B.O. and Mohammed, I.U. 2016. Evaluation of gender differences in resource utilization and
technical efficiency of irrigated vegetable farming in Plateau State, Nigeria. European Journal
of Basic and Applied Sciences 3 (2):1-14.
Farrel, M. 1957. The Measurement of Productive Efficiency. Journal of the Royal Statistical Society,
Series A, Part 3.
Feder, G., Just, R.E. and Zilberman, D. 1985. Adoption of agricultural innovations in developing
countries: A survey. Economic Development and Cultural Change 33 (2):255-298.
Federal Ministry of Agriculture and Rural Development (FMARD) 2016. The Agricultural Promotion
Policy (2016-2020). Building on the successes of the Agricultural Transformation Agenda
(ATA), closing key gaps. Policy and Strategy Document
Fleming, E. and Coelli, T. 2004. Assessing the performance of a nucleus estate and smallholder
scheme for oil palm production in West Sumatra: a stochastic frontier analysis. Agricultural
Systems 79 (1):17-30.
Food and Agricultural Organisation Statistics (FAOSTAT) 2019. Food and agriculture data. FAOSAT
data base. http://www.fao.org/faostat
Food and Agricultural Organisation (FAO) 2017. Global information and early warning system on
food and agriculture, country (Nigeria) brief report.
http://www.fao.org/giews/countrybrief/index.jsp
97
Food and Agricultural Organisation (FAO) 2011. Current world fertilizer trends and outlook to 2015.
Food and Agricultural Organisation of United Nations Rome.
Food and Agricultural Organisation (FAO) 2016. Rice market monitor; trade and market division.
Food and Agricultural Organisation of United Nations report 19 (1):32.
http://www.fao.org/economic/RMM
Forsund, F.R., Lovell, C.K. and Schmidt, P. 1980. A survey of frontier production functions and of
their relationship to efficiency measurement. Journal of Econometrics 13 (1):5-25.
Ghimire, R., Wen-chi, H. and Shrestha, R.B. 2015. Factors affecting adoption of improved rice
varieties among rural farm households in Central Nepal. Rice Science 22 (1):35-43.
Goni, M., Mohammed, S. and Baba, B. 2007. Analysis of resource-use efficiency in rice production
in the Lake Chad area of Borno State, Nigeria. Journal of Sustainable Development in
Agriculture and Environment 3 (2):31-37.
Greene, W.H. 1993. Econometric Analysis, 2nd edition. Macmillan Publisher, New York.
Greene, W.H. 2003. Econometric Analysis, 5th edition. Prentice Hall Publisher, Upper Saddle River,
New Jersey.
Greene, W.H. 1980. On the estimation of a flexible frontier production model. Journal of
Econometrics 13 (1):101-115.
Greene, W.H. 1990. A gamma-distributed stochastic frontier model. Journal of Econometrics 46 (1-
2):141-163.
Global Rice Science Partnership (GRiSP) 2013. Rice almanac, 4th edition. Los Baños (Philippines):
International Rice Research Institute.
Heckman, J.J. 1976. The common structure of statistical models of truncation, sample selection and
limited dependent variables and a simple estimator for such models. Annals of Economic and
Social Measurement 5(4): 475-492.

98
Heong, K., Escalada, M. and Mai, V. 1994. An analysis of insecticide use in rice: case studies in the
Philippines and Vietnam. International Journal of Pest Management 40 (2):173-178.
Huang, C.J. and Liu, J.-T. 1994. Estimation of a non-neutral stochastic frontier production function.
Journal of Productivity Analysis 5 (2):171-180.
Hussain, A. 2013. Economic analysis of rice crop cultivation in district swat. Journal of Agricultural
Research 51 (2): 175-188.
Huynh-Truong, H. 2009. Technical efficiency of rice producing households in the Mekong delta of
Vietnam. Asian Journal of Agriculture and Development 6(2): 35-50.
Idiong, I. 2007. Estimation of farm level technical efficiency in smallscale swamp rice production in
cross river state of Nigeria: a stochastic frontier approach. World Journal of Agricultural
Sciences 3 (5):653-658.
Ihugba, O.A., Chinedu, N. and Njoku, A. 2013. An assessment of Nigeria expenditure on the
agricultural sector: Its relationship with agricultural output (1980-2011). Journal of
Economics and International Finance 5 (5):177-186.
International Rice Research Institute (IRRI) 1995. World rice statistics. International Rice Research
Institute Metro Manila, Philippine.
Ishani, P., Hazarika, J. and Nivedita, D. 2016. Resource use efficiency in rice production under SRI
and conventional method in Assam, India. Agricultural Science Digest 36 (2):152-154.
Just, R.E. and Zilberman, D. 1988. The effects of agricultural development policies on income
distribution and technological change in agriculture. Journal of Development Economics 28
(2):193-216.
Kadiri, F., Eze, C., Orebiyi, J., Lemchi, J., Ohajianya, D. and Nwaiwu, I. 2014. Technical efficiency
in paddy rice production in Niger Delta Region of Nigeria. Global Journal of Agricultural
Research 2 (2):33-43.
99
Kagoda, A.M. 2008. The effect of land tenure system on womens knowledge-base and resource
management in Manjiya County, Uganda. Educational Research and Reviews 3 (12):365-369.
Kedir, M. 2017. Adoption and impact of improved soybean (Belessa-95) variety among smallholder
farmers in Bambasi Woreda, Benishangul Gumuz regional state. PhD Dissertation,
department of agricultural economics and value chain, Haramaya university, Ethopia.
Khai, H.V. and Yabe, M. 2011. Technical efficiency analysis of rice production in Vietnam. Journal
of ISSAAS 17 (1):135-146.
Khonje, M., Manda, J., Alene, A.D. and Kassie, M. 2015. Analysis of adoption and impacts of
improved maize varieties in eastern Zambia. World Development 66:695-706.
Kinkingninhoun-Mêdagbé, F.M., Diagne, A. and Agboh-Noameshie, A.R. 2015. Impact of NERICA
adoption on productivity and income in Benin: Is there gender difference? Paper Presented
at the International Conference of Agricultural Economist, Milan, Italy, August 8-14.
Koopmans, T.C. 1951. An analysis of production as an efficient combination of activities. Activity
Analysis of Production and Allocation: 33-97.
Kumbhakar, S.C., Ghosh, S. and McGuckin, J.T. 1991. A generalized production frontier approach
for estimating determinants of inefficiency in US dairy farms. Journal of Business &
Economic Statistics 9 (3):279-286.
Kuwornu, J.K., Amoah, E. and Seini, W. 2013. Technical efficiency analysis of maize farmers in the
Eastern Region of Ghana. Journal of Social and Development Sciences 4 (2):84-99.
Llewelyn, R.V. and Williams, J.R. 1996. Nonparametric analysis of technical, pure technical, and
scale efficiencies for food crop production in East Java, Indonesia. Agricultural Economics
15 (2):113-126.
Longtau, S.R. 2003a. Multi-agency partnerships in west African agriculture. A review and description
of Rice Production System in Nigeria. Ecosystem Development Organization (EDO) Report.
100
Longtau, S.R. 2003b. Multi-agency partnerships in west African agriculture. A review and description
of rice production systems in Nigeria. Jos, Nigeria: Eco-systems Development Organization
(EDO-DFID) report 50.
Lopes, H. 2010. Adoption of improved maize and common bean varieties in Mozambique. Msc
Thesis. Department of agricultural, food, and resource economics, Michigan State University,
United State of America.
Mango, N., Makate, C., Hanyani-Mlambo, B., Siziba, S. and Lundy, M. 2015. A stochastic frontier
analysis of technical efficiency in smallholder maize production in Zimbabwe: The post-fast-
track land reform outlook. Cogent Economics & Finance 3 (1):1-14.
Mardani, M. and Salarpour, M. 2015. Measuring technical efficiency of potato production in Iran
using robust data envelopment analysis. Information Processing in Agriculture 2 (1):6-14.
Masterson, T. 2007. Productivity, technical efficiency, and farm size in Paraguayan agriculture. Levy
Economics Institute of Bard College, Annandale-on-Hudson, New York. Working Paper, 490.
Meeusen, W. and van Den Broeck, J. 1977. Efficiency estimation from Cobb-Douglas production
functions with composed error. International Economic Review 18 (2):435-444.
Merem, E., Twumasi, Y., Wesley, J., Isokpehi, P., Shenge, M., Fageir, S., Crisler, M., Romorno, C.,
Hines, A. and Hirse, G. 2017. Analyzing rice production issues in the Niger state area of
Nigeria’s middle belt. Food and Public Health 7 (1):7-22.
Mmbando, F.E., Wale, E.Z. and Baiyegunhi, L.J.S. 2015. Welfare impacts of smallholder farmers’
participation in maize and pigeonpea markets in Tanzania. Food Security 7 (6):1211-1224.
Mulugeta, T. and Hundie, B. 2012. Impacts of adoption of improved wheat technologies on
households’ food consumption in Southeastern Ethiopia. Selected Poster Presented at
International Association of Agricultural Economists (IAAE) Triennial Conference, Foz do
Iguaçu, Brazil, August 18-24.

101
National Bureau of Statistics (NBS) 2018. Nigeria gross domestic product report. Quarter 2 report,
Abuja, Nigeria.
National Bureau of Statistics (NBS) 2017. Foreign goods statistics. Quarter 3 report, Abuja, Nigeria.
Nargis, F. and Lee, S. 2013. Efficiency analysis of boro rice production in North-Central region of
Bangladesh. The Journal of Animal & Plant Sciences, 23 (2):527-533.
Nguezet, D.P.M., Diagne, A., Okoruwa, O.V., Ojehomon, V. and Manyong, V. 2013. Estimating the
actual and potential adoption rates and determinants of NERICA rice varieties in Nigeria.
Journal of Crop Improvement 27 (5):561-585.
Nguezet, P.D., Diagne, A., Okoruwa, V.O., Ojehomon, V. and Manyong, V. 2011. Impact of
improved rice technology (NERICA varieties) on income and poverty among rice farming
households in Nigeria: a local average treatment effect (LATE) approach. Quarterly Journal
of International Agriculture 50 (3):267-292.
Nimoh, F., Tham-Agyekum, E.K. and Nyarko, P.K. 2012. Resource use efficiency in rice production:
The case of Kpong Irrigation Project in the Dangme West District of Ghana. International
Journal of Agriculture and Forestry 2 (1):35-40.
Nwosu, F., Uhuegbulem, I. and Ben-Chendo, G. 2015. Green economy: A tool for achieving
sustainable development and poverty reduction in Nigeria. European Journal of Academic
Essays 2 (5):1-4.
Oberholzer, M. and Van der Westhuizen, G. 2009. Estimating technical and scale efficiency in banks
and its relationship with economic value added: A South African study. South African Journal
of Accounting Research 23 (1):67-86.

102
Ogundari, K. 2008. Resource-productivity, allocative efficiency and determinants of technical
efficiency of rainfed rice farmers: A guide for food security policy in Nigeria. Zemedelska
Ekonomika-praha- 54 (5):224.
Ogundari, K., Amos, T. and Ojo, S. 2010. Estimating confidence intervals for technical efficiency of
rainfed rice farming system in Nigeria. China Agricultural Economic Review 2 (1):107-118.
Ogundele, O.O. and Okoruwa, V.O. 2006. Technical efficiency differentials in rice production
technologies in Nigeria. African Economic Research Consortium (AERC) Research Paper
178.
Ogunya, L.O., Bamire, S.A. and Ogunleye, A.S. 2017. Factors influencing levels and intensity of
adoption of new rice for Africa (Nerica) among rice farmers in Ogun State, Nigeria.
International Journal of Agricultural Economics. 2 (3):84-89.
Ohen, S. and Ajah, E. 2015. Cost and return analysis in small scale rice production in Cross River
State, Nigeria. International Research Journal of Agricultural Science and Soil Science 5
(1):22-27.
Ojo, T., Baiyegunhi, L. and Salami, A. 2019. Impact of credit demand on the productivity of rice
farmers in South West Nigeria. Journal of Economics and Behavioral Studies 11 (1):166-180.
Okoye, B., Abass, A., Bachwenkizi, B., Asumugha, G., Alenkhe, B., Ranaivoson, R.,
Randrianarivelo, R., Rabemanantsoa, N. and Ralimanana, I. 2016. Differentials in technical
efficiency among smallholder cassava farmers in Central Madagascar: A Cobb Douglas
stochastic frontier production approach. Cogent Economics & Finance 4 (1):1-10.
Oladeebo, J.O. and Fajuyigbe, A. 2007. Technical efficiency of men and women upland rice farmers
in Osun State, Nigeria. Journal of Human Ecology 22 (2):93-100.

103
Oladeji, O., Okoruwa, V., Ojehomon, V., Diagne, A. and Obasoro, O. 2015. Determinants of
awareness and adoption of improved rice varieties in north central, Nigeria. Rice Genomics
and Genetics 6 (7):1-10.
Oladele, O. and Somorin, A.B. 2008. Technology and extension gaps among rice farmers in Ogun
State, Nigeria. Agricultura Tropica et Subtropica 41 (4):160-164.
Olajide, O., Akinlabi, B. and Tijani, A. 2012. Agriculture resource and economic growth in Nigeria.
European Scientific Journal, 8 (22):103-115.
Ọlayide, S.Ọ. and Heady, E.O. 1982. Introduction to agricultural production economics. Ibadan
University Press, University of Ibadan.
Ologbon, O., Ikheloa, E. and Akerele, E. 2012. Adoption of ‘Ofada’Rice Variety and Technical
Efficiency of Rice-Based Production Systems in Ogun State, Nigeria. World Journal of
Agricultural Sciences 8 (6):624-631.
Omondi, S.O. and Shikuku, K.M. 2013. An analysis of technical efficiency of rice farmers in Ahero
Irrigation Scheme, Kenya. Journal of Economics and Sustainable Development 4 (10):9-16.
Omonona, B.T., Egbetokun, O. and Akanbi, A. 2010. Farmers resource-use and technical efficiency
in cowpea production in Nigeria. Economic Analysis and Policy 40 (1):87.
Osawe, O.W., Adeqeye, A. and Omonona, B.T. 2008. Technical efficiency of small scale farmers:
An application of the stochastic frontier production function on fish farmers in Ibadan
metropolis. Journal of Economics and Rural Development 16(1):71-82
Rahman, S. 2008. Women's involvement in agriculture in northern and southern Kaduna State,
Nigeria. Journal of Gender Studies 17 (1):17-26.
Reifschneider, D. and Stevenson, R. 1991. Systematic departures from the frontier: a framework for
the analysis of firm inefficiency. International Economic Review 32 (3):715-723.

104
Richmond, J. 1974. Estimating the efficiency of production. International Economic Review 15
(2):515-521.
Rogers, E.M. 2003. Diffusion of innovations, 5th Edition. The Free Press, A division of Simon and
Schuster. New York.
Rogers, E.M. 1995. Diffusion of Innovations: modifications of a model for telecommunications. Die
diffusion Von Innovationen in der Telekommunikation. Springer.
Rogers, E.M. and Shoemaker, F.F. 1971. Communication of innovations; A Cross-Cultural
Approach. New York free Press.
Rosenbaum, P.R. 2002. Overt bias in observational studies. Observational Studies: 71-104. Springer.
Rosenbaum, P.R. and Rubin, D.B. 1983. The central role of the propensity score in observational
studies for causal effects. Biometrika 70 (1):41-55.
Saka, J. and Lawal, B. 2009. Determinants of adoption and productivity of improved rice varieties in
southwestern Nigeria. African Journal of Biotechnology 8 (19):4923-4932.
Sianesi, B. 2004. An evaluation of the Swedish system of active labour market programs in the
1990s. The Review of Economics and Statistics 86 (1): 133–155.
Sanchez, P.A. 2002. Soil fertility and hunger in Africa. Science 295 (5562):2019-2020.
Schmidt, R. 1986. Multiple emitter location and signal parameter estimation. IEEE Transactions on
Antennas and Propagation 34 (3):276-280.
Seyoum, E., Battese, G.E. and Fleming, E. 1998. Technical efficiency and productivity of maize
producers in eastern Ethiopia: a study of farmers within and outside the Sasakawa-Global
2000 project. Agricultural Economics 19 (3):341-348.
Sharma, K.R. and Leung, P. 1998. Technical efficiency of carp production in Nepal: an application
of stochastic frontier production function approach. Aquaculture Economics & Management
2 (3):129-140.
105
Simonyan, J., Umoren, B. and Okoye, B. 2011. Gender differentials in technical efficiency among
maize farmers in Essien Udim local government area, Nigeria. International Journal of
Economics and Management Sciences 1 (2):17-23.
Simtowe, F., Kassie, M., Asfaw, S., Shiferaw, B., Monyo, E. and Siambi, M. 2012. Welfare effects
of agricultural technology adoption: The case of improved groundnut varieties in rural
Malawi. Selected Paper Prepared for Presentation at the International Association of
Agricultural Economists (IAAE) Triennial Conference, Foz do Iguaçu, Brazil, August 18-24.
Smale, M. and Mason, N.M. 2013. Hybrid seed, income, and inequality among smallholder maize
farmers in Zambia. Indaba Agricultural Policy Research Institute (IAPRI) Working Paper 72
Solomon, T., Yami, M. and Begna, B. 2015. Gender differentials in scale and technical efficiencies
among improved wheat variety growers in wheat belt areas of Ethiopia: A Data Envelopment
Analysis (DEA). Journal of Economics and Sustainable Development 6 (1):91-100
Tiamiyu, S., Akintola, J. and Rahji, M. 2009. Technology adoption and productivity difference among
growers of new rice for Africa in Savanna Zone of Nigeria. Tropicultura 27 (4):193-197
Tilahun, M., Maertens, M., Deckers, J., Muys, B. and Mathijs, E. 2016. Impact of membership in
frankincense cooperative firms on rural income and poverty in Tigray, Northern Ethiopia.
Forest Policy and Economics 62:95-108.
Tipi, T., Yildiz, N., Nargeleçekenler, M. and Çetin, B. 2009. Measuring the technical efficiency and
determinants of efficiency of rice (Oryza sativa) farms in Marmara region, Turkey. New
Zealand Journal of Crop and Horticultural Science 37 (2):121-129.
Tobin, J. 1958. Estimation of relationships for limited dependent variables. Econometrica: Journal of
the Econometric Society 26 (1):24-36.

106
Tu, V.H., Can, N.D., Takahashi, Y., Kopp, S.W. and Yabe, M. 2018. Technical and environmental
efficiency of eco-friendly rice production in the upstream region of the Vietnamese Mekong
delta. Environment, Development and Sustainability:1-24.
Udoh, E. 2000. Land management and resource use efficiency among farmers in south eastern
Nigeria. PhD Dissertation. Department of Agricultural Economics, University of Ibadan.
Nigeria.
Ugalahi, U.B., Adeoye, S.O. and Agbonlahor, M.U. 2016. Irrigation potentials and rice self-
sufficiency in Nigeria: A review. African Journal of Agricultural Research 11 (5):298-309.
Umoh, G.S. 2006. Resource use efficiency in urban farming: An application of stochastic frontier
production function. International Journal of Agriculture and Biology 8 (1):38-44.
Villano, R., Bravo‐Ureta, B., Solís, D. and Fleming, E. 2015. Modern rice technologies and
productivity in The Philippines: disentangling technology from managerial gaps. Journal of
Agricultural Economics 66 (1):129-154.
Verbeek, M. 2008. A Guide to Modern Econometrics, 3rd edition. John Wiley & Sons, Chichester.
Willy, D.K., Zhunusova, E. and Holm-Müller, K. 2014. Estimating the joint effect of multiple soil
conservation practices: A case study of smallholder farmers in the Lake Naivasha basin,
Kenya. Land Use Policy 39:177-187.
Zahidul Islam, K., Sumelius, J. and Bäckman, S. 2012. Do differences in technical efficiency
explain the adoption rate of HYV rice? Evidence from Bangladesh. Agricultural Economics
Review 3 (1):93-110.
Zeng, D. 2014. Three essays on the adoption and impacts of improved maize varieties in Ethiopia.
PhD Dissertation, Virginia Polytechnic Institute and State University, United State of
America.

107
APPENDICES
APPENDIX I: Research Questionnaire Used for Data Collection
RESEARCH QUESTIONNAIRE
RESEARCH TOPIC: GENDER DIFFERENTIALS IN TECHNICAL EFFICIENCY
AMONG SMALL SCALE RICE FARMERS IN OGUN STATE, NIGERIA.
Serial Number of Questionnaire …………………..
Local Government……………………………………
Community name……………………………………..
INTRODUCTION AND CONSENT
Dear Sir/Ma,
Please introduce yourself to respondent: My name is…………………………….I am an enumerator
collecting data on behalf of Lateef Olalekan Bello, a Post graduate student of University of KwaZulu-
Natal, South Africa. The study aims to examine Gender differentials in technical efficiency among
small scale rice farmers. Your cooperation in responding to these questions will be highly appreciated.
The information so given will strictly be used for academic purposes, and in utmost confidence.
In the process of the interview, you are free to interrupt me and ask for any clarification. You have
the liberty or legal right to call the principal researcher (Mr Lateef Olalekan Bello) on the mobile
number +2348038448438 and ask for any clarification at any point in time. I respect all the responses
you give and appreciate your cooperation.
Name of enumerator
Name of respondent
Date

108
SECTION A. SOCIOECONOMIC CHARACTERISTICS OF RESPONDENTS
Household Basic Characteristics
Questions Responses
1.1 Are you the household head? (1) Yes [ ] (2) No [ ]
1.2 If no, state your relationship with the household
head
(1) Spouse [ ] (2) Child/House-help/Farm care-taker
[ ]
Age of household head
1.4 Gender of household head (1) Male [ ] (2) Female [ ]
1.5 Marital status of household head (1) Married [ ] (2) Single/divorced [ ]
1.6 Household (HH) size
1.7 Household composition by Gender (1) No of males ………. (2) No of females
…………..
1.8 No of people in the household in the following age
category.
(1) < 18 … (2) 18 – 60 ……. (3) >
60……
A19. What is the primary activity of the household
head?
[1] Agricultural related activity
[2] Formal private employment
[3] Public sector employment
[4] Artisans [5]
Retired [
6] Others
A20. What is the secondary activity of the household
head?
A21. What is the primary activity of the respondent?
A22. What is the secondary activity of the
respondent?
1.10 No of years in crop farming
1.11 No of years in rice farming
Note: Household size includes all people, who usually eat from the same pot and sleep under the same
roof. Include also members who are absent for less than two months
Educational Status (Human Capital)
Questions Responses
2.1 Can the household head (HHH) read, construct
and write a simple sentence?
(1) Yes [ ] (2) No [ ]
2.2 Highest level of education completed by the
household head
(1) Primary school [ ] (2) JHS [ ] (3) SHS [ ]
(4) Tech/Voc. [ ] (5) Training/Poly/Univ. [ ]
2.3 Number of years of schooling by household head …………………..
2.4 Highest level of education completed by the
spouse of the household head.
(1) Primary school [ ] (2) JHS [ ] (3) SHS [ ]
(4) Tech/Voc. [ ] (5) Training/Poly/Univ. [ ]
2.5 Number of years of schooling by the spouse of
the household head.
2.5 Number of people in the household who are in
school (e.g children and other relatives).
(1)Primary school ……………………. (2 JHS………
(3) Training/Polytechnic/University………..

109
2.6 Number of people who are learning other trade
(e.g hair-dressing, carpentry).
Other Knowledge Gained Through Social Network
Training attended/Membership of
organization for the past 5 years
Household head Spouse Any other member
of the household
Yes = Y
No = N
# of
times
Yes [ ]
No [ ]
# of
times
Yes [ ]
No [ ]
# of
times
3.1 Agricultural extension services
3.2 Farmer seminar/workshop/conference
3.3 Farmer field school
3.4 Membership of any rice related NGO’s
3.5 Farmer-based-organization
3.6 Any other agricultural related training
received
3.7 Any other capacity building training
received (financial management, other
skills).
3.8 Membership of any socio-economic
group
( e.g credit union, community ass, etc)
3.9 Membership of any religious group
(e.g. church)
3.10 Any leadership position held
3.12Any relative in community leadership
position (chief, etc)
SECTION B. BUSINESS IDENTITY & STRUCTURE
Business Details
4.1 Name of Farm/Firm (optional)
4.2
Business Form/Type
[1] Sole Proprietorship [2] Limited Liability
[3] Partnership [4] Other
(specify)_______________
4.3 Business Address (optional)
4.4 Telephone Number
4.5 Are you in rice farming Full or Part time? [1] Full time [2] Part time
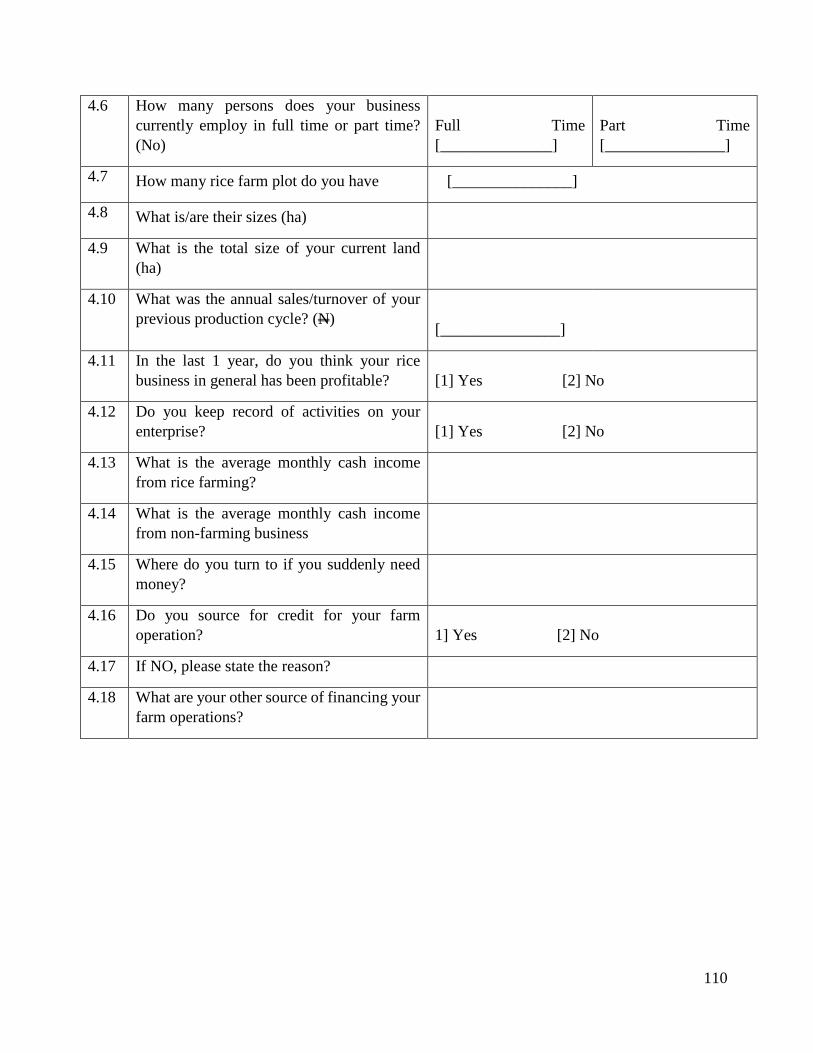
110
4.6 How many persons does your business
currently employ in full time or part time?
(No)
Full Time
[______________]
Part Time
[_______________]
4.7 How many rice farm plot do you have [_______________]
4.8 What is/are their sizes (ha)
4.9 What is the total size of your current land
(ha)
4.10 What was the annual sales/turnover of your
previous production cycle? (N)
[_______________]
4.11 In the last 1 year, do you think your rice
business in general has been profitable? [1] Yes [2] No
4.12 Do you keep record of activities on your
enterprise? [1] Yes [2] No
4.13 What is the average monthly cash income
from rice farming?
4.14 What is the average monthly cash income
from non-farming business
4.15 Where do you turn to if you suddenly need
money?
4.16 Do you source for credit for your farm
operation? 1] Yes [2] No
4.17 If NO, please state the reason?
4.18 What are your other source of financing your
farm operations?

111
SECTION C. RESOURCE INFORMATION
Fixed Costs
Please list the total fixed cost items used for all your operations in the last 12 months
Fixed Costs for the last
production in the last 12
months
Total
Quantity
(N)
Cost/Unit
(N)
Owned Rented
1 Land
2 Warehouses/Space/Building
3 Bowls
Machinery
4 Tractor machine
5 Ridger
6 Sprayers
7 Harvester
8 Plough
9 Wheelbarrow
10 Water tank
11 Bowls/Pans
12 Parboiling pot/chamber
13 Water borehole
14 Pumps
15 Funnels
16 Weighing Scale
17 Other 1 (specify)_________
18 Other 2 (specify)_________
19 Other 3 (specify)_________
20 Other 4 (specify)_________
6. Variable Cost
Raw Material Costs used in the last 12 months
1 Seed (kg)
2 Fertilizer (kg)
3 Herbicide (ltrs)
4 Pesticide (ltrs)
5 Irrigation water (ltrs)
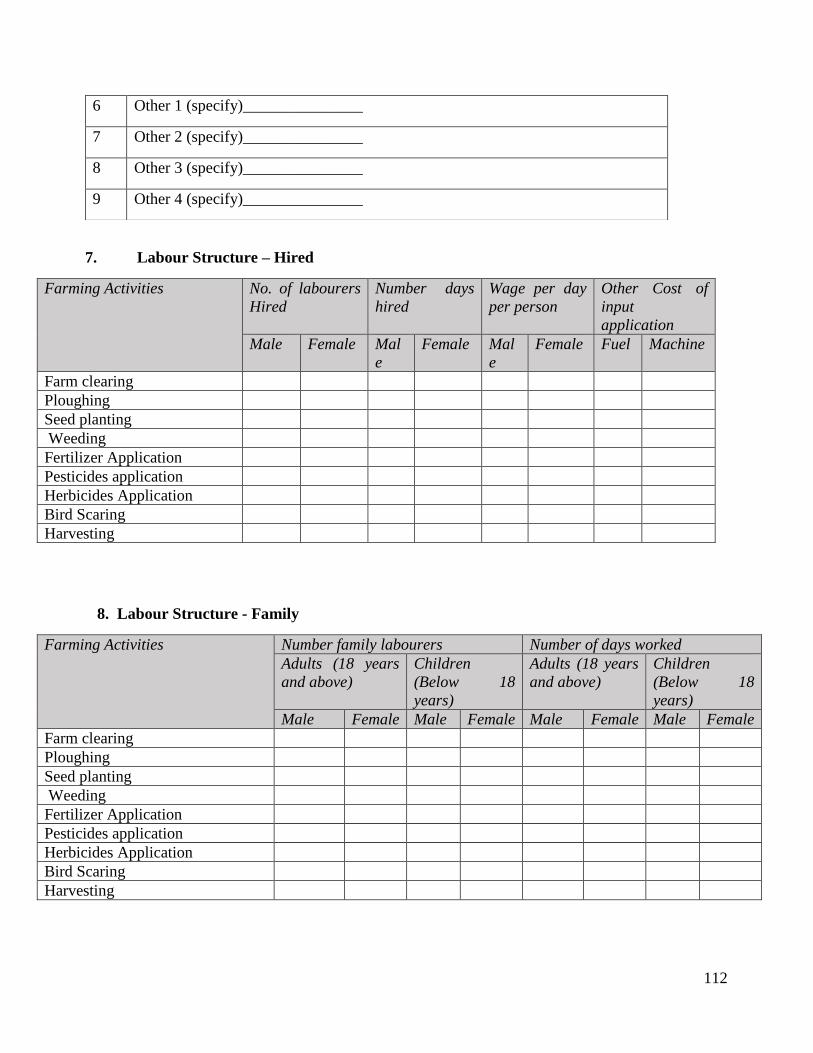
112
7. Labour Structure – Hired
Farming Activities No. of labourers
Hired
Number days
hired
Wage per day
per person
Other Cost of
input
application
Male Female Mal
e
Female Mal
e
Female Fuel Machine
Farm clearing
Ploughing
Seed planting
Weeding
Fertilizer Application
Pesticides application
Herbicides Application
Bird Scaring
Harvesting
8. Labour Structure - Family
Farming Activities Number family labourers Number of days worked
Adults (18 years
and above)
Children
(Below 18
years)
Adults (18 years
and above)
Children
(Below 18
years)
Male Female Male Female Male Female Male Female
Farm clearing
Ploughing
Seed planting
Weeding
Fertilizer Application
Pesticides application
Herbicides Application
Bird Scaring
Harvesting
6 Other 1 (specify)_______________
7 Other 2 (specify)_______________
8 Other 3 (specify)_______________
9 Other 4 (specify)_______________

113
SEED, FERTILIZER AND AGROCHEMICALS
9.1. Seed
What type of seed do you plant? (a) Local [ ] (b) Improved [ ]
Are you aware of improved rice variety? (a) Yes [ ] (b) No [ ]
Are you planting of improved rice variety? (a) Yes [ ] (b) No [ ]
If Yes in Q2 above, Year of awareness ………………………………..
If Yes in Q3 above, Year of planting ………………………………..
Why do you prefer the variety (ies) ……………………………………………………….
What is the total farm size planted with improved rice? …………………………………
What is the quantity of improved rice seed planted? ………………………………………
What is the total farm size planted with local rice? …………………………………
What is the quantity of local rice seed planted? ………………………………………
Do you have access to improved rice seed? (a) Yes [ ] (b) No [ ]
If Yes, how frequent? (a) Very frequent [ ] (b) Not frequent [ ]
Please state the source of the seed by percentage?
Local Government ………………………………
NGOs ……………………………………………
Government agency …………………………….
Research Institute ………………………………
Farmers’ group ………………………………….
Others (state) ………………………………
If you are not planting improved rice seed, why?
……………………………………………………………………………………….
Seed Type (specify the name
local/improved variety)
Quantity/kg Price/unit

114
9.2. Fertilizer and Agrochemicals
Fertilizer Application: Y [ ]
N [ ]
Pesticide Application: Y [ ]
N [ ]
Herbicide Application: Y [ ]
N [ ]
Type Quantity
(Bag/kg)
Price/
Unit
Type Quantity/
litre
Price/
Unit
Type
Quantity/
litre
Price/
Unit
If you don’t apply fertilizer and other agrochemicals, why? …...................................
………………………………………………………………………………………..
Has the use of Fertilizer and Agro-chemicals improved the output of rice farm?
(a) Yes (b) No ____
If Yes, by how many tonnes has it increased the output?
If No, why are you not using……………………………………………………
SECTION D. REVENUE
10. Sales Volume & Price
Item Total Quantity
Produced/acquired
(Bag/kg)
Total Quantity used for
home consumption/gift
(Bag/kg)
Total quantity
sold (Bag/kg)
Price
(Bag/kg)
Paddy rice
THANKS FOR YOUR COOPERATION