improvement of the laser-based alignment system …
TRANSCRIPT
1
IMPROVEMENT OF THE LASER-BASED ALIGNMENT SYSTEM FOR THE J-PARC PROTON LINAC
Takao KATO, Fujio NAITO, Hirokazu TANAKA and Yasuo HIGASHI KEK, High Energy Accelerator Research Organization
Oho 1-1, Tsukuba-shi, Ibaraki-ken, 305-0801, Japan
Abstract
Large improvements in the accuracy of the laser-based alignment system for the
J-PARC proton linear accelerator were achieved as a result of both many efforts for decreasing all kinds of noises in the measured laser-target signals and adopting a new signal-processing method for the measured signals. The fundamental measurements for
improving the ability of the laser-based alignment system were performed with a 50-m long laser test bench, located in the sub-tunnel of the test facility of the 50-MeV proton linac at KEK. The obtained standard deviation of the accuracy of the position measurement with an average time of 40 sec was about 2.6 µm. A proportionality
between the deflection angle of the injected laser beam and the position shift of the laser beam at a distance of 50 m was satisfactorily confirmed. The mounting stage shows an
excellent performance of controlling the direction of the laser beam: a deflection of 0.4 micro radian can be easily controlled by using stepping motors with a sufficiently large signal-to-noise ratio. The obtained experimental results support that the developed
laser-based alignment system satisfies the severe requirements for the J-PARC proton-linac alignment system. Also, it is strongly recommended to utilize this alignment system of high performance with a short measurement time for achieving the
required high beam-power operation of an order of 1 MW for the J-PARC.
KEY WORDS: alignment, laser, accuracy, improvement, proton linear accelerator, J-PARC

2
1. Introduction
A laser-based alignment system for the J-PARC proton linac was developed since
1999. It was considered to be very promising for three reasons: (1) it provides a meaning for achieving linac alignment within a required position tolerance, (2) once the laser alignment system is successfully installed, we are able to obtain the required
position data for the total linac system automatically at any time with a short measurement time and a little additional work, and (3) since the ground stability of the Tokai area in Japan is not very high, an ability to easily and rapidly set a steady laser
line relative to the three virtual fixed points, which positions are to be determined by the accurate GPS system, will be of great use in determining the optimum alignment of the linac.
Strictly speaking, it is not a realistic assumption that there is an absolute fixed reference point around the linac, since all of the related positions (the local ground area, a part of the building and even the GPS fixed points) move in all directions with
different periods of movements, depending upon the change in the surrounding temperature, the age of the moon, the level of groundwater, and so on. It is pointed out that the ground, where the J-PARC is under construction, is not firm, since it was
beneath the surface of the sea in ancient times, and is now a few hundred meters from the seashore of the Pacific Ocean. Thus, the achievement of an accurate, flexible and useful alignment system is essential to achieve the required beam intensity of an order
of MW with a stable operation against the severe condition for alignment. In addition, it should be pointed out that measurements of the linac alignment on the operating condition of the linac system will be of great use, since many kinds of position
movements, owing to the linac operation, including rf dissipation, exciting of the focusing magnets, water cooling, and air conditioning, are expected.
A laser alignment system of about 50 m in length was first constructed in the tunnel
for the 50-MeV proton-linac test-stand at KEK. Some preliminary measurements were performed and reported [1-3]. Some large noise components in the measured signal were found and reported. The results were shown in section 3. The total system
performance of the old laser-based alignment system was also tested when installing and aligning the first three tanks for the 50-MeV proton linac in the tunnel of the test stand at KEK. Here, it was found that the linearity of the position measurements and the

3
reproducibility of the measurement were comparable to the required accuracy of the alignment, although there were some large noise components.
In 2003, two questions concerning the laser-based alignment system were presented
as follows: (1) the achieved accuracy of the laser-based alignment system is sufficient or not,
and
(2) the total cost of the laser-based alignment system is too expensive or not. In order to obtain answers to the questions mentioned above, two kinds of work were started:
(1) a check and improvement of the laser-based alignment system and (2) a reduction of the total cost for constructing the laser-based alignment system,
by selecting the important functions for the measurements.
These two studies had been finished within two months. In conclusion, the observed noise signals in the latest experiments were drastically suppressed, and also the required total cost for the laser-based alignment system was reduced to within the initial budget
by carefully selecting the indispensable specifications. In this report, the improvements of the measurement accuracy of the laser alignment system for the J-PARC proton linac, which was performed in June and August 2003, are reported.
It should be pointed out that the alignment of the first three tanks for the 50-MeV DTL was done before the accuracy improvement of the laser-based alignment system was achieved. Therefore, although there are many useful measurement data and
accumulated technologies in the laser-based alignment of the DTL, they are to be reported elsewhere.
2. Laser-based alignment system
A conceptual view of the laser-based alignment system for the J-PARC proton linac
is shown in Fig. 2-1. There are 87 tanks in total (9 DTL tanks, 32 SDTL tanks and 46 ACS tanks). Each tank has two laser-target boxes on its side (Fig. 2-1), in which a laser target is previously installed within the setting accuracy. The position of each
laser-target box is precisely set in relative to its beam axis by adjusting the connecting arms between the laser target box and the tank at the same time when the drift tubes are aligned in the tank within the required accuracy. Each tank is to be aligned so that the

4
laser beam passes through the center of the laser target. The required accuracy of the position alignment is about 50 µm. In the initial alignment of the linac, the optical
alignment system will also be utilized, which can use the beam axis directly. The
laser-based alignment system is composed of seven parts: 1. a laser, 2. a focusing system for a parallel laser beam just after the laser,
3. a laser-mounting stage with a very fine adjustment mechanism of the laser beam in three directions,
4. a laser target installed in a laser-target box,
5. a laser-target box, attached to each rf tank with a rigid arm, 6. guided ducts connecting the laser and the laser-target boxes , and 7. a signal processing system for finding the deviation of the position.
Some fundamental properties for each component are described in the following subsections.
Fig. 2-1 Conceptual view of the laser-based alignment system for the J-PARC proton linac.
2.1 Laser
A continuous-wave DPSS (Diode-Pumped Solid-State) laser with a wavelength of
532 nm (Coherent Compass 532-20) was selected as the light source. This green laser has an advantage over the usual 633 nm He-Ne laser because it has a lower diffraction limit, which enables us to keep the beam spot size smaller after a long propagation
5
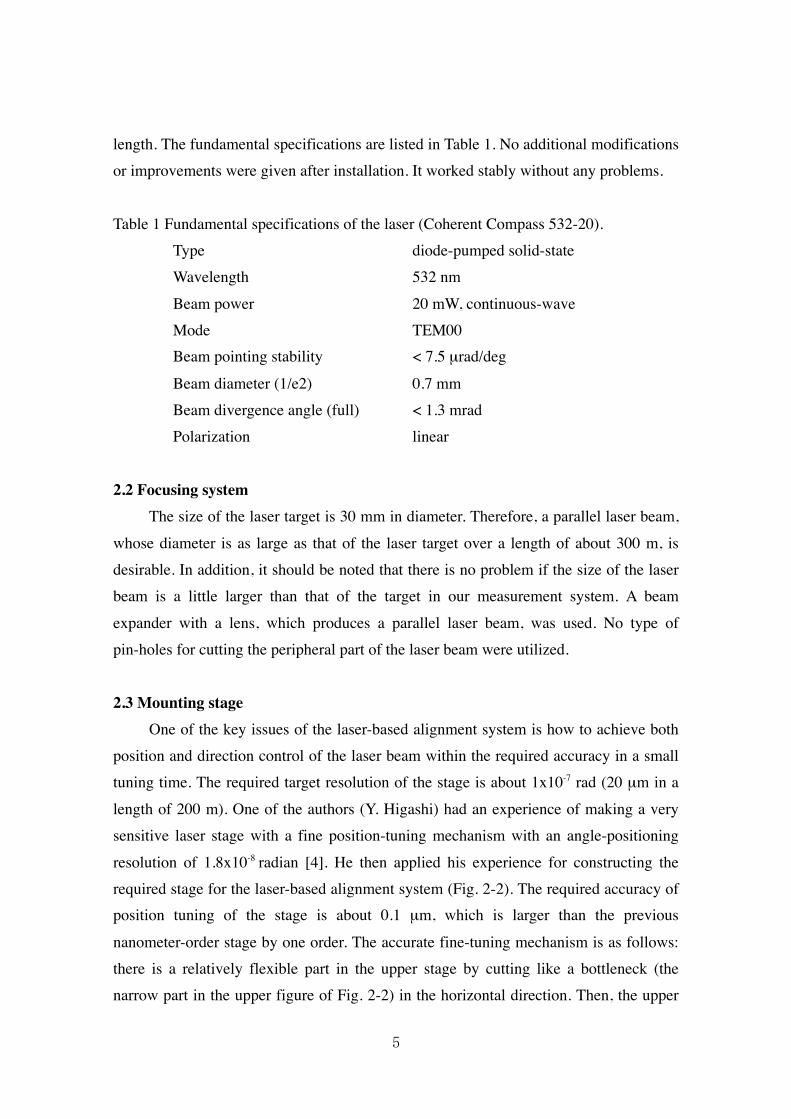
length. The fundamental specifications are listed in Table 1. No additional modifications or improvements were given after installation. It worked stably without any problems.
Table 1 Fundamental specifications of the laser (Coherent Compass 532-20). Type diode-pumped solid-state Wavelength 532 nm
Beam power 20 mW, continuous-wave Mode TEM00 Beam pointing stability < 7.5 µrad/deg
Beam diameter (1/e2) 0.7 mm Beam divergence angle (full) < 1.3 mrad Polarization linear
2.2 Focusing system
The size of the laser target is 30 mm in diameter. Therefore, a parallel laser beam,
whose diameter is as large as that of the laser target over a length of about 300 m, is desirable. In addition, it should be noted that there is no problem if the size of the laser beam is a little larger than that of the target in our measurement system. A beam
expander with a lens, which produces a parallel laser beam, was used. No type of pin-holes for cutting the peripheral part of the laser beam were utilized.
2.3 Mounting stage One of the key issues of the laser-based alignment system is how to achieve both
position and direction control of the laser beam within the required accuracy in a small tuning time. The required target resolution of the stage is about 1x10⁻⁷ rad (20 µm in a
length of 200 m). One of the authors (Y. Higashi) had an experience of making a very sensitive laser stage with a fine position-tuning mechanism with an angle-positioning
resolution of 1.8x10⁻⁸ radian [4]. He then applied his experience for constructing the required stage for the laser-based alignment system (Fig. 2-2). The required accuracy of position tuning of the stage is about 0.1 µm, which is larger than the previous
nanometer-order stage by one order. The accurate fine-tuning mechanism is as follows: there is a relatively flexible part in the upper stage by cutting like a bottleneck (the narrow part in the upper figure of Fig. 2-2) in the horizontal direction. Then, the upper

6
stage direction is smoothly changed in the horizontal plane by pushing both sides with a stepping motor, or a piezo-electric element. On the other hand, a normal changing method is utilized in the vertical direction; the end part of the upper stage near to the
laser beam line is finely moved either by a stepping motor or by a piezo-electric element. The minimum tunable length of about 0.1 µm in both directions was achieved.
Additional fine mechanisms of parallel motion of the upper stage in both horizontal and
vertical directions are also included. The total weight of the stage is about 200 kg, which is sufficiently heavy to keep fine motion of the stage. The directivity of the mounting stage was tested by measuring the deviation of the laser beam in a 50-m beam
line (section 4).
Fig. 2-2 Drawing of the laser mounting stage with a fine tuning mechanism for both the horizontal and vertical directions. The level of the laser beam line can be also tunable. 2.4 Laser target

7
A silicon photo diode of 30 mm in diameter, divided by four quadrants with a very thin cutting line, is used for the laser target (Fig. 2-3). They were supplied by
Fig. 2-3 Drawing of the laser target.
Hamamatsu Photonics. The uniformity of each quadrant was specified to be less than 2% in electric current against the specified light source. The photo diode was set on the center of the base plate with a position accuracy of 10 µm. The mechanical center
positions of the photo diode in the x- and y-directions relative to the base plate were precisely measured by a microscope, and adjusted within the tolerances. In the
following installation and measurement processes, two corners of the base plate were assumed to be the basic standard of the measurement. A laser signal, composed of four signals (VUR, VUL, VLR, VLL), corresponding to four quadrants, was previously
checked by moving the position of the laser target step by step in the laser check-stand, in order to determine both the electric center of the laser target and the transform coefficient from the measured-signal voltages to the distance. Here, we denote the
output voltage from the upper-right quadrant of the diode as VUR, the upper-left quadrant VUL, the lower-right quadrant VLR, and the lower-left quadrant VLL. The horizontal displacement (ΔH) in relative to the electric center of the laser target can be calculated as
€
Δ H =αHVUR +VLR( ) − VUL +VLL( )VUR +VLR +VUL +VLL
,
where αH denotes the transform factor between the signal and the displacement,
8
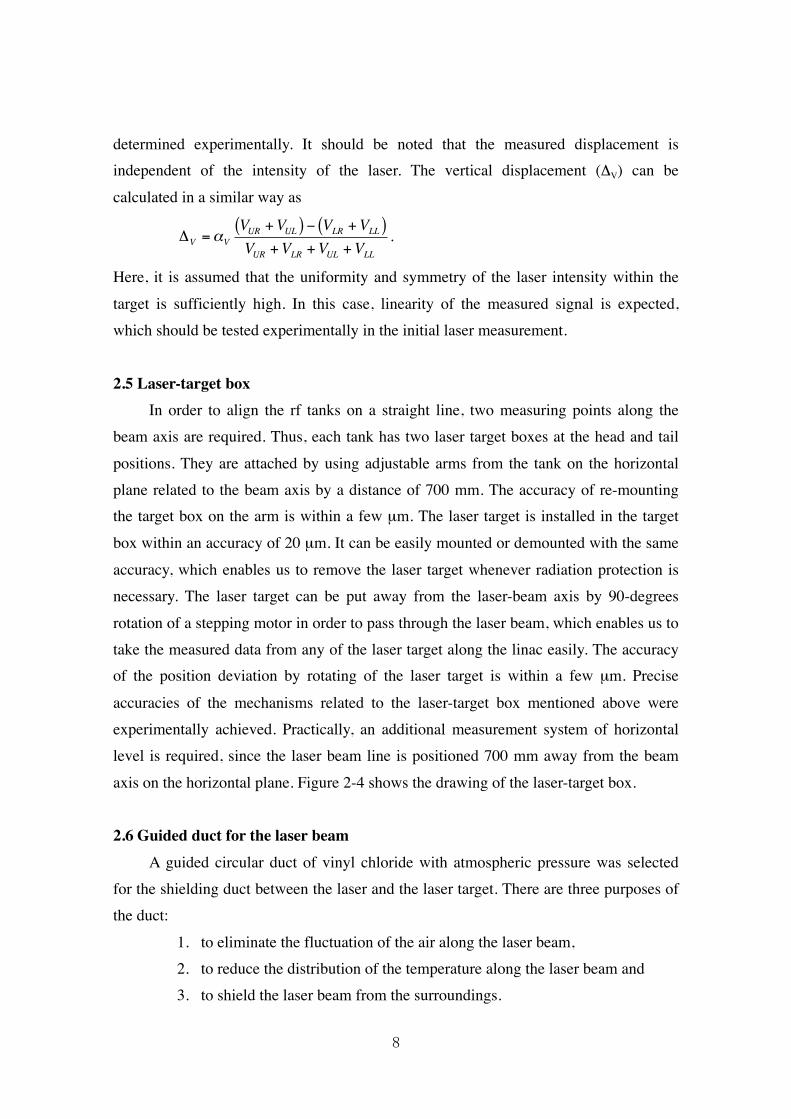
determined experimentally. It should be noted that the measured displacement is independent of the intensity of the laser. The vertical displacement (ΔV) can be
calculated in a similar way as
€
ΔV =αVVUR +VUL( ) − VLR +VLL( )VUR +VLR +VUL +VLL
.
Here, it is assumed that the uniformity and symmetry of the laser intensity within the
target is sufficiently high. In this case, linearity of the measured signal is expected, which should be tested experimentally in the initial laser measurement.
2.5 Laser-target box In order to align the rf tanks on a straight line, two measuring points along the
beam axis are required. Thus, each tank has two laser target boxes at the head and tail
positions. They are attached by using adjustable arms from the tank on the horizontal plane related to the beam axis by a distance of 700 mm. The accuracy of re-mounting the target box on the arm is within a few µm. The laser target is installed in the target
box within an accuracy of 20 µm. It can be easily mounted or demounted with the same
accuracy, which enables us to remove the laser target whenever radiation protection is necessary. The laser target can be put away from the laser-beam axis by 90-degrees
rotation of a stepping motor in order to pass through the laser beam, which enables us to take the measured data from any of the laser target along the linac easily. The accuracy of the position deviation by rotating of the laser target is within a few µm. Precise
accuracies of the mechanisms related to the laser-target box mentioned above were experimentally achieved. Practically, an additional measurement system of horizontal level is required, since the laser beam line is positioned 700 mm away from the beam
axis on the horizontal plane. Figure 2-4 shows the drawing of the laser-target box. 2.6 Guided duct for the laser beam
A guided circular duct of vinyl chloride with atmospheric pressure was selected for the shielding duct between the laser and the laser target. There are three purposes of the duct:
1. to eliminate the fluctuation of the air along the laser beam, 2. to reduce the distribution of the temperature along the laser beam and 3. to shield the laser beam from the surroundings.

9
The material of the duct of a high electric conductivity is desirable, since a difference in the temperature between the upper part of the duct and the lower one will be smaller. However, a cost reduction was firstly considered in this time.
Fig. 2-4 Drawing of the laser-target box. Some of the useful functions, such as an motor-driven rotation mechanism of the target, will not be installed for the moment because of a limitation of construction cost. 2.7 Signal processing system
10
The signal from a quadrant of the laser target reaches the A/D converter after passing through the filter circuit. The A/D converter of 12 bit resolution accumulates the measured data by sampling the data during the specified accumulate-time duration.
Therefore, the output of the A/D converter is an averaged value for a number of very fast multiple sampling, usually 1000 times. However, this averaging process with the default set of the sampling parameters is not effective for averaging the measured data,
since the averaging duration is too short from the viewpoint of the frequency components of the noises from the laser target.
3. Obtained measurement accuracy before improvements
Some results of the measurements by using the old laser-based measurement
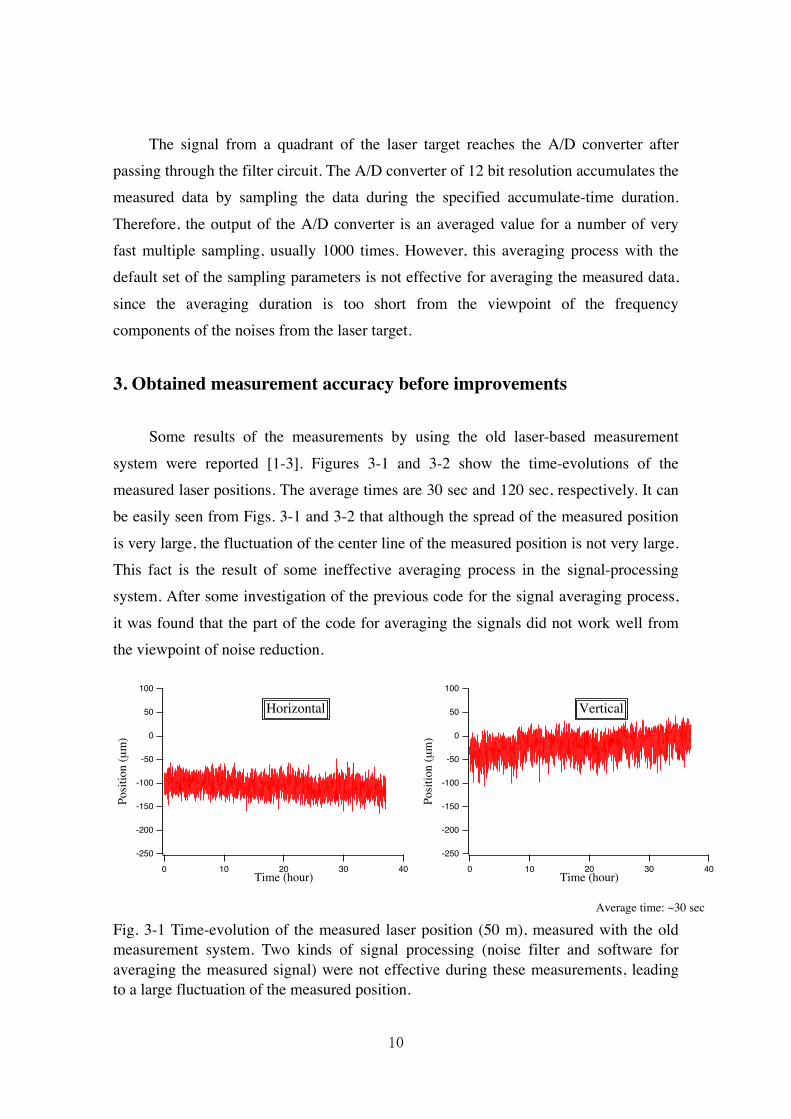
system were reported [1-3]. Figures 3-1 and 3-2 show the time-evolutions of the measured laser positions. The average times are 30 sec and 120 sec, respectively. It can be easily seen from Figs. 3-1 and 3-2 that although the spread of the measured position
is very large, the fluctuation of the center line of the measured position is not very large. This fact is the result of some ineffective averaging process in the signal-processing system. After some investigation of the previous code for the signal averaging process,
it was found that the part of the code for averaging the signals did not work well from the viewpoint of noise reduction.
Fig. 3-1 Time-evolution of the measured laser position (50 m), measured with the old measurement system. Two kinds of signal processing (noise filter and software for averaging the measured signal) were not effective during these measurements, leading to a large fluctuation of the measured position.
-250
-200
-150
-100
-50
0
50
100
Posit
ion
(µm
)
403020100Time (hour)
Vertical
-250
-200
-150
-100
-50
0
50
100
Posit
ion
(µm
)
403020100Time (hour)
Horizontal
Average time: ~30 sec

11
Fig. 3-2 Time-evolution of the measured laser position (100 m), measured with the old measurement system. A mirror was used for making a 100 m beam line by reflecting the laser beam. Two kinds of signal processing (noise filter and software for averaging the measured signal) were not effective during these measurements, leading to a large fluctuation of the measured position. 4. Improvements in the accuracy of the laser alignment system
In order to improve the performance of the laser-based alignment system, a new
test laser line of 50 m in length was built in the sub-tunnel of the test beam line. Because a beam test in the 50-MeV proton linac began in the main tunnel, the previous laser-beam line in the main tunnel had to be carried away. Since the original purpose of
the sub-tunnel was to install the cooling-water ducts for the accelerator tanks, there is not sufficient air conditioning. Figure 4-1 shows photos of a new laser beam line in the sub-tunnel. The measured signals (a raw current generated by a photo diode) are
transmitted by a double-shielded cable and received by an A/D transform board, after transmitting through a new filtering circuit for noise reduction. After some average processing of the digital signals, the positions (x, y) are calculated. We tried to reduce
the noises in the raw signals by testing any ideas, resulting in a large advance in reducing the noise level. Here, three important results are reported, the contributions of which seem to be large.
950
900
850
800
750
700
650
600
Posit
ion
(µm
)
302520151050Time (hour)
Horizontal
-1950
-1900
-1850
-1800
-1750
-1700
-1650
-1600
Posit
ion
(µm
)
2520151050Time (hour)
Vertical
Average time: ~ 2 min

12
Fig. 4-1 Photos of a new laser beam line in the sub-tunnel of the test stand of the 50-MeV proton linac at KEK. The laser in the shielding box on the mounting stage (left one) and the shielding guided duct of 50 m in length viewed from the laser target side (right one). 4.1 Noise reduction with a new filter circuit
4.1.1 A raw signal from a quadrant of the laser target
A raw signal from a quadrant of the laser target, located at a distance of 50 m away from the laser, was directly observed
with an oscilloscope (Fig. 4-2). It was also observed with a spectrum analyzer (Fig. 4-3). There are 1/f noises and some noises of
multiples of power-supply frequency (50 Hz)
in the left plot in Fig. 4-3. It can be easily
seen that there are two kinds of spike pulses around 40 kHz in the right one. All signals from four quadrants showed a similar noise
Fig. 4-2 Raw signal from a quadrant of the laser target, located at a distance of 50 m away from the laser, observed with an oscilloscope.
0.07
0.075
0.08
0.085
0.09
0.095
0.1
0.105
0.0079 0.008 0.0081 0.0082 0.0083 0.0084
Vol
tage
(V)
Time (sec)

13
distribution. Since the position values are calculated with DC components of the laser signals from four quadrants, it is necessary to reduce the noise components of low frequencies as well as the spike noises of higher frequencies.
4.1.2 Improved signals with a new filter circuit A new low-pass filter circuit for the laser-target signals was developed. The final
tuning of the filtering parameters wase experimentally determined by using a generated noise signal, including white noise, 1/f noises and some spike noises around 40 kHz. The filter was installed just before the A/D converter circuit for each quadrant signal.
Figures 4-4 and 4-5 show the output signals through the old filter and the new one, respectively. An improvement of the peak-to-peak noise of 28 dB was achieved. The same input signal from the laser target was used for all measurements shown in this
sub-section. 4.2 Suppression of the fluctuation of the air in the guided duct
Any type of fluctuation of the air in the laser-beam line will produce noises in the measured signals. Thus, suppressing any type of fluctuation of the air around the laser system is crucially important, since the effects will be enhanced at the measuring points
which are placed at a distance of a few hundreds meters. Although our guided-duct is
Fig. 4-3 Frequency spectrum of a raw signal from a quadrant of the laser target, located at a distance of 50 m away from the laser. Left: sweep-frequency range from 0 to 1 kHz, right: sweep-frequency range from 0 to 50 kHz.
-160
-140
-120
-100
-80
-60
0 1 104 2 104 3 104 4 104 5 104
Sign
al le
vel (
dB)
Frequency (Hz)
-140
-130
-120
-110
-100
-90
0 200 400 600 800 1000Frequency (Hz)
Sign
al le
vel (
dB)

14
not vacuum-tight, any small holes for air flowing should be closed. The fluctuation of the measured signal was largely suppressed after some careful work. 4.3 Improved signal with the modified averaging process
One of the simple and useful averaging methods for time-evolution measured data is the moving average, expressed by
€
y i[ ] =1M
x i + j[ ]J= 0
M −1
∑ ,
where x[ ] is the input signal, y[ ] is the output signal, and M is the number of points in
the average. One can see from the above formula that the moving average is a convolution using a very simple filter kernel. It does not show good performance in separating the signals in the frequency domain, but shows a better performance for the
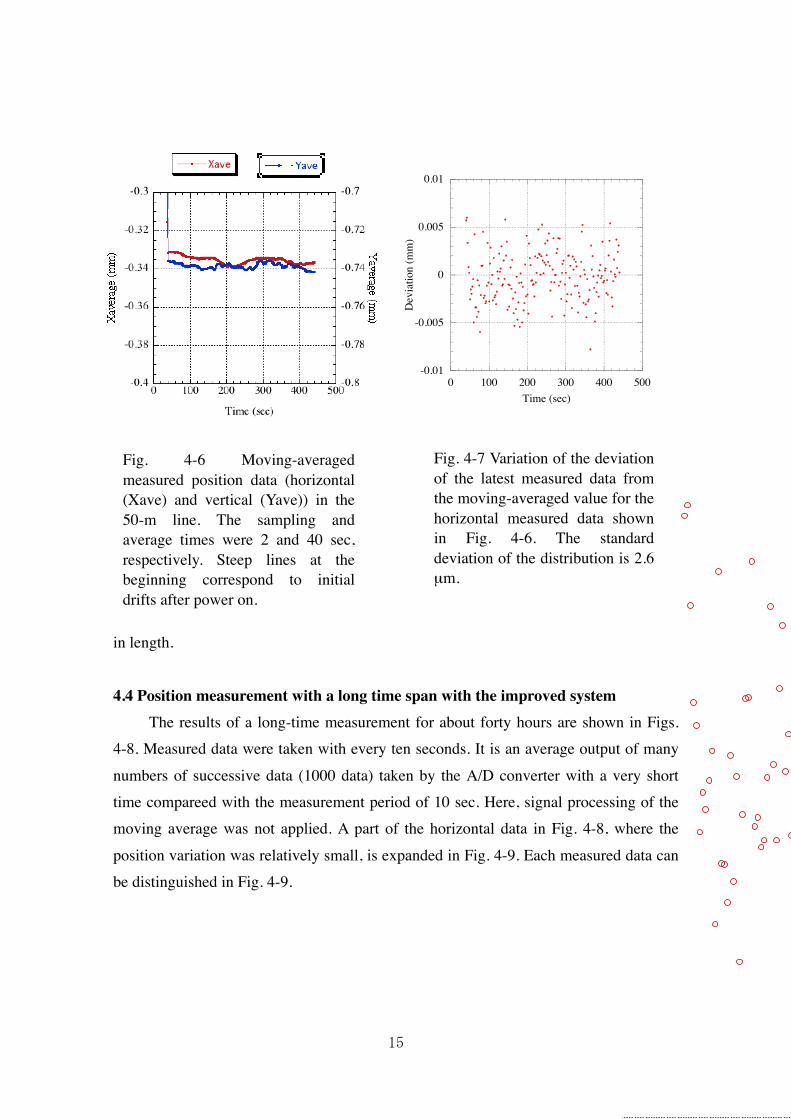
time-domain encoded signals. Therefore, it is optimal for reducing random noise. Figure 4-6 shows the moving-averaged measured position data (horizontal and vertical) in the 50-m line. The sampling and average times are 2 and 40 sec, respectively.
Then, the number of points in the average is 20. Figure 4-7 shows the variation of the differences between the latest measured data and the moving-averaged value for the horizontal measurement shown in Fig.4-6. The distribution (Fig. 4-7) has a standard deviation of 2.6 µm. This means that an accuracy of the measurement of 2.6 µm was
achieved in the laser beam line of 50 m
Fig. 4-4 Observed laser-target signals through the old filter circuit.
Fig. 4-5 Observed laser-target signals through the new filter circuit.
15
in length. 4.4 Position measurement with a long time span with the improved system
The results of a long-time measurement for about forty hours are shown in Figs. 4-8. Measured data were taken with every ten seconds. It is an average output of many
numbers of successive data (1000 data) taken by the A/D converter with a very short time compareed with the measurement period of 10 sec. Here, signal processing of the moving average was not applied. A part of the horizontal data in Fig. 4-8, where the
position variation was relatively small, is expanded in Fig. 4-9. Each measured data can be distinguished in Fig. 4-9.
Fig. 4-6 Moving-averaged measured position data (horizontal (Xave) and vertical (Yave)) in the 50-m line. The sampling and average times were 2 and 40 sec, respectively. Steep lines at the beginning correspond to initial drifts after power on.
Fig. 4-7 Variation of the deviation of the latest measured data from the moving-averaged value for the horizontal measured data shown in Fig. 4-6. The standard deviation of the distribution is 2.6 µm.
-0.01
-0.005
0
0.005
0.01
0 100 200 300 400 500
Dev
iatio
n (m
m)
Time (sec)

16
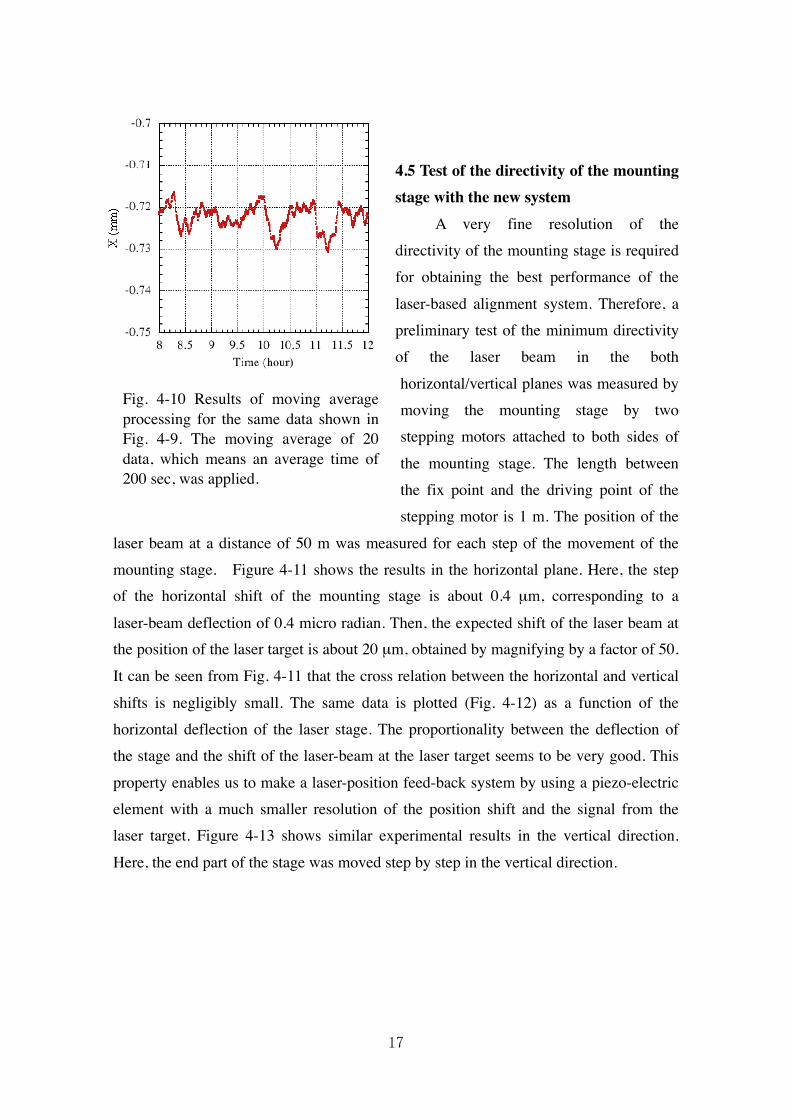
Then, the results of moving average processing for the same data, shown in Fig. 4-9, are shown in Fig. 4-10. Here, the moving average of 20 data, which means an average time of 200 sec, was applied. The maximum deviation of the position during for hours is within 10 µm. The standard deviation of the measurement data is 4.1 µm. By comparing the old data (Fig. 3-1, full scale of vertical axis is 350 µm) and the new data (Fig. 4-10, full scale of vertical axis is 50 µm) for the laser-beam line of 50 m in length,
a drastic improvement in the accuracy of the laser-based alignment system is clear. A periodic movement of the measured position with a period of about 24 hours can be clearly observed in Fig. 4-8, especially in the vertical measurement. It corresponds to
the variation of the temperature in the outside.
Fig. 4-8 Measured results of a long-time measurement for about forty hours. Signal processing of the moving average was not applied.
Fig. 4-9 Details of a part of the horizontal data shown in Fig. 4-8.
-1
-0.8
-0.6
-0.4
-0.2
0
0.2
0.4
0 10 20 30 40 50
Posit
ion
(mm
)
Time (hour)
Vertical
Horizontal
17
4.5 Test of the directivity of the mounting stage with the new system A very fine resolution of the directivity of the mounting stage is required for obtaining the best performance of the
laser-based alignment system. Therefore, a preliminary test of the minimum directivity of the laser beam in the both
horizontal/vertical planes was measured by moving the mounting stage by two stepping motors attached to both sides of
the mounting stage. The length between the fix point and the driving point of the stepping motor is 1 m. The position of the
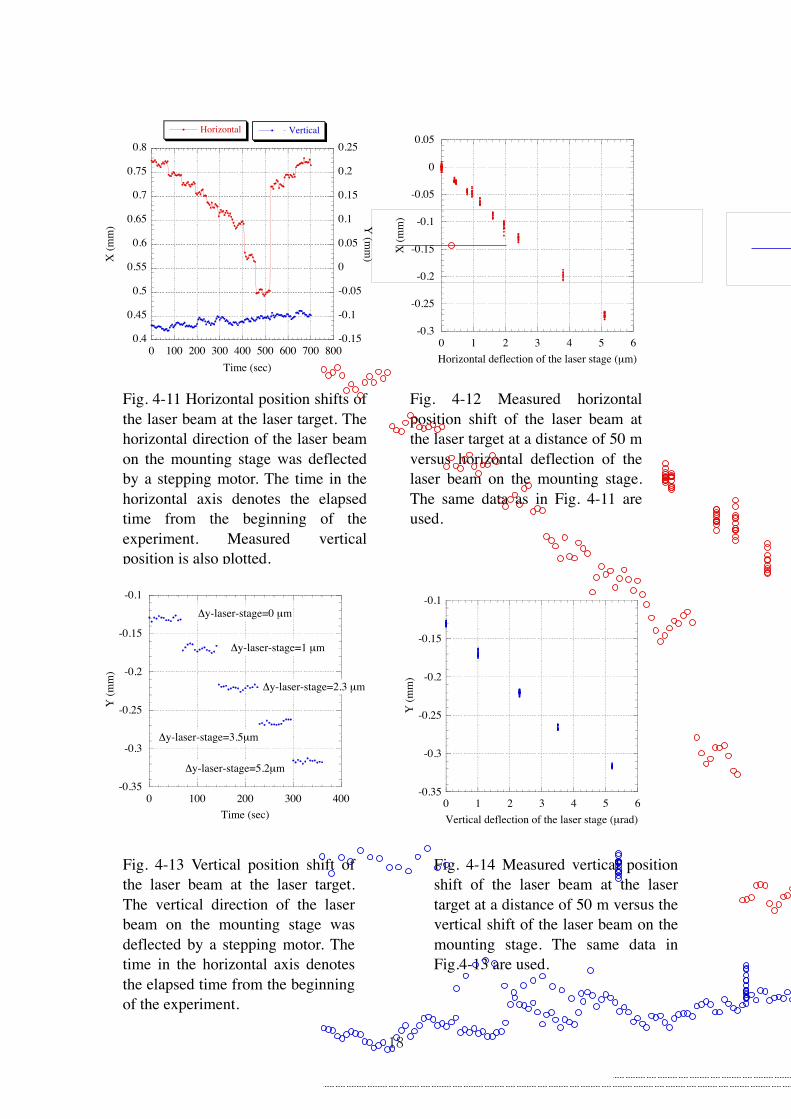
laser beam at a distance of 50 m was measured for each step of the movement of the mounting stage. Figure 4-11 shows the results in the horizontal plane. Here, the step of the horizontal shift of the mounting stage is about 0.4 µm, corresponding to a
laser-beam deflection of 0.4 micro radian. Then, the expected shift of the laser beam at the position of the laser target is about 20 µm, obtained by magnifying by a factor of 50.
It can be seen from Fig. 4-11 that the cross relation between the horizontal and vertical
shifts is negligibly small. The same data is plotted (Fig. 4-12) as a function of the horizontal deflection of the laser stage. The proportionality between the deflection of the stage and the shift of the laser-beam at the laser target seems to be very good. This
property enables us to make a laser-position feed-back system by using a piezo-electric element with a much smaller resolution of the position shift and the signal from the laser target. Figure 4-13 shows similar experimental results in the vertical direction.
Here, the end part of the stage was moved step by step in the vertical direction.
Fig. 4-10 Results of moving average processing for the same data shown in Fig. 4-9. The moving average of 20 data, which means an average time of 200 sec, was applied.
18
-0.3
-0.25
-0.2
-0.15
-0.1
-0.05
0
0.05
0 1 2 3 4 5 6
X (m
m)
Horizontal deflection of the laser stage (µm)
Fig. 4-11 Horizontal position shifts of the laser beam at the laser target. The horizontal direction of the laser beam on the mounting stage was deflected by a stepping motor. The time in the horizontal axis denotes the elapsed time from the beginning of the experiment. Measured vertical position is also plotted.
Fig. 4-12 Measured horizontal position shift of the laser beam at the laser target at a distance of 50 m versus horizontal deflection of the laser beam on the mounting stage. The same data as in Fig. 4-11 are used.
Fig. 4-13 Vertical position shift of the laser beam at the laser target. The vertical direction of the laser beam on the mounting stage was deflected by a stepping motor. The time in the horizontal axis denotes the elapsed time from the beginning of the experiment.
0.4
0.45
0.5
0.55
0.6
0.65
0.7
0.75
0.8
-0.15
-0.1
-0.05
0
0.05
0.1
0.15
0.2
0.25
0 100 200 300 400 500 600 700 800
Horizontal Vertical
X (m
m) Y
(mm
)
Time (sec)
Fig. 4-14 Measured vertical position shift of the laser beam at the laser target at a distance of 50 m versus the vertical shift of the laser beam on the mounting stage. The same data in Fig.4-13 are used.
-0.35
-0.3
-0.25
-0.2
-0.15
-0.1
0 100 200 300 400Time (sec)
Y (m
m)
Δy-laser-stage=0 µm
Δy-laser-stage=1 µm
Δy-laser-stage=2.3 µm
Δy-laser-stage=3.5µm
Δy-laser-stage=5.2µm
-0.35
-0.3
-0.25
-0.2
-0.15
-0.1
0 1 2 3 4 5 6
Y (m
m)
Vertical deflection of the laser stage (µrad)

19
5. Discussion and conclusion
The obtained experimental data show that large improvements in the accuracy of
the laser-based alignment system for the J-PARC proton linear accelerator were achieved as the result of both many efforts for decreasing all kinds of noises in the measured laser-target signals and adopting a new signal-processing method for the
measured signals. The standard deviation of the position accuracy in a 50-m laser line was 2.6 µm with an average time of 40 sec. It can be said that the achieved accuracy is
sufficiently high and the required average time is sufficiently short. A proportionality
between the deflection angle of the injected laser beam and the position shift of the laser beam at a distance of 50 m was satisfactorily confirmed. The mounting stage shows excellent performance of controlling the direction of the laser beam: a deflection of 0.4
micro radian can be easily controlled by using stepping motors with a sufficiently large signal-to-noise ratio. The obtained experimental results mentioned above support that the developed laser-based alignment system for the J-PARC proton linac satisfies the
severe requirements for the linac alignment system as follows. Firstly, if the standard deviation of the position measurement increases linearly as the total length increases up to 250 m, the standard deviation of the position measurement is as small as 13 µm,
which is within the requirement. Secondly, it is well known that a feed back system for stabilizing the laser-beam position by using piezo-electric elements with much less position resolution has been established, technically. Therefore, it can be predicted that
the construction of a position feed back system with a minimum deflection angle of less than 0.1 micro radian (it is equivalent to a position shift of 0.1 µm in our system) and
with some feed-back gain is realistic. The expected radiation damage of the laser target
during beam operation can be easily avoided if necessary, since the laser target can be easily mounted or demounted on the laser-target box within an accuracy of 20 µm,
which enables us to remove the laser target whenever radiation protection is necessary,
although it takes an hour or so. In conclusion, it is strongly recommended to utilize the developed laser-based alignment system of high performance with a short measurement time for the main alignment system of the J-PARC linac in order to achieve the required
high beam-power operation of an order of 1 MW.
20
Acknowledgments The authors wish to thank Z. Kabeya and S .Kakizaki in Mitsubishi Heavy
Industry for their contribution to the development of the components of the laser-based alignment. They wish to thank the linac group of J-PARC for their support and help.
References 1. M. Ikegami, Y. Higashi, and T. Kato, “DEVELOPMENT OF A LASER-BASED
ALIGNMENT SYSTEM FOR THE J-PARC LINAC”, Proceedings of the 7th International Workshop on Accelerator Alignment, SPring-8, 2002.
2. M. Ikegami et al., “LASER-BASED ALIGNMENT SYSTEM FOR THE J-PARC
LINAC”, Proceedings of the 2003 Particle Accelerator Conference, 2394 (2003). 3. “Alignment”, Accelerator Technical Design Report for J-PARC, KEK Report
2002-13 (2003), section 3.1.2.8.
4. Y. Higashi et al., “A new designed ultra-high precision profiler for SR mirrors”, Proc. of the COE Int. Symp. on Ultraprecision Science and Technology for Atomistic Production Engineering, Osaka, pp. 113-120 (2001), Higashi et al., “A New
Designed Ultra-high Precision Profiler”, SPIE Annual Meeting (opto photonics) Proceedings, San Diego (2005).