imputation of missing network data: some simple procedures
TRANSCRIPT

Imputation of missing network data:
Some simple procedures
Mark Huisman∗
Dept. of PsychologyUniversity of Groningen
Abstract
Analysis of social network data is often hampered by non-response and missingdata. Recent studies show the negative effects of missing actors and ties on thestructural properties of social networks. This means that the results of socialnetwork analyses can be severely biased if missing ties were ignored and onlycomplete cases were analyzed. To overcome the problems created by missingdata, several treatment methods are proposed in the literature: model-basedmethods within the framework of exponential random graph models, and im-putation methods. In this paper we focus on the latter group of methods, andinvestigate the use of some simple imputation procedures to handle missingnetwork data. The results of a simulation study show that ignoring the missingdata can have large negative effects on structural properties of the network.Missing data treatment based on simple imputation procedures, however, doesalso have large negative effects and simple imputations can only successfullycorrect for non-response in a few specific situations.
Keywords: Missing data; Single imputation; Descriptive network analysis; Friend-ship network.
1 Introduction
There are several ways in which researchers can cope with missing values, whichare frequently found in data collected in empirical research. The easiest option isto simply ignore the missing data and only analyze the observed responses. How-ever, this practice results in (serious) loss of information and a decrease in statisticalpower, and, more important, may lead to serious bias (e.g., Little and Rubin, 1987;Schafer and Graham, 2002). Other missing data treatments include weighting pro-cedures, model-based procedures (often likelihood-based), and imputation. Muchis already known about the effects of missingness on (statistical) data analysis and∗Department of Psychology, University of Groningen, Grote Kruisstraat 2/1, 9724 TS, Gronin-
gen, the Netherlands. Email: [email protected], tel: +31 50 3636345, fax: +31 50 3636304.
the effectiveness of the various treatment procedures (e.g., Little and Rubin, 1987;Schafer and Graham, 2002). However, the effects of missing data on the structuralproperties of social networks, and especially the treatment of missing network dataare scarcely studied.
This paper presents the results of a simulation study that addresses these two is-sues. First, the effect of missing data on the structure of a network was investigated.The network used in this study is a medium sized friendship network of pupils in asecondary school class. The focus is on missing data caused by non-response of theactors. Second, the performance of some simple imputation techniques to treat themissing network data was inspected by studying the effect of imputation on networklevel estimates. The paper is organized as follows. In Section 2, the occurrence ofmissing data in social networks is discussed. Section 3 presents some simple impu-tation procedures of which the performance is investigated in a simulation study.The design of the simulations is presented in Section 4. Sections 5 and 6 give theresults of the study with respect to effects of missingness and effectiveness of theimputation techniques for both undirected and directed networks, respectively. Thepaper ends with a discussion of the results and an appendix in which two examplesare presented. These examples illustrate the performance of the imputation tech-niques for complex (and more realistic) missing data patterns than were used in thesimulation study
2 Missing data in networks
Data analysis in social sciences is often hampered by missing data. The analysis ofsocial networks is even more frustrated by missing values, because the complexity ofnetwork surveys is more likely to generate missingness, and the analysis and mappingof the structure of the network is especially sensitive to missing data (Burt, 1987a;Ghani, Donnelly, and Garnett, 1998; Borgatti and Molina, 2003; Kossinets, 2006).Social network data consist of a set of actors and a collection of social relationsbetween the actors. In the present paper, the focus is on complete set of actorsand a single, binary relation between the actors. For each pair of actors i, j, the tievariable Xij indicates whether there is a tie from i to j (Xij = 1) or not (Xij = 0).Self-relations Xii are not defined and set to 0. The relation can either be directed,from one actor to another, or undirected, in which case Xij = Xji. If a network tieor actor is missing, there is limited capacity to describe the network context of themissing actors as well as the context of neighboring actors.
One of the main causes of missingness is non-response1. In social network analy-sis, non-response results in missing network information, that is, missing ties and/ormissing scores on actor attributes. Two main types of non-response can be distin-guished: unit non-response, where actors are completely missing (i.e., all outgoingties and attribute scores of an actor), and item non-response, where data on partic-ular items (i.e., particular ties or attributes) are missing. Although missing actors
1In this paper the terms missing data and non-response will be used interchangeably. SeeKossinets (2006) for a detailed discussion of other causes of missingness (e.g., boundary specificationproblems or fixed choice designs).
2

seem to be the most relevant to the social network context, missing data on particularties may occur in whole-network studies when questionnaire instruments incorporaterosters of all actors in a network and a respondent does not indicate the presenceor absence of a relation. In longitudinal studies, a third type of non-response canbe distinguished: wave non-response (or partial non-response; see Huisman andSteglich, 2008). The present paper is restricted to cross-sectional data, thereforethis latter type of non-response is not addressed.
Although non-response results in missing ties for some actors, partial informationon the network context of the incompletely observed actors is available: the ties fromother actors to the incompletely observed actors are observed. This informationcan and should be used to assess the effect of the missingness and to adequatelyanalyze the incomplete network (Costenbader and Valente, 2003; Robins, Pattison,and Woolcock, 2004; Gile and Handcock, 2006; Handcock and Gile, 2007). Thepartial information on the incomplete actors is used to obtain (better) estimates ofthe structural properties of the actors and the network, and may give informationon the nature of the missing data mechanism.
An important question when treating missing data is whether the data are sys-tematically missing, and if so, whether missingness is related to the values of ob-served variables (properties or attributes). Rubin (1976) defined three types of miss-ing data, related to the level of bias caused by the missingness: Missing Completelyat Random (MCAR), Missing at Random (MAR), and Missing Not at Random(MNAR) (see also Schafer and Graham, 2002, or McKnight, McKnight, Sidani, andFiguero, 2007, for a detailed discussion of these definitions).
Data are called Missing Completely at Random if the probability of missingnessis not related the observed data, nor to the unknown missing data (that would havebeen observed). For network data this means that the missingness is unrelated tothe value of the missing ties and unrelated to observed data (e.g., observed actorattributes). In this case there is no systematic bias and the observed data area random subsample from the original set of observations. If the probability ofmissingness is related to the observed data, but still unrelated to the missing ties,data are called Missing at Random. Although in this case the missing data showsystematic patterns, these patterns can be controlled because they are related toobserved data in the sample. Given these observed data, the missingness is a randomprocess.
Data are called Missing Not at Random if the probability of missingness is re-lated to the unknown value of the missing ties. This type of missing data has thelargest impact on the level of bias in statistical analyses, because it results in sys-tematic differences between respondents and non-respondents. The extent in whichstructural properties are affected by systematic missing ties partly depends on theproperties themselves. Measures based on indegrees, for instance, are found to bemore robust against missing data than other measures, because incoming ties areonly partially missing (Costenbader and Valente, 2003).
3

3 Imputation
There are several ways to handle missing data. Two general, popular approachesare likelihood-based estimation based on the available data and imputation (Schaferand Graham, 2002). Butts (2003), Robins, Pattison, and Woolcock (2004), Snijders(2005), Gile and Handcock (2006), Handcock and Gile (2007), and Koskinen (2007)propose methods in the former category. These methods are model-based treat-ments based on all available data, including the incoming ties of non-respondents,within the framework of statistical network models (e.g., exponential random graphmodels).
Imputation procedures replace missing values by plausible estimates. This resultsin a completed data set and gives the researcher the opportunity to proceed with theanalysis using standard analysis methods and software. No information is lost, andif the observed data contain information on the missingness, this information can beused to obtain better predictions of the missing values. Schafer and Graham (2002)distinguish four general types of single imputation procedures, that is, imputationprocedures in which each missing value is imputed once.
Imputing unconditional means. An easy and simple procedure is replacing eachmissing item score with the mean over the observed values of that item. In thisway the means of the items are preserved, but variances and covariances are oftenseverely biased. Moreover, in case of categorical data, rounding the means mayeven introduce more bias. In the case of social networks, unconditional means canbe computed in several ways: 1) the average number of relations in the network(total mean), that is, the density of the network, 2) the average number of incomingrelations of an actor (‘item mean’), and 3) the average number of outgoing relationsof an actor (‘person mean’). For binary network data this results in imputing ones inthe case of dense networks, popular actors, and active actors, respectively. Gabbayand Zuckerman (1998) report imputing mean scores and scores reported by otheractors for missing ties in a network of work-related interactions between membersof R&D laboratories.
Imputing from unconditional distributions. In order to prevent the distributionof the items to be distorted by imputation, procedures are developed that better pre-serve the data distributions. One class of procedures, known as hot deck procedures,replace each missing value of a respondent, or even the complete non-respondent,with the observed score of a donor respondent from the same data set (e.g., Sande,1982). Cold deck procedures use donors from other data sets (and studies). Theseprocedures preserve the means and variances of the items in the data set, but stilldistort the associations between items. In the case of social networks, hot deck im-putation means finding a donor actor whose observed ties are used to replace the(completely) missing ties of another actor. Burt (1987b) describes a hot deck impu-tation procedure for imputation of missing actor attribute data in which donor altersare found “who can speak as a surrogate alter” using the structure of the network(Burt 1987b, p. 1332). Goldstein (1999) uses hot deck imputation for synthesizingkinship networks from household-level survey data.
Imputing conditional means. If there is an association between a missing itemand an observed item, the latter may be used to predict the missing value of the for-
4

mer item. In non-network data, regression models are often used to predict missingscores. This prediction is the conditional mean of the missing item given the valuesof the observed item. The procedures gives better estimates of the missing val-ues than unconditional procedures, but underestimates variances and overestimatesthe relationships between the variables used in the prediction. In social networks,conditional means can be obtained by conditioning on (partially observed) networkcharacteristics like degree, or by using expected values from conditional distribu-tions.
Imputing from conditional distributions. Bias in variances and covariances canbe greatly reduced by using a conditional distribution and replacing missing valueswith draws from this distribution. An often used procedure is imputing regressionpredictions with an added error term drawn from a normal distribution. Underthe assumption that the data are MAR this produces nearly unbiased estimates ifthe conditional distribution of the missing data given the observed data is correctlyspecified. For general (arbitrary) patterns of missing data this can be quite com-plicated. For network analysis there are several classes of distributions available:Ward, Hoff, and Lofdahl (2003) use latent space models (based on logistic regres-sion) to impute missing network data, Steinley and Wasserman (2006) explore thepossibilities of conditional uniform random graph distributions (Bernouilli distribu-tions), Handcock and Gile (2007) use exponential random graph models (ERGMs)to produce imputed values.
Apart from the complexity of the latter two classes of imputation methods,single imputation procedures have two major shortcomings. These shortcomingsare related to bias and uncertainty. The first problem is that imputations candistort data distributions and relationships, and produce biased estimates, even fordata that are MCAR. Second, even if distributions are preserved, single imputationunderestimates uncertainty levels, because predictions are treated as observed valuesand the actual sample size is overestimated. This problem can be solved by multipleimputation (Rubin, 1987). Handcock and Gile (2007) suggest how to obtain multipleimputations using ERGMs.
3.1 Simple imputation methods
The simple imputation procedures presented in this section come from the first twoclasses of procedures defined by Schafer and Graham (2002): imputing unconditionalmeans and imputing from unconditional distributions.
Imputing the unconditional meanFor binary networks the unconditional total mean (i.e., the average tie value overall observed ties) is equal to the network density. The rounded value of the density(zero if the density is smaller than 0.5) is imputed. This imputation method treatsmissing ties as absent in sparse networks, and present in dense networks. It is avery crude version of the imputations suggested by Burt (1987a). For ego-centeredsurveys networks, Burt (1987a) finds that missingness is strongly associated withweak relations, and suggests that they can be replaced by values indicating suchweak relations.
5

Imputation by reconstructionStork and Richards (1992) suggest reconstructing the missing part of the networkusing the observed incoming relations of the missing actors. All missing ties Xij arereplaced with the observed value of the opposite tie in the dyad: Xmis
ij = Xji. As theprocedure does not allow reconstruction of ties when the dyad is completely missing,additional imputations are necessary. We used random imputation proportional tothe observed density (i.e., the probability of a tie is equal to the observed density ofthe network). This reconstruction procedure was also investigated by Huisman andSteglich (2008) for non-response in network panels.
The reconstruction procedure is the natural candidate for undirected networks asit assumes that reported ties match across actors. For directed networks, however,this assumption is not expected to hold; even in networks with strong reciprocityeffects a large number of ties may not be reciprocated. An application of imputationby reconstruction for directed networks with valued ties is given by Gabbay andZuckerman (1998), who impute the ties reported by observed respondents abouttheir relationships with the non-respondent.
Imputation using preferential attachmentThis procedure was proposed by Huisman and Steglich (2008) and uses the conceptof preferential attachment, which states that the probability that an actor will link toanother actor is dependent on the connectivity of other actors. (Barabasi and Albert,1999). Preferential attachment is incorporated in terms of indegrees by assumingthat the probability that a missing actor i will be connected to another (observed ormissing) actor j is proportional to the indegree of actor j: Π(kj) = kj∑
jkj
, with kj
the observed indegree of actor j, and the sum is over all available actors j 6= i. Theprocedure is expected to preserve the degree distributions. The following steps aretaken to replace the missing ties by randomly drawn zeros or ones (see also Huismanand Steglich, 2008):
1. For each actor i with missing ties randomly draw an outdegree di from theobserved outdegree distribution.
2. Determine Ji = {j : j = 1, . . . , n, j 6= i,Xmisij }, the set of actors j whose tie
from i, Xij , is missing. For completely missing actors i, Ji contains all otheractors in the network.
3. Compute the observed outdegree dobsi of actor i using the observed ties. Forcompletely missing actors dobsi = 0.
4. If di > dobsi , randomly draw a total of di − dobsi actors j without replacementfrom Ji using the the preferential attachment probabilities Π(kj). ImputeXij = 1 for these actors j and 0s for the other ties.
Hot Deck imputationUsing actor attributes and structural properties, completely observed donor actorsare found to replace the missing actor (unit non-response) or missing ties of an in-complete actor (item non-response). Actors were matched on a completely observed,
6

categorical attribute and on their indegrees by minimizing the absolute differencesbetween the incomplete and donor actors on the two properties (see Section 4 for adescription of the network and attribute data). The indegrees were computed fromthe observed ties of the actors. When no donor actor could be found, zeros wereimputed.
4 Simulation study
In order to investigate the effect of non-response and imputation on network struc-ture, a simulation study was performed. The general pattern of the study is:
1. ‘generate’ a complete network,
2. generate missing data by deleting a proportion of actors or ties,
3. analyze the incomplete network data,
4. generate a completed network by imputing the missing ties,
5. re-analyze the completed network data.
Different (independent) factors were used to generate data and missing data: type ofnetwork, type of non-response, missing data mechanism, and proportion of missingties. The incomplete data sets generated were analyzed using descriptive techniques(see Section 4.3) and imputed with the techniques described in Section 3. For eachgenerated data set and imputation method, the procedure is repeated 100 times.
4.1 Generating network data
The network data used in the simulation study are a sample data set of 50 actors.These data are provided together with the StOCNET software (Boer, Huisman, Sni-jders, Steglich, Wichers, and Zeggelink, 2006) and are a subset of the friendshipnetwork from the Teenage Health and Lifestyle study, as discussed in Pearson andWest (2003) and Steglich, Snijders, and West (2006). The data set consists ofgirls only, and directed relations between them. In this network, among others,reciprocity effects and network closure effects were found to be strong effects (innetwork evolution), as well as actor attribute effects related to alcohol consumption.The friendship data were assessed by a name generator allowing for naming up tosix friends. Alcohol consumption is coded on a 5-point frequency scale ranging from1 (‘I don’t drink’) to 5 (‘more than once a week’). This data set was also used byHuisman and Steglich (2008) in a simulation study on non-response in longitudinalnetwork studies.
Two types of networks were used in the simulation study: the original, directednetwork and a symmetrized version of the network. The latter undirected networkwas created by replacing each tie value with the maximum value of the dyad towhich it belongs.
7

4.2 Generating missing data
For the creation of missing ties two types of non-response were used. The firsttype is unit non-response, defined as completely missing actors (i.e., all outgoingties of an actor are missing). The second type is item non-response, defined asoccasionally missing ties of observed actors. These two types of missingness, amongstothers, were also studied by Kossinets (2006). In Kossinets’ study, unit non-responsewas implemented as completely missing subsets of actors, that is, all outgoing andincoming ties of the actors were deleted. This is different from the definition used inthe present paper. In order to compare the results of the present simulations withthe results found by Kossinets, a third type of non-response was added: completelymissing outgoing and incoming ties of actors. This type was only used to study ofthe effects of missing data, not to study the imputation methods.
Three missing data mechanisms define the probability that an actor or a tie ismissing (see also Huisman and Steglich, 2008):
• Ties are Missing Completely at random (MCAR).
• Missingness is related to an actor attribute: alcohol consumption. The prob-ability of missing is proportional to 1
(alcohol score)2 .
• Missingness is related to a network characteristic: outdegree. The probabilityof missing is proportional to 1
(outdegree+1)2 .
The three mechanisms are examples of the three definitions by Rubin (1976;see Section 2). The two non-random mechanisms are such that higher scores (highalcohol scores indicate heavier alcohol consumption, high outdegrees indicate moreactive actors in the network) result in small missingness probabilities2. As theattribute alcohol consumption is completely observed for all actors, the data areMAR. The missingness related to outdegree is missing not at random (MNAR),as outdegree is a network characteristic determined from the complete data set(observed and missing).
Missing ties were created according to the two types and three mechanisms. Theproportions of missing ties (actors) ranged from 0.10 to 0.90, in steps of 0.10.
4.3 Performance of the imputation techniques
An imputation technique performs well if it is able to obtain plausible estimates ofthe missing values and preserves the relationships among the items. This meansthat analysis of the completed data should result in unbiased estimates of parame-ters and variances. Moreover, an imputation technique should also reduce the biascaused by the missing data (e.g., see Sande, 1982). The effectiveness of the impu-tation techniques in reaching these goals is evaluated against some criteria that arefrequently used in social network research.
2This means that the less alcohol respondents consume, the less they are inclined to participatein the study. This may not be overly realistic in every context but does not diminish the usefulnessof the mechanism for illustrative purposes.
8

Huisman and van Duijn (2005) distinguish five classes of procedures that soft-ware for social network analysis may or may not possess. Four of these classescontain important criteria (analysis techniques) that can be used to evaluate theeffects of missing data and imputation. The groups of procedures are: (1) visual-ization techniques, (2) descriptive methods to calculate (simple) network statistics,(3) procedure-based analysis based on more complex algorithms, and (4) statisticalmodeling based on probability distributions. In the present study, the effectivenessof the imputation techniques is investigated using criteria from the second group ofprocedures: descriptive methods. The focus is on bias in estimating the descriptivestatistics, and not on standard errors and inferences.
In order to investigate the impact of missing data and imputation on structuralproperties of the network the following statistics were used3, and were calculated forboth undirected and directed networks (e.g., Wasserman and Faust, 1994):
• Mean outdegree.
• Reciprocity. For undirected networks, reciprocity is defined as the proportionof mutual dyads. Because all ties are reciprocated in undirected networks,reciprocity is equal to the density. For directed networks, it is defined as twotimes the number of mutuals divided by the sum of two times the numberof mutuals and the number of asymmetric dyads, 2M
2M+A (as in the StOCNETsoftware, Boer et al., 2006).
• Transitivity (or clustering; Newman, Strogatz, and Watts, 2001). For undi-rected networks clustering equals three times the number of triangles dividedby the number of connected triples (Newman et al., 2001; this definition is alsoused in the StOCNET software). For directed networks, transitivity is definedas the ratio of transitive triads to the number of potential transitive triads(StOCNET, Boer et al., 2006).
• Assortativity (Newman, 2003). Assortativity, or assortative mixing on degrees,is defined by Newman (2003) as the correlation between the degrees at eitherend of an edge, that is, the correlation between degrees of adjacent networknodes. It shows the preference of actors to associate with others who aresimilar in terms of their volume of connections (Newman, 2003). For directednetworks it is the correlation between the indegree of the node the edge leadsinto and the outdegree of node the edge leads out of.
• Mean inverse geodesic distance. When large amounts of the data are missing inthe sparse friendship network, the simulated graphs break up in disconnectedcomponents, resulting in undefined (or infinite) geodesics. In order to be ableto interpret the results for geodesic distance, the inverse of the geodesic wascalculated for both directed and undirected simulated networks, which equals0 for unconnected nodes.
3This set of measures does not include important measures for dyadic or nodal properties (e.g.,node centrality), which may be affected differently by missingness and imputation, depending onthe local neighborhoods of the observed and missing actors. The majority of the statistics were alsoused by Kossinets (2006), and were chosen to be able to compare the results of the studies
9

Table 1 : Network descriptives for the original friendship net-works.
Undirected DirectedMean degree 3.240 2.320Reciprocity 0.066 0.603Clustering/transitivity 0.209 0.373Assortativity 0.088 0.094Mean inverse geodesic distance 0.280 0.128
For the original, completely observed network, the values of the descriptives arepresented in Table 1. It follows from Table 1 that the two networks do not differmuch with respect to the descriptive statistics. The girls’ friendship network israther sparse: the density of the undirected network equals 0.066 (the proportion ofmutual dyads; see Table 1), and the density of the directed network equals 0.047.Also, the mean degrees are small. In the directed network the majority of theties are reciprocated (reciprocity equals 0.603). The networks show a fair amountof transitive relations and a small amount of assortative mixing. On average, theinverse of the geodesic equals 0.280 in the undirected network and 0.128 in thedirected network, indicating that it takes a larger number of steps to reach anotheractor in the directed network. Note that there are two isolated actors.
The relation between alcohol consumption and some aspects of network struc-ture were calculated for a better interpretation of the effect of the missing datamechanisms. The mean alcohol score of the 50 actors is 3.1 (SD = 1.2), with 38%of the actors scoring 4 or 5 (indicating high alcohol consumption). The outdegree ofthe actors with a higher alcohol consumption is somewhat larger than that of lessheavy drinkers, 2.7 and 2.1, respectively (the difference is not significant), and thecorrelation between alcohol consumption and outdegree is 0.16. No large differenceswere found in centrality measures between the alcohol groups. Inspection of cliques(of size 3 and larger, containing 74% of the actors) shows that 8 of the 19 observedcliques almost completely consisted of actors with high alcohol scores (score 4 or 5).The other 8 cliques consist of actors with lower, but similar alcohol scores.
4.4 Simulation design
To study the impact of missing data and the performance of the imputation tech-niques, the two types of networks (directed and undirected) were analyzed separately,using slightly different designs. For directed networks, the design is a complete fac-torial one, with two types of missing data, three missing data mechanisms, and nineproportions of missing data, resulting in 2 × 3 × 9 = 54 cells. Within each cell 100incomplete data sets were generated and repeatedly imputed using the four imputa-tion techniques. The descriptive measures were calculated for the incomplete dataand the imputed data sets in each cell.
For undirected networks, an extra type of missing data was added: the completedeletion of subsets of actors. For these actors all outgoing and incoming ties weredeleted (cf. Kossinets, 2006). The incomplete data were analyzed using all available
10

cases, ignoring the missing ties. This means that, contrary to complete case analysis,actors with some individually missing ties are included in the calculation of thedescriptives, and analyses are based on their observed ties only. Moreover, onlyone imputation technique was used for undirected networks, that is, imputationby reconstruction. The other imputation methods do not take into account thesymmetry of the network, and reconstruction is the most logical and easiest methodto impute undirected networks. This results in a design with 3×3×9 = 81 cells, eachin which 100 incomplete data sets were generated and repeatedly imputed using thereconstruction method. The descriptive measures were calculated for the incompletedata and the imputed data sets in each cell.
5 Undirected graphs
To investigate the effects of missing data and imputation in the networks, the descrip-tives mean degree, reciprocity, clustering, assortativity and mean inverse geodesicdistance were calculated on the simulated incomplete data using the available data,and on the data completed with the imputation methods. The results are presentedin Figures 1 and 2, which show the values of the descriptive measures in each cell ofthe simulation design, and in Table 2, containing the partial eta squared effect sizesfrom an analysis of variance performed on difference scores: the calculated value ofthe descriptive measure in a particular cell of the design minus the true value of theoriginal data without missingness.
The figures each contain 10 plots. The plots on the left side show the resultsfor the case of unit non-response (missing actors), the plots on the right side foritem non-response (missing ties). The missingness mechanisms are represented bydifferent lines in each plot. The five descriptives are presented from top to bottomon the y axis of the plots, on the x axis corresponds to the proportion of missingactors/ties. Figure 1 depicts how the descriptives change as the proportion missingdata increases, where a flat line indicates that missing data do not affect the networkstructural descriptives.
Table 2 presents the partial eta squared effect sizes for the main effect of method(ignoring the missing data and the imputation methods), type of non-response, miss-ingness mechanism, and proportion of missing data, as well as all two-way interac-tions. Higher-order interactions were not found to be relevant (except for a fewspecific cases that are mentioned in the text).
5.1 Effects of missing data
Table 2 shows that the proportion of missing data has the largest effect on all fivedescriptive statistics. There are also relatively large interaction effects includingproportion missing, especially the interaction between proportion and (imputation)method. The directions of these effects are shown in Figure 1 and 2, and are discussedbelow, as well as other effects observed for specific descriptive statistics.
Mean degree. For degree there are large effects of type of non-response, andproportion missing. Both effects are clear in Figure 1. Generally, the bias increases
11

Table 2 : Partial eta squared effect sizes from the ANOVA of the biasin the descriptive statistics for the symmetrized friendship network.Main effects of Method (Meth), type of non-response (Type), miss-ingness mechanism (Mech), and proportion missing data (Prop), andtwo-way interaction effects are reported.
Degree Recip. Clust. Assor. InvGeo.
Meth 0.734 0.072 0.010 0.026 0.955Type 0.709 0.000* 0.010 0.000* 0.171Mech 0.091 0.024 0.010 0.008 0.106Prop 0.850 0.202 0.317 0.259 0.957
Meth × Type 0.723 0.000* 0.005 0.000* 0.152Meth × Mech 0.206 0.018 0.004 0.001* 0.524Meth × Prop 0.625 0.175 0.074 0.082 0.872Type × Mech 0.242 0.000* 0.000* 0.001* 0.001*Type × Prop 0.640 0.000* 0.013 0.006 0.068Mech × Prop 0.220 0.043 0.029 0.013 0.379* The result was not significant: p > 0.01.
with more missing data. There is a large decrease in mean degree in case of item non-response (i.e., missing ties). In case of unit non-response (i.e., missing actors), degreeis not affected or slightly increases, because the parameter controls for networksize. In this situation, the non-random mechanisms result in an increase of meandegree, especially degree-related missings, as the actors with lower degrees have alarger probability to be missing and the positive relation between degree and alcoholconsumption.
Reciprocity. For reciprocity, the proportion missing data has the largest effect.There is also a small interaction effect between proportion missing and mechanism.Figure 1 shows that reciprocity is stable for randomly missing data, but increases forthe degree and alcohol-related mechanisms. The increase is largest for missingnessrelated to degree (as was the case for mean degree), due to the deletion of actorswith a smaller number of ties in both non-random mechanisms.
Clustering. Table 2 shows the same effects for clustering as for reciprocity:large effects for proportion missing, and a small interaction effect with mechanism.For random and degree-related missing data, clustering is rather stable up to 60%missing data, after which the scores generally decrease and the variation in thescores sharply increase. Alcohol-related missingness results in a slight decrease of theclustering. Results for item non-response are similar, only the increase in variationstarts at smaller proportions of missing ties, and for large numbers of missing ties thedecrease of the clustering coefficient is more pronounced, especially for the MCARdata.
Assortativity. For assortativity the effect of proportion missing is largest, aswas the case for the other statistics. Missing data mechanism has a small effecton assortativity (also in interaction with proportion missing), which is differentfrom the effects found for the other statistics. For the alcohol-related missingness,assortativity first increases, and decreases again (after 50% missing data). This
12

indicates that actors with high scores on alcohol consumption have a preference tohave ties to others with the same alcohol consumption level (cf. Steglich et al., 2006,who find that alcohol consumption has a strong impact on friendship dynamics interms of homophily). The other two mechanisms show decreasing scores. Thesepatterns are found for both unit and item non-response.
Inverse geodesic distance. The mean inverse geodesic decreases with higher pro-portions missing data. This is due to the sparseness of the network, which causes thenetwork to break up into disconnected components. For degree-related non-responsethe decrease is least steep, as actors with low degrees are missing more often.
The effects of the third type of missingness (i.e., deleting complete subsets of actors)on the mean degree were always between those of unit and item non-response (resultsare not reported here). Mean degree decreases, but not as sharply as for item non-response. The effects on reciprocity and inverse geodesic are the same as for theother two types of non-response, and the effects on clustering largely resemble theeffects of the other types. The effects of missingness on assortativity are even betterthan the effects caused by either unit or item non-response. Assortativity is slightlyoverestimated, but stable up to 80% missing, after which it rapidly decreases.
5.2 Effects of imputation
The generated incomplete networks were imputed using the reconstruction proce-dure. The effects of imputation on mean degree, reciprocity, clustering, assortativity,and mean inverse geodesic distance are presented in Figure 2. The figure shows theeffects of type of missingness, missing data mechanism, and proportion missing inthe same way as Figure 1. Table 2 also presents the effects of missing data treatmenton the network descriptives.
Mean degree. The large effect of missing data treatment (as shown in Table 2)is due to the effect of reconstruction in the case of item non-response. The decreasein mean degree due to the missing ties is completely removed by reconstructing thenetwork. The patterns are identical to the patterns for unit non-response (ignoringmissingness and reconstructing the missing actors). There is a smaller effect ofmechanism, where mean degree increases for the non-random mechanisms and isstable in case of MCAR data.
Reciprocity. For reciprocity similar patterns are found in Figures 1 and 2. Table 2shows an interaction effect between method and proportion missing. ComparingFigure 1 and 2 shows that the effect of imputation on reciprocity is smaller than theeffect of the ignoring the missingness, indicating that reconstruction results in goodestimates of reciprocity, even for non-random missingness mechanisms.
Clustering. The effect of reconstruction on clustering is the same for both typesof missing data and all three mechanisms. The clustering decreases quickly after20% missing data, where the decrease is slower for large proportions missing. Whenignoring the missing data (Figure 1) the decrease is smaller indicating that recon-struction results in underestimation of the amount of clustering in the network evenfor low proportions of missing data.
13

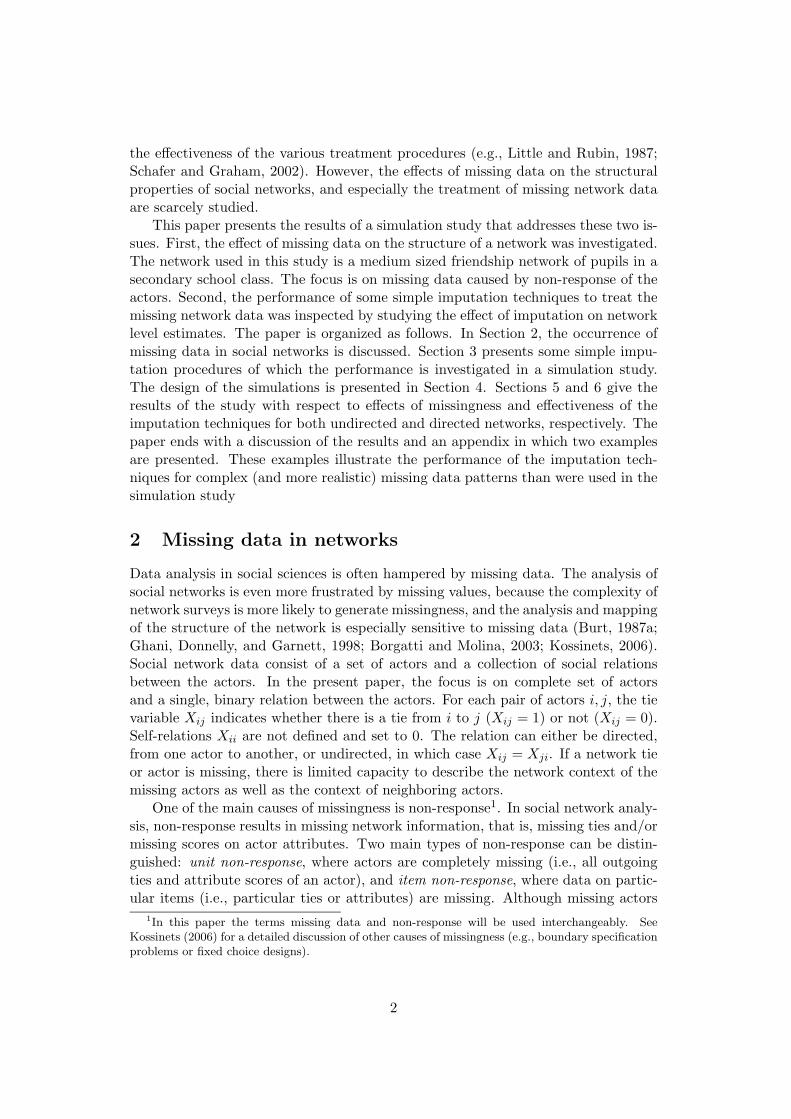
Figure 1 : Estimated statistics for the symmetrized, incomplete friendship network (with errorbars), for unit non-response (left) and item non-response (right). From top to bottom: plotsfor degree (D), reciprocity (R), clustering (C), assortativity (A), inverse geodesic (G) on the yaxis, and proportion missing data on the x axis. Within each plot three different lines representthe missingness mechanisms: MCAR (labelled Unit or Item), Degree, and Alcohol.
14

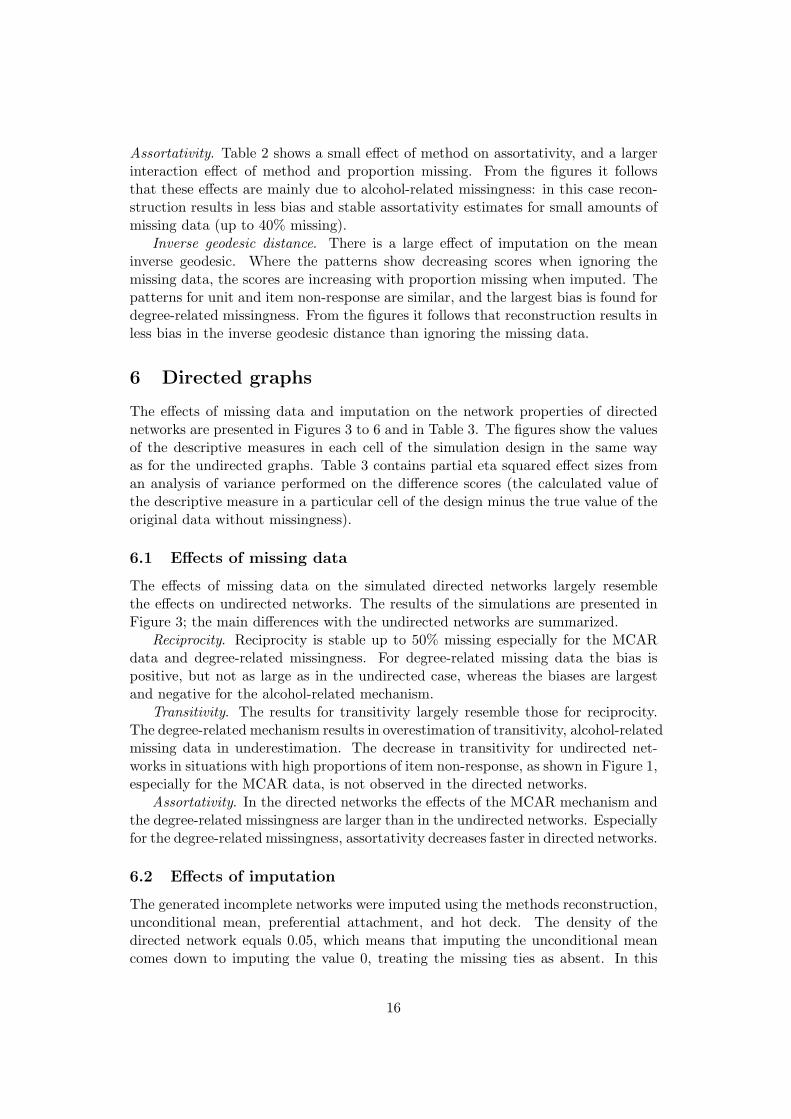
Figure 2 : Estimated statistics for the symmetrized friendship network imputed using recon-struction (with error bars), for unit non-response (left) and item non-response (right). Fromtop to bottom: plots for degree (D), reciprocity (R), clustering (C), assortativity (A), inversegeodesic (G) on the y axis, and proportion missing data on the x axis. Within each plot threedifferent lines represent the missingness mechanisms: MCAR (labelled Unit or Item), Degree,and Alcohol.
15
Assortativity. Table 2 shows a small effect of method on assortativity, and a largerinteraction effect of method and proportion missing. From the figures it followsthat these effects are mainly due to alcohol-related missingness: in this case recon-struction results in less bias and stable assortativity estimates for small amounts ofmissing data (up to 40% missing).
Inverse geodesic distance. There is a large effect of imputation on the meaninverse geodesic. Where the patterns show decreasing scores when ignoring themissing data, the scores are increasing with proportion missing when imputed. Thepatterns for unit and item non-response are similar, and the largest bias is found fordegree-related missingness. From the figures it follows that reconstruction results inless bias in the inverse geodesic distance than ignoring the missing data.
6 Directed graphs
The effects of missing data and imputation on the network properties of directednetworks are presented in Figures 3 to 6 and in Table 3. The figures show the valuesof the descriptive measures in each cell of the simulation design in the same wayas for the undirected graphs. Table 3 contains partial eta squared effect sizes froman analysis of variance performed on the difference scores (the calculated value ofthe descriptive measure in a particular cell of the design minus the true value of theoriginal data without missingness).
6.1 Effects of missing data
The effects of missing data on the simulated directed networks largely resemblethe effects on undirected networks. The results of the simulations are presented inFigure 3; the main differences with the undirected networks are summarized.
Reciprocity. Reciprocity is stable up to 50% missing especially for the MCARdata and degree-related missingness. For degree-related missing data the bias ispositive, but not as large as in the undirected case, whereas the biases are largestand negative for the alcohol-related mechanism.
Transitivity. The results for transitivity largely resemble those for reciprocity.The degree-related mechanism results in overestimation of transitivity, alcohol-relatedmissing data in underestimation. The decrease in transitivity for undirected net-works in situations with high proportions of item non-response, as shown in Figure 1,especially for the MCAR data, is not observed in the directed networks.
Assortativity. In the directed networks the effects of the MCAR mechanism andthe degree-related missingness are larger than in the undirected networks. Especiallyfor the degree-related missingness, assortativity decreases faster in directed networks.
6.2 Effects of imputation
The generated incomplete networks were imputed using the methods reconstruction,unconditional mean, preferential attachment, and hot deck. The density of thedirected network equals 0.05, which means that imputing the unconditional meancomes down to imputing the value 0, treating the missing ties as absent. In this
16

Figure 3 : Estimated statistics for the directed, incomplete friendship network (with error bars),for unit non-response (left) and item non-response (right). From top to bottom: plots fordegree (D), reciprocity (R), transitivity (T), assortativity (A), geodesic (G) on the y axis, andproportion missing data on the x axis. Within each plot three different lines represent themissingness mechanisms: MCAR (labelled Unit or Item), Degree, and Alcohol.
17

Figure 4 : Estimated statistics for the directed friendship network imputed using reconstruction(RE), for unit non-response (left) and item non-response (right). From top to bottom: plotsfor degree (D), reciprocity (R), transitivity (T), assortativity (A), geodesic (G) on the y axis,and proportion missing data on the x axis. Within each plot three different lines represent themissingness mechanisms: MCAR (labelled Unit or Item), Degree, and Alcohol.
18

Table 3 : Partial eta squared effect sizes from the ANOVA of thebias in the descriptive statistics for the directed friendship network.Main effects of Method (Meth), type of non-response (Type), miss-ingness mechanism (Mech), and proportion missing data (Prop),and two-way interaction effects are reported.
Degree Recip. Trans. Assor. InvGeo.
Meth 0.946 0.758 0.121 0.262 0.326Type 0.830 0.018 0.183 0.126 0.124Mech 0.533 0.057 0.091 0.010 0.397Prop 0.905 0.827 0.655 0.326 0.804
Meth × Type 0.858 0.044 0.021 0.234 0.067Meth × Mech 0.094 0.012 0.006 0.037 0.315Meth × Prop 0.880 0.535 0.205 0.135 0.481Type × Mech 0.015 0.001* 0.014 0.025 0.002*Type × Prop 0.779 0.026 0.107 0.058 0.183Mech × Prop 0.176 0.017 0.075 0.018 0.138* The result was not significant: p > 0.01.
respect it resembles the available case method, where missing values are ignored.This turns out to be true for assortativity and geodesic distance, where the effectsare exactly the same as those for ignoring the missing data. This is also true for meandegree in the situation of item non-response and transitivity for unit non-response.In the other two cases (mean degree for unit non-response and transitivity for itemnon-response) the effects are negative: there is a sharp and almost linear decrease.The results are not reported here.
The results of the simulations are summarized in Table 3, using partial eta’ssquared. The effects of the procedures reconstruction (RE), preferential attachment(PA), and hot deck (HD) on the network properties are presented in Figures 4, 5,and 6, respectively. It should be noted that in case of item non-response the hotdeck method frequently was not able to find donor actors to replace the missing ties.For missingness levels of 0.5 and higher suitable donors were not available in thenetwork and zeros were imputed. For these situations the hot deck method and theunconditional mean method show the same effects.
Mean outdegree. Table 3 shows large effects of all factors on mean outdegree.There is a large three-way effect of imputation method, type of non-response, andproportion missing (not reported in Table 3), but clearly visible in the figures. Forunit non-response the patterns resemble those of ignoring the missing data, indi-cating that imputation does not lead to better results in this situation. In case ofitem non-response, the patterns for RE are clearly different from the other methods.Here, the downward effect of missingness (Figure 3) is corrected. The methods PAand HD somewhat correct for small proportions missing (HD even over-corrects),after which they show the same effect as ignoring the missingness. In all plots, thelargest positive bias is found for degree-related missing data
Reciprocity. For reciprocity there is a large interaction effect of method andproportion missing. Ignoring the missing data gives reasonably stable results (for
19

Figure 5 : Estimated statistics for the directed friendship network imputed using preferentialattachment (PA), for unit non-response (left) and item non-response (right). From top tobottom: plots for degree (D), reciprocity (R), transitivity (T), assortativity (A), geodesic (G)on the y axis, and proportion missing data on the x axis. Within each plot three different linesrepresent the missingness mechanisms: MCAR (labelled Unit or Item), Degree, and Alcohol.
20

Figure 6 : Estimated statistics for the directed friendship network imputed using hot deck(HD), for unit non-response (left) and item non-response (right). From top to bottom: plotsfor degree (D), reciprocity (R), transitivity (T), assortativity (A), geodesic (G) on the y axis,and proportion missing data on the x axis. Within each plot three different lines represent themissingness mechanisms: MCAR (labelled Unit or Item), Degree, and Alcohol.
21

small to medium proportions missing), but the imputation methods show differentpatterns. The PA and HD methods show similar effects: reciprocity is increas-ingly underestimated for higher proportions of missing data. RE shows a different(quadratic) pattern: reciprocity is overestimated for small proportions missing, un-derestimated for larger proportions. This latter result is largely due to the randomcharacter of the method when many ties are missing. The figures show that thereare no differences between the two types of non-response and the three missingnessmechanisms.
Transitivity. The results for transitivity largely resemble those for reciprocity.Table 3 shows a large interaction effect of method and proportion missing. Theimputation methods result in underestimated transitivity scores, whereas ignoringthe missing data gives more or less stable results. Generally, the negative biasincreases with proportion missing data. Only hot deck imputation for unit non-response shows an increase in scores (after an initial decrease). This is probablydue to the imputation of zeros for large proportions missing (as no suitable donorscan be found), which leads to the same results as found in Figure 3 for ignoring themissing data.
Assortativity. Table 3 presents two interaction effects for assortativity: thelargest of method and type, and a second of method and proportion missing. Thegeneral picture is clear from Figures 4 to 6: assortativity gradually decreases forhigher proportions missing. The methods RE and PA give similar, reasonably sta-ble results, especially for small amounts of missing data. Here, the bias is generallylargest for degree-related missingness and smallest for alcohol-related missingness.The HD method, however, shows a large decrease in the assortativity score in caseof missing actors, and more erratic behavior in case of missing ties. Moreover, theerror bars show large variations in the scores, making HD not a very good methodwhen estimating assortativity.
Inverse geodesic distance. For the mean inverse geodesic distance there is alarge tree-way interaction effect for method, mechanism, and proportion missing(not reported in Table 3). From the figures it follows that degree-related missingdata results in large positive bias, especially for the RE and PA methods. For REthe bias increases with higher proportions, whereas for the other methods the biasstarts decrease for high proportions missing data. The RE method overcorrects thedecrease in assortativity found for ignoring the missing data (Figure 3). The othertwo methods overcorrect for small amounts of missing data, but tend to undercorrectfor large numbers of missing ties.
In the appendix two examples are presented of the directed network data with morecomplex missing data mechanisms than were used in the simulation study.
7 Discussion
In this paper, a simulation study was performed to investigate the effect of non-response on the structural properties of social networks, and the ability of somesimple imputation techniques to treat the missing network data. The simulations
22

were based on an existing friendship network in school classes, and missing datawere created using different types, mechanisms, and proportions of missing data.In simulation studies like this, the question always is how realistic the design andconditions of the study are, in order to suggest real-life applicability of the resultsand generalization to situations that were not explored.
The data set used in the simulations was chosen to be the empirical data setthat was used by Huisman and Steglich (2008), consisting of a medium-sized, sparsenetwork. This makes generalizing the results of the simulations to denser networksdifficult, and such networks need further study. Although item non-response (miss-ing ties) is probably less common in network surveys than unit non-response (miss-ing actors), both types of missingness were studied. The missing data mechanismsincluded a random and two non-random mechanisms, which result in missingnessrelated to actor and network characteristics. Although the occurrence of these lattermechanisms in real data was not inspected, they seem plausible and serve to avoidbig simplifications by modelling all mechanisms as random.
The selected outcome measures are a sample of descriptive measures that sum-marize structural properties of the network and do not include measures of nodalproperties or specific ties. The effect of missing data and imputation on these lat-ter properties depend on the local neighborhoods of the specific ties, which are notstudied in this paper.
The imputation methods that were studied are simple methods which eitherfollow logically from the general classification given by Schafer and Graham (2002),or are proposed and/or used by others (Burt, 1987a, 1987b; Stork and Richards,1992; Gabbay and Zuckerman, 1998; Goldstein, 1999; Huisman and Steglich, 2008).Some of the methods needed slight (ad hoc) modifications in order to work in allsituations. These are the random imputation of values in the reconstruction methodwhen both ties in the dyad are missing, and imputing zeros in the hot deck methodwhen no donor actor is available. These situations occur when the proportionsmissing data are (unrealistically) high and are therefore expected not to distort theresults too much.
Effects of non-responseThe simulation study shows that ignoring missing data in networks can have largeeffects on descriptive analyses of social networks depending on the type of networkand type of non-response. Comparing directed and undirected graphs (Figures 1 and3), the direction of effects of non-response on the descriptive statistics are generallythe same. For undirected networks biases are larger for the degree-related statistics(mean degree, inverse geodesic), for directed networks the biases are somewhat largerfor reciprocity and clustering.
Comparing unit non-response (missing actors) and item non-response (missingties), the patterns are also generally the same, with item non-response resultingin slightly more bias. One exception is mean degree, which is more or less stablefor unit non-response, whereas item non-response results in lower degrees. Themissing data mechanisms have a somewhat smaller effect, where generally (one of)the non-random mechanisms results in the largest biases. Especially the degree-related missingness leads to large biases in estimating degree-related statistics.
23

The results found by Kossinets (2006) were similar for degree and assortativityin those situations where the definitions of the mechanisms agree. The effect onclustering and geodesic distance is different. The differences are mainly due todifferences in the networks used in the studies. In Kossinets’ study the networksare (very) large and have larger values for mean degree, clustering, assortativity,and mean path length. Moreover, the networks used by Kossinets are one-modeprojections of bipartite graphs.
Effects of imputationFor low to medium proportions missing data in undirected networks, imputation byreconstruction is quite capable of correcting the effects of non-response. Reconstruc-tion results in stable estimates of reciprocity (as expected), mean degrees (especiallyin case of item non-response), and inverse geodesic, up to 40% missing data. Alsothe results for assortativity are at least as good as ignoring the missing data. Onlyfor clustering the bias increases rapidly for higher proportions missing.
In directed networks, imputation by reconstruction does not correct the effectsof non-response as well as in undirected networks. Here the biases are usuallylarger than in the undirected networks, especially for the estimates of reciprocity.Generally, ignoring the missing data gives smaller biases, except for mean degree incase of item non-response.
For directed networks, generally reconstruction is the best of the studied impu-tation methods. This is confirmed by the two examples in the appendix. The othertwo procedures, preferential attachment and hot deck, generally result in more biasthan reconstruction. Imputation using preferential attachment was expected to pre-serve the degree distribution of the network. However, it cannot adequately correctfor biases, and does not give better results than reconstruction (except in a few caseswith high proportions missing, which are quite unrealistic). This results was alsofound by Huisman and Steglich (2008).
The performance of the hot deck procedure depends on the availability of donoractors and on the relation between the descriptive statistic (structural network prop-erty) and the matching variable. For medium and high proportions missing, hot deckbreaks down because no suitable donors can be found, especially in case of item non-response. For low proportions missing hot deck results in small biases for inversegeodesic and to a lesser extent mean degree.
The simulations show that for low proportions of missing data, generally the biasin the descriptive statistics is not very large. This suggests that simply ignoringthe missing data does not lead to seriously biased results in the studied descriptivestatistics. Moreover, the simple imputation procedures generally are not able tocorrect these biases, especially for medium to large amounts of missing data. Thiswas also shown in the examples in which more complex missingness mechanismswere presented.
Does this mean that the remark of Robins et al. (2004) that imputation is unlikelyto be very successful4, is true? Even for the simple methods used in this study, the
4The remark was made with respect to unit non-response, but the question can and should be
24

answer should be no, because the reconstruction method proposed by Stork andRichards (1992) can correct the effects of non-response in some situations.
In the simulations, reconstruction is the best simple imputation method. Forundirected networks and small amounts of missing data (20-30%), it gives betterresults than ignoring the missing data, regardless the missing data mechanism. Andeven for larger amounts of missing data (50%), reconstruction is the recommendedprocedure when calculating mean degree, reciprocity, and inverse geodesic.
In directed networks, the measures most affected by non-response are degreeand inverse geodesic. For these measures reconstruction gives good results when theproportion of missing data is low. For the other measures ignoring the missing datais better than imputation (using simple methods), and even gives good results forsmall amounts of missingness: reciprocity, transitivity, and assortativity are fairlystable up to 40% missing data.
It should be noted that for large amounts of missing data, the reconstructionmethod often fails, because both ties in a dyad are missing. In this situation, the tiesare randomly imputed, conditional on the observed density. This affects the struc-ture of the network as nodes are usually not randomly connected and it influencesclustering in the neighborhood of the new tie. Because the existing neighborhoodstructure is not well preserved, imputation methods that work at a global level arelikely to be weaker than intended.
This also holds for the other simple, ad hoc imputation methods studied inthe simulations, and generally they do not give good results. They distort datadistributions and structural properties, especially for larger amounts of missing data(cf. Schafer and Graham, 2002). The size and sparseness of the network may alsohave lessened the effectiveness of the imputations, because changing a small numberof ties can have a large impact on the overall structure of the network.
References
Barabasi, A-L. and Albert, R. (1999). Emergence of scaling in random networks. Science,286, 509–512.
Boer, P., Huisman, M., Snijders, T.A.B., Steglich, C.E.G., Wichers, L.H.Y., and Zeggelink,E.P.H. (2006). StOCNET: An open software system for the advanced statistical anal-ysis of social networks. Version 1.7. Groningen: ICS / SiencePlus.http://stat.gamma.rug.nl/stocnet/.
Borgatti, S.P. and Molina, J.L. (2003). Ethical and strategic issues in organizational socialnetwork analysis. Journal of Applied Behavioral Science, 39, 337–349.
Burt, R.S. (1987a). A note on missing network data in the general social survey. SocialNetworks, 9, 63–73.
Burt, R.S. (1987b). Social contagion and innovation: Cohesion versus structural equivalence.The American Journal of Sociology, 92, 1287–1335.
Butts, C.T. (2003). Network inference, error, and informant (in)accuracy: a Bayesian ap-proach. Social Networks, 25, 103–140.
Costenbader, E. and Valente, T.W. (2003). The stability of centrality measures when net-works are sampled. Social Networks, 25, 283–307.
generalized to all types of missing data.
25

Gabbay, S.M. and Zuckerman, E.W. (1998). Social capital and opportunity in corporateR&D: The contingent effect of contact density on mobility expectations. Social ScienceResearch, 27, 189–217.
Ghani, A.C., Donnelly, C.A. and Garnett, G.P. (1998). Sampling biases and missing data inexplorations of sexual partner networks for the spread of sexually transmitted diseases.Statistics in Medicine, 17, 2079–2097.
Gile, K. and Handcock, M.S. (2006). Model-based assessment of the impact of missing dataon inference for networks. CSSS Working paper no. 66, University of Washington,Seattle. (http://www.csss.washington.edu/Papers/wp66.pdf)
Goldstein, J.R. (1999). Kinship networks that cross racial lines: The exception or the rule?Demography, 36, 399–407.
Handcock, M.S. and Gile, K. (2007). Modeling social networks with sampled or missingdata. CSSS Working paper no. 75, University of Washington, Seattle.(http://www.csss.washington.edu/Papers/wp75.pdf)
Huisman, M. and Steglich, C.E.G. (2008). Treatment of non-response in longitudinal net-work studies. Social Networks, 30, 297–308.
Huisman, M. and van Duijn, M.A.J. (2005). Software for social network analysis. In Car-rington, P.J., Scott, J., and Wasserman, S. (Eds.), Models and Methods in SocialNetwork Analysis, pp. 270–316. Cambridge University Press, Cambridge.
Kossinets, G. (2006). Effects of missing data in social networks. Social Networks, 28, 247–268.
Koskinen, J. (2007). Fitting models to social networks with missing data. Paper presentedat Sunbelt XXVII, the International Sunbelt Social Network Conference, May 1–6,2007, Corfu, Greece.
Little, R.A.J. and Rubin, D.B. (1987). Statistical Analysis with Missing Data. New York:Wiley.
McKnight, P.E., McKnight, K.M., Sidani, S., and Figueredo, A.J. (2007). Missing Data. AGentle Introduction. New York: Guildford Press.
Newman, M.E.J. (2003). Mixing patterns in networks. Physical Review E, 67, 026126.Newman, M.E.J., Strogatz, S.H., and Watts, D.J. (2001). Random graphs with arbitrary
degree distributions and their applications. Physical Review E, 64, 026118.Pearson, M. and West, P. (2003). Drifting smoke rings: social network analysis and Markov
processes in a longitudinal study of friendship groups and risk-taking. Connections,25, 59–76.
Robins, G., Pattison, P., and Woolcock, J. (2004). Missing data in networks: exponentialrandom graph (p∗) models for networks with non-respondents. Social Networks, 26,257–283.
Rubin, D.B. (1976). Inference and missing data. Biometrika, 63, 581–592.Rubin, D.B. (1987). Multiple Imputation for Nonresponse in Surveys. New York: Wiley.Sande, I.G. (1982). Imputation in surveys: Coping with reality. The American Statistician,
36, 145–152.Schafer, J.L. and Graham, J.W. (2002). Missing data: our view of the state of the art.
Psychological Methods, 7, 147–177.Snijders, T.A.B. (2005). Models for longitudinal network data. In Carrington, P.J., Scott,
J., and Wasserman, S. (Eds.), Models and Methods in Social Network Analysis, pp.215–247. Cambridge University Press, Cambridge.
26

Steglich, C.E.G., Snijders, T.A.B., and West, P. (2006). Applying SIENA: An illustrativeanalysis of the co-evolution of adolescents’ friendship networks, taste in music, andalcohol consumption. Methodology, 2, 48–56.
Steinley, D. and Wasserman, S. (2006). Approximate distributions of several common graphstatistics: hypothesis testing applied to a terrorist network. Proceedings of the Amer-ican Statistical Association, Statistical Applications in Defense and National Security.Santa Monica, CA: Rand Corporation.
Stork, D. and Richards, W.D. (1992). Nonrespondents in communication network studies.Group & Organization Management, 17, 193–209.
Van de Bunt, G.G. (1999). Friends by choice. An actor-oriented statistical network modelfor friendship networks through time. Amsterdam: Thesis Publishers.
Ward, M.D., Hoff, P.D., and Lofdahl, C.L. (2003). Identifying international networks: La-tent spaces and imputation. In Breiger, R., Carley, k., and Pattison, P. (Eds.), Dy-namic Social Network Modelling and Analysis: Workshop Summary and Papers, pp.345–360. Washington: The National Academic Press.
Wasserman, S. and Faust, K. (1994). Social Network Analysis. Methods and applications.Cambridge: Cambridge University Press.
27

APPENDIX: Two examples
In this appendix two examples are presented to illustrate the effects of missing dataand the imputation methods presented in Section 3 when applied to more complexmissingness mechanisms. First, a mechanism is simulated that is a mix of themechanisms used in the simulation study. Next, an empirical mechanism is studiedby applying the imputation methods to empirical incomplete network data.
First example: Simulated mechanismThe first example uses the directed girls’ friendship data that were also used inthe simulations. Missing data were generated by combining different types of non-response and missingness mechanisms in the following (arbitrary) way: first delete5% of the actors at random (MCAR), next, delete about 25% of the actors propor-tional to outdegree, and finally, delete about 5% of the ties proportional to alcoholconsumption.
This process was repeated 100 times, resulting in an average fraction of missingties of 0.36 in the generated data sets. The proportion of missing data in thedata set is fairly high (although such numbers may be encountered in real data) inorder to clearly illustrate the impact of missing data and imputation. Each of theincomplete data sets was imputed with the four imputation procedures described inSection 3. The effects of missingness and imputation were inspected by calculatingthe mean degree, reciprocity transitivity, assortativity, and mean geodesic distance.The results are presented in Figure 7.
The boxplots in Figure 7 are consistent with the results of the simulation study inFigures 3 to 6. Degree-related measures are generally overestimated (mean degree,inverse geodesic), as is reciprocity in case of imputation by reconstruction, and theother statistics are underestimated. The strong dependence of missingness on degreeis reflected by almost all methods, especially the methods that preserve the degreedistribution (cf. the results of the simulation study). Ignoring the missing data (usingavailable cases only) gives good results, and gives in almost all situations betterresults than the imputation procedures. The effects on reciprocity and transitivityare large, especially for preferential attachment. This latter procedure, togetherwith hot deck, behaves poorly for all descriptives.
Second example: Empirical data setThe second example uses another friendship network that is distributed togetherwith the StOCNET software. It is the sixth observation of a network of 32 freshmenstudents at a university in the Netherlands (van de Bunt, 1999). The studied relationis defined as a friendly relation. Three actor attributes are available, of which oneis used: the length of the programme followed by the students (2, 3, 4 years).
Of the 32 actors in this observation of the network, 7 are completely missing (unitnon-response), and 3 actors have one additional missing tie (item non-response).This results in 220 missing ties, which is 22.2% of the ties. This amount of missingdata is not uncommon in empirical research, especially in longitudinal studies. Themissing ties were imputed using the four imputation procedures, and the effects ofimputation on the descriptive statistics are presented in Table 4.
28

Figure 7 : Box plots of the effects of missing data and imputation on the five networkstatistics mean degree, reciprocity, transitivity, assortativity, and mean geodesic distancein the example data. Within each plot the methods are: ignoring the missingness (MIS),reconstruction (RE), preferential attachment (PA), hot deck imputation (HD), and im-puting zeros (ZE).
The effects shown in Table 4 are in line with the results of the simulation study(cf. the effects in figures 3 to 6, for 20% unit non-response). The mean degree is largerfor the reconstruction and hot deck imputations, and is much smaller for imputingzeros. Reciprocity is largest for reconstruction, and small for the other imputationmethods. Transitivity is smaller for reconstruction and preferential attachment, butlarger for hot deck imputation (where the simulations in Section 4 show smallervalues). Assortativity is small for all methods, except reconstruction, and inversegeodesic distance is large.
Table 4 : Four network statistics, mean degree (D), reci-procity (R), transitivity (T), assortativity (A), and meaninverse geodesic distance (G) computed for the incompleteand imputed example data.
D R T A G
Incomplete 6.720 0.705 0.463 0.015 0.397Reconstruction 7.156 0.786 0.443 0.033 0.540Pref. attachment 6.469 0.483 0.396 0.004 0.529Hot deck 9.094 0.545 0.471 −0.056 0.541Imputing zeros 5.250 0.512 0.460 0.015 0.397
29