in mjm:¥s in - defense technical information center · i- 00 in co in < i o < i photograph...
TRANSCRIPT

I- ■
00 IN
CO in
< i
O <
i
PHOTOGRAPH THIS SHEET
LEVEL INVENTORY
^M». NKL-330JL
DOCUMENT IDENTIFICATION
MJm:¥S
DgmBimON STATEMEWT K
Appmd lot public ralMMf Dirtribotioa unlimited
DISTRIBUTION STATEMENT
ACCESSION FOR OTIS GRAftI
DTK TAB
UNANNOUNCED
JUSTIFICATION
^ D D
BY DISTRIBUTION / AVAILABILmf CODES DIST
fVi AVAIL AND/OR SPECIAL
& fc
DATE ACCESSIONED
DISTRIBUTION STAMP
UNANNOUNCED DATE RETURNED
04 08 3l 048 DATE RECEIVED IN DTIC REGISTERED OR CERTIFIED NO.
PHOTOGRAPH THIS SHEET AND RETURN TO DTICDDAC
m^^irmmrm DOCUMOfT PnOCDDfllHG GIICET MiMywwinaiw^Y PC I ICCr> I IMTII

C30
CO in
< i
Q
("■I .; i>;
14 # KPÖRf NO. #-3302 ^ ^ii
.■ ,••>< - ■
"■■■'■■ Jr /. , ■.-■..^.-N «
• . .r' ■■.-'.> . '. '' .
.^-. . ... .; • -.:■'-
THE EQUIVALENT STATIC ACCELERATIONS OF SHOCK MOTIONS ;
i; . S
*
■i7 ■'■' - ' ■'■•-" ' "Si
SPV! c»-
m DISTPIPirnCN STA
Appioved let p'.:''
NAVAL RESEARCH LABORATORY
WASHINGTON, D.C.

NRL REPORT NO. 0-3302
THE EQUIVALENT STATIC ACCELERATIONS OF SHOCK MOTIONS
J. P. Walsh and R. E. Blake
June 21, 1948
n VOR P^C BEI^E
Approved by:
Or. H. M. Trent, Head, Applied Mathematics Section Or. E. B. Stephenson, Superintendent, Mechanics Division
^sS<
NAVAL RESEARCH LABORATORY CAPTAIN H A SCHADE, USN DIRECTOR
WASHINGTON, O.C.

>
DISTRIBUTION
CNO » • Attn: Capt. G. W. Stott (2)
BuShips Attn: Capt. W. R. Millis '20)
BuOrd . Attn: Capt. K. H. Noble (20) * 9
BuAer Attn: CodeAer-24 (2) Attn: Code TD-4 (1)
BuDocks | • Attn: Capt. J. C. Gebhard, Des. Mgr. (2)
ONR Attn: Dr. R. M. Robertson (2) Attn: CodeN-482 (2)
CO, NOL, White Oak, Silver Spring, Md. > • Attn: Technical Director (4) Attn: Capt. J. Taylor, Aviation Ord. Group (4)
Medical OinC, NMRI Attn: Lt. Comdr. D. E. Goldman (1)
Dir., USNEL, San Diego (4) > •
CO, USNOTS, China Lake Attn: Reports Unit (2)
1 Dir., USNEES, Annapolis
Attn: Mr. G. Wohlberg
Supt., PGS, Annapolis Attn: Prof. G. H. Lee
(1)
(1)
} •
1
CO, U. S. Naval Shipyard, New York Attn: Comdr. H. B. Blackwood, Material Lab. (4)
• •
! ii 1 •
• • « * • m w m • •
DISTRIBUTION (Cont.)
CO, U. S. Naval Shipyard, Philadelphia Attn: Mr. Botta, Ship Design Section (2) Attn: Library, Code 263 (2)
CO, MAMC, Philadelphia Attn: Mr. D. E. Weiss, Aeronautical Material Lab. (2)
CO, NADS, Johnsville Attn: Mr. D. R. Wheeler (2)
OinC, USRL, Orlando Attn* Reports and Analysis Section (1)
Comdt., U. S. Marine Corps Headquarters, Wash., D. C. (2)
Dir., DTMB, Wash., D. C. Attn: Capt. R. A. Hinners (4)
Dir., NBS, Wash., D. C. Attns Dr. C. D. Ramberg (1)
CG, Aberdeen Proving Grounds, Md. Attn: Mr. C. W. Lampson, Ballistics Res. Labs. (2)
OCSigO Attni Ch. Eng. and Tech. Div., SIGTM-S (2)
CO, SCEL, Fort Monmouth (4) Attn: Mr. Frank K. Priebe Attn: Evans Signal Laboratory Attn: Coles Signal Laboratory Attn: Squier Signal Laboratory
CG, AMC, Wright-Patterson Air Force Base Attn: Chief Engineering Division (1) Attn: Chief Material Laboratory (1) Attn: Chief Electronics Subdivision, MCREEO-2 (1)
RDB Attn: Library (2) Attn: Navy Secretary (1)
Science and Technology Project Attn: Mr. J. H. Heald (2)
iii

CONTENTS
Abstract vi
Problem Status vi
Authorization vi
INTRODUCTION 1
RESPONSE OF SINGLE-DEGREE-OF-FREEDOM SYSTEMS TO SHOCK MOTIONS 1
THE DERIVATION OF SHOCK SPECTRA FROM REED-GAGE DATA 2
EXAMPLES OF SHOCK SPECTRA 3
SIGNIFICANCE OF SHOCK SPECTRA 4
NAVY SHOCK-MACHINE SPECTRA 5
SUMMARY 9
APPENDIX I - NOTES ON THE REED GAGE 10

ABSTRACT
The use of the reed gage as a method of determining important char-
acteristics of a shock motion is discussed. It is shown that the'shock
spectrum," derived from the reed-gage record, provides design condi-
tions for "shockproof" equipment in the form of equivalent static accel-
erations of the shock motion, and a rational method for comparing the
severity of different shock motions.
Shock spectra are presented for certain theoretical motions as well
as for the motions of Navy shock-testing machines. Differences between
jthe machines are pointed out and it is noted that the predominant charac-
teristic of the shock-machine motion is a sudden velocity change.
PROBLEM STATUS
This is an interim report on this problem^ work is continuing.
AUTHORIZATION
NRL Problem No. F 03-06 R.
vi

THE EQUIVALENT STATIC ACCELERATIONS OF SHOCK MOTIONS
INTRODUCTION
When contemplating the design of a structure which must be " shock-proof," the designer seeks design conditions which can be used to calculate the sizes of the members of the structure. Because ot training and past experience, it is likely that he will attempt to transform the dynamic inertia loads acting on the structure, into equivalent static loads - loads which, if apolied statically, will produce similar deflections, stresses, ana lailures. In the reports of investigations on laboratory shock machines and aboard ship, records of the acceleration imparted to various parts of these structures under shock conditions are found. In general, these records show that the acceleration reached peak values many times the acceleration due to gravity - in some cases thousands of times as much. Knowing that systems can not be designed to carry several thousand times their own weight, the designer chooses some arbitrary number (say 50, 100, or 150) and proceeds on the assumption that the equivalent static load acting on the structure is its static weight multiplied by this arbitrary number.
It is the purpose of this paper to point out: a) that the effect of a given shock motion is not the same for all structures, and b), that the load for which a structure should be designed depends not only upon the shock motion to which it is to be subjected, but also upon its natural frequencies; and to present data useful in the design of structures.
RESPONSE OF SINGLE-DEGREE-OF-FREEDOM SYSTEMS TO SHOCK MOTIONS
The concept of the response of a single-degree-of-freedom system to the shock motion under consideration is of fundamental importance. That this is true will be apparent later. A single-degree-of-freedom-system (Figure 1) is defined as a rigid mass (M) supported by a massless linear spring. The motion or response of the system can be completely de- scribed by the displacement of the mass in a direction parallel with the axis of the spring. A
X = x1-x 6 Fig. 1 - A single-degree-of-freedom system
NAVAL RESEARCH LABORATORY
single-degree-of-freedom system has one natural frequency. It is often described as a "simple system "and will be so designated in the remainder of this report. A necessary assumption throughout this report is that the motion (Xj) of the foundation is unaffected by the motion of the structure which it supports.
There are several methods of finding the response of a simple system (Figure 1) to shock excitations. If an analytic expression for the shock excitation is known, the response of the simple system can be obtained by Duhamel's integral.1 For each natural frequency assigned to the simple system, a response to the excitation can be computed.
When the excitation is given only in graphical form (an acceleration time curve taken aboard ship for example) there are two convenient methods of determining the response of simple systems to such excitations. The first is a graphical method of evaluating Duhamel's integral, described in detail in reference2. By this method, the maximum value of the acceleration of the mass (M) can be found for any natural frequency of the system when Xj, the acceleration of the base of the simple system, is given as a graphical record or an analytical expression which can be plotted.
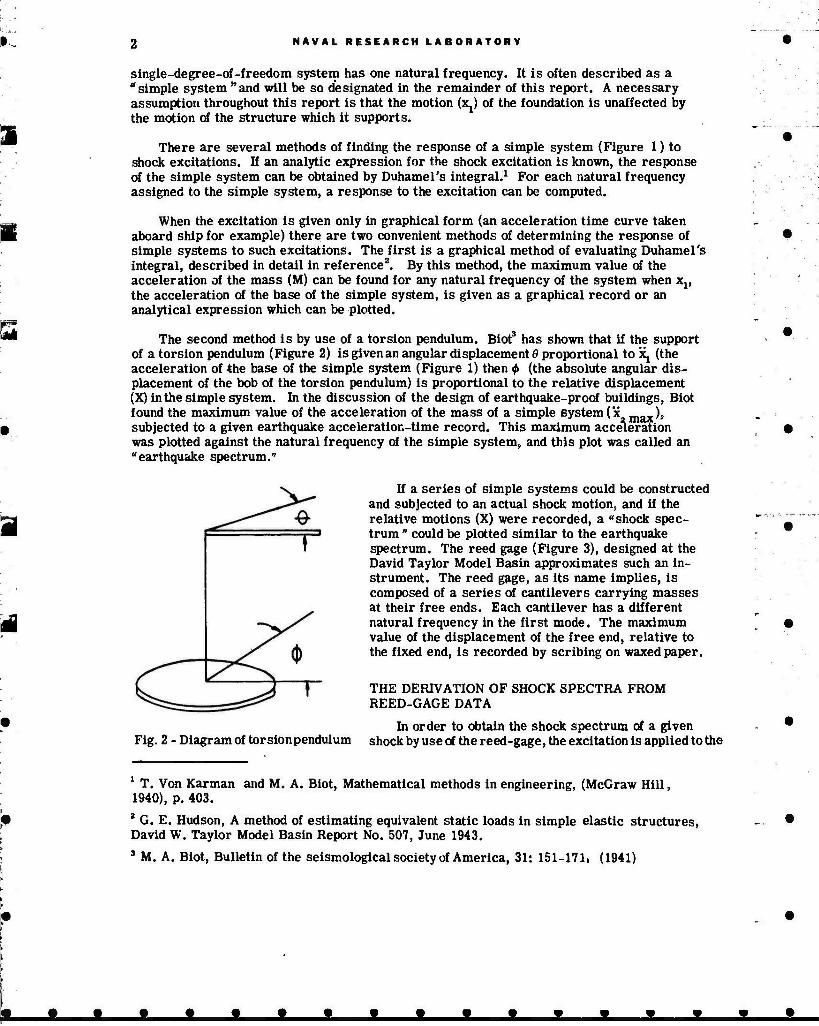
The second method is by use of a torsion pendulum. Blot* has shown that if the support of a torsion pendulum (Figure 2) is given an angular displacement d proportional to Xj (the acceleration of the base of the simple system (Figure 1) then <t> (the absolute angular dis- placement of the bob of the torsion pendulum) is proportional to the relative displacement (X) in the simple system. In the discussion of the design of earthquake-proof buildings. Blot found the maximum value of the acceleration of the mass of a simple system (x max)> subjected to a given earthquake acceleration-time record. This maximum acceleration was plotted against the natural frequency of the simple system, and this plot was called an "earthquake spectrum."
Fig. 2 - Diagram of torsion pendulum
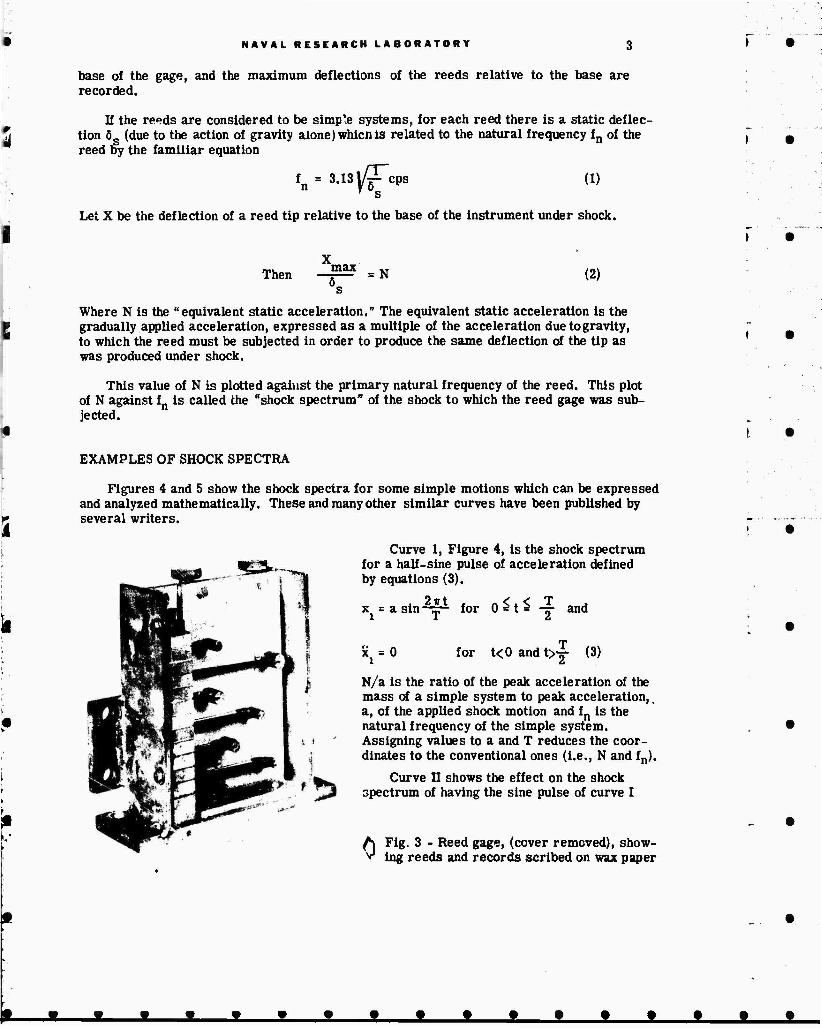
If a series of simple systems could be constructed and subjected to an actual shock motion, and if the relative motions (X) were recorded, a «shock spec- trum " could be plotted similar to the earthquake spectrum. The reed gage (Figure 3), designed at the David Taylor Model Basin approximates such an in- strument. The reed gage, as its name implies, is composed of a series of cantilevers carrying masses at their free ends. Each cantilever has a different natural frequency in the first mode. The maximum value of the displacement of the free end, relative to the fixed end, is recorded by scribing on waxed paper,
THE DERIVATION OF SHOCK SPECTRA FROM REED-GAGE DATA
In order to obtain the shock spectrum of a given shock by us e of the reed -gage, the excitation is applied to the
1 T. Von Karman and M. A. Blot, Mathematical methods in engineering, (McGraw Hill, 1940), p. 403.
2 G. E. Hudson, A method of estimating equivalent static loads in simple elastic structures, David W. Taylor Model Basin Report No. 507, June 1943. 3 M. A. Blot, Bulletin of the seismological society of America, 31: 151-171, (1941)
NAVAL RESEARCH LABORATORY 3
base of the gage, and the maximum deflections of the reeds relative to the base are recorded.
If the re«>ds are considered to be simp'e systems, for each reed there is a static deflec- tion ös (due to the action of gravity alone) whicnis related to the natural frequency fn of the reed by the familiar equation
f = 3.13 n l/fcps (1)
Let X be the deflection of a reed tip relative to the base of the instrument under shock.
Then max 5. = N (2)
Where N is the "equivalent static acceleration." The equivalent static acceleration is the gradually applied acceleration, expressed as a multiple of the acceleration due to gravity, to which the reed must be subjected in order to produce the same deflection of the tip as was produced under shock.
This value of N is plotted against the primary natural frequency of the reed. This plot of N against fn is called the "shock spectrum" of the shock to which the reed gage was sub- jected.
EXAMPLES OF SHOCK SPECTRA
Figures 4 and 5 show the shock spectra for some simple motions which can be expressed and analyzed mathematically. These and many other similar curves have been published by several writers.
«a- Curve 1, Figure 4, is the shock spectrum
for a half-sine pulse of acceleration defined by equations (3).
x = a sin 2Trt for
for
oS.S-I and
t<0 andt>Y (3)
N/a is the ratio of the peak acceleration of the mass of a simple system to peak acceleration, a, of the applied shock motion and fn is the natural frequency of the simple system. Assigning values to a and T reduces the coor- dinates to the conventional ones (i.e., N and fn).
Curve n shows the effect on the shock spectrum of having the sine pulse of curve I
Fig. 3 - Reed gage, (cover removed), show- ing reeds and records scribed on wax paper

NAVAL RESEARCH LABORATORY
si li.
i - * A -in
e « ft r^ n i -li W f u
+ f • | \ 4-1 \
\ *
\ r" 9C
Y -< ^ ==■*.
/ Y \ : __ = —.
J 1 V 1
1 i ».1 r «i IMAL FMO XI 1 MRUV
• IOMOI MILK
continue on as a damped transient vibration. This motion is defined by
xj = 0
and x = e -bt
for t<0
a sin(^ y) fort^O (4)
In the curve shown, b is appropriate for 0.5 percent of critical damping and the phase angle y is practically zero. This curve is very similar to a steady-state vibration trans- missibility curve.
Curve in is the shock spectrum for a "square"pulse of acceleration defined by
Xj = 0 for K0, t>|-
"^ = a for O^t^-y
and
(5)
Figure 5 is the shock spectrum for a step velocity change defined by
0 for t<0 and Fig. 4 - Shock spectra for
three simple shocks
n wtmti '"* *•»**
Fig. 5 - Shock spectra for velocity change
^ = V for t> 0 (6)
Various values of the velocity change (V) have been used to obtain the family of curves shown. The equation of this family of curves is given by
2v{ V , N= 2— ' , (7)
SIGNIFICANCE OF SHOCK SPECTRA
Shock spectra are important because they can be used to calculate whether or not a given shock will damage a specific strurture. In order to use the shock spectra in designing a structure, it is necessary to assume that the structure is elastic and linear up to the point of failure, and is subject to the same shock motion as the reed gage.
The kinds of damage to a structure which are predictable from the use of shock spectra are: the yielding of ductile materials, the fracture of brittle mate- rials, and the collision of adjacent parts through elastic distortion of their supports. Types of failure not pre- dictable from shock spectra include: breaking of a friction bond, as in the loosening of screws or opening of knife switches; spilling of liquids; fracture of ductile materials; and collision of unsecured parts.
When a structure can be assumed to be a simple system (i. e., a single degree of freedom system) and

NAVAL RESEARCH LABORATORY 5
the shock spectrum is available, it is an easy matter to calculate its natural frequency and to determine the stress and deflection which will be caused by the shock. Tlds calculation is simple because the shock spectrum gives the equivalent static acceleratipn from which the equivalent static load may be computed. Since static stress is proportional to static load, the shock spectrum enables one to predict stress, and hence damage. > *
Similar calculations of stress and deflection are possible for a multi-degree-of-freedom structure if the flexible members of the structure are linear and elastic. The method of calculation is given in reference (4) and will be discussed in detail in a future report. The important parts of the method are the following: First, it is necessary to find the shapes of the modes of vibration of the structuce, and ihejiatural frequencies associated with them. r .-.- < The amplitude of each mode excited by a shock motion is proportional to the number of g ■ in the shock spectrum corresponding to the natural frequency of the mode. Since each moae is analogous to a simple system, the total stress and deflection of the structure can be found by superposing the response of the various modes.
The shock spectrum is an excellent index of the damaging capacity of a shock, for if the vulnerability of a structure to two different shock motions is under consideration, the | • spectrum with the greater value at the natural frequency of the structure is the one which will produce the greater stress or likelihood of damage. The shock spectrum is also an excellent index of the relative protective abilities of two or more shock mounts. One shock mount is considered the best of a lot in the performance of its protective function, if the motion of a mass mounted on it has, during shock, a lower shock spectrum than that of any of the others.
I • The shock spectrum presents a shock motion in a graphical form which can be easily
understood. Onthe other hand, by looking at the velocity-meter records. Figures 11 and 12, one can see that the motion at the center of the 4A plate is different from that at the edge; but it is not apparent what the effect of this difference will be upon structures to be tested. The shock spectra Figures 6 through 10 show the significance of this difference, which will be discussed in the following section.
-H
NAVY SHOCK-MACHINE SPECTRA
i •
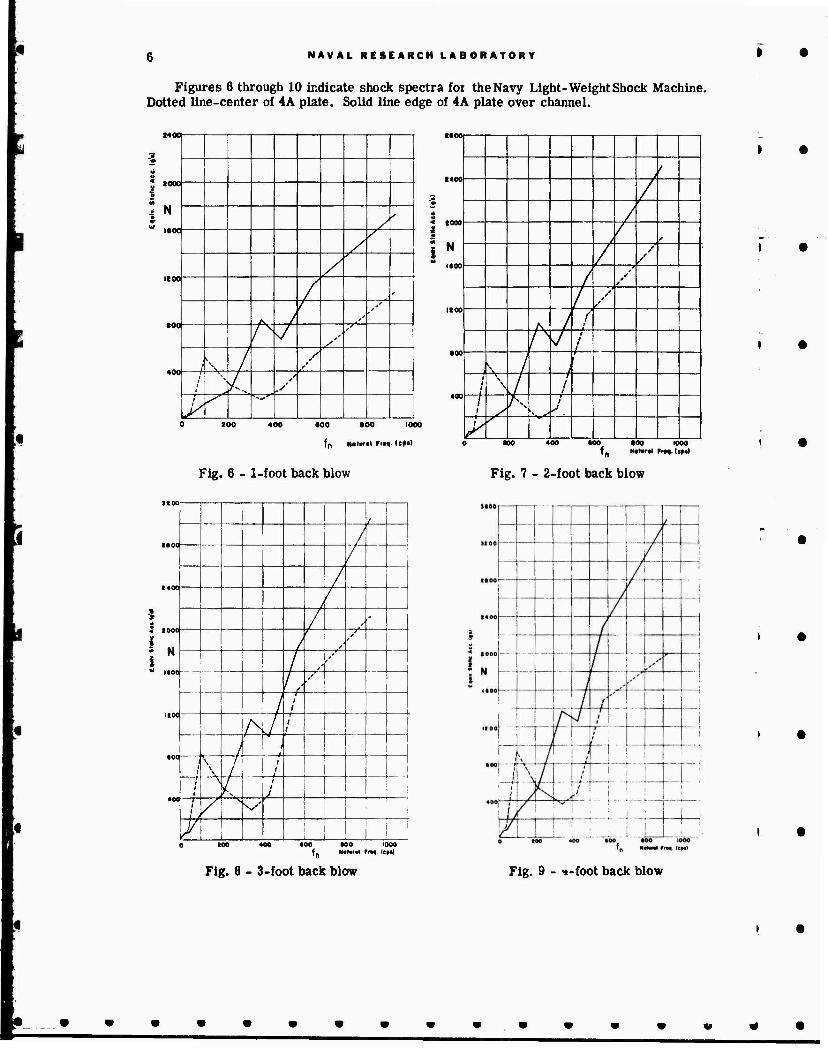
Reed-gage records were obtained on the Navy Light-Weight Shock Machine, prior to its modification in 1947 ? by mounting the gage on the 4A plate and subjecting the anvil plate to 1ft, 2 ft, 3 ft, 4 ft, and 5 ft back blows. The shock spectra obtained of the motion of the center of the 4A plate are shown as dotted lines in Figures 6 through 10. The reed gage [ • was also placed at the edge of the 4A plate directly over the channel support of the 4A plate. The shock spectra of the motion at this location are shown in Figures 6 through 10 as solid lines. These spectra were obtained by connecting the observed points with straight lines. The motion at the two locations on the 4A plate as recorded by a British type velocity meter are shown in Figures 11 and 12. Peaks occurring in the shock spectra are due to near- resonance of particular reeds with transient vibrations of the anvil and 4 A plate. The width m and height of these peaks are not well defined because of the small number of reeds used. Since the frequency of the transient vibration probably did not coincide with any reed fre- quency, the true peaks are probably higher than shown and resemble, in shape, the peak of Figure 4, curve ü.
Reed-gage records obtained on the Navy Medium-Weight Shock Machine are shown in Figures 13 through 15 The important features of the motion of the anvil plate of this machine L •
M. A. Blot, Natl. Acad. Sei. (U.S.) 19: 262-66 (1933)
6 NAVAL RESEARCH LABORATORY
Figures 6 through 10 indicate shock spectra foi the Navy Light-Weight Shock Machine. Dotted line-center of 4A plate. Solid line edge of 4A plate over channel.
WOO
9
'.
3
i N ft /
s
/ /
A / / r
A / f
s
y
h J s
\ i / *
i L y y
200 400 •00 100 1000
fn Niturol F»q. (eft)
ttoo
t*oo J f
r /
1 J / /
tN 8
..00 / i /
/ / *
/ /
K j ( $ |
y i * t
\ j \ * i
I r j i \
/ /
/ s i
s y.
y s
too «00 fn N««ral Fn«. (»Ml
Fig. 6 - 1-foot back blow Fig. 7 - 2-foot back blow
\
uoo / /
/
/ /
1 / , ' 1
1« 1
} f
s *
/ s
—■-
/ / 1
1 hi /
j i
i 1
\ \ \ 1
1 1
1 i
*00
I f
\ I 1 I j
i f A \S 1 ' .
; 1 , 1 IO0 «00 100 000 1000
Fig. 8 - 3-foot back blow Fig. 9 - i-foot back blow

NAVAL RESEARCH LABORATORY
1 ■ i !
! 1 ;/| ^ i ^ 1/ -J i ■ ■ i \ :/ i
\ ! ^ / 1 j
/ i
< BO00 ■ " * -■
I H ' -i . :
j -t-
/ r !
i i
r~ 7 /
j r J
i
! 1
1 i a oo;
i ! /i i
K J i r i —
400--^v-/^ h A v | |
in i
Fig. 10 - 5-foot back blow
are two successive velocity changes - one due to the impact of the hammer, the second to the impact of the anvil plate against rigid stops. The effect of tue second impact (velocity change) upon the reeds (already vibrat- ing from the first impact) depends upon the phase of the reeds at the moment of the second impact. The ampli- tudes of some reeds are increased by the second velocity change while those of other reeds may be unaffected or decreased; hence the record shows some deviations from the straight-line characteristic of an instantaneous ve- locity change.
A comparison of Figure 5 with the shock spectra of the shock machines shows that the predominate charac- teristic of the shock-machine motion is an instantaneous velocity change. These records demonstrate that design- ing for some fixed value of g without regard for the natural frequency of the structure being designed is not correct and cannot be justified. When it is desired to reduce the description of a shock machine motion to a simple equivalent, this can be done with less error by finding the velocity change the spectrum of which lies just over the shock spectrum.
The spectra of the motion of the center of the 4A plate on the Navy Light-Weight Shock Machine shows clearly an important characteristic of the motion at this point—the relatively high aequivalent-static-accelerations "to which the 100 cps systems are subjected. This high acceleration is a result of the transient
[^•dTCB OF 4A P. ATE
Miiin.auilHUtitilU
&" lACK BLOW
Kt-'fipn iiinwtMTii*
', '.■/
imiuiituKitUuitiuMHbUiUiiiu RACiC * - ■*
J 9 * ■:« I . 0 •
Fig. 11 - Velocity - time record of motion of center of 4A plate Navy Light-Weight Shock Machine
• •

VlLOC.TV NCTC« »r tD3E Of **■ -iJiT-l
C* BACH »tO«
l«CK BLOW
3 HACK -.,. .:■-■
5" PACK BL 0 » .r .a ^r .'.«.«.« -a
TrMr Ih'fflVJiL BETWEEN TPACF IN'EHh
Fig. 12 - Velocity - time record of motion of 4A plate over supporting channel Navy Light-Weight Shock Machine
1 8 A
HI KOO
f \ \
/ "v
\ I
IIOO /
/ i
,r— J / /
40C / y 1
/ i : IM * M) t * ihm! f
10 66
1
I too /-.
A N s /
■v
X /
/
A V /
/ '
/
/
100 400 «00. •00 1000 Html fr., IOMI
Fig. 13 - ühock spectra of the motion of the Fig. 14 - Shock spectra of the motion of the Medium-Weight Shock Machine, 3-inch table Medium-Weight Shock Machine, 3-inch table travel, 1-foot hammer crop, 500-pound load travel, 2-foot hammer drop, 500-pound load on table on table
NAVAL RESEARCH LABORATORY 9
/
ssoo /!
1 / \ d
* 8 400 £ S at
/:
:/i i \ 1 1 1
N 1 \
i / j 1
1
i, i A i \ \ \ \
/ \ J 1 . j 1 / V !
/ /
i i 1
/ 1 1
/
/ ; :
• 00 1000
NOlUrdl rr»q tcp»)
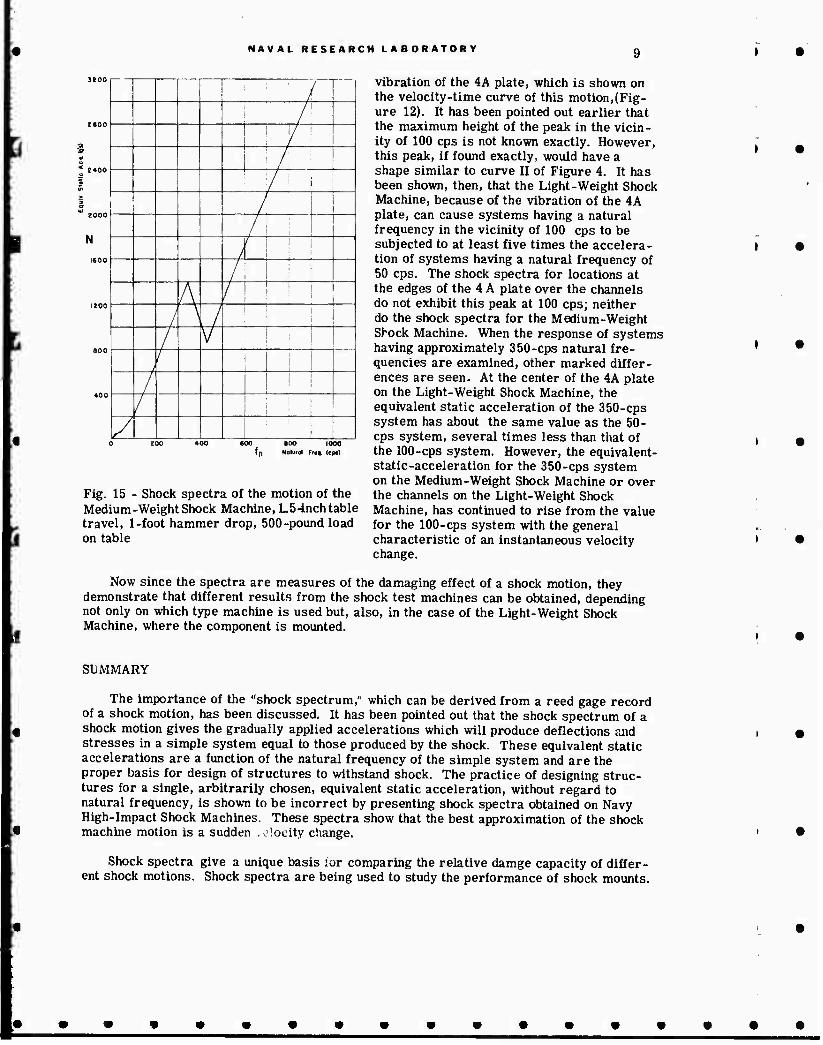
Fig. 15 - Shock spectra of the motion of the Medium-Weight Shock Machine, L54nch table travel, 1-foot hammer drop, 500-pound load on table
vibration of the 4A plate, which is shown on the velocity-time curve of this motion,(Fig- ure 12). It has been pointed out earlier that the maximum height of the peak in the vicin- ity of 100 cps is not known exactly. However, this peak, if found exactly, would have a shape similar to curve II of Figure 4. It has been shown, then, that the Light-Weight Shock Machine, because of the vibration of the 4A plate, can cause systems having a natural frequency in the vicinity of 100 cps to be subjected to at least five times the accelera- tion of systems having a natural frequency of 50 cps. The shock spectra for locations at the edges of the 4 A plate over the channels do not exhibit this peak at 100 cps; neither do the shock spectra for the Medium-Weight Shock Machine. When the response of systems having approximately 350-cps natural fre- quencies are examined, other marked differ- ences are seen. At the center of the 4A plate on the Light-Weight Shock Machine, the equivalent static acceleration of the 350-cps system has about the same value as the 50- cps system, several times less than that of the 100-cps system. However, the equivalent- static-acceleration for the 350-cps system on the Medium-Weight Shock Machine or over the channels on the Light-Weight Shock Machine, has continued to rise from the value for the 100-cps system with the general characteristic of an instantaneous velocity change.
•
•
) •
•
Now since the spectra are measures of the damaging effect of a shock motion, they demonstrate that different results from the shock test machines can be obtained, depending not only on which type machine is used but, also, in the case of the Light-Weight Shock Machine, where the component is mounted.
•
SUMMARY
The importance of the "shock spectrum," which can be derived from a reed gage record of a shock motion, has been discussed. It has been pointed out that the shock spectrum of a shock motion gives the gradually applied accelerations which will produce deflections and stresses in a simple system equal to those produced by the shock. These equivalent static accelerations are a function of the natural frequency of the simple system and are the proper basis for design of structures to withstand shock. The practice of designing struc- tures for a single, arbitrarily chosen, equivalent static acceleration, without regard to natural frequency, is shown to be incorrect by presenting shock spectra obtained on Navy High-Impact Shock Machines. These spectra show that the best approximation of the shock machine motion is a sudden ,e!ocity change.
Shock spectra give a unique basis ior comparing the relative damge capacity of differ- ent shock motions. Shock spectra are being used to study the performance of shock mounts.
•
•

10 NAVAL RESEARCH LABORATORY * *
Comparison of the shock-machine spectra shows that the damage capacity of the two types of Navy Shock Machines differ and that in the case of the Light-Weight Shock Machine signifi- cantly different spectra are obtained for different locations on the test-specimen mounting fixture.
APPENDIX I
NOTES ON THE REED GAGE ■ •
The present reed gage (Figure 3) diverges from the theoretical ideal in several respects. Corrections can be made for some deviations on a theoretical basis, but other errors are inherent in the instrument. The following observations are the result of experience in using and applying the reed gage.
1. The accuracy with which a deflection can be measured is not satisfactory for the high frequency reeds. It is believed from experience, that reed deflections cannot be meas- ured closer than 0.01 inches. This can amount to an error of the following number of ~g" depending upon the frequency.
Reed Natural Frequency Error (in g 's)
20 .40 40 1.39
100 8.82 210 37.70 345 120 430 185 570 316
These errors are due largely to the use of rounded point styli on waxed paper to record ■ * deflections. The line scribed is broad and poorly defined. Suggested improvements have not yet obtained the desired simplicity, freedom from friction drag, and ability to operate during shock. There is also an error because the scribed deilection mark is an arc rather than a straight line. This is not important, since it predominates in the low frequency reeds and is a small error in terms of equivalent static acceleration. Deflection is customarily measured as the perpendicular distance from the end of the arc to the zero-deflection line. » 9 Occasionally, shifting of the recording paper, when it is removed from under the reeds after a shock, makes the zero position of the reeds difficult to locate.
2. The mass of an actual reed is distributed rather than concentrated at the tip. The proper point at which to measure the deflection is not thecenter of the weight at thetip of the reed, but some effective center of mass. It is possible to find the ratio of the deflection of a reed at the point measured, to the deflection which a simple system of the same frequency k 9 would undergo.5 The following table gives numbers, corresponding to standard reeds of the gage, which should be multiplied by the measured reed deflections to find the deflections which a simple system would have recorded.
9 E. Z. Stowell, et al. Bending and shear stresses developed by the instantaneous arrest of the root of a cantilever"beam with a mass at its tip. NACA MR No. 14K30
I •
I •
» •
• •

NAVAL RESEARCH LABORATORY H ► •
Reed Frequency Correction Factor 20 .97 40 -845
100 .860 210 .93 345 .98 430 .97 570 .945
I •
The above effect of distributed mass is quite different from the effect of higher modes of vibration of the reeds. The deflection of the reed tip due to the second and higher modes is, except in rare cases of resonance, a negligibly small fraction of the tip deflection due to the first mode.
I •
3. Friction of the scribers on the waxed paper causes damping of the reeds. This is certainly not the same amount and type of damping to be found in the practical structures which the reed gage is supposed to represent, though it would be difficult to specify an ideal damping characteristic. Examination of the transient, traced upon a special moving paper, as a result of a velocity-change shock shows the damping to be coulomb (rubbing) > • friction. The decrement of amplitude per cycle was uniform regardless of amplitude and is tabulated in the following table.
Reed Decrement Per Decrement Per Frequency (cps) Cycle (inches) Cycle (g)
20 .132 5.28 40 .115 16.0
100 .014 12.4 210 .004 15.1
For shocks which will build up the simple system amplitude by resonance, damping will cause a large error. Except in such cases, the error is negligible. In the case of resonant T "'"Z build-up of vibration, it is not yet clear whether or not a simple undamped system represents " - - ■ an actual structure any better than the friction-damped reed. If a practical structure is to fail by successive increases in its amplitude of motion because of resonance with a transient vibration in the shock motion, it must, on some cycle, pass from wholly elastic deformation into a slight plastic deformation. This orovides a considerable increase in the damping and may thus prevent the deformation from exceeding an acceptable value. Further investigation of this important question is required. \ m
4. The number of reeds which can be accommodated in the reed gage frame is too small to define satisfactorily a shock spectrum. The present gage is already too large for some applications. The difficulty is largely inherent in the nature of the gage since a large space is required for motions of the low- frequency reeds. Shorter low-frequency reeds would be more non-linear than the present reeds since their deflection would be a larger fraction of their length, and since lighter reeds are affected more by scriber friction. Perhaps the solution lies In having several reed gage designs - each for a special type of application.
•
* * *
L _ •
niKC 7»ai » i« 4i 1BO
• •

-C OO Q
> ->-<
iß es
C- " O C O) 0) CD •
3 (H
o *
m o c c o
o _ N
h eg
ass 05 ü e 3
■ « lS
t» B'•S>',
o 2 it 'S « *
2 E £ c 0» _ -" c
'S S E 2 S h g a .
m 3 5 c o
fli ^ J- Jä m So»«
3 ü
Li
1 £ « s O ä| B en S"3«, a> Oi U Q-
A .<H ■a Hcs- a T3
^ §
^ 9 i<5^ ■gmS »£ a . SPÄ o c c ö S § o m -
Q u _ « h .. j: .Sf u > u ra 3 S S SIM 3 ■ n
2 o-o u a,
Sill
9 o
10 <D W
I
o IS
||||3
SE§2^ J="3 • *" 3 is 8 In . B * . a
Z :
♦' B B u S1
|S8i£
to ^ * ^ s =« aj •" u cfl
i U
§-a in Q
£ 00 Q
"^I ^ H« ^ ^ rT 3 -H
*£§ M O C -4-1 O rt 3 u
II ..^ a
M U JG O
«-c i, E; I IM V>
e.2_ hrt ^ Wl
—1 A Su . n
« C 3
2 " B
|^ 3 S . ■s « S 0 > "3 2 »a . w « . a « Hi W a
1 -o 2 rt
rt u, "" o -c **-< 1 u u o s »of g* C 110 £ T3
V O 0)
aJ c c -3
•o <u E f 0 .^ s. 5 'n 's * £■0 « § § aß'S .a rt 3 g c o «i S 2 s
^g-l E S
h o 1, 9
w a; bo en Ü
o
• • • •
• •
I • • • •
fa
« --^ o <«
is >• 8 Sa
3 I!
o • n
Is i ä
«H « <" 0 tJ u _ a>
l-'S- bO
^ 2 c S3 5 |J5 I
c a> 6 v fa 3 01 " ri
E«
o « tß CQ
\ • • • • •
L , • • • . • •
'.•*-..'«i'Si-4 .
!•••••
d ni
tn f10
> T3
«2S S^S
»E§2-5>
— 0! m O «
fa 0 ~ O 0) m M m 3 5 ?} u a> rt
^ S = !3
.c
3
0
ui 01
u o I
• •••••
• • • •
L • • • • •
E
o « co CQ
• • . 1 •