in this issue equities 5 fixed income 7 quarterly market
TRANSCRIPT

IN THIS ISSUE
SPOTLIGHT 2 ECONOMY 3
EQUITIES 5FIXED INCOME 7
OUTLOOK 9DISCLOSURES 12
QUARTERLY MARKET INSIGHTS 3RD QUARTER 2021

SPOTLIGHT
page 2 CENTURY TRUST | Quarterly Market Insights
THE U.S. DEBT CEILINGPresident Biden is expected to sign into law a temporary $480 billion increase to the federal debt ceiling that will enable the government to pay its bills, but only until December 3. This troubling deadline might seem rather bizarre given the size, dynamism and reserve currency status of the American economy. And yet, every several years or so, political brinkmanship in Washington surrounding the federal debt ceiling seems to take the world’s largest economy to the edge of a hypothetical sovereign default. Thankfully, the worst-case scenario has never materialized, as squabbling political parties have always found an eleventh-hour solution to raise the debt limit and avert disaster. Most legislators, officials, journalists and investors expect another last-minute deal ahead of the December 3 deadline. Failure to compromise would result in American policymakers causing one of the most painful self-inflicted wounds in modern history. In broad terms, the situation has little to do with imminent solvency concerns, but rather with a fiscal constraint U.S. Congress has placed on itself for more than one hundred years.
The debt ceiling is a legal limit the U.S. Congress sets on the amount of money the Treasury Department can borrow. This limit does not sanction any new spending. Rather, it simply allows the federal government to pay for spending Congress has already approved. The debt ceiling originated in 1917, when Congress granted Treasury more flexibility to borrow in order to support America’s entry into World War I. Prior to 1917, Congress typically authorized borrowing on a program-specific basis, like the U.S. phase of Panama Canal construction from 1904 through 1914. According to Treasury Department records, Congress has raised or extended our nation’s debt ceiling limit 78 times since 1960, or an average of once every nine months. The debt ceiling has been raised 49 times under a Republican president and 29 times under a Democratic president. Other developed nations have similar types of fiscal rules designed to serve as guardrails against excessive spending. Germany caps its structural deficit each year at 0.35% of GDP, while the current Conservative government in Britain aims to match its outlays and revenues over a three-year horizon.
In the U.S., the debt-to-GDP ratio has climbed from about 35% in 2000 to near 100% today. As political partisanship
has escalated in recent decades along with the nation’s debt load, the debt ceiling has increasingly become a political weapon wielded by both Republicans and Democrats. Typically, the party out of power attempts to use the debt ceiling to win concessions from the party in control. For example, over the course of 2011, congressional Republicans demanded deficit reduction in exchange for an increase in the debt ceiling. With the August 2, 2011 deadline looming, the S&P 500 Index plunged 17.2% from July 7 through August 8. Standard & Poor’s downgraded the credit rating of U.S. sovereign debt from AAA to AA+ on August 5. Somewhat counterintuitively, yields on the 10-year U.S. Treasury note fell sharply from 3.18% on July 1 to a then all-time low of 1.72% on September 22. Investors raced to the perceived safety of U.S. Treasury debt even though a major source of their fears at the time was the potential financial chaos unleashed by a sovereign default. The Budget Control Act of 2011, signed into law on August 2 of that year, increased the debt ceiling from $14.294 trillion to $16.394 trillion by January 2012. This was the last time Congress actively increased the debt limit. Since then, lawmakers have passed temporary suspensions of the debt ceiling. They reset the debt limit to the current amount of debt when these suspensions end. During the Trump Administration, the debt ceiling was suspended three times; the most recent suspension ended on July 31, 2021. Over the last ten weeks, the Treasury Department has been maintaining debt levels using “extraordinary measures” to borrow funds without “breaching” the new debt ceiling of $28.401 trillion.
INVESTMENT CONCLUSIONSMost political commentators believe Democratic leadership will begrudgingly insert a debt ceiling increase in their sprawling reconciliation bill. This would bypass the need for Republican votes in the Senate on a standalone bill to increase the debt limit. Up until now, most Democrats have rejected this option because it would complicate the already herculean task of passing a bipartisan infrastructure bill and a multi-trillion dollar reconciliation package with a razor-thin congressional majority. In a realistic worst-case scenario, in which the possibility of default exists up until the final minutes before the deadline, investors can probably expect markets to take a similar trajectory to the late summer of 2011. This would most likely entail an acute, but short-lived correction in equity indexes, a spike in one-month U.S. Treasury yields, a sharp decline in long-term U.S. Treasury yields and strength in the U.S. dollar.

ECONOMY
ECONOMIC INDICATORS LATEST 3MO PRIOR CHANGE*REAL GDP (QoQ ANNUALIZED) 6.7% 6.3% ▲
TRADE BALANCE -73.3 -68.5 ▼
UNEMPLOYMENT RATE 4.8% 5.9% ▲
NON-FARM PAYROLLS 194K 962K ▼
ISM MANUFACTURING 61.1 60.6 ▲
ISM NON-MANUFACTURING 61.9 60.1 ▲
RETAIL SALES (LESS AUTOS) 2.0% -0.7% ▲
INDUSTRIAL PRODUCTION 0.4% 0.6% ▼
HOUSING STARTS 1615M 1594M ▲
CONSUMER PRICE INDEX (YoY) 5.3% 5.0% ▼
CONSUMER CONFIDENCE 109.3 128.9 ▼
EXISTING HOME SALES 5.88M 5.78M ▲
CONSUMER CREDIT 14.37B 35.38B ▼
CRUDE OIL PRICE $ 75.03 $ 73.47 ▼
CENTURY TRUST | Quarterly Market Insights page 3
Source: Bloomberg. Data as of 9/30/21. Past performance does not guarantee future results. *The change arrow is indicative of a positive or negative change in the economic nature of the data series. For example, a downward-pointing change arrow assigned to the crude oil price field will correspond with an increase in the actual price of crude oil over the last three months. This is because a short-term increase in the price of crude oil has historically been detrimental to aggregate U.S. consumer spending.
GROWTH WITH SOME BAGGAGE The U.S. economy posted another quarter of above-trend growth for the three months ending June 30. This fell short of expectations, however, as the COVID-19 Delta variant continued to disrupt both the supply and demand sides of the economy. Annualized second quarter GDP growth of 6.7% was above pre-pandemic levels, but missed the median estimate of 8.4% from a Bloomberg survey of economists. As is often the case, consumers did much of the heavy lifting, as personal consumption expenditures rose 12.0% during the period after increasing 11.4% in the previous quarter. Consumer expenditures made up roughly 69% of GDP in the quarter. Growth for the remainder of 2021 will likely be slower than the first two quarters as higher prices in many parts of the economy and the more contagious Delta variant could cause hesitancy in consumer activity. Nevertheless, growth expectations for the second half of 2021 remain healthy compared to the pre-pandemic era. According to Bloomberg, U.S. GDP is estimated to grow at annualized rates of 5.0% and 5.1% in the third and fourth quarters, respectively.
In September, the Federal Reserve lowered its full-year growth outlook due to the resurgence of COVID-19. This did not seem to sway policymakers from their plans to gradually remove accommodations, however, as minutes from the September Federal Open Market Committee (FOMC) meeting indicated tapering of monthly bond purchases may be likely later this year if progress toward maximum employment continues. Notably, Fed Chairman Jerome Powell stated that tapering bond purchases and raising the federal funds rate hold distinctly different criteria. The former is likely to begin this year following the November FOMC meeting and end sometime in the middle of
2022. Many market observers believe the culmination of tapering will set the stage for the Fed to start discussing lifting the federal funds rate from its current range of 0.00% to 0.25%. The Core Consumption Expenditures (PCE) index, which excludes food and energy costs, and is also the Fed’s preferred measure of inflation, rose 3.6% in August from a year prior. Although this was the highest reading since May of 1991, most Fed policymakers believe the sharp increase in price levels seen in 2021 will subside once supply chain disruptions are resolved.

ECONOMY CONTINUED
CHART 1
PEAK ACCOMMODATION IS APPROACHING
page 4 CENTURY TRUST | Quarterly Market Insights
Source: Bloomberg. Data as of 9/30/21. Past performance does not guarantee future results.
The Conference Board’s Consumer Confidence Index fell in September, following declines in both July and August. The Index now stands at 109.3, down from a pandemic-era high of 128.9 in June. The average reading over the 18 months since the onset of the pandemic is 102.4. Concerns about the Delta variant and the state of the economy deepened, while the spending outlook for homes, autos, and major appliances all retreated. Short-term inflation concerns expressed by consumers eased, but remain elevated.
EMPLOYMENT AND MANUFACTURINGAccording to the Labor Department, 1,875,000 jobs were added to domestic payrolls in the third quarter. The September nonfarm payrolls report showed that the headline unemployment rate dipped to 5.1% from 5.9% three months ago. Meanwhile, the closely watched labor force participation rate among Americans aged 15 to 64 held steady at 61.7%. This level is considerably higher than the recent low of 60.2% in March 2020, but remains frustratingly below the monthly average of 63.3% over the ten-year period spanning 2010 through 2019. With pandemic-era enhanced federal unemployment benefit programs ending, many economists expect an uptick in the number of Americans reentering the labor force in coming quarters. According to the Institute for Supply Management (ISM), manufacturing sector activity accelerated in September from August, even as production continues to be limited by global supply chain issues. The latest Manufacturing ISM Report on Business shows the Purchasing Managers’ Index (PMI) rose 1.2 percentage points to 61.1% in September, from August, and the overall economy expanded for the 16th consecutive month. A PMI reading above 50% indicates the manufacturing sector is expanding.
HOUSINGSales of new U.S. single family homes increased for a second straight month in August, but demand for housing has possibly peaked after a COVID-19 fueled
buying spree. The report from the Commerce Department also showed the supply of new homes on the market last month was the largest in nearly 13 years, with prices unchanged on a monthly basis. New home sales rose 1.5% to a seasonally adjusted annual rate of 740,000 units in August and July's sales pace was revised up to 729,000 units from the previously reported 708,000 units. Existing home sales dropped 2.0% to a seasonally adjusted annual rate of 5.88 million units in August. Home resales, which account for the bulk of U.S. home sales, fell 1.5% on a year-on-year basis. The annual comparison was distorted by the pandemic-driven surge in sales in August 2020. Sales are up 16% so far this year compared to the same period in 2020 and remain well above their pre-pandemic level.
0.0%
1.0%
2.0%
3.0%
4.0%
5.0%
6.0%
$0$1$2$3$4$5$6$7$8$9
FEDERAL RESERVE BALANCE SHEET IN $TRILLIONS (L)
FEDERAL FUNDS RATE UPPER BOUND (R)

EQUITY
CHART 2
S&P 500 VALUE INDEX LESS S&P 500 GROWTH INDEX
CENTURY TRUST | Quarterly Market Insights page 5
Source: Morningstar. Data as of 9/30/21. Past performance does not guarantee future results. Indices are unmanaged, may not include reinvestment of income or short positions and do not incur management fees. An investor is unable to invest directly in an index.
FLAT QUARTER AMID MOUNTING CONCERNSThe third quarter was a mixed picture for U.S. equities. The ongoing economic and corporate earnings recovery enabled domestic equities to exhibit resilience through periodic bouts of volatility in July and August. Yet, late in the quarter positive sentiment ultimately succumbed to investors’ mounting concerns surrounding inflation and Federal Reserve policy. Domestic stocks held up in the first two months of the quarter despite percolating investor anxiety over a resurgence in COVID-19 cases in some developed countries and slowing global economic growth momentum. The S&P 500’s seven-month run of positive monthly returns, its longest streak since January 2018, came to an end in September after rising bond yields spurred a stock market sell-off late in the month. The 10-year U.S. Treasury yield moved above 1.5% for the first time since June following the Federal Reserve’s late September meeting. The Fed signaled its asset purchase tapering could begin before year-end and interest rate increases could happen sooner than expected. Despite the S&P 500’s 4.65% loss in September, the index still managed to eke out a 0.58% gain for the quarter.
Signs of slowing economic activity and lower bond yields amid a resurgence of COVID-19 driven by the Delta variant led many investors to return to the 2020 playbook of favoring growth and large capitalization stocks in July and August. The growth-oriented technology and communications sectors were among the S&P 500’s top performing sectors in the first two months of the quarter, but lagged in September as the reflationary trade was revived after a summer hiatus. In September, rising bond yields and declining U.S. COVID-19 cases led to a reflationary rotation back toward more economically sensitive areas of the equity market including cyclical, value, and smaller capitalization stocks.
The cyclically oriented industrials and materials sectors were notably absent from the reflationary rotation
and were among the worst performing S&P 500 sectors in September and in the third quarter. The woes of these two groups were partly due to slowing construction and manufacturing activity in recent months. Signs of improving loan demand and a steepening yield curve propelled the financials sector to a 2.74% quarterly return, the best S&P 500 sector performance. Energy was the only S&P 500 sector with a positive return in September (+9.44%), but still fell 1.66% in the quarter. The COVID-19 Delta variant resurfaced concerns about the pandemic’s impact on oil demand which contributed to energy stocks finally cooling off in July following the sector’s 45.64% gain in the first half of the year. The price of West Texas Intermediate (WTI) crude oil
-1.07%
5.92%
3.62%
-3.14%
3.31%
-6.85%
-3.00%-2.46%
2.50%
-8.00%
-6.00%
-4.00%
-2.00%
0.00%
2.00%
4.00%
6.00%
8.00%
EQUITY CONTINUED
page 6 CENTURY TRUST | Quarterly Market Insights
resumed an upward trajectory in September to near a multi-year high after Hurricane Ida disrupted oil production in the Gulf of Mexico.
Foreign equity performance was also weak in the quarter with the MSCI EAFE index losing 0.35%. Emerging markets were a notable laggard. The MSCI China index’s 18.13% quarterly loss dragged the MSCI Emerging Market index down 7.97% in the quarter. Chinese stocks contended with a bombardment of negative news throughout the quarter, including the government’s regulatory tightening and potential default of a large domestic property developer. China’s increased regulatory pressure on the private tutoring and internet industries unnerved investors due to the regulations’ potential to impair earnings growth and profitability of the targeted companies. Shares of after-school education firm TAL Education plummeted 80.82% in the quarter. Shares of internet giants Tencent and Alibaba, which account for almost a quarter of the MSCI China index, fell 20.62% and 34.72% in the quarter, respectively. Some economists and global asset managers believe these regulations will only impact a limited number of industries since they are driven more by China’s long-term goal to achieve more balanced growth and better social equality rather than by a broad attack on the private sector. Sentiment for Chinese stocks worsened near quarter-end amid concerns the heavily indebted property developer, Evergrande Group, would not be able to meet its $300 billion of outstanding debt obligations owed to more than 100 banks and over another 100 non-bank entities. Many economists believe Evergrande seems to be heading for an orderly default and will likely avoid a worst-case scenario of producing a systemic shockwave given the Chinese government exerts a large degree of control over banks and other financial institutions.
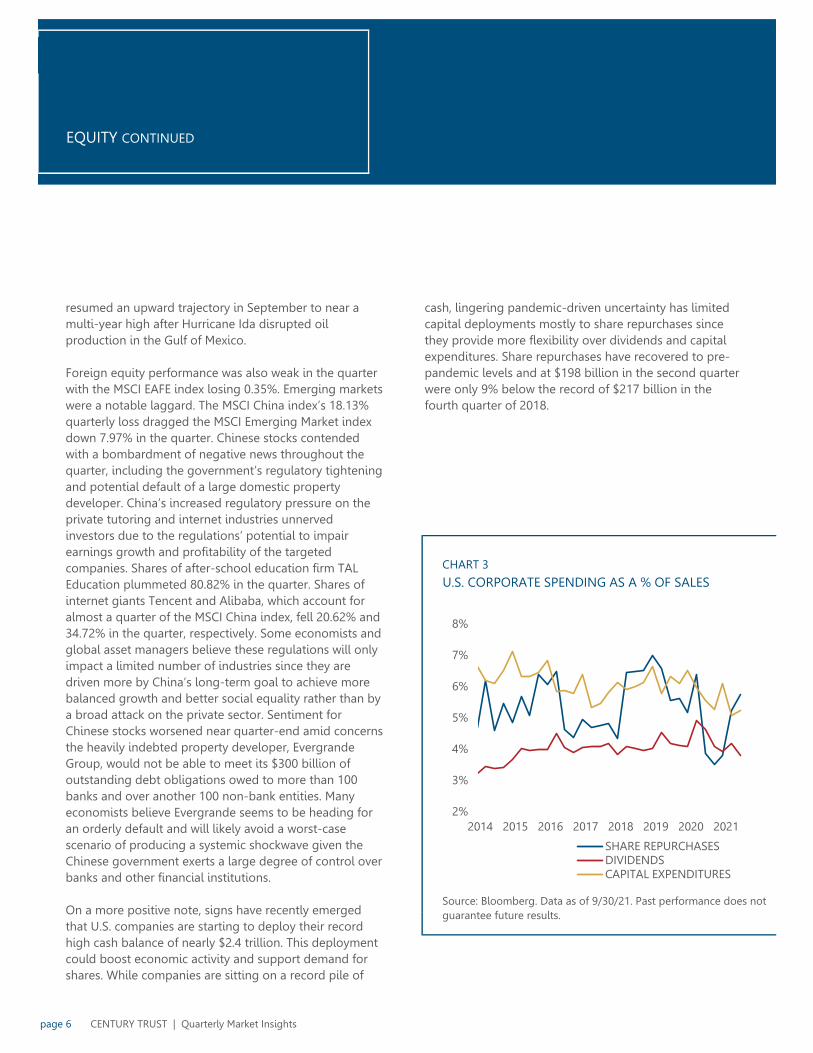
On a more positive note, signs have recently emerged that U.S. companies are starting to deploy their record high cash balance of nearly $2.4 trillion. This deployment could boost economic activity and support demand for shares. While companies are sitting on a record pile of
cash, lingering pandemic-driven uncertainty has limited capital deployments mostly to share repurchases since they provide more flexibility over dividends and capital expenditures. Share repurchases have recovered to pre-pandemic levels and at $198 billion in the second quarter were only 9% below the record of $217 billion in the fourth quarter of 2018.
Source: Bloomberg. Data as of 9/30/21. Past performance does not guarantee future results.
U.S. CORPORATE SPENDING AS A % OF SALESCHART 3
2%
3%
4%
5%
6%
7%
8%
2014 2015 2016 2017 2018 2019 2020 2021
SHARE REPURCHASESDIVIDENDSCAPITAL EXPENDITURES
FIXED INCOME
CENTURY TRUST | Quarterly Market Insights page 7
Source: Bloomberg. Data as of 9/30/21. Past performance does not guarantee future results.
possibility of an initial rate hike in the second half of 2022. If the labor market recovery continues into 2022, Federal Reserve officials will need to provide a more detailed definition of “maximum employment.” Market participants will increasingly wonder whether the unemployment rate of 3.5% and labor force participation rate of 63.3% that existed in February 2020 will satisfy policymakers’ conditions for hiking interest rates. Given our expectation that any labor market tightness will be revealed through significant upward wage pressures, realized consumer inflation and inflation expectations in 2022 will likely play an even more crucial role in determining the Fed’s path toward lift-off. In the FOMC’s September Fed Funds Rate Projections, 9 of the 18 participants expect at least one
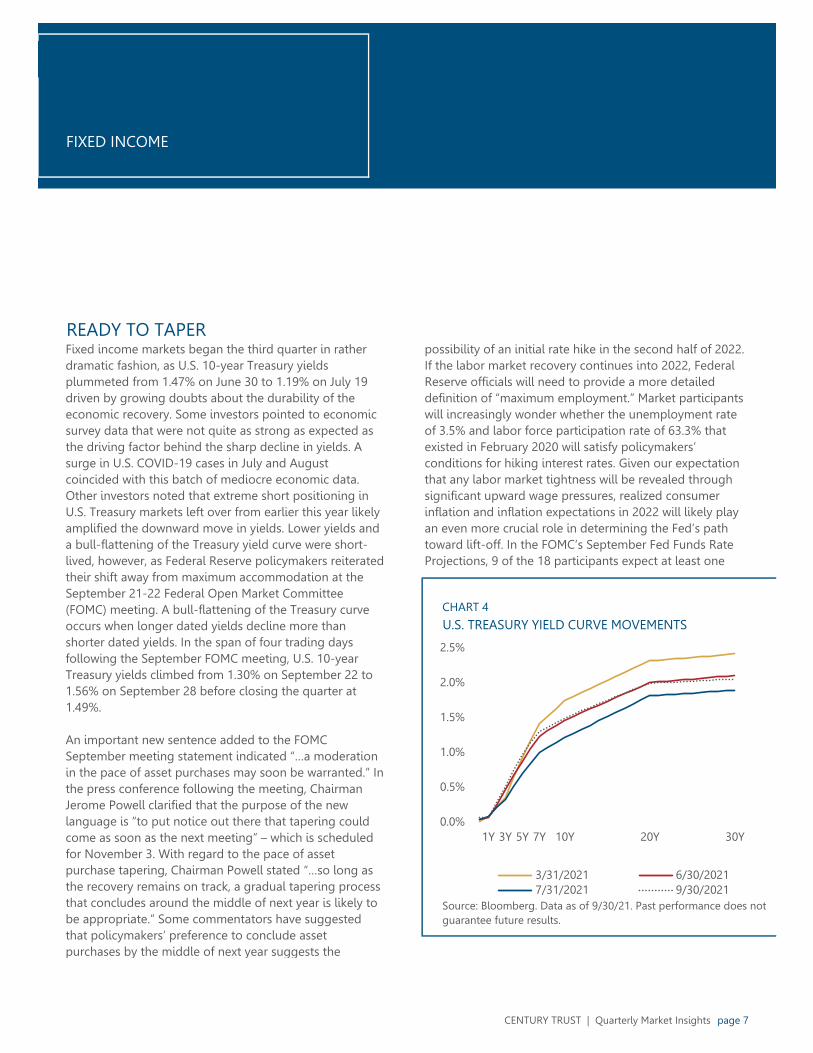
Fixed income markets began the third quarter in rather dramatic fashion, as U.S. 10-year Treasury yields plummeted from 1.47% on June 30 to 1.19% on July 19 driven by growing doubts about the durability of the economic recovery. Some investors pointed to economic survey data that were not quite as strong as expected as the driving factor behind the sharp decline in yields. A surge in U.S. COVID-19 cases in July and August coincided with this batch of mediocre economic data. Other investors noted that extreme short positioning in U.S. Treasury markets left over from earlier this year likely amplified the downward move in yields. Lower yields and a bull-flattening of the Treasury yield curve were short-lived, however, as Federal Reserve policymakers reiterated their shift away from maximum accommodation at the September 21-22 Federal Open Market Committee (FOMC) meeting. A bull-flattening of the Treasury curve occurs when longer dated yields decline more than shorter dated yields. In the span of four trading days following the September FOMC meeting, U.S. 10-year Treasury yields climbed from 1.30% on September 22 to 1.56% on September 28 before closing the quarter at 1.49%.
An important new sentence added to the FOMC September meeting statement indicated “…a moderation in the pace of asset purchases may soon be warranted.” In the press conference following the meeting, Chairman Jerome Powell clarified that the purpose of the new language is “to put notice out there that tapering could come as soon as the next meeting” – which is scheduled for November 3. With regard to the pace of asset purchase tapering, Chairman Powell stated “…so long as the recovery remains on track, a gradual tapering process that concludes around the middle of next year is likely to be appropriate.” Some commentators have suggested that policymakers’ preference to conclude asset purchases by the middle of next year suggests the
READY TO TAPER
U.S. TREASURY YIELD CURVE MOVEMENTSCHART 4
0.0%
0.5%
1.0%
1.5%
2.0%
2.5%
1Y 3Y 5Y 7Y 10Y 20Y 30Y
3/31/2021 6/30/20217/31/2021 9/30/2021

FIXED INCOME CONTINUED
U.S. ECONOMIC SURPRISES AND YIELDS
page 8 CENTURY TRUST | Quarterly Market Insights
Source: Bloomberg. Data as of 9/30/21. Past performance does not guarantee future results. The Citi U.S. Economic Surprise Index measures data surprises relative to market expectations. A positive (negative) reading means that data releases have been stronger (weaker) than expected.
Over the next six to twelve months, we believe fixed income portfolios will benefit from duration exposure moderately below benchmark, as the Federal Reserve embarks upon winding down emergency-era asset purchases. A modest allocation to Treasury Inflation-Protected Securities (TIPS) should help protect fixed income portfolios against potential upside inflation surprises. Despite tight credit spreads, we think the favorable economic backdrop and a general coupon advantage warrants an overweight allocation to corporate credit including U.S. high yield and preferred stocks, if suitable for client portfolios.
0.25% rate increase by the end of 2022 and 8 expect an initial rate hike by the end of 2023.
During the quarter, the Bloomberg Barclays U.S. Treasury Index eked out a return of 0.09%, which can be decomposed into 0.39% of coupon income and a 0.30% price decline. The Bloomberg Barclays Corporate Bond Index, which measures the investment grade, fixed rate corporate bond market generated a total return of 0.00% in the quarter, as a 0.80% price decline fully offset 0.80% of coupon income. The environment for below investment grade corporate credit remained mostly supportive. The Bloomberg Corporate High Yield Index posted a quarterly return of 0.89%, as 1.34% of coupon income absorbed a 0.45% price decline. The credit spread on the Bloomberg Barclays U.S. Corporate High Yield Bond Index widened from 2.28% on June 30 to 2.56% on September 30. This marked the first quarter high yield bond spreads widened since the first quarter of 2020. Speculative grade bond spreads remain low, however, compared to an average of 3.98% in 2019 and 5.26% in 2020.
In tax-exempt municipal markets, heavy reinvestment demand and mutual fund inflows have easily absorbed lower-than-usual new issuance over the last six months. Bloomberg analysts estimated that from June through August, the amount of proceeds received by bondholders from principal and interest payments on municipal bonds outstripped new issuance by approximately $60 billion. Secondary market municipal bond spreads continued to tighten in the third quarter amid this supply-demand imbalance. The ratio of municipal yields to U.S. Treasury yields, a measure of relative value, currently sits at near historic lows. An increase in new issuance in coming months in an environment where municipalities are likely to benefit from above-trend economic growth and a large-scale fiscal stimulus should create a favorable backdrop for municipal investors over the next several quarters.
CHART 5
0.8%
1.0%
1.2%
1.4%
1.6%
1.8%
2.0%
-80
-60
-40
-20
0
20
40
60
80
100
JAN-21 MAR-21 MAY-21 JUL-21 SEP-21
CITI U.S. ECONOMIC SURPRISE INDEX (L)U.S. 10-YEAR TREASURY YIELD (R)

OUTLOOK
CHART 6
COVID-19 CASES AND CONSUMER SENTIMENT
CENTURY TRUST | Quarterly Market Insights page 9
Source: Johns Hopkins University. Bloomberg. Data as of 9/30/21. Past performance does not guarantee future results.
THE DELTA AND DEBT CEILING SPEEDBUMPS
to delay return-to-office plans. According to data from the Centers for Disease Control (CDC), the rolling seven-day average of daily new cases appeared to peak at near 165,000 in the first week of September. Encouragingly, case counts declined over the ensuing five weeks, as vaccination rates ticked up in hard-hit states and the Delta variant began to show signs of waning. According to CDC data, 65.3% of all Americans and 78.2% of the adult population have received at least one dose of a COVID-19 vaccine as of October 8. Although herd immunity in the U.S. may be permanently out of reach, slowly advancing vaccination rates and more efficient anti-viral treatments should create a scenario in which the spread of COVID-19 becomes more manageable and a broad-based economic reopening can resume heading into 2022.
In the prior quarter’s Outlook section, we considered whether recent domestic inflationary pressures and the U.S. Federal Reserve’s timeline for policy normalization would result in a sharp deceleration of economic growth expectations. Elevated inflation has no doubt created challenges for a growing number of businesses and consumers. Yet, supply chain pressures in certain sectors have begun to ease, and a majority of data is showing signs that a period of runaway inflation analogous to the 1970s is unlikely. Meanwhile, Federal Reserve Chairman Jerome Powell has emphasized that “tapering is not tightening” and policymakers seem far from implementing policy that would purposefully restrict economic growth. While we acknowledge so-called “peak growth” may have occurred in the second quarter, this is only part of the story.
In our view, the combination of healthy consumer balance sheets and a Federal Reserve unlikely to prematurely slam the brakes on the recovery should enable the U.S. economy to grow at an above-trend rate through 2022. Moreover, while significant dislocations exist in the U.S. labor market, the existence of nearly 11 million unfilled positions hardly paints a grim picture for American workers (see Chart 7). We believe this backdrop should continue to remain broadly favorable for risk assets including global equities and corporate credit relative to U.S. Treasury bonds and cash. This baseline outlook remains in place despite a resurgence of COVID-19 cases in the third quarter and uncertainty surrounding the U.S. debt ceiling (see Spotlight section). These risks were among the primary culprits behind a late summer unease which sent the S&P 500 down 4.7% in September and drove yields on U.S. 10-year Treasury notes below 1.20% in the first week of August.
As covered in the Economy section and seen in Chart 6, rising COVID-19 cases along with higher prices for housing, gasoline and groceries depressed consumer sentiment in the third quarter. Driven by the highly transmissible Delta variant, COVID-19 cases and hospitalizations surged in many parts of the U.S. in July and August. This led some local authorities to reimpose social distancing measures and many U.S. companies
68
72
76
80
84
88
0
50,000
100,000
150,000
200,000
250,000
300,000
U.S. DAILY COVID-19 CASES: 7-DAY AVG. (L)UNIV. OF MICHIGAN CONSUMER SENTIMENT (R)

OUTLOOK CONTINUED
page 10 CENTURY TRUST | Quarterly Market Insights
Source: Bloomberg. Data as of 9/30/21. Past performance does not guarantee future results.
As the Delta variant peaked, investors expressed growing concern that U.S. Congress would fail to raise the federal debt ceiling by October 18, the date when the U.S. government would run out of money. In theory, this would cause a sovereign default and potentially calamitous outcomes for both the economy and markets. Although Democrats have the ability to raise the debt limit without Republican votes through the budget reconciliation process, many refused to consider that option because they said it would distract from their efforts to pass a sweeping multi-trillion dollar spending package and a bipartisan infrastructure deal. Ultimately, the squabbling sides agreed to kick the can down the road when Democrats accepted an offer from Senate Minority Leader Mitch McConnell to temporarily raise the debt ceiling until December 3. Investors should probably expect another bout of political brinkmanship and short-lived market volatility before a last-minute agreement to avert disaster ahead of the new debt ceiling deadline.
We recommend investors remain overweight global equities relative to cash and U.S. Treasury bonds based on our view that the Delta variant and the debt ceiling drama will prove to be speedbumps in a delayed economic reopening. We expect to see further progress in the ongoing labor market recovery and an increased desire from American households to spend their excess savings built up over the last 18 months on a more balanced mix of goods and services.
As investors attempt to interpret shifting inflation expectations in coming quarters, we expect companies that provide a combination of cyclical exposure and quality characteristics to increasingly provide equity market leadership. In our view, a further back-up in U.S. Treasury yields should not cause an acute problem for the broad domestic equity market as long as the speed of such an upward move is not extreme. In fixed income
allocations, we continue to suggest that investors minimize allocations to long-dated U.S. Treasuries. We recommend maintaining exposure to satellite fixed income segments, including domestic high yield bonds and preferred stocks, which stand to benefit from a generally healthy backdrop for corporate profits.
HELP WANTED: JOB OPENINGS SURGECHART 7
0
5,000,000
10,000,000
15,000,000
20,000,000
25,000,000
2000 2004 2008 2012 2016 2020
U.S. JOB OPENINGS U.S. TOTAL UNEMPLOYED

ECONOMIC OUTLOOK AND INVESTMENT POLICY
ECONOMIC FACTORS CURRENT OUTLOOK
U.S. GDP Growth The median estimate for real U.S. GDP growth in 2022 from a recent Bloomberg survey of economists dipped to 4.1% from 4.3% in August.
Federal Funds Rate According to Fed Funds Futures data, market participants are pricing in a 50% chance of an initial quarter-point Fed rate hike by the late July 2022 FOMC meeting.
Inflation Expectations for average annual inflation over the next five years derived from U.S. TIPS breakevens wavered in the range of 2.40% to 2.60% in the third quarter.
Employment Despite weak nonfarm payrolls in August and September, a record net 32% of U.S. small business owners reported plans to fill open positions in coming months.
Consumer Confidence Various measures of U.S. consumer sentiment have showed reduced optimism in recent months amid elevated inflation and a late summer resurgence in COVID-19 cases.
Oil OPEC and its allies' agreement on a modest increase in crude oil production might not be enough to relieve low global inventories over the next several months.
Housing Limited supply of existing homes, elevated prices and construction sector labor shortages are likely to dilute housing market demand in coming quarters.
International Economies The median projections for 2022 GDP growth in the euro zone, China and Japan, based on recent Bloomberg surveys of economists, are 4.3%, 5.5% and 2.5%, respectively.
MINIMUM NEUTRAL MAXIMUM
FIXED INCOME = CURRENT OUTLOOK
Core Bonds =
TIPS =
Non-Investment Grade =
International =
MINIMUM NEUTRAL MAXIMUM
EQUITIES = CURRENT OUTLOOK
Large Cap =
Mid Cap =
Small Cap =
Developed International =
Emerging Markets =
MINIMUM NEUTRAL MAXIMUM
ALTERNATIVES* = CURRENT OUTLOOK
CAP PRES IWSG BAL GWSI GROWTH
Global Real Estate
Global Infrastructure
Gold = = =
Hedged Equity = = = = =
Arbitrage = = =
page 11CENTURY TRUST | Quarterly Market Insights
We believe an underweight to fixed income in multi-asset class portfolios remains appropriate based on our expectations for above-trend economic growth and gradually higher interest rates in coming quarters. The total return prospects of U.S. Treasury bonds are likely to be capped by a Federal Reserve that has signaled its intention to begin winding down emergency-era asset purchases and the potential for elevated inflation to persist longer than consensus expectations. Within core segments of fixed income allocations, a moderate duration underweight relative to benchmark should benefit portfolios in the fourth quarter and first half of 2022. Although they are not a perfect inflation hedge, we believe an allocation to Treasury Inflation-Protected Securities (TIPS) should continue to help dampen the volatility of fixed income allocations. Outside of core, investment-grade fixed income segments, we believe high yield bonds and preferred stocks will continue to benefit from a coupon advantage and a generally benign credit environment.
The material is prepared and distributed solely for information purposes and is not a solicitation or an offer to buy any security or instrument or to participate in any trading strategy. The information presented has been obtained with care from sources believed to be reliable, but is not guaranteed. Opinions herein are not statements of facts and may include “forward-looking statements” which may or may not be accurate over the long term. Report includes candid statements and observations regarding investment strategies, asset allocation, individual securities, and economic and market conditions. Statements, opinions, or forecasts are not guaranteed and are as of this date appearing only. Do not place undue reliance on forward-looking statements. Client accounts may not reflect the opinions expressed herein. Investing involves risk, and may result in loss. This information is subject to change at any time, based on market and other conditions. Past performance is not indicative of future results, which may vary.
The above minimum/neutral/maximum recommendations represent MainStreet Advisors' current positions relative to our Strategic Asset Allocation ranges. Views expressed have a 6-12 month horizon and are those of the MSA Investment Committee.*Cap Pres: Capital Preservation, IWSG: Income with some growth, Bal: Balanced, GWSI: Growth with some income
We believe an allocation to alternative asset classes and strategies can be an effective portfolio diversification tool in an environment characterized by elevated policy uncertainty and a low risk-free rate. Within an alternatives allocation, we believe an allocation to gold should help most client portfolios better navigate coming quarters. This is largely based on our observation of gold's tendency to behave as a safe-haven asset in periods of market stress and the potential for it to benefit from U.S. dollar weakness and negative real (inflation-adjusted) interest rates. Our diversified alternatives portfolios, as seen in the table to the left, are designed to decrease the overall risk profile of our five investment objective-based portfolios (CAP PRES, IWSG, BAL, GWSI, and GROWTH).
We recommend maintaining an overweight to equities relative to bonds and cash despite recent growth slowdown concerns and uncertainty surrounding the durability of recent inflationary pressures. Encouragingly, the Delta variant surge in COVID-19 cases probably peaked in early September and U.S. consumer balance sheets remain quite healthy. As such, we expect the labor market recovery will regain speed after a summer pause. Meanwhile, most U.S. corporations continue to successfully navigate the pandemic era from a balance sheet and profitability perspective. In aggregrate, U.S. stocks are set to generate strong profit growth for the remainder of 2021 and into 2022. Within equity allocations, we continue to recommend an overweight to GDP-sensitive areas of the market including domestic mid cap and small cap. These areas are more closely tied to the business cycle and should experience a disproportionately stronger boost to revenues and earnings heading into 2022. Key risks to our view that we will be monitoring include a sharp acceleration in wage gains and potential spillover from distress in certain areas of Chinese debt markets.

NOT A NOT FDIC MAY LOSE NOT BANK DEPOSIT INSURED VALUE GUARANTEED
NOT INSURED BY ANY FEDERAL GOVERNMENT AGENCY
IMPORTANT DISCLOSURE INFORMATION
This Quarterly Market Insights was prepared by MainStreet Investment Advisors, LLC ("MainStreet Advisors"), an investment adviser registered with the SEC and wholly-owned subsidiary of Fifth Third Bank, National Association. Registration as an investment adviser does not imply any level of skill or training. The MainStreet Advisors’ professionals may provide oral or written market commentary or advisory strategies to clients that reflect opinions that are contrary to the opinions expressed herein or the opinions expressed in research reports issued by MainStreet Advisors’ Investment Committee and may make investment decisions that are inconsistent with the views expressed herein. Opinions expressed are only our current opinions or our opinions on the posting date. We and our affiliates, officers, directors, and employees may from time to time have long or short positions in, and buy or sell the securities, if any, referred to in this report. Information and opinions herein are as of the publication date and are subject to change without notice based on market and other conditions. Sources used: Bloomberg, BCA Research, Morningstar, Johns Hopkins University.
The material herein was prepared from sources believed to be reliable, however, no assurances can be made. The prices shown are as of the close of business as indicated in this document. Actual results could differ materially from those described. The securities and financial instruments described in this document may not be suitable for you, and not all strategies are appropriate at all times. The specific securities identified are shown for illustrative purposes only and should not be considered a recommendation by MainStreet Advisors. It should not be assumed that investments in these securities were or will be profitable. Index performance used throughout this report is intended to illustrate historical market trends and is provided solely as representative of the general market performance for the same period of time. Indexes are unmanaged, may not include the reinvestment of income or short positions, and do not incur investment management fees. An investor is unable to invest in an index. Any graph, data, or information is considered reliably sourced and for educational purposes only, but no representation is made that it is accurate or complete and should not be relied upon as such or used to predict security prices or market levels. Any suggestion of cause and effect or of the predictability of economic or investment cycles is unintentional.
There are substantial risks involved with investing in Alternative Investments. Alternative Investments represent speculative investments and involve a high degree of risk. An investor could lose all or a substantial portion of his/her investment. Investors must have the financial ability, sophistication/experience and willingness to bear the risks of an investment in an Alternative Investment. Traditional and Efficient Portfolio Statistics include various indexes that are unmanaged and are a common measure of performance of their respective asset classes.
This Quarterly Market Insights may contain forward-looking statements which may or may not be accurate over the long term. These forward-looking statements are identified as any statement that does not relate strictly to historical or current facts. In particular, statements, express or implied, concerning future actions, conditions or events, future operating results or the ability to generate revenues, income or cash flow or to make distributions or pay dividends are forward-looking statements. Do not place undue reliance on forward-looking statements; actual results could differ materially from those described and are not guarantees of performance. They involve risks, uncertainties and assumptions. This report may include candid statements and observations regarding investment strategies, asset allocation, individual securities, and economic and market conditions; however, there is no guarantee that the statements, opinions, or forecasts will prove to be correct.
The material included herein was prepared or is distributed solely for information purposes; is not a solicitation or an offer to buy/sell any security or instrument, to participate in any trading strategy or to offer advisory services by MainStreet Advisors; is not intended to be used as a general guide to investing or as a source of any specific investment recommendations; makes no implied or express recommendations concerning the manner in which any client’s account should or would be handled; and should not be relied on for accounting, tax or legal advice. Appropriate investment strategies depend upon the client’s investment objectives. The portfolio risk management process and the process of building efficient portfolios includes an effort to monitor and manage risk but should not be confused with or does not imply low or no risk. This report should only be considered as a tool in any investment decision matrix and should not be used by itself to make investment decisions.
There are risks involved with investing including possible loss of principal and the value of investments and the income derived from them can fluctuate. The price of equity securities may rise or fall because of changes in the broad market or changes in a company’s financial condition. Diversification does not guarantee investment returns and does not eliminate the risk of loss. Investing for short periods may make losses more likely. Future returns are not guaranteed. Past performance is not indicative of future results, which may vary. Investors are urged to consult with their financial advisors before buying or selling any securities.
NOT FDIC INSURED, NOT A DEPOSIT OR OBLIGATION OF THE BANK, NO BANK GUARANTEE, NOT INSURED BY ANY FEDERAL GOVERNMENT AGENCY.