indigenous origins of colonial institutions
TRANSCRIPT
Indigenous Origins of Colonial Institutions∗
Luz Marina Arias Desha Girod
February 20, 2011
Abstract
Differences in colonial institutions appear to explain divergent patterns of political
and economic development across former colonies. However, the origins of colonial
institutions are not well understood. This article hypothesizes that variation in colonial
labor institutions can be explained by both pre-colonial indigenous governance and
the resource promise of colonies. We derive the hypotheses using a game-theoretic
framework that emphasizes constraints facing profit-maximizing colonists, indigenous
leaders and workers. We test the hypotheses using an original dataset of natural
resources and labor and tribute institutions from the pre-colonial and colonial periods
for 454 sub-national territories in the Americas. The findings suggest that differencesin political and economic development today may predate European colonialism.
∗We thank Sondra Appelson, Meagan Barrera, Bradford Crist, Richa Goyal, Trevor Kosmo, Ben Rosen-
blum, Karl Schuettler, Virginia Smith, and Marie Tranvouez for their research assistance. We are also
grateful to B. Douglas Bernheim, Alberto Dıaz-Cayeros, Ricardo Fagoaga Hernandez, Jennifer Gandhi,
Avner Greif, David Laitin, Ev Meade, Luis Fernando Medina, Romans Pancs, Sebastian Saiegh, Gabriela
Soto-Laveaga, William Sundstrom, Gabriela Torres-Mazuera, Eric Van Young, Joel Watson, and Chris
Woodruff for their feedback. We also thank participants at the Social Science and History Workshop at
Stanford University and the Center for U.S.-Mexican Studies’ Seminar and Writers’ Workshop at UCSD,
the APSA and the EHA Meetings in 2010. The research also benefited from the financial support of the
Center on Democracy, Development, and the Rule of Law (CDDRL) at Stanford University and the Center
for U.S.-Mexican Studies at UCSD.
1
1 Introduction
While colonial institutions appear to explain contemporary development,1 the origins of
colonial institutions and the mechanisms through which institutions persist are not well
understood. Traditional explanations of different types of colonial institutions focus on Eu-
ropean culture and religion (Weber, 1958), and European legal and economic institutions
(la Porta et al. 1997, 1998; Lange et al. 2006; Mahoney 2010). Recent research emphasizes
indigenous prosperity (i.e. population density, urbanization), settler mortality, and natural
endowments (Acemoglu et al. 2001, 2002b, Engerman and Sokoloff 1997, 2000, 2006). How-
ever, the role of indigenous institutions and peoples remains largely unaddressed and the
mechanisms behind institutional persistence poorly specified.2 Were colonial institutions
new or did they represent the persistence of indigenous governance practices?
When colonists arrived to the Americas, they encountered much more than a tabula rasa
or institutional vacuum. They found rich and diverse indigenous institutions. For example,
when Cortes reached the valley of Mexico, he found the Aztec empire, a prosperous and
organized society with an agricultural surplus that could sustain a political elite, a religious
elite, and an administrative hierarchy. Cortes wrote: “There are many chiefs, all of whom
reside in this city, and the country towns contain peasants who are vassals of these lords
and each of whom holds his land independently; some have more than others... And there
are many poor people who beg from the rich in the streets as the poor do in Spain and
in other civilized places,” (Cortes 1986). Similarly, the Aztecs lived in “large and intricate
polities” (Macleod 2000, p. 5) with a political administration able to mobilize labor for
public works, cultivation of the fields, and religious activities (Cline 2000, p. 194).
In contrast, colonists encountered dispersed settlements in the sub-national Mexican
states of Sonora, Sinaloa, Durango, Chihuahua and Baja California. The Spanish called
them rancherıas. Indigenous peoples in these settlements subsisted mostly on hunting and
gathering, and political organization was decentralized. Headmen or elders (principales)
provided guidance “...with oratorical skill” (Deeds 2000, p. 51). Indigenous peoples in these
territories did not institutionalize tribute or organize communal labor. Instead, they relied
on “bilateral forms of kinship organization” (Deeds 2000, p. 52). The variation in indige-
nous institutions raises an important empirical puzzle: How did pre-colonial institutions
influence colonial institution building?
We use the colonization of the Americas as a natural experiment to study institutional
development. The arrival of the colonists is an exogenous shock that allows us to disentangle
indigenous and European influences on colonial institutions since Europeans had no contact
with the region prior to their first expeditions in 1492. In Africa, the Middle East, and
Asia, it is much more difficult to disentangle indigenous from European influences on
1See Nunn and Wantchekon 2008, Bardhan 2005, Rodrik et al. 2004, Easterly and Levine 2003, Glaeser
et al. 2004, Acemoglu et al. 2001, 2002b, and Hall and Jones 1999.2Africa scholars acknowledge the impact of pre-colonial institutions on economic development (Gennaioli
and Rainer 2007, Boone 2003, Englebert 2000; see also Acemoglu et al. 2002a), as do Ertan and Putterman
(2007) considering all countries. However, they assume persistence rather than provide a mechanism to
explain institutional development.
2
colonial institutions because Europeans traded with indigenous peoples for centuries prior
to colonial rule. As a result, the Americas offer the cleanest study of the origins of colonial
institutions.3
The theoretical framework presented here explains when and how colonists settled by
focusing on the interaction between colonists, indigenous leaders, workers, and natural
resources. We focus on colonial labor institutions and we predict and observe the repro-
duction of indigenous institutional attributes in some cases, and a change in the underlying
mode of labor governance in others.
Whether colonists replicated indigenous institutions depended on the promise of natural
resources and the degree of hierarchy in indigenous governance. We define the degree
of hierarchic governance as the degree to which indigenous leaders relied on a political
infrastructure to enforce tribute laws and mobilize labor. In polities with a high degree of
hierarchy, rulers had an extensive administration. In polities with low degrees of hierarchic
governance, leaders relied instead on kinship relations to obtain labor or goods. Indigenous
governance institutions therefore help explain why and how colonists profited from natural
resources across the Americas.
Our theoretical analysis predicts that colonists settled faster in territories with a high
degree of hierarchy than in other territories. Colonists were also better off in these terri-
tories by imitating indigenous governance. In doing so, they could reap profits from the
existing structure. Two institutional channels drive this in the model. First, the more hier-
archy in indigenous governance, the higher the share of the wealth leaders are able to keep
for themselves. Second, hierarchic societies are more easily captured than non-hierarchic
societies. Indigenous leaders in territories with high hierarchic governance have more to
lose if defeated and captured after a military confrontation.
Some territories with low degrees of hierarchy, however, had the potential for natural
resource wealth. In these territories, colonists built new, hierarchical labor institutions to
obtain a higher share of the wealth than they would obtain otherwise. The prospects of
profit offset the cost of building institutions. However, when colonists found low hierarchy
and no resource promise, colonists did not settle at first. Once they did settle, they imitated
indigenous governance institutions, wherein labor exchange was based on familial ties and
higher labor mobility. In these regions, laborers received higher compensation for their
work.
To test the argument, we collected original data across 454 subnational territories in the
Americas. These data improve on existing quantitative work on early colonial institutions
in two main ways. First, while existing quantitative studies measure colonial institutions
indirectly with variables like settler mortality, we measure institutional and resource types
directly. Second, existing quantitative studies analyze differences in colonial institutions
using present-day national boundaries, which include a very broad range of indigenous
and colonial institutions. We analyze subnational territories (still based on modern day
3There had been a few short-term expeditions to Newfoundland. In contrast to Africa and Asia, however,
there had been no previous trade relations between the continents.
3
boundaries) and therefore reduce the different number of colonial institutions present in
each unit under study.4
Our analysis has implications for several literatures. Domar (1970) first developed the
argument that economic forces (i.e. the land to labor ratio) alone are not sufficient to
explain labor institutions. Domar emphasizes the role of a political infrastructure able to
restrict the movement of peasants and limit land ownership to only a few. Like Domar, we
emphasize the role of political institutions. We take it further by analyzing the mechanisms
by which external actors imitate or change different types of political infrastructures.5
Also, our analysis is related to the literature on the transfer of institutions. Berkowitz
et al. (2003) study the determinants of legal institutions by analyzing the process through
which legal institutions were transplanted in the colonies and find that transfers were suc-
cessful in colonies where the transplant adapted to local conditions or where the population
was familiar with the law. Their findings are in line with our argument that the institutions
colonists “built” share common elements with the indigenous institutions already in place.
Furthermore, the approach here contributes to the literature incorporating history to
the game-theoretic study of institutions (Greif and Laitin, 2004). By studying institutions
as an endogenous process, under specific historical conditions, we are able to provide an
explanation for the endogenous persistence and change of institutions.
Finally, historical institutionalism holds that institutions persist until challenged by
a critical juncture.6 New institutions that emerge after a critical juncture depend on a
constellation of interests, ideas and pre-existing institutions. Consistent with historical
institutionalism, we find that the same critical juncture, colonial expansion, had widely
different effects on colonial labor institutions throughout the Americas. We find that
the underlying structure of economic potential encountered by Europeans influenced the
development of colonial labor institutions in predictable ways.
We begin with a description of indigenous governance institutions and natural resources
when colonists arrived to the Americas. Second, we offer a theoretical framework to explain
variation in colonial labor institutions. Third, we test observable implications of the theory
with original data on natural resources and indigenous and colonial institutions. The final
section concludes with a discussion of the implications of our study.
2 Landscape of the Americas
When colonists arrived to the Americas, they observed diverse natural environments and
heterogeneous indigenous societies. We emphasize two aspects of the landscape they en-
countered: indigenous governance institutions that might have influenced colonist decisions
4The only paper to our knowledge studying subnational variation in colonial institutions is Bruhn and
Gallego 2009. Its focus is on economic development while ours is on the mechanisms behind institutional
development.5See also (Acemoglu and Wolitzky, 2009), for an economic theory of coercion in labor arrangements.6See Thelen 2004, and Thelen 1999 for a review. Also Pierson and Skocpol 2002.
4
to settle and to organize labor, and natural resources and raw materials that promised prof-
its to the potential settlers.
2.1 Indigenous Governance Hierarchy
We focus on the indigenous rules and beliefs governing labor and goods surplus extraction
by indigenous authorities for political or other purposes.7 Indigenous governance regarding
labor and goods exchange can be classified across a continuum where one extreme represents
exchange based on kinship relations and reciprocity, and the other extreme represents
exchanges based on what we call hierarchic governance. We define the degree of hierarchic
governance as the degree to which rulers relied on a political infrastructure to enforce
tribute laws and mobilize labor. In polities with a high degree of hierarchy, rulers had
extensive administration. In polities with low degrees of hierarchic governance, leaders
relied instead on kinship relations to obtain labor or goods.
Indigenous regions with hierarchic governance were governed by an elite with control
over resources and labor. Control is evident in two areas: mode of surplus extraction and
the ease with which indigenous peoples could migrate or escape.8 First, in regions with
hierarchic governance the elite consisted of a political authority supported by a legal and
religious infrastructure of norms, beliefs, and social and political organizations.9 Social and
political differentiation was sustained by economic specialization that allowed for overall
productivity and thus food surpluses. This structure gave the ruler and the elite access
to a share of the surplus through labor drafts for public works and the cultivation of the
fields, and through the collection of tribute.
For example, in present-day Mexico, according to Gerhard, “often a state consisted of
a group of calputin within a very small area, or even part of a single, complex settlement,
with its own ruler, nobility, commoners, and slaves” (1993, p. 4-5). The Spanish referred
to this Mesoamerican altepetl, or city-state, as senorıo. The altepetl consisted of a head,
the tlatoani, surrounded by counselors, the pipitlin. The pipitlin also served as high-level
functionaries (Cline 2000, p. 193) and sometimes governed subunits of the altepetl (calpulli).
Each calpulli had its own god and its own hierarchy (Lockhart 1992, p. 16). Elites in the
calpulli mobilized labor for public works, cultivation of the fields, and religious activities
(Cline 2000, p. 194). Some states wielded military, economic, and sometimes political
hegemony over others, like in the case of the Triple Alliance of the Mexica, Tepanec, and
Acolhuaque—known as the Aztec Empire—which controlled much of the area of central
Mexico. This Triple Alliance controlled a far-flung empire in which these three altepetl
were dominant and all others subordinated to them. “In the period prior to the Spanish
7For more on the role of institutions as rules and beliefs see Greif 2006, p. 190. These rules and beliefs
shaped the cognitive, informational, coordinative, and normative context for indigenous peoples, and in
doing so facilitated or hindered the colonists’ ability to use indigenous labor and obtain goods. Tella et al.
2007 provide evidence of the influence of economic institutions on the formation of beliefs.8For the following characterization we rely primarily on Lockhart and Schwartz (1983), Villamarın and
Villamarın (1975), Sanders and Marino (1970), and Greif (2006).9See Macleod 2000, p. 5-6, and Lockhart 1992, p. 16.
5
conquest all peoples in the Valley [of Mexico] had been subordinated by way of tribute and
military service to the tlatoani of Tenochtitlan, Texcoco, or Tacuba” (Gibson 1964, p. 34).
Their hierarchical administrative structure facilitated the transfer of goods and labor to
the capital of the empire in the valley of Mexico, and other urban centers.10 Within this
complex there were “countless quite autonomous states with their own tlatoque, together
with others ruled by military governors and tribute collectors imposed by a tlatoani of a
dominant state” (Gerhard 1993, p. 5).
Also, in regions with hierarchies, political authority and class differentiation were in-
stitutionalized and visible. Not only was the clothing of the ruling class distinguishable
from that of the commoners, also “lavish residences, stone-lined tombs, and sumptuary
privileges” gave evidence of the status of the elite constituting the political and adminis-
trative authority (Zeitlin 1989, p. 32). This is important because the existence of a single,
identifiable agent facilitates negotiation and makes enforcing agreements with outsiders
more credible.
In contrast, territories with no hierarchic governance tended to lack visible leaders. As
noted by Lockhart, “even at the village level, tribute paying and community rotary labor
were not known, nor was there a strong chief empowered to demand levies” (Lockhart and
Schwartz 1983, p. 52). If there was a leader at all, this chief or headman was concerned
mostly with ceremony and war, and his authority depended on merit (e.g. success in war,
healing powers), suasion skills, or age. To obtain labor or goods from the community, the
leader needed the consent of the community, relying for enforcement on kinship relations
and peer-pressure (Deeds 2000, p. 52).11 Whenever labor was organized at all (i.e. for
war or ceremony), it was organized on the bases of age and sex. These societies relied
on hunting and gathering and therefore had smaller food surpluses. For example, the
Chichimecs occupying the arid plains and mountains of the north of present-day Mexico
were hunters and gatherers, and “considered barbarians by the Mexica [Aztecs]” and other
peoples living in the more complex societies. The Chontal and the Huave in the present-
day state of Oaxaca and other tribes in present-day Guerrero offer other examples of non-
hierarchical societies. Colonists viewed them as “people on a relatively primitive cultural
level with simpler social and political institutions” (Gerhard 1993, p. 5).
In addition to the potential for surplus extraction, the degree of hierarchic governance
has implications for whether indigenous peoples could migrate or escape. While those
living in specialized societies were sedentary, others were hunters and gatherers and “had
literally no cultivation of domestic varieties, no permanent settlements” (Lockhart 1992,
p. 56). Thus, less hierarchic societies were more accustomed to surviving on the move and
adapting to new environments. They could find refuge in the hinterlands because they
were relatively more self-sufficient. Migrating was less costly for them. Indigenous peoples
10Furthermore, the peoples of central Mexico had pre-hispanic experiences of conquest (Cline 2000,
p. 198). Altepetl were in constant competition with each other, which resulted in their frequent restruc-
turation and in the formation of expansive units as a consequence of alliances (Bartolome 1992, p. 255),
like in the case of the Aztec Empire.11See Greif 1994 for a description of community-based enforcement.
6
in hierarchic regions found it more difficult to migrate because they possessed a specialized
set of skills (intensive agriculture, trade, or ritual-making, for example). Furthermore,
most of the hierarchical territories were in the highlands, from where it was harder to
escape. Peoples on the lowlands and coastal areas could escape the colonists by retreating
inland. This mobility has implications regarding the ability of indigenous societies to avoid
capture in a military defeat. Because of the higher ability to flee in less hierarchic societies,
the probability to be captured once defeated is higher the higher the degree of hierarchic
governance.12
2.2 Resources
Colonists found different natural endowments and raw materials across the Americas. ‘Re-
sources’ are those natural endowments and raw materials that were valuable because tech-
nological and institutional conditions made their appropriation and utilization possible and
profitable.13 For example, sugar grew better in tropical climates, but its large scale pro-
duction became possible only in the fifteenth century with the technological innovation of
the two-roller mill.14 Furthermore, the possibility to commercialize the crop and export it
to Europe was a necessary condition for its high profitability. The consumption of sugar
was not widespread in the fifteenth century, but by the sixteenth century, cooking manuals
include references to sugar that suggest sugar had become part of the European diet, at
least for the aristocracy.15
We categorize resources according to whether they were valuable resources to potential
settlers based on two factors.16 First, we account for the marketability and price of the
resource in world markets. Second, we account for the scalability of the production process,
the capital investment required. Resources can therefore be categorized based on whether
they had high or low marketability, and whether they required high or low levels of capital
investment. Resources with high marketability and low levels of capital investment included
minerals and timber (Glade 1969, p. 74-77). Resources with high marketability and high
levels of capital investment included cotton and sugar. Resources with low marketability
and low levels of capital investment included livestock. The category of low-marketability,
high-capital investment resources was null.17
12For more on social and geographic factors relating to escape see Service (1955). See Lockhart 1992,
p. 52-56 for mobility of warfare.13For a thorough discussion of resources as a dynamic concept functionally related to a complex of
variables see Glade 1969, p. 14-21.14The traditional mill consisted of one large circular-stone and required cutting the sugar cane. The
new form did not require the cane to be cut since it could pass through the two rollers cogged together.
Schwartz (1985) has more detail on the role of the mill innovation in the appearance of the plantation as a
way of organizing production.15See Schwartz 1985, p. 5.16We are not the first to emphasize marketability and the technology of production. See for instance
Engerman and Sokoloff 2002, p. 44 .17Cochineal could not be produced in large scale because of the time and care intensive labor that the
cacti home to the cochineal insect require. For a specific analysis of the production and export of cochineal
and its implications for the development of colonial institutions see Dıaz-Cayeros and Jha, 2011.
7
Because the potential for large-scale, profitable agriculture was contingent on technol-
ogy and markets, colonists sometimes viewed certain lands that lacked indigenous agricul-
ture or society as potentially profitable. For example, some warm and tropical areas in the
islands of the Caribbean, parts of Brazil and parts of southeast Mexico were optimal for
sugar and cotton. Yet, none of these territories had pre-existing societies with high levels of
hierarchic governance, nor did they have agriculture as the main form of sustenance. Sim-
ilarly, while colonists found silver and gold mines in Central Mexico and the highlands of
Peru, territories with high degrees of hierarchy, colonists also found mines in areas lacking
hierarchy, such as present-day Zacatecas in the northeast of Mexico, for example.18
3 Analytic Framework
We propose a mechanism that explains differences in colonial labor institutions. We argue
that early colonial outcomes in the Americas result from variation in indigenous governance,
together with the natural endowments valuable to the colonists.
We formalize the strategic interaction between colonists, indigenous leaders, and labor.
The historical evidence supports focusing on the entrepreneurs exploring the regions as
opposed to the Crowns they represented. After the early experiences in the Caribbean,
“the idea of direct crown supervision of overseas expansion (...) faded rapidly in the
face of the realities of the Indies” (Lockhart and Schwartz 1983, p. 78). Conquest and
colonization was largely carried out by private enterprise and organized on a mercantile
basis backed by wealthy Europeans holding charters from their respective crowns. These
entrepreneurs, however, relied mostly on their own financial resources. The crowns provided
some financial resources at first, but the contributions were small relative to the overall
cost of the enterprise. For instance, early explorations in Spanish America were undertaken
by the huestes Indianas, parties consisting of military men, seamen, religious men for the
spiritual care of the soldiers and to intervene in the conversion of the indigenous, and fiscal
authorities. The leader of the exploration party would “sport the title captain,” and was
invariably a man of standing in the base area (Lockhart and Schwartz 1983, p. 79).19
Players, interaction, and payoffs
Consider a complete information game with three players: colonists (player 1), indigenous
leaders (player 2), and workers (player 3). Colonists first explore a region and observe its
indigenous governance institutions, α, and its resource wealth r.20 As argued in section
18Minerals were not as highly valued or commercialized by the indigenous peoples, nor was their technol-
ogy for the extraction of minerals from the ore as developed as that of the Europeans. Even though gold
and silver were part of the attire of the highest indigenous authorities—which pointed out to the Europeans
the existence of metals—these metals were not used as a means of exchange in the Americas, as was the
case in Europe.19See Zavala (1988) for more on the Spanish expeditions and legal instructions for the conquest.20There is evidence that upon arrival colonists inquired about the types of resources and the forms of
governance. See, for instance, Villamarın and Villamarın 1999, p 579. Furthermore, colonists obtained early
8
indigenous governance specifies the degree to which labor and tribute exchanges are en-
forced through a political administration, and thus the share of the surplus that goes to the
rulers. We operationalize indigenous institutions as specifying the division of the output
between indigenous leaders and workers before the arrival of colonists. Let α ∈ (0, 1) be
the share of the output kept by indigenous leaders. Correspondingly, 1 − α is the share
kept by workers. A higher α implies more hierarchic indigenous governance, and thus a
higher proportion of the output kept by the indigenous leaders. As such, the parameter α
allows us to highlight the role of indigenous leaders as intermediaries between the colonists
and workers.
After a colonist has explored the territory, he chooses whether to seek permanent set-
tlement. If deciding not to settle, the colonist explores a new region and observes its
governance institutions and resource wealth, and, again, chooses whether to seek perma-
nent settlement. If choosing to settle, the colonist decides whether to imitate or to change
the degree of hierarchy of indigenous forms of governance. Imitation entails bargaining
with the leaders on a division of the total production surplus. In the case of imitation,
the colonist interacts only with the leaders. If instead the colonist changes institutions,
he faces the workers directly and suppresses the leaders. After observing the change in
institutions, the workers choose whether to comply with the colonial regime.
Concretely, the timing is as follows:
1. Colonists explore and decide whether to settle. If not settling, they keep exploring.
2. Once they decide to seek permanent settlement, the colonists decide whether to
invest in changing the degree of hierarchy of indigenous forms of governance. They
can either imitate indigenous institutions or build new institutions.
3. If imitating indigenous institutions, colonists bargain with the indigenous leaders a
division of the production surplus.
4. If building new institutions, colonists choose x such that α� = α+ x, where α+ x is
between zero and one. There is a cost c(x), increasing in x, to changing indigenous
governance.
Let p(r)Y (K,L) be the value of the total output from a region with resource wealth
r, and capital investment K and labor L; p(r) represents the price and marketability of
the natural endowment in world markets. We include L in the production function to
emphasize that labor is necessary to exploit the resources of a region. If labor does not
comply with colonial rule after a change in institutions, total output is zero. To simplify
notation in what follows we use pY for the total value of output.
In the following sections we specify in more detail the interaction at each stage of the
game, the payoffs and the outside options of the players.
on an idea of the functioning of each society. They could not understand the detail of all the norms, beliefs
and organizations. However, indigenous leaders and differentiation were often visible. See also Lockhart
and Schwartz 1983, p. 79.
9
3.1 Bargaining
The colonists and the indigenous leaders, players 1 and 2, have the opportunity to reach
an agreement whereby they will split the surplus from the production process. The set of
possible agreements is:
Y = {(y1, y2)|y1, y2 � 0, y1 + y2 � αpY }
As long as they do not reach an agreement, there is the possibility of a military con-
frontation between the colonists and the indigenous leaders. The outcome of the con-
frontation depends on who is defeated, and on whether the winner is able to capture the
defeated. Thus, the ‘loser’ can escape and avoid being captured, or concede to the winner.
There is broad scholarly agreement that the war technology of the colonists was superior
to that of the indigenous peoples.21 Therefore, we assume that if a confrontation ensues,
the colonists win with probability one. Nonetheless, some indigenous peoples were more
likely than others to be captured.
Let πc be the probability that the colonists capture the indigenous leader and, corre-
spondingly, 1−πc the probability that the indigenous leader flees and resists to be captured.
This probability is a function of the hierarchy in indigenous institutions. As argued in sec-
tion 2, hierarchic societies are more likely to be captured once defeated. Therefore, πc is
increasing in α. If captured, the indigenous leader is killed and thus receives a zero payoff.
Otherwise, the leader is able to keep all of the production surplus to herself: αpY . In turn,
the colonist receives a zero payoff if the indigenous leader flees, and if capturing the leader
obtains (α− φ)pY , where φ is the fraction of the production output that colonists are not
able to extract without the indigenous leaders.
We apply a static axiomatic approach to obtain the outcome of the bargaining pro-
cess, and in particular we use the Nash bargaining model.22 Even though Nash’s is a
static approach that does not explicitly specify the extensive form representation of the
bargaining procedure, Binmore et al. (1986) show that for an appropriate choice of the
disagreement point, the Nash solution approximates the perfect equilibrium outcome of
the alternating offers model in Rubinstein (1982) when the length of a single bargaining
period is sufficiently small. In our case, the Nash bargaining problem is defined by:
S = {(u1, u2)|y ∈ Y subject to (u1, u2) = (u1(y), u2(y))},
s0 = (u1(b), u2(b)).
where b is the disagreement outcome obtained in the case of a military confrontation
between the players, as described above; u1(y) and u2(y) are the von Neumann-Morgenstern
21See Powell 1972, p. 205; Lockhart and Schwartz 1983, p. 80-83; Mahoney 2010, p. 57. Some indigenous
leaders attempted to defeat the colonists to keep their position of authority intact, but no indigenous group
succeeded. In some cases, indigenous leaders even sought agreements with the Colonists preemptively. After
receiving notice of the defeat of the Aztecs in Tenochtitlan, the reigning Zapotec ruler in Tehuantepec, in
the Isthmus region in Oaxaca, sent rich gifts and promises of loyalty to Spanish emissaries exploring the
highlands of southern, present-day Mexico: see Zeitlin 1989, p. 34.22This is also known as the Nash cooperative solution, first characterized by Nash (1950).
10
utility representations of the preferences of colonists and indigenous leaders over outcomes.
We assume that players are risk neutral and so drop u from now on and focus on expected
utilities.23
The agreement specified by the Nash solution to the problem described above is the
solution for24
yN = argmaxy∈Y
[y1 − πc(α− φ)pY ][y2 − (1− πc
)αpY ].
There are mutually beneficial agreements since a portion of the production output
surplus is lost if agreement breaks down: φpY is lost. The Nash solution specifies the
following agreements:
y1 = πcαpY − 1/2(πcφpY ), (1)
y2 = (1− πc)αpY + 1/2(πcφpY ). (2)
The players divide the value created from bargaining, φpY , in half and keep a share
of the remaining production surplus according to the probability of capture. Societies
with hierarchies are more likely to be captured and thus the leader must transfer a larger
portion of the production surplus to the colonists to reach an agreement. The value created
is divided in half because we assumed a symmetric solution. If we allow for asymmetries in
the bargaining power of the players not resulting from differences in utility functions or the
disagreement point, we could obtain different partitions of the surplus lost. A more general
characterization of the partition would be βπcφpY where β is the bargaining power of the
indigenous leaders. Alternatively, we could assume that the indigenous leaders are more
risk averse than the colonists (not unreasonable) which would increase the share obtained
by the colonists.
The result shows that by imitating the existing indigenous institutions the colonists
obtain a surplus. Furthermore, the surplus is higher, the higher the degree of hierarchy of
the indigenous society. Two ‘institutional’ channels make the surplus higher. First, leaders
of more hierarchic societies are able to extract a higher share of the surplus. Second, the
share of the colonist is higher because more hierarchic societies are more easily captured.
Indigenous leaders, thus, have more to lose if the agreement breaks down. Also note that
the presence of highly profitable resources (higher pY ) and a higher hierarchy (higher α)
increase the share for both colonists and leaders, increasing the likelihood of an agreement.
3.2 Building institutions
The colonists can choose to create labor institutions that differ form indigenous institutions
rather than bargain with the leaders and imitate indigenous forms of governance. When
investing in new labor institutions, the colonist chooses a share (1− α�) of the production
surplus to give to the workers. Colonists can change the degree of hierarchy by either
reducing the mobility (ability to escape) of the workers through increases in coercion and
23We discuss below how making the players risk averse changes the results.24The solution satisfies the four axioms formulated by Nash: scale invariance, efficiency, symmetry, and
independence of irrelevant alternatives.
11
hierarchy (increase in α�), or by providing positive incentives to workers (decrease in α�).
We focus on the case in which colonists always prefer a higher α� to simplify the exposition
and because we seldom observe colonial institutions going in the opposite direction.25
Therefore, we model institution building as the implementation of policies that reduce
the outside option of the workers. For an investment in hierarchy of size x, the worker’s
participation constraint becomes (1− α�)pY ≥ v(α)− x, where v(α) is the outside option
of the worker for a pre-existing degree of hierarchy α. As we argue in section 2, v(α) is
decreasing in α.
For workers to comply with colonial rule, the colonist needs to give the workers at
least a subsistence level wage. Let v be the subsistence wage. To maximize his payoff the
colonist chooses x such that
α = 1− v
pY. (3)
That is, x = v(α) − v. Equation 3 implies that colonists build institutions that extract
more of the surplus from the workers the higher the resource wealth and the lower the
level of subsistence of the workers.26 African workers are an example of workers with a
low subsistence level: they were displaced to unknown environments far away from their
homeland. This result implies that using African slavery in regions with potential for sugar
allowed for a large extraction of surplus.
Building more hierarchic institutions is costly. The cost depends on the difference
between the new level of hierarchy and the previous level of hierarchy. The less hierarchic
the society, the more costly it is for the colonist to impose a control infrastructure relying
on hierarchy and coercion. Let c(x) be the cost of hierarchies; c(x) is increasing in x. The
payoff to colonists from building more hierarchic labor institutions is αpY − c(x), where α
is defined in (3).
The following proposition gives the condition under which we observe a change in
governance in a subgame perfect equilibrium. The condition derives from comparing the
payoff to the colonist upon reaching an agreement with indigenous leaders for a given α,
to their payoff if instead more hierarchic institutions are put in place.
Proposition 1. If the following inequality holds, in equilibrium the colonists invest in more
hierarchic institutions α� = α and the workers comply with the colonial regime as long as
(1− α�)pY ≥ v.v + c(x)
pY≤ 1− πcα+
φ
2. (4)
25We could modify the model to allow for equilibria in which colonial institutions are less hierarchic
than indigenous institutions by, for example, making the production process be influenced by the degree of
hierarchy: if some production processes require more qualified workers, and qualified workers have higher
reservation wages, increasing hierarchy may disincentivize effort.26In addition to Indigenous labor, the colonists also employed Africans and Europeans in some regions
to supply the necessary labor. Note that bringing outside labor can be interpreted as workers with a low
subsistence wage specially in regions with difficult escape options. For instance, workers displaced to regions
very different from their native regions, and regions lacking access to land. Displacing workers was indeed
a from of building labor governance institutions. Workers in our analysis need not only refer to Indigenous
labor but also to African or European labor.
12

Otherwise, in equilibrium the colonists reach an agreement with the indigenous leaders and
imitate indigenous institutions.
This result implies that there is a cutoff value for the initial level of hierarchy,
α∗=
1
π(1 +
φ
2− v + c(x)
pY),
below which we will see institutional change as long as the parameters are such that the
following inequality holds: v + c(x) ≤ pY [1− (1/2)φ].
Whenever the cost of building institutions plus the subsistence wage of workers are
high as a proportion of the value of total output, we expect colonists to imitate indigenous
levels of hierarchy. This will be the case whenever there are no highly profitable resources
in the region, or workers have high subsistence wages. An increase in the profitability of
resource wealth increases the range of values for which equation 4 holds and institutional
change happens. Also, an increase in the proportion of the output lost in case of a break
down in bargaining increases the cutoff value α∗, leading to institutional change for a
larger range of initial levels of hierarchy; concretely, for any α < α∗. Finally, a decrease in
the probability of capturing an indigenous society increases the range of values for which
institutional change will be observed (recall that this probability is higher the higher the
degree of hierarchy). In all, this implies that we should expect colonists to build more
hierarchic labor institutions in societies with lower degrees of hierarchy and with profitable
resources.
3.3 Settlement
When deciding whether to seek permanent settlement, colonists will make their decision
based upon indigenous governance and resource wealth. Colonists will settle first in regions
with high payoffs. Regions with hierarchic governance promise a share of the production
surplus to colonists and facilitate the bargaining with indigenous leaders. Regions with
resource wealth promise a higher value of the output produced. From the above analysis,
thus, we expect that regions with more hierarchic governance and with high resource wealth
will be settled first. Furthermore, recall that Y = Y (K,L). Production requires not only
labor but also capital. Different resources require different capital investments. Those
production processes necessitating higher initial investments (high K) entail higher initial
setup costs and so offer a relatively lower payoff upfront than do those with lower initial
investment costs. Exploiting resources that require investment will thus be less attractive
initially as long as lower investment resources are believed to be available.
The decision of whether to settle depends also on the regions yet to explore: the
availability of unexplored regions and the belief about their potential. As settlement in
other regions reduced the availability of unexplored areas, or changed the belief about the
existence of hierarchic governance and/or resources in the unexplored areas, we expect to
see an increase in settlement in regions with less expected payoffs. Thus, we expect regions
with less governance hierarchy and with resources that require higher investment to be
settled later.
13
3.4 Testable Hypotheses
The above analysis implies specific testable hypothesis regarding the colonist rate of set-
tlement and the degree to which colonial labor arrangements rely on hierarchies:
Hypothesis 1a: After an expedition, colonists should settle faster in territories with
higher indigenous governance hierarchy (high α). Hypothesis 1b: After an expedition,
colonists should settle faster in territories with highly profitable resources that require
little capital investment (high p and low K) than in territories that lack such resources.
Hypothesis 2a: When indigenous governance hierarchy is high, colonial labor institu-
tions are likely to imitate indigenous institutions. That is, the cutoff value α∗ falls as the
probability of capture, πc, increases. Hypothesis 2b: As resources become less profitable,
colonial labor institutions are more likely to imitate indigenous institutions. That is, a
decrease in pY reduces the range of values for which the inequality in proposition 1 holds.
Hypothesis 2c: As resources become more profitable, new hierarchical colonial labor insti-
tutions are more likely to emerge. That is, an increase in pY increases the range of values
for which the inequality in proposition 1 holds.
4 Data
To determine whether resources and indigenous institutions influence the speed and type of
colonial settlements, we created an original dataset including all 454 subnational territories
in the Americas. Our unit of analysis is the “territory” in the Americas. Territories
constitute the largest political demarcation within present-day countries (i.e. 33 states in
Mexico, 10 provinces and 3 territories in Canada, 9 departments in Bolivia, and so on).27
The Americas offer the cleanest test of our argument because colonists had no contact
with the territory prior to their expeditions. We therefore avoid the endogeneity problem
we would face if studying other regions, where previous contact with colonists might have
influenced the development of the colonial project.
We collected data on natural resources and indigenous institutions at the time that
expeditions reached each of the subnational territories, as well as on colonial institutions
once the colonists settled. Appendix A provides descriptive statistics. These data improve
on existing quantitative work on early colonial institutions in two main ways. First, exist-
ing quantitative studies measure colonial institutions indirectly with variables like settler
mortality. Some countries, however, received different colonial institutions despite having
similar settler mortality rates. For example, while settler mortality was equally high in
Mexico and Argentina, early settlers did not introduce free labor to Mexico, but intro-
duced it to forty-three percent of Argentina. In contrast, we measure institutional and
resource types directly. Second, existing studies analyze variation in colonial institutions
using present-day national boundaries. However, indigenous peoples and settlers built dif-
ferent types of institutions within modern-day countries. Settlers in present-day Argentina
and the United States, for example, established repartimientos and encomiendas in addi-
27The reported sample is smaller than 454 because of missing data on some of the variables.
14
tion to free labor. By analyzing subnational territories instead of nation states, we reduce
the different number of colonial institutions present in each unit under study.28
4.1 Indigenous Governance Hierarchy
The first independent variable of interest is pre-colonial indigenous governance hierarchy.
Hierarchy is based on the type of labor governance and tribute collection indigenous people
organized in each territory. We code indigenous labor organization on an ordered 3-point
scale fifty years before the colonial expedition reached the territory. The first expedition
is coded on the earliest year on record marking the arrival of colonists to the territory.
The fifty-year lag in coding indigenous institutions ensures that colonists did not influence
indigenous institutions. Territories with no specialized political or religious institutions
that could mobilize labor are coded as “0”. In these territories, if labor was organized
at all, it was organized on the bases of age and sex. An example of this type of indige-
nous governance are the Guaranı in Paraguay where kinship played an important role.29
When indigenous leaders could mobilize communal labor, the territory was coded as “1”.
Leaders in such territories typically mobilized labor for religious or military purposes. The
Arawaks in the Caribbean islands show this pattern of labor organization. There was some
asymmetry in political power, even if nominal and on the basis of personality. Finally,
territories where political or religious authorities systematically organized labor drafts for
public works, cultivation of fields, and so on, were coded as “2”.30
As with indigenous labor organization, indigenous tribute collection is coded on an
ordered three-point scale fifty years before the colonial expedition arrived. Territories with
no systematic collection were coded as “0”.31 Territories with systematic local collection
were coded as “1” (for example, the Chibcha of present-day Colombia), and territories with
systematic collection and transferring tribute to an authority external to the indigenous
society were coded as “2”.32 The territories part of the Inca and Aztec empires, in the
Andean region of South America and central Mexico, respectively, are examples of the
latter type of tax governance. Indigenous labor and tribute are positively correlated at
0.68.
28We relied on ethnographic and secondary sources in the historical literature to code institutions and
resources. We are in the process of creating a detailed Appendix for the sources and data collection. Some
of our major sources are: Steward, ed 1946, Bethell, ed 1984, Sokolow 2003, Burkholder and Johnson
2007, Birmingham 2000, Tandeter 1993, Bethell 1987, Schwartz 1978, Newson 1995, Lovell 2005, Bakewell
1971, Boucher 1992, Newson 1987, Malinowski and Sheets, eds 1998, Osgood 1904-07, Rabushka 2008;
http://countrystudies.us, http://www.britannica.com/.29See for instance Lockhart and Schwartz 1983, p. 26030When more than one level of labor organization is present in a territory, we code the territory as having
the higher level of labor organization (this was the case in eleven percent, 51 out of 454, territories). Results
hold when coding the territory as having the lowest value.31There could be some tribute collection for war or other purposes, but the tribute had to be requested
each time. Again, the Guaranı fit this category.32In two percent of the territories (8 out of 454), we found more than one level of tribute collection and,
as with labor organization, we code these territories as having the higher level of tribute collection. Results
hold when coding the territory as having the lowest value.
15
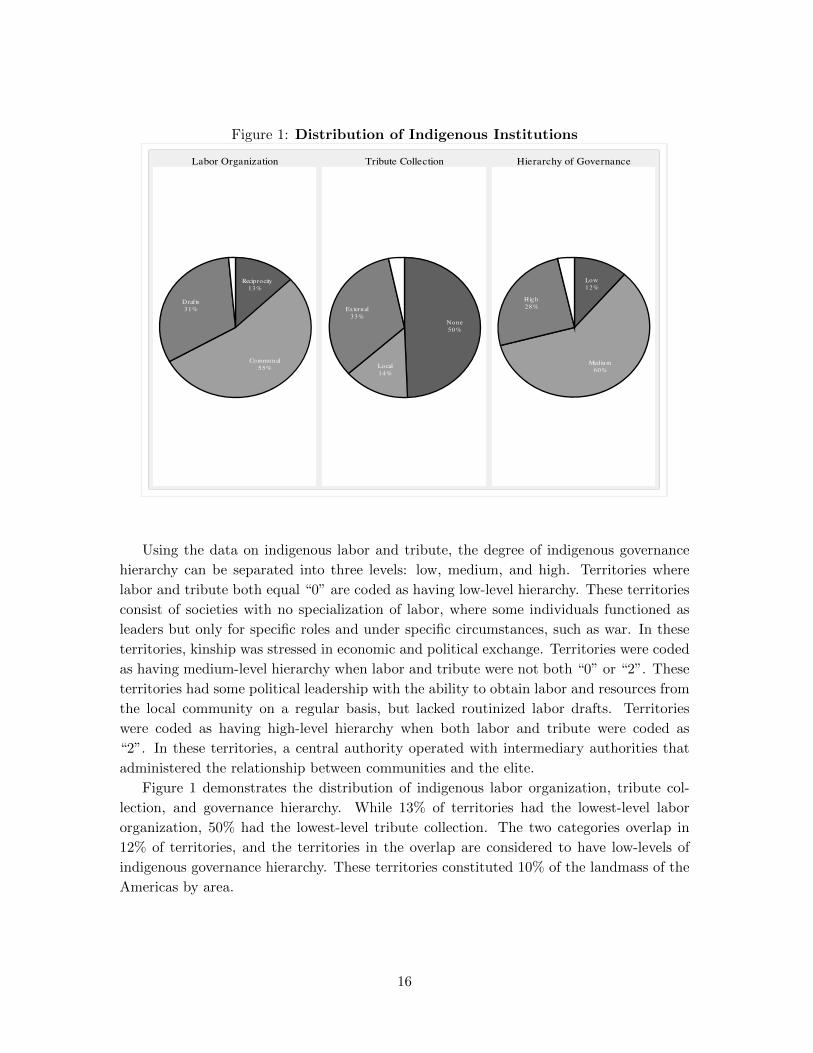
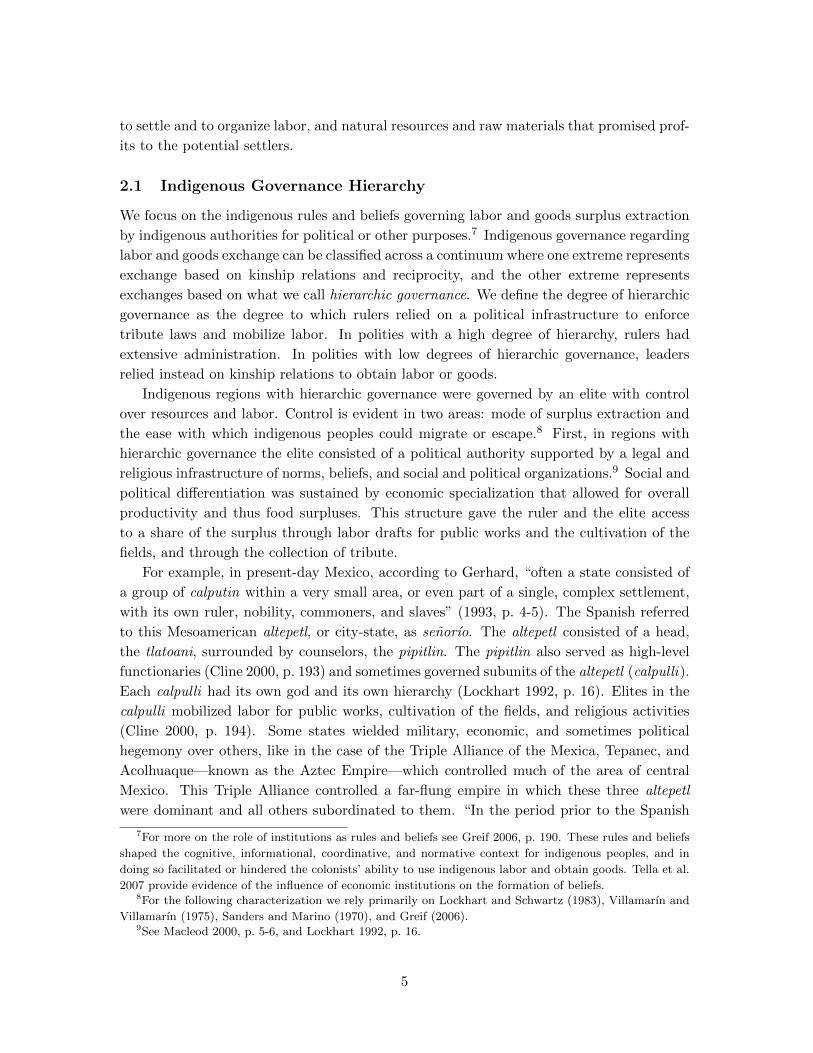
Figure 1: Distribution of Indigenous Institutions
Reciprocity13%
Communal55%
Drafts31%
Labor Organization
None50%
Local14%
External33%
Tribute Collection
Low12%
Medium60%
High28%
Hierarchy of Governance
Using the data on indigenous labor and tribute, the degree of indigenous governance
hierarchy can be separated into three levels: low, medium, and high. Territories where
labor and tribute both equal “0” are coded as having low-level hierarchy. These territories
consist of societies with no specialization of labor, where some individuals functioned as
leaders but only for specific roles and under specific circumstances, such as war. In these
territories, kinship was stressed in economic and political exchange. Territories were coded
as having medium-level hierarchy when labor and tribute were not both “0” or “2”. These
territories had some political leadership with the ability to obtain labor and resources from
the local community on a regular basis, but lacked routinized labor drafts. Territories
were coded as having high-level hierarchy when both labor and tribute were coded as
“2”. In these territories, a central authority operated with intermediary authorities that
administered the relationship between communities and the elite.
Figure 1 demonstrates the distribution of indigenous labor organization, tribute col-
lection, and governance hierarchy. While 13% of territories had the lowest-level labor
organization, 50% had the lowest-level tribute collection. The two categories overlap in
12% of territories, and the territories in the overlap are considered to have low-levels of
indigenous governance hierarchy. These territories constituted 10% of the landmass of the
Americas by area.
16
Thirty-one percent of territories had labor drafts and 33% had external tribute col-
lection. Twenty-eight percent of territories had both and are therefore coded as having
high-level hierarchy. These constituted 20% of the landmass of the Americas by area.
The vast majority of territories, the remaining 60%, had medium-level hierarchy. These
territories represented 63% of the landmass by area. Most of the observations in this
category (77%) have communal labor and no systematic tribute collection (labor = 1 and
tribute = 0) or communal labor and local tribute collection (labor =1 and tribute = 1).
Finally, 10% of territories, mostly small island countries, are missing data on at least one
of the two variables, and these represent 13% of the landmass.
4.2 Resources
The second independent variable of interest is resources. Highly profitable resources are
coded as requiring minimal capital investment (minerals and timber), or large amounts
of capital (cotton and sugar). Resources that generated lower profit, but required low
investment (livestock) are also analyzed. We code whether any of these resources were
available in each territory on the expedition year, regardless of whether the indigenous
groups were exploiting the resource. If the specific resource was present, the territory was
coded as “1” for the binary variable representing the resource. If the resource was lacking,
the territory was coded as “0” for the specific resource. Forty-five percent of the territories
had minerals, 41% had timber, 33% had livestock, 26% had cotton, and 18% had sugar.
Resources and indigenous governance hierarchy are not strongly correlated, with none of
the pairs exceeding 0.4.
4.3 Settlement and Colonial Labor Institutions
We investigate the influence of indigenous governance and resources on settlement and
on the development of five common colonial labor institutions: Free Labor, repartimiento
Repart, encomienda Encom, indigenous slavery IndigSlavery, and African slavery AfrSlav-
ery. The precise year of settlement was coded on the year that a governor or mayor arrived
(whichever was first) to govern the territory. The five institutions were coded as present,
“1”, or absent ,“0”, fifty years after a governor or mayor began governing the territory.
Of the five types of colonial labor arrangements, free labor is the least hierarchical. It
is based on direct, sometimes contractual, agreements between laborer and employer. Free
labor did not involve coercion, quotas or intervention of crown officials. The institutions
of repartimiento and encomienda were more hierarchical. Repartimiento was a system of
quotas wherein the colonists had to petition crown officials—the viceroy or the audiencia in
Spanish America—for workers.33 For a fixed wage, workers would tend to colonist property
on a rotational basis. The legal work period was one or two weeks and wages were lower
33In central Mexico before the conquest, this form of labor arrangement was known as cuatequitl and in
Ecuador, Peru, and Bolivia, it was known as mita.
17
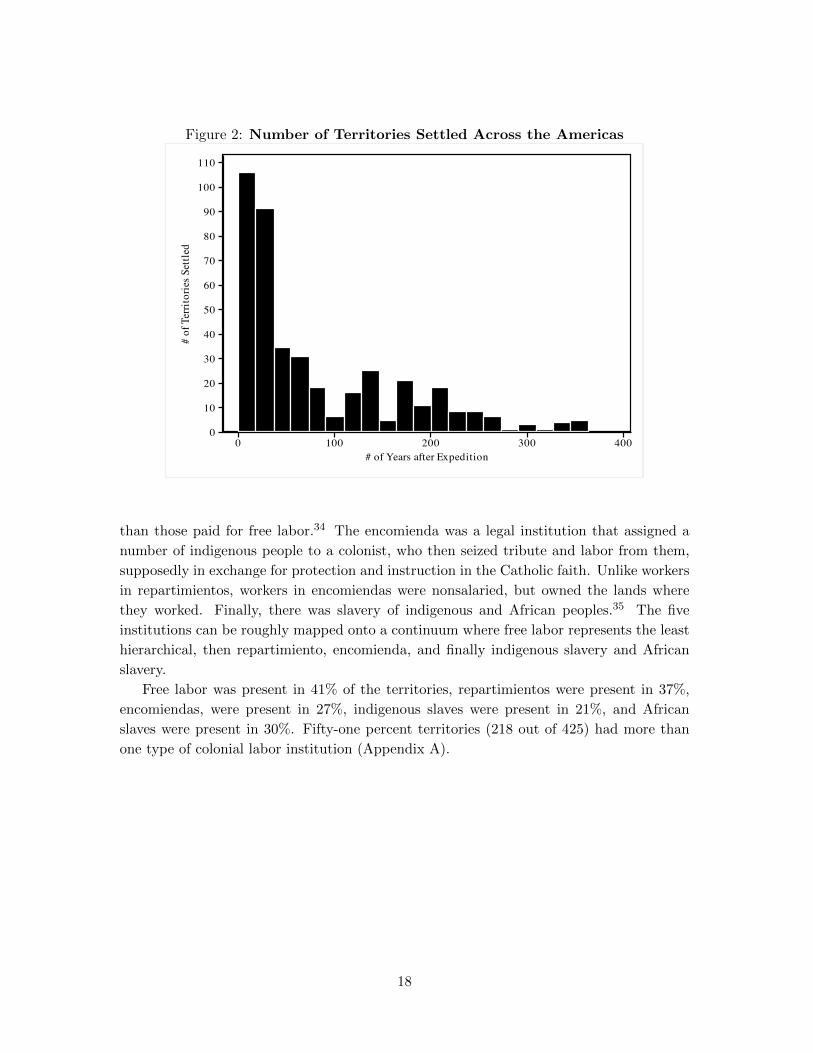
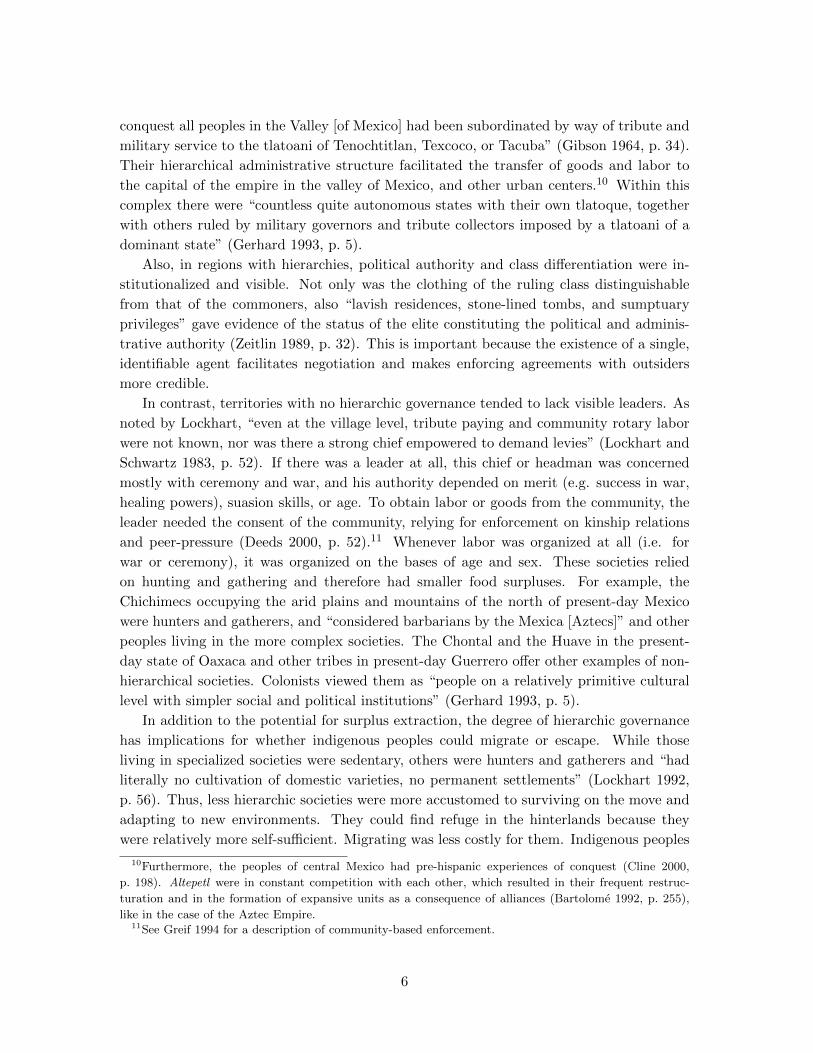
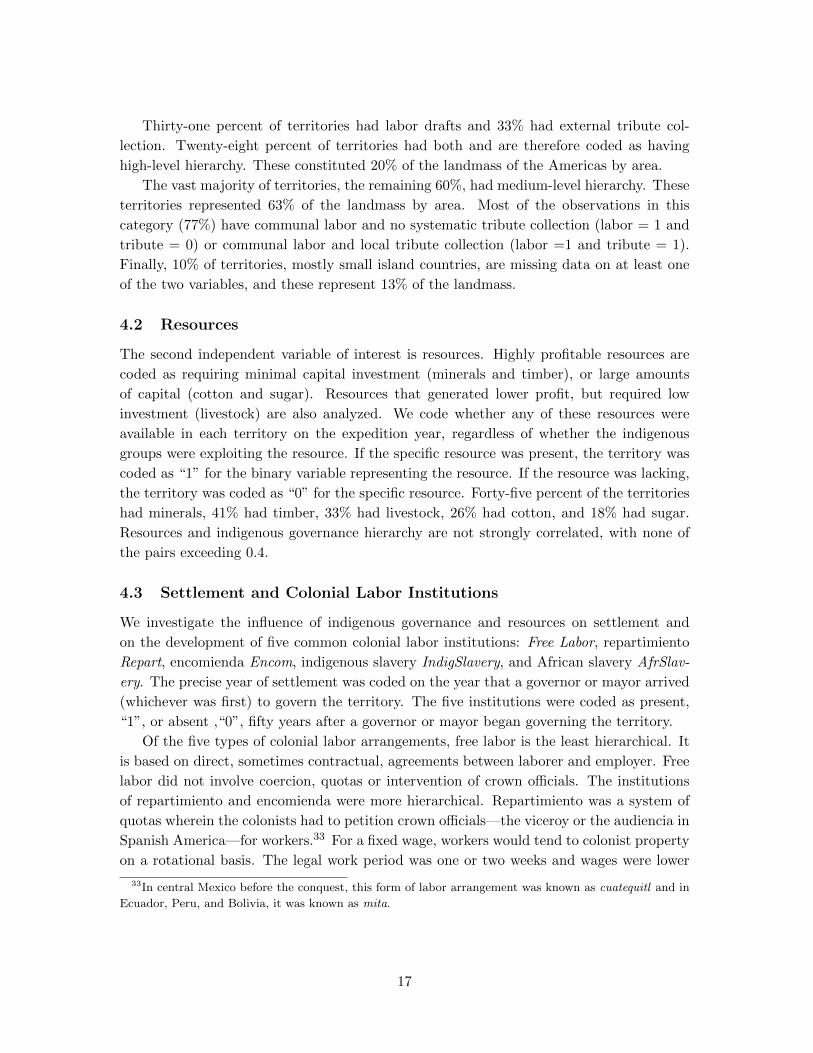
Figure 2: Number of Territories Settled Across the Americas
0
10
20
30
40
50
60
70
80
90
100
110
# of
Ter
ritor
ies S
ettle
d
0 100 200 300 400# of Years after Expedition
than those paid for free labor.34 The encomienda was a legal institution that assigned a
number of indigenous people to a colonist, who then seized tribute and labor from them,
supposedly in exchange for protection and instruction in the Catholic faith. Unlike workers
in repartimientos, workers in encomiendas were nonsalaried, but owned the lands where
they worked. Finally, there was slavery of indigenous and African peoples.35 The five
institutions can be roughly mapped onto a continuum where free labor represents the least
hierarchical, then repartimiento, encomienda, and finally indigenous slavery and African
slavery.
Free labor was present in 41% of the territories, repartimientos were present in 37%,
encomiendas, were present in 27%, indigenous slaves were present in 21%, and African
slaves were present in 30%. Fifty-one percent territories (218 out of 425) had more than
one type of colonial labor institution (Appendix A).
18
5 Empirical Analysis
5.1 The Rate of Settlement
According to the theory presented here, indigenous governance hierarchies and highly prof-
itable resources that are require minimum capital to extract should accelerate the rate of
colonial settlement (hypotheses 1a and 1b, respectively). The dependent variable is the
probability of settlement after the first colonial expedition in a territory. Expeditions in
the Americas occurred over 333 years, and settlement took almost four centuries, 398 years.
Spain launched the first expedition in 1492 and reached the Dominican Republic, Haiti,
Cuba and the Bahamas. The United Kingdom launched the last expedition in 1825 into
the Yukon province of Canada. The median year of expedition was 1530. On average,
colonists settled 81 years following an expedition. The first settlement was in 1500 in the
Dominican Republic, and the last was in 1898 in Yukon. The shortest amount of time
between expedition and settlement was one year (in Cusco, Peru, for example), and the
longest was 360 years (in Tierra Del Fuego, Argentina). By 1550, 28% of the territories
were settled. Fifty-five percent of the territories were settled by 1600, 75% by 1700, and
89% by 1800. All territories were settled by 1898. Figure 2 demonstrates the distribution
of the data.
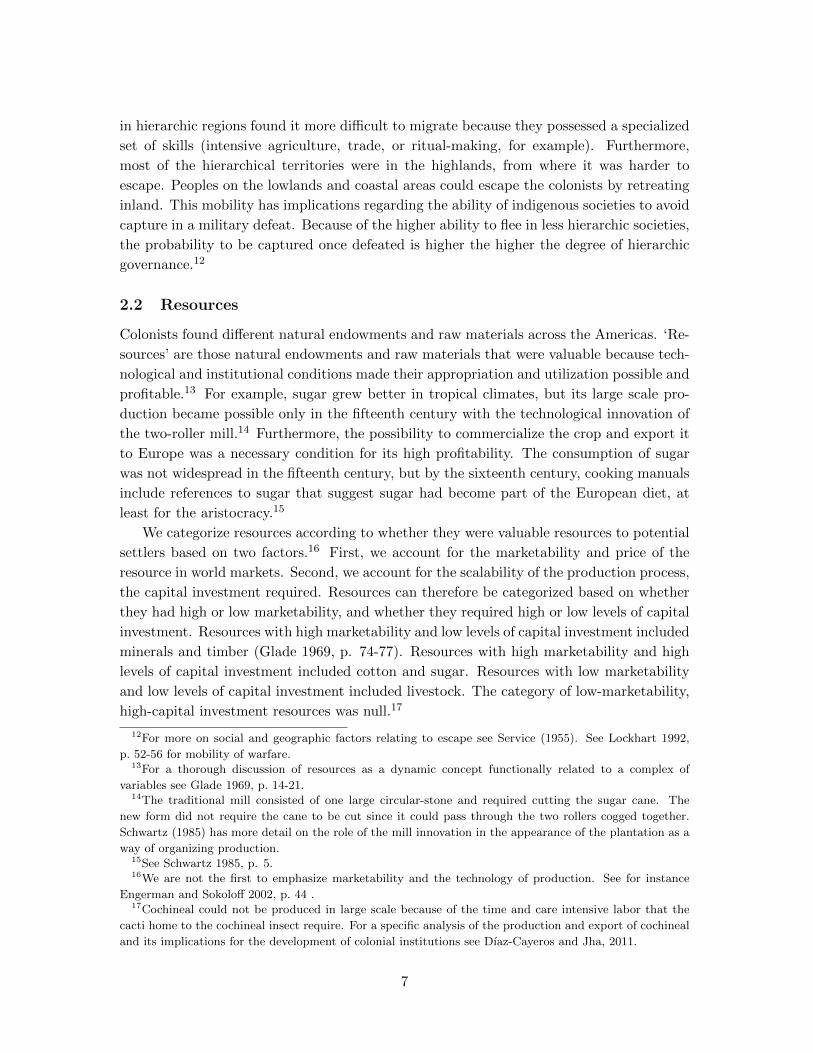
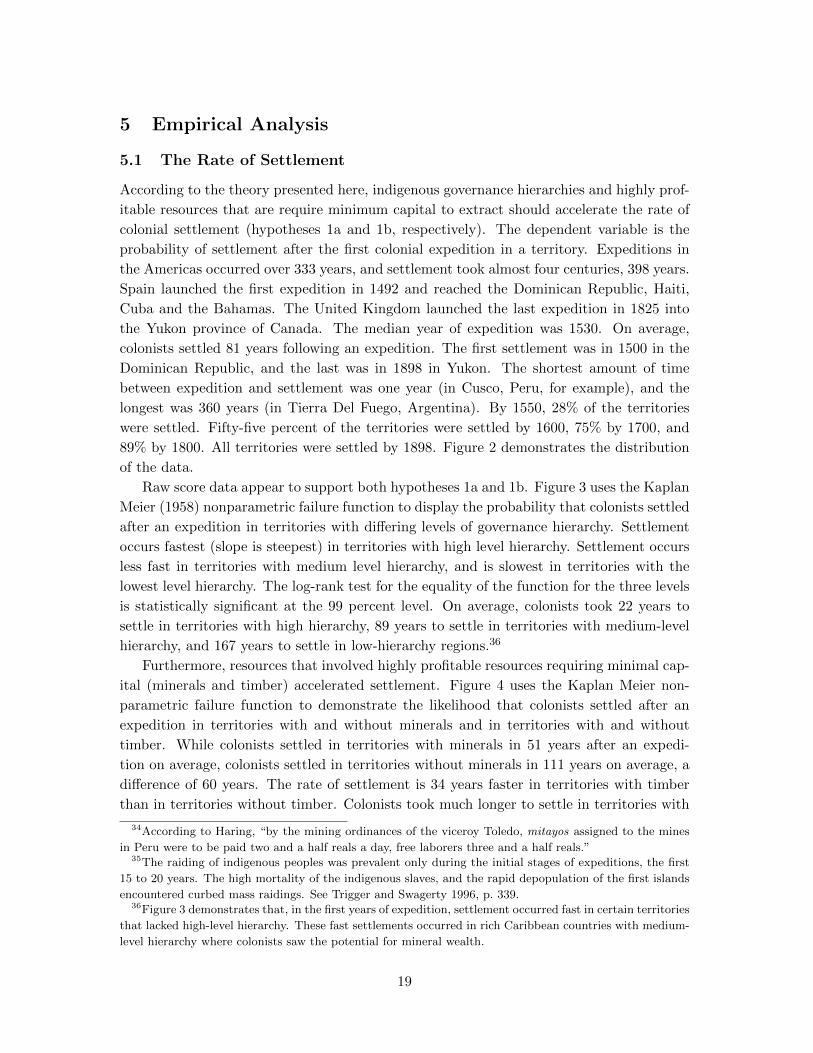
Raw score data appear to support both hypotheses 1a and 1b. Figure 3 uses the Kaplan
Meier (1958) nonparametric failure function to display the probability that colonists settled
after an expedition in territories with differing levels of governance hierarchy. Settlement
occurs fastest (slope is steepest) in territories with high level hierarchy. Settlement occurs
less fast in territories with medium level hierarchy, and is slowest in territories with the
lowest level hierarchy. The log-rank test for the equality of the function for the three levels
is statistically significant at the 99 percent level. On average, colonists took 22 years to
settle in territories with high hierarchy, 89 years to settle in territories with medium-level
hierarchy, and 167 years to settle in low-hierarchy regions.36
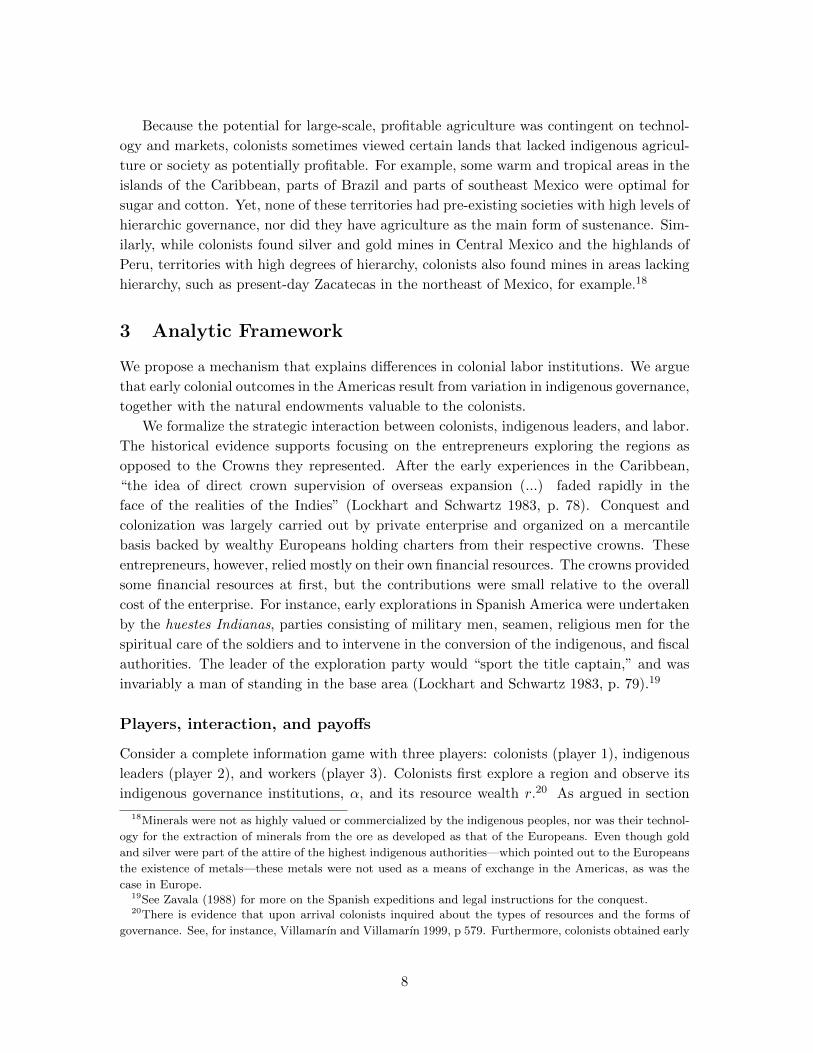
Furthermore, resources that involved highly profitable resources requiring minimal cap-
ital (minerals and timber) accelerated settlement. Figure 4 uses the Kaplan Meier non-
parametric failure function to demonstrate the likelihood that colonists settled after an
expedition in territories with and without minerals and in territories with and without
timber. While colonists settled in territories with minerals in 51 years after an expedi-
tion on average, colonists settled in territories without minerals in 111 years on average, a
difference of 60 years. The rate of settlement is 34 years faster in territories with timber
than in territories without timber. Colonists took much longer to settle in territories with
34According to Haring, “by the mining ordinances of the viceroy Toledo, mitayos assigned to the mines
in Peru were to be paid two and a half reals a day, free laborers three and a half reals.”35The raiding of indigenous peoples was prevalent only during the initial stages of expeditions, the first
15 to 20 years. The high mortality of the indigenous slaves, and the rapid depopulation of the first islands
encountered curbed mass raidings. See Trigger and Swagerty 1996, p. 339.36Figure 3 demonstrates that, in the first years of expedition, settlement occurred fast in certain territories
that lacked high-level hierarchy. These fast settlements occurred in rich Caribbean countries with medium-
level hierarchy where colonists saw the potential for mineral wealth.
19
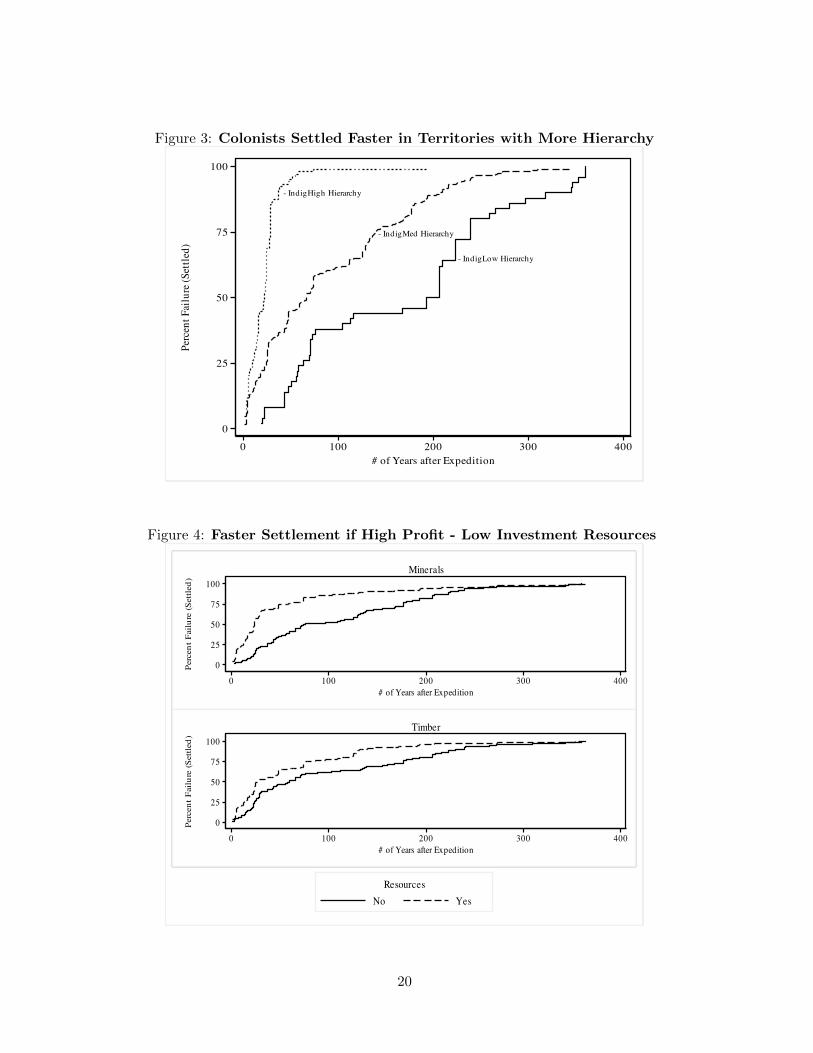
Figure 3: Colonists Settled Faster in Territories with More Hierarchy
- IndigLow Hierarchy
- IndigMed Hierarchy
- IndigHigh Hierarchy
0
25
50
75
100
Perc
ent F
ailu
re (S
ettle
d)
0 100 200 300 400# of Years after Expedition
Figure 4: Faster Settlement if High Profit - Low Investment Resources
0
25
50
75
100
Perc
ent F
ailu
re (S
ettle
d)
0 100 200 300 400# of Years after Expedition
Minerals
0
25
50
75
100
Perc
ent F
ailu
re (S
ettle
d)
0 100 200 300 400# of Years after Expedition
Timber
No YesResources
20
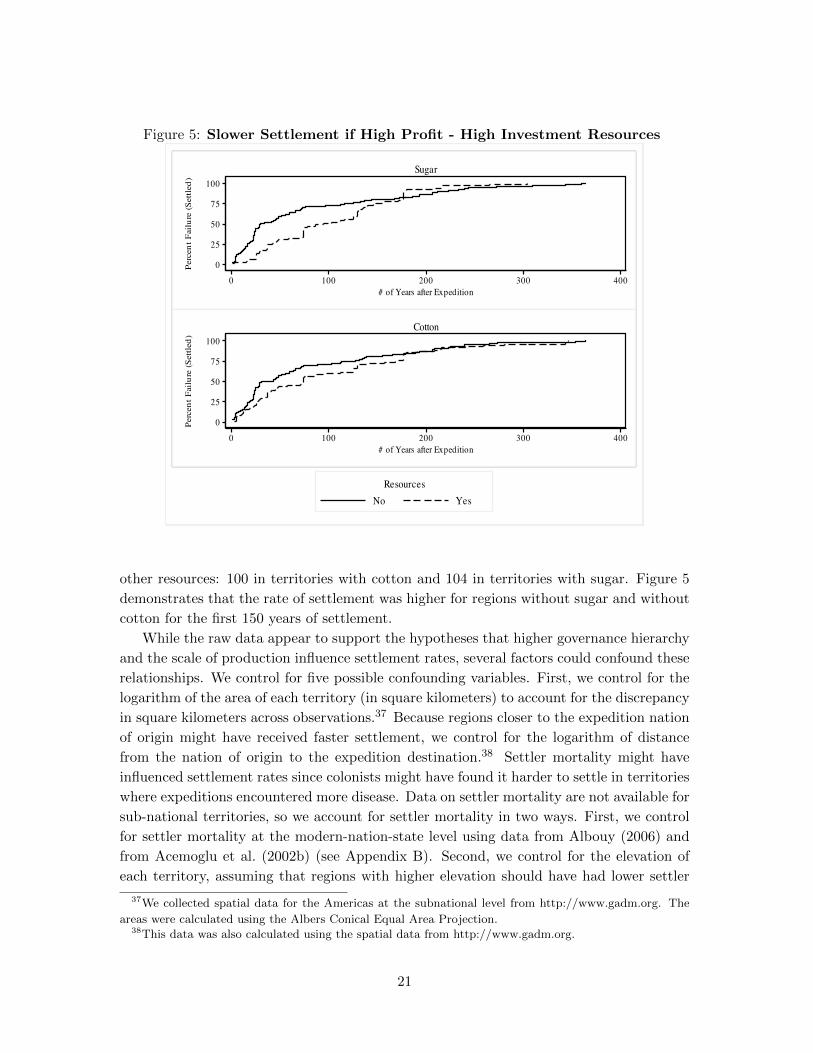
Figure 5: Slower Settlement if High Profit - High Investment Resources
0
25
50
75
100Pe
rcen
t Fai
lure
(Set
tled)
0 100 200 300 400# of Years after Expedition
Sugar
0
25
50
75
100
Perc
ent F
ailu
re (S
ettle
d)
0 100 200 300 400# of Years after Expedition
Cotton
No YesResources
other resources: 100 in territories with cotton and 104 in territories with sugar. Figure 5
demonstrates that the rate of settlement was higher for regions without sugar and without
cotton for the first 150 years of settlement.
While the raw data appear to support the hypotheses that higher governance hierarchy
and the scale of production influence settlement rates, several factors could confound these
relationships. We control for five possible confounding variables. First, we control for the
logarithm of the area of each territory (in square kilometers) to account for the discrepancy
in square kilometers across observations.37 Because regions closer to the expedition nation
of origin might have received faster settlement, we control for the logarithm of distance
from the nation of origin to the expedition destination.38 Settler mortality might have
influenced settlement rates since colonists might have found it harder to settle in territories
where expeditions encountered more disease. Data on settler mortality are not available for
sub-national territories, so we account for settler mortality in two ways. First, we control
for settler mortality at the modern-nation-state level using data from Albouy (2006) and
from Acemoglu et al. (2002b) (see Appendix B). Second, we control for the elevation of
each territory, assuming that regions with higher elevation should have had lower settler
37We collected spatial data for the Americas at the subnational level from http://www.gadm.org. The
areas were calculated using the Albers Conical Equal Area Projection.38This data was also calculated using the spatial data from http://www.gadm.org.
21
mortality. We also control for the absolute geographic latitude of each territory.39 Finally,
because the Spanish and British were the most prominent settlers in the Americas and
might have settled using systematically differing strategies, we code each territory for
Spanish expedition and British expedition. We code Spanish expedition as a binary variable
where each territory is coded as “1” if its first expedition was Spanish and zero otherwise.
We similarly code British expeditions as a binary variable where each territory as “1” if
its first expedition came from the United Kingdom and zero otherwise.
We analyze the influence of increasing indigenous governance hierarchy and differences
in resource wealth on the rate of colonial settlement by modeling the probability of settle-
ment (known as the hazard rate) after an expedition into the territories of the Americas (i).
We use a Cox proportional hazards duration model because it is non-parametric, and we
cannot assume that settlement increases, decreases or stays constant over time (equation
5):40
h(t|X) = h(t)exp{β1indig govi + β × resources + γ × controls + �i} (5)
The probability of settlement, represented by the hazard function h(t|X), depends on
indigenous governance hierarchy, the promise of resources, and the existence of sustenance.
The model includes a vector of control variables and an error term (�).
5.1.1 Results for Rate of Settlement
Table 1 demonstrates the influence of indigenous governance on the rate of colonial set-
tlement across the Americas (model 1). The coefficients can be interpreted by calculating
them as hazard ratios, or the probability of settlement for each independent variable hold-
ing the other variables constant. When an independent variable has a hazard ratio greater
than 1, the independent variable has a positive effect on the dependent variable. When the
hazard ratio is less than 1, the independent variable has a negative effect on the dependent
variable. In model 1, the hazard ratio of indigenous governance is 2.64. As indigenous
governance hierarchy increases, the rate of settlement more than doubles on average. The
result is statistically significant at the 99 percent level.41 Thus, the data confirm Hypothesis
1a that indigenous governance hierarchy accelerates colonial settlement.
The data also confirm Hypothesis 1b. Resources that were highly profitable and that
required minimum capital accelerated settlement more than other types of resources. Min-
erals and timber consistently positively influenced the rate of settlement and the effect is
39Results hold when we control for temperature instead of latitude (see Appendix B). Eleva-
tion is calculated as the mean elevation for each territory, using the Global Digital Elevation Model
(GTOPO30). We calculated latitude from the GADM spatial data and temperature using spatial data
from http://www.worldclim.org.40Results stay the same when using a parametric model, the Weibull distribution (Appendix B).41The standard deviation of indigenous governance is 0.6, relatively close to one. As a result, we take
the liberty to interpret the coefficients in indigenous governance as one unit increases. Results are similar
when running the model with separate binary variable for each category of indigenous governance hierarchy
(Appendix B). Results are also similar when running the model with indigenous labor organization or
indigenous tribute collection instead of indigenous governance hierarchy (Appendix B).
22
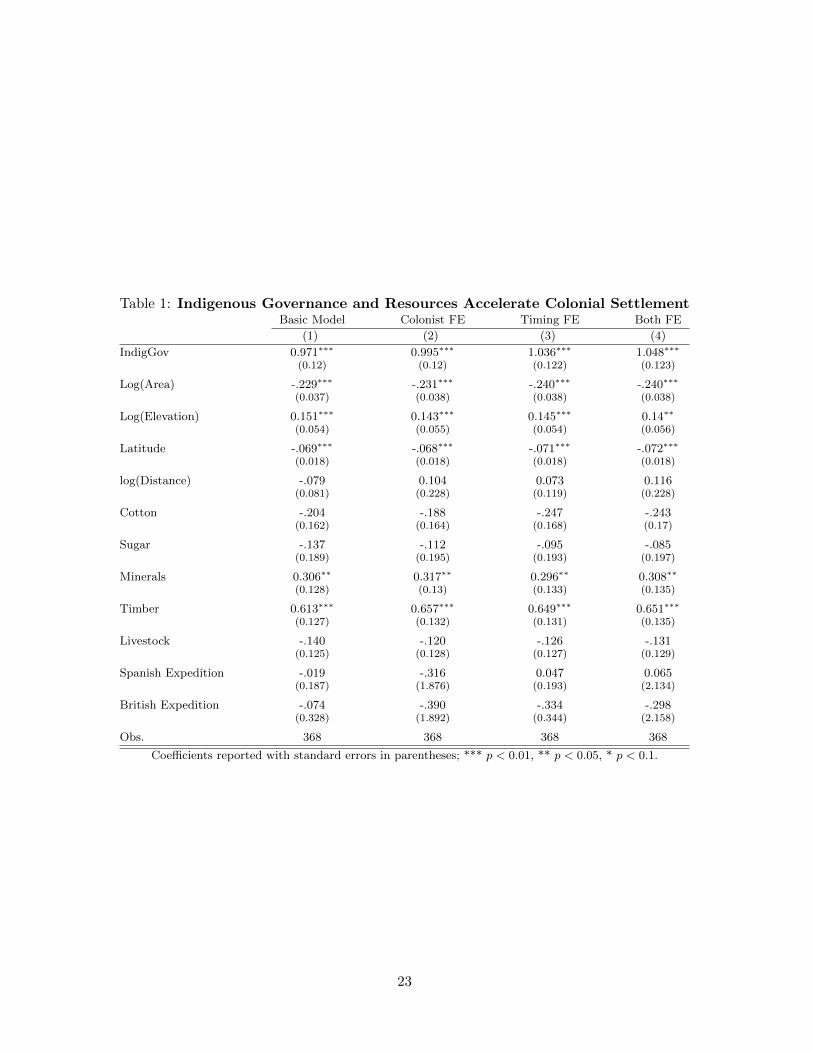
Table 1: Indigenous Governance and Resources Accelerate Colonial SettlementBasic Model Colonist FE Timing FE Both FE
(1) (2) (3) (4)
IndigGov 0.971∗∗∗ 0.995∗∗∗ 1.036∗∗∗ 1.048∗∗∗
(0.12) (0.12) (0.122) (0.123)
Log(Area) -.229∗∗∗ -.231∗∗∗ -.240∗∗∗ -.240∗∗∗
(0.037) (0.038) (0.038) (0.038)
Log(Elevation) 0.151∗∗∗ 0.143∗∗∗ 0.145∗∗∗ 0.14∗∗
(0.054) (0.055) (0.054) (0.056)
Latitude -.069∗∗∗ -.068∗∗∗ -.071∗∗∗ -.072∗∗∗
(0.018) (0.018) (0.018) (0.018)
log(Distance) -.079 0.104 0.073 0.116(0.081) (0.228) (0.119) (0.228)
Cotton -.204 -.188 -.247 -.243(0.162) (0.164) (0.168) (0.17)
Sugar -.137 -.112 -.095 -.085(0.189) (0.195) (0.193) (0.197)
Minerals 0.306∗∗ 0.317∗∗ 0.296∗∗ 0.308∗∗
(0.128) (0.13) (0.133) (0.135)
Timber 0.613∗∗∗ 0.657∗∗∗ 0.649∗∗∗ 0.651∗∗∗
(0.127) (0.132) (0.131) (0.135)
Livestock -.140 -.120 -.126 -.131(0.125) (0.128) (0.127) (0.129)
Spanish Expedition -.019 -.316 0.047 0.065(0.187) (1.876) (0.193) (2.134)
British Expedition -.074 -.390 -.334 -.298(0.328) (1.892) (0.344) (2.158)
Obs. 368 368 368 368
Coefficients reported with standard errors in parentheses; *** p < 0.01, ** p < 0.05, * p < 0.1.
23

statistically significant. Minerals accelerate settlement by 36% and timber accelerates it
by more than 85%.42
In conclusion, we find that indigenous institutions, minerals and timber accelerate the
rate of settlement holding five potentially confounding variables constant. There are two
important threats to validity, however. First, although the British or Spanish origin of the
expedition has no effect on the rate of settlement, other colonizers might still have been
better equipped to settle than others (France, Netherlands, and so on). Second, over time,
colonists might have become better equipped to settle. For example, the United States
might have had more technology and know-how to settle its hinterlands in the 1800s than
the Spanish in the same hinterlands in the 1500s. Models 2-4 in Table 1 address these
threats to validity. Model 2 includes fixed effects for the national origin of every country
that launched a first expedition into a territory of the Americas between 1492 and 1898.
Model 3 includes fixed effects for each 50-year period from 1450 to 1850. Model 4 includes
both sets of fixed effects. The results hold in the three additional models and remain
statistically significant at the 99 percent level.
5.2 Colonial Institutions
Hypothesis 2 states that colonial labor institutions should imitate indigenous institutions
when hierarchy in indigenous institutions is high (Hypothesis 2a) or as the resource promise
of a territory declines (Hypothesis 2b). It was also anticipated that colonists built new
forms of hierarchical labor arrangements as they discovered highly profitable resources in
territories with low hierarchy in indigenous institutions (Hypothesis 2c). Concretely, hy-
pothesis 2a implies that as hierarchy in indigenous institutions increase, the probability
of free labor institutions should decline and the probability of repartimientos, encomien-
das, and indigenous slavery should increase. Hypothesis 2b implies that when colonists
found the least profitable of the resources presented here (livestock) they were more likely
implement free labor institutions. Hypothesis 2c implies that when colonists found the
prospect of resources that were not exploited by indigenous peoples, but would become
highly profitable after capital investment, such as cotton or sugar, African slavery was
more likely.
Because any territory can contain more than one labor institution, we analyze colonists
choice to imitate or build new labor institutions by modeling the probability of each colonial
institution separately in each territory i using a logistic (logit) regression, equation 6:
logit(πi) = β0 + β1indig govi + β × resources + γ × controls + �i (6)
The probability depends on indigenous governance hierarchy, resources that are highly
profitable and easy to extract (minerals and timber), resources that are highly profitable
42One might ask whether territories with highly profitable resources and high levels of indigenous gov-
ernance may increase the rate of settlement most dramatically. These regions may have had the greatest
wealth, urbanization, and population densities, when colonists arrived. A control for population is coming
soon. We are still coding this.
24
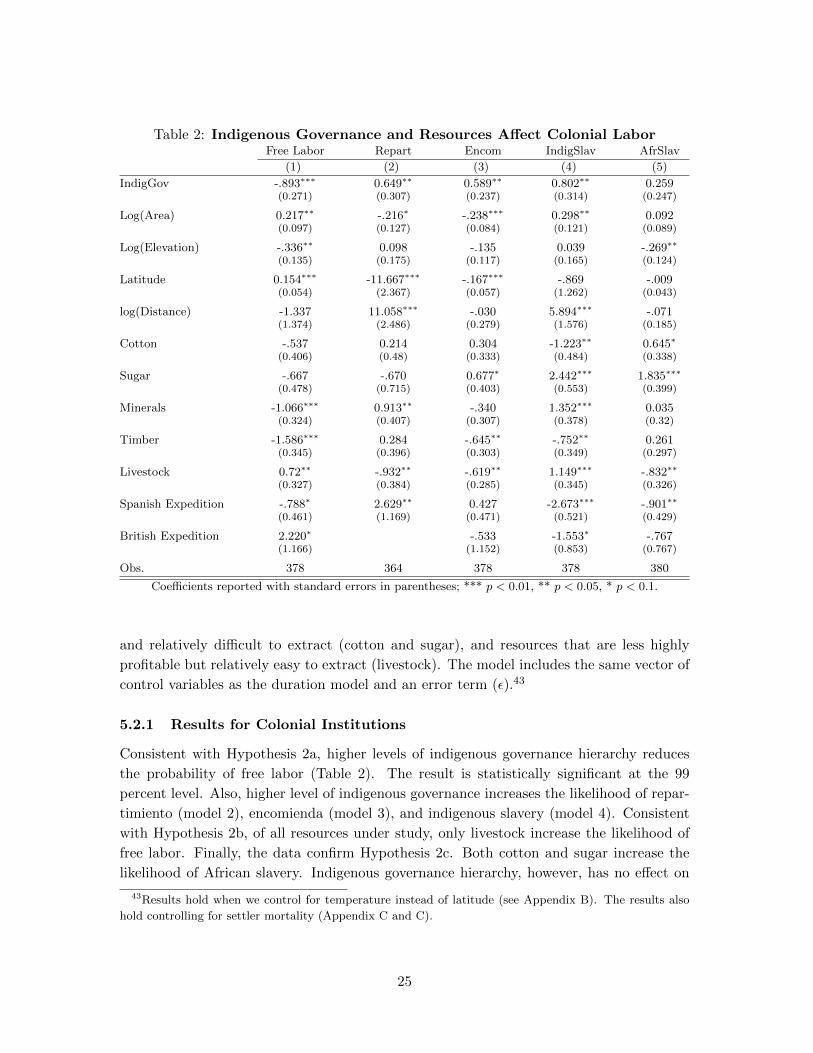
Table 2: Indigenous Governance and Resources Affect Colonial LaborFree Labor Repart Encom IndigSlav AfrSlav
(1) (2) (3) (4) (5)
IndigGov -.893∗∗∗ 0.649∗∗ 0.589∗∗ 0.802∗∗ 0.259(0.271) (0.307) (0.237) (0.314) (0.247)
Log(Area) 0.217∗∗ -.216∗ -.238∗∗∗ 0.298∗∗ 0.092(0.097) (0.127) (0.084) (0.121) (0.089)
Log(Elevation) -.336∗∗ 0.098 -.135 0.039 -.269∗∗
(0.135) (0.175) (0.117) (0.165) (0.124)
Latitude 0.154∗∗∗ -11.667∗∗∗ -.167∗∗∗ -.869 -.009(0.054) (2.367) (0.057) (1.262) (0.043)
log(Distance) -1.337 11.058∗∗∗ -.030 5.894∗∗∗ -.071(1.374) (2.486) (0.279) (1.576) (0.185)
Cotton -.537 0.214 0.304 -1.223∗∗ 0.645∗
(0.406) (0.48) (0.333) (0.484) (0.338)
Sugar -.667 -.670 0.677∗ 2.442∗∗∗ 1.835∗∗∗
(0.478) (0.715) (0.403) (0.553) (0.399)
Minerals -1.066∗∗∗ 0.913∗∗ -.340 1.352∗∗∗ 0.035(0.324) (0.407) (0.307) (0.378) (0.32)
Timber -1.586∗∗∗ 0.284 -.645∗∗ -.752∗∗ 0.261(0.345) (0.396) (0.303) (0.349) (0.297)
Livestock 0.72∗∗ -.932∗∗ -.619∗∗ 1.149∗∗∗ -.832∗∗
(0.327) (0.384) (0.285) (0.345) (0.326)
Spanish Expedition -.788∗ 2.629∗∗ 0.427 -2.673∗∗∗ -.901∗∗
(0.461) (1.169) (0.471) (0.521) (0.429)
British Expedition 2.220∗ -.533 -1.553∗ -.767(1.166) (1.152) (0.853) (0.767)
Obs. 378 364 378 378 380
Coefficients reported with standard errors in parentheses; *** p < 0.01, ** p < 0.05, * p < 0.1.
and relatively difficult to extract (cotton and sugar), and resources that are less highly
profitable but relatively easy to extract (livestock). The model includes the same vector of
control variables as the duration model and an error term (�).43
5.2.1 Results for Colonial Institutions
Consistent with Hypothesis 2a, higher levels of indigenous governance hierarchy reduces
the probability of free labor (Table 2). The result is statistically significant at the 99
percent level. Also, higher level of indigenous governance increases the likelihood of repar-
timiento (model 2), encomienda (model 3), and indigenous slavery (model 4). Consistent
with Hypothesis 2b, of all resources under study, only livestock increase the likelihood of
free labor. Finally, the data confirm Hypothesis 2c. Both cotton and sugar increase the
likelihood of African slavery. Indigenous governance hierarchy, however, has no effect on
43Results hold when we control for temperature instead of latitude (see Appendix B). The results also
hold controlling for settler mortality (Appendix C and C).
25
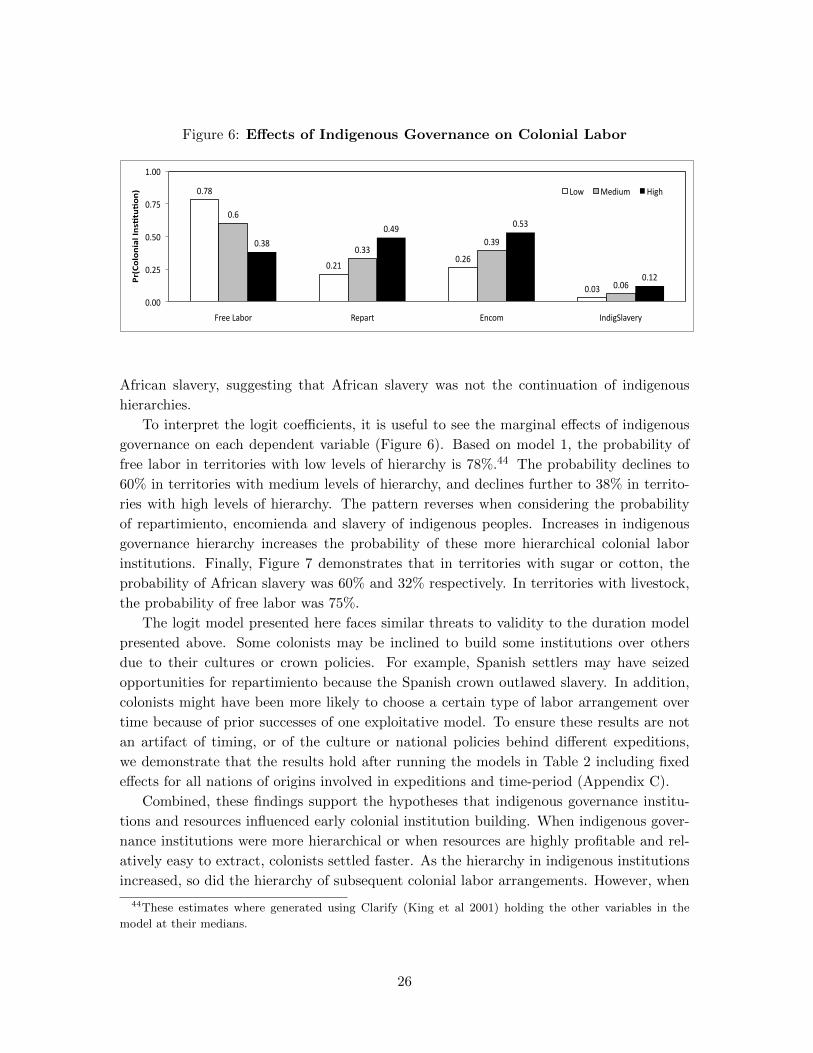
Figure 6: Effects of Indigenous Governance on Colonial Labor
!"#$%
!"&'%!"&(%
!"!)%
!"(%
!"))%!")*%
!"!(%
!")$%
!"+*% !",)%
!"'&%
!"!!%
!"&,%
!",!%
!"#,%
'"!!%
-.//%0123.% 4/51.6% 7893:% ;8<=>?@1A/.B%
!"#$%&%'()&*+',-./-%'0* 03C% D/<=E:% F=>G%
African slavery, suggesting that African slavery was not the continuation of indigenous
hierarchies.
To interpret the logit coefficients, it is useful to see the marginal effects of indigenous
governance on each dependent variable (Figure 6). Based on model 1, the probability of
free labor in territories with low levels of hierarchy is 78%.44 The probability declines to
60% in territories with medium levels of hierarchy, and declines further to 38% in territo-
ries with high levels of hierarchy. The pattern reverses when considering the probability
of repartimiento, encomienda and slavery of indigenous peoples. Increases in indigenous
governance hierarchy increases the probability of these more hierarchical colonial labor
institutions. Finally, Figure 7 demonstrates that in territories with sugar or cotton, the
probability of African slavery was 60% and 32% respectively. In territories with livestock,
the probability of free labor was 75%.
The logit model presented here faces similar threats to validity to the duration model
presented above. Some colonists may be inclined to build some institutions over others
due to their cultures or crown policies. For example, Spanish settlers may have seized
opportunities for repartimiento because the Spanish crown outlawed slavery. In addition,
colonists might have been more likely to choose a certain type of labor arrangement over
time because of prior successes of one exploitative model. To ensure these results are not
an artifact of timing, or of the culture or national policies behind different expeditions,
we demonstrate that the results hold after running the models in Table 2 including fixed
effects for all nations of origins involved in expeditions and time-period (Appendix C).
Combined, these findings support the hypotheses that indigenous governance institu-
tions and resources influenced early colonial institution building. When indigenous gover-
nance institutions were more hierarchical or when resources are highly profitable and rel-
atively easy to extract, colonists settled faster. As the hierarchy in indigenous institutions
increased, so did the hierarchy of subsequent colonial labor arrangements. However, when
44These estimates where generated using Clarify (King et al 2001) holding the other variables in the
model at their medians.
26
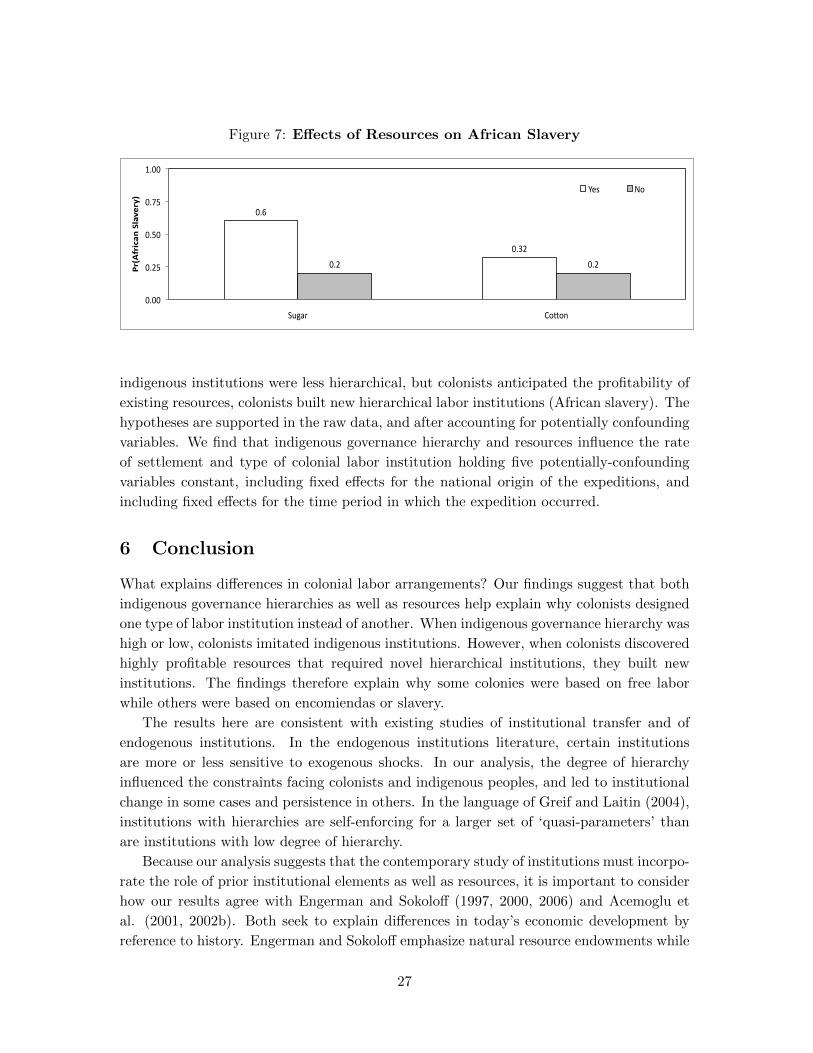
Figure 7: Effects of Resources on African Slavery
!"#$
!"%&$
!"&$ !"&$
!"!!$
!"&'$
!"'!$
!"('$
)"!!$
*+,-.$ /0102$
!"#$%"&'()
*+,(-."/0*
345$ 60$
indigenous institutions were less hierarchical, but colonists anticipated the profitability of
existing resources, colonists built new hierarchical labor institutions (African slavery). The
hypotheses are supported in the raw data, and after accounting for potentially confounding
variables. We find that indigenous governance hierarchy and resources influence the rate
of settlement and type of colonial labor institution holding five potentially-confounding
variables constant, including fixed effects for the national origin of the expeditions, and
including fixed effects for the time period in which the expedition occurred.
6 Conclusion
What explains differences in colonial labor arrangements? Our findings suggest that both
indigenous governance hierarchies as well as resources help explain why colonists designed
one type of labor institution instead of another. When indigenous governance hierarchy was
high or low, colonists imitated indigenous institutions. However, when colonists discovered
highly profitable resources that required novel hierarchical institutions, they built new
institutions. The findings therefore explain why some colonies were based on free labor
while others were based on encomiendas or slavery.
The results here are consistent with existing studies of institutional transfer and of
endogenous institutions. In the endogenous institutions literature, certain institutions
are more or less sensitive to exogenous shocks. In our analysis, the degree of hierarchy
influenced the constraints facing colonists and indigenous peoples, and led to institutional
change in some cases and persistence in others. In the language of Greif and Laitin (2004),
institutions with hierarchies are self-enforcing for a larger set of ‘quasi-parameters’ than
are institutions with low degree of hierarchy.
Because our analysis suggests that the contemporary study of institutions must incorpo-
rate the role of prior institutional elements as well as resources, it is important to consider
how our results agree with Engerman and Sokoloff (1997, 2000, 2006) and Acemoglu et
al. (2001, 2002b). Both seek to explain differences in today’s economic development by
reference to history. Engerman and Sokoloff emphasize natural resource endowments while
27
Acemoglu et al. emphasize settler mortality and prosperity. We demonstrate when and
how resource endowments and the indigenous institutions that likely supported prosperity
before colonists arrived, matter for future institutional development. Moreover, we suggest
that the history of institutions that is relevant for understanding differences in today’s
economic development predates European colonialism.
An open question that is beyond the scope of this paper is what are the conditions
and processes occurring since early history that led to indigenous governance hierarchies in
some regions of the Americas but not in others. Our findings point to physical geography
and the relative abundance of resources valued by specific societies at specific periods in
history as key factors leading to institutional divergence.
28
References
Acemoglu, Daron and Alexander Wolitzky, “The Economics of Labor Coercion,”
Massachusetts Institute of Technology, Department of Economics Working Paper Series,
2009.
and Simon Johnson, “Unbundling Institutions,” Journal of Political Economy, 2004,
113, 949–95.
, Marıa Angelica Bautista, Pablo Querubin, and James A. Robinson, “Eco-
nomic and Political Inequality in Development: The Case of Cundinamarca, Colombia,,”
in “Institutions and Economic Performance,” Harvard University Press, 2009.
, Simon Johnson, and James A. Robinson, “The Colonial Origins of Comparative
Development: an Empirical Investigation,” American Economic Review, 2001, 91, 1369–
1401.
, , and , “An African success story: Botswana,” CEPR Discussion Paper 3219,
2002.
, , and , “Reversal of Fortune: Geography and Institutions in the Making of the
Modern World Income Distribution,” Quarterly Journal of Economics, 2002, 117, 1231–
1294.
Adams, Richard E.W. and Murdo J. MacLeod, eds, The Cambridge History of the
Native Peoples of the Americas, Cambridge University Press, 2000.
Albouy, David, “The Colonial Origins of Comparative Development: An Investigation
of the Settler Mortality Data,” Center for International and Development Economics
Research, Working Paper Series 1055, 2006.
Bakewell, Peter John, Silver mining and society in colonial Mexico: Zacatecas, 1546-
1700, Cambridge University Press,, 1971.
Bardhan, Pranab, Scarcity, conflicts, and cooperation: essays in the political and insti-
tutional economics of development, Massachusetts: MIT Press, 2005.
Bartolome, Miguel A., “La identidad residencial en Mesoamerica: fronteras etnicas y
fronteras coloniales,” America Indıgena, 1992, 52 (1-2), 251–73.
Berkowitz, David, Katarina Pistor, and Jean-Francois Richard, “Economic devel-
opment, legality, and the transplant effect,” European Economic Review, 2003, 47 (1),
165–95.
Bethell, Leslie, Colonial Brazil, Cambridge University Press, 1987.
, ed., The Cambridge History of Latin America, Cambridge University Press, 1984.
29
Binmore, Ken, Ariel Rubinstein, and Asher Wolinsky, “The Nash Bargaining
solution in economic modelling,” Rand Journal of Economics, 1986, 17 (2).
Birmingham, David, Trade and empire in the Atlantic, 1400-1600, Routledge, 2000.
Bockstette, Valerie and Chanda L. Putterman, “States and Markets: The Advantage
of an Early Start,” Journal of Economic Growth, 2002, 7, 347–69.
Boone, Catherine, Political topographies of the African State: Territorial authority and
institutional choice, Cambridge University Press, 2003.
Boucher, Philip P., Cannibal Encounters: Europeans and Island Caribs, 1492-1763, The
Johns Hopkins University Press, 1992.
Bowles, Samuel, Steven N. Durlauf, and Karla Hoff, eds, Poverty Traps, Princeton
University Press, Russel Sage Foundation, 1986.
Bruhn, Miriam and Francisco A. Gallego, “Good, Bad and Ugly Colonial Activities:
Do They Matter for Economic Development?,” Working paper, 2009.
Burkholder, Mark A. and Lyman L. Johnson, Colonial Latin America, Oxford Uni-
versity Press, 2007.
Cline, Howard F., Handbook of MIddle American Indians, University of Texas Press,
Austin, 1972.
Cline, Sarah L., “Native Peoples of Colonial Central Mexico,” in Richard E.W. Adams
and Murdo J. MacLeod, eds., The Cambridge History of the Native Peoples of the Amer-
icas, Vol. II, Cambridge University Press, 2000.
Cortes, Hernan, Letters From Mexico, New Haven, Conn: Yale University Press, 1986.
Deeds, Susan M., “Legacies of Resistance, Adaptation, and Tenacity: History of the
Native Peoples of Northwest Mexico,” in “The Cambridge History of the Native Peoples
of the Americas,” Vol. II, Cambridge University Press, 2000.
Denevan, William M., ed., The Native Population of the Americas in 1492, The Uni-
versity of Wisconsin Press, 1992.
Diamond, Jared, Guns, Germs, and Steel: The Fate of Human Societies, W. W. Norton,
1997.
Domar, Evsey D., “The Causes of Slavery or Serfdom: A Hypothesis,” The Journal of
Economic History, Mar. 1970, 30 (1), 18–32.
Easterly, William and Ross Levine, “Tropics, germs, and crops: How endowments
influence economic development,” Journal of Monetary Economics, 2003, 50 (3-39).
30
Elliot, J. H., “Colonial Spanish America,” in Leslie Bethell, ed., Spain and America before
1700, Cambridge University Press, 1987.
Engerman, Stanley L. and Kenneth L. Sokoloff, “Factor Endowments, Institutions,
and Differential Paths of Growth Among New World Economies: A View from Economic
Historians of the United States,” in Stephen H. Haber, ed., How Latin America Fell
Behind, Stanford, Calif.: Stanford University Press, 1997.
and , “History Lessons: Institutions, Factor Endowments, and the Paths of Develop-
ment in the New World,” The Journal of Economic Perspectives, 2000, 14 (3), 217–232.
and , “Factor Endowments, Inequality, and Paths of Development among New World
Economies,” Economia, 2002, Fall.
and , “The Persistence of Poverty in the Americas: The Role of Institutions,” in
Samuel Bowles, Steven N. Durlauf, and Karla Hoff, eds., Poverty Traps, Princeton Uni-
versity Press, 2006.
Englebert, Pierre, “Pre-Colonial Institutions, Post-Colonial States, and Economic De-
velopment in Tropical Africa,” Political Research Quarterly, 2000, 53 (7-36).
Ertan, Ahran S. and Louis Putterman, “Determinants and Economic Consequences
of Colonization,” 2007. Mimeo, Brown University.
Galeson, D., “The Settlement and Growth of the Colonies,” in Stanley L. Engerman and
Gallman, eds., The Cambridge History of the United States, Cambridge University Press,
1996.
Gennaioli, Nicola and Ilia Rainer, “The modern impact of pre-colonial centralization
in Africa,” Journal of Economic Growth, 2007, 12, 185–234.
Gerhard, Peter, A Guide to the Historical Geography of New Spain, Cambridge Univer-
sity Press, 1972.
, A Guide to the Historical Geography of New Spain: Revised Edition, University of
Oklahoma Press, 1993.
Gibson, Charles, The Aztecs Under Spanish Rule, Stanford University Press, 1964.
and Pekham, eds, Attitudes of Colonial Powers toward the American Indian, Univer-
sity of Utah Press, 1969.
Glade, William P., The Latin American Economies: a study of their institutional evo-
lution, American Book, 1969.
Glaeser, Edward L., Rafael La Porta, Florencio Lopez-De-Silanes, and Andrei
Shleifer, “Do Institutions Cause Growth?,” Journal of Economic Growth, 2004, 9 (271-
303).
31
Greif, Avner, “Cultural beliefs and the organization of society: A historical and theoret-
ical reflection on collectivist and individualist societies,” Journal of Political Economy,
1994, 102, 912–50.
, Institutions and the Path to the Modern Economy: Lessons from Medieval Trade,
Cambridge University Press, 2006.
, “The Impact of Administrative Power on Political and Economic Development: Toward
a Political Economy of Implementation,” in Elhanan Helpman, ed., Institutions and
Economic Performance, Harvard University Press, 2008.
and David D. Laitin, “A Theory of Endogenous Institutional Change,” The American
Political Science Review, November 2004, 98 (4), 633–652.
Hall, Robert E. and Charles I. Jones, “Why Do Some Countries Produce So Much
More Output Per Worker than Others?,” Quarterly Journal of Economics, 1999, 114
(83-116).
Haring, C. H., The Spanish Empire: in America, Harbinger Books, 1963.
Iyer, Lakshmi, “Direct Versus Indirect Colonial Rule in India: Long-Term Conse-
quences,” Harvard Business School Working Paper, 2008, (05-041).
Kaplan, E. L. and Paul Meier, “Nonparametric Estimation from Incomplete Observa-
tions,” Journal of the American Statistics Association, 1958, 53 (282).
Krishna, Vijay and Roberto Serrano, “Multilateral Bargaining,” The Review of Eco-
nomic Studies, 1996, pp. 61–80.
la Porta, Rafael, Florencio Lopez-De-Silanes, Andrei Shleifer, and Robert
Vishny, “Legal Determinants of External Finance,” Journal of Finance, 1997, 52 (3),
1131–1150.
, , , and , “Law and Finance,” Journal of Political Economy, 1998, 106 (6),
1113–55.
Lange, Matthew, James Mahoney, and Matthias vom Hau, “Colonialism and
Development: A Comparative Analysis of Spanish and British Colonies,” American
Journal of Sociology, 2006, 111 (5).
Leon-Portilla, Miguel, Vision de los Vencidos, Historia 16, Madrid, 1985.
Lockhart, James, The Nahuas after the Conquest, Stanford University Press, 1992.
and Stuart B. Schwartz, Early Latin America: a history of colonial Spanish America
and Brazil, Cambridge University Press, 1983.
Lovell, William George, Conquest and survival in colonial Guatemala: a historical
geography of the Cuchumatan Highlands, 1500-1821, McGill-Queen’s Press, 2005.
32
Macleod, Murdo J., “Aspects of the Internal Economy,” in Leslie Bethell, ed., Colonial
Spanish America, Cambridge University Press, 1987.
, “Mesoamerica Since the Spanish Invasion: an Overview,” in Richard E.W. Adams and
Murdo J. MacLeod, eds., The Cambridge History of the Native Peoples of the Americas,
Vol. II, Cambridge University Press, 2000.
Mahoney, James, Colonialism and Postcolonial Development: Spanish America in Com-
parative Perspective, Cambridge University Press, 2010.
Malinowski, Sharon and Anna Sheets, eds, The Gale Encyclopedia of Native Amer-
ican Tribes, Thomson Gale, 1998.
Morales-Padron, F., Atlas Historico Cultural de America, Consejerıa Cultural y De-
portes, Gobierno de Canarias, 1988.
Nash, John F., “The bargaining problem,” Econometrica, 1950, 18 (155-62).
, “Two-Person Cooperative Games,” Econometrica, 1953, 21 (128-40).
Newson, Linda A., “Indian Population Patterns in Colonial Spanish America,” Latin
American Research Review, 1985, 2 (3), 41–74.
, Indian Survival in Colonial Nicaragua, University of Oklahoma Press, 1987.
, Life and Death in Early Colonial Ecuador, University of Oklahoma Press, 1995.
Nunn, Nathan, “The Importance of History for Economic Development,” Annual Review
of Economics, 2009, 1, 65–95.
and Leonard Wantchekon, “The Trans-Atlantic Slave Trade and the Evolution of
Mistrust in Africa: An Empirical Analysis,” Afrobarometer Working Papers, 2008, (100).
Osgood, Herbert, The American Colonies in the 17th Century., Columbia University,
1904-07.
Pierson, Paul and Theda Skocpol, “Historical Institutionalism in Contemporary Po-
litical Science,” Political Science: State of the Discipline, 2002.
Przeworsky, Adam, “The Last Instance: Are Institutions the Primary Cause of Eco-
nomic Development?,” European Journal of Sociology, 2004, 45 (2), 165–188.
Rabushka, Alvin, Taxation in Colonial America, Princeton University Press, 2008.
Rodrik, D., A. Subramanian, and F. Trebbi, “Institutions Rule: The Primacy of
Institutions over Geography and Integration in Economic Development,” Journal of Eco-
nomic Growth, 2004, 9 (2).
Rubinstein, A., “Perfect Equilibrium in a Bargaining Model,” Econometrica, 1982, 50.
33
Sachs, Jeffrey D., “Notes on a New Sociology of Economic Development,” in Lawrence E.
Harrison and Samuel P. Huntington, eds., Culture Matters: How Values Shape Human
Progress, New York, NY: Basic Books, 2000.
, “Tropical Underdevelopment,” NBER Working Paper, 2001, 8119.
Sanders, William T. and Joseph Marino, New world prehistory; archaeology of the
American Indian, Englewood Cliffs, N.J., Prentice-Hall, 1970.
Schwartz, Stuart B., “Indian Labor and New World Plantations: European Demands
and Indian Responses in Northeastern Brazil,” The American Historical Review, 1978,
83 (1).
, Sugar Plantations in the Formation of Brazilian Society: Bahia, 1550-1835, Cambridge
University Press, 1985.
Service, Elman R., “Indian-European Relations in Colonial Latin America,” American
Anthropologist, New Series, 1955, 57 (3), 411–425.
Sokolow, Jayme A., The great encounter: native peoples and European settlers in the
Americas, 1492-1800, M.E. Sharpe, 2003.
Steward, Julian H., ed., Handbook of South American Indians, Vol. 3-5, Bureau of
American Ethnology, Smithsonian Institution, 1946.
Tandeter, Enrique, Coercion and Market: Silver Mining in Colonial Potosi 1692-1826,
University of New Mexico Press, 1993.
Tella, Rafael Di, Sebastian Galiani, and Ernesto Schargrodsky, “The Formation
of Beliefs: Evidence from the Allocation of Land Titles to Squatters,” Quarterly Journal
of Economics, 2007, 122 (1), 209–41.
Thelen, Kathleen, “Historical Institutionalism in Comparative Politics,” Annual Review
of Political Science, 1999, 2.
, How Institutions Evolve: The Political Economy of Skills in Germany, Britain, the
United States, and Japan, Cambridge University Press, 2004.
Trigger, Bruce G. and William R. Swagerty, “Entertaining Strangers: North Amer-
ica in the Sixteenth Century,” in Bruce G. Trigger and Wilcomb E. Washburn, eds.,
The Cambridge History of the Native Peoples of the Americas, Vol. I: North America,
Cambridge University Press, 1996.
Villamarın, Juan A. and Judith E. Villamarın, Indian Labor in Mainland Colonial
Spanish America, University of Delaware, 1975.
34
and , “Chiefdoms: The prevalence and persistence of “Senorıos Naturales” 1400 to
European conquest,” in Frank Saloman and Stuart B. Schwartz, eds., The Cambridge
History of the Native Peoples of the Americas, Vol. 3, Cambridge University Press, 1999.
Weber, Max, The Protestant Ethic and the Spirit of Capitalism, Scribner, New York,
1958.
Young, Eric Van, ed., Mexico’s Regions: Comparative History and Development, Center
for U.S.-Mexican Studies, UC San Diego, 1992.
Zavala, Silvio Arturo, Las instituciones jurıdicas en la conquista de America, Mexico:
Editorial Porrua, 1988.
Zeitlin, Judith F., “Ranchers and Indians on the Southern Isthmus of Tehuantepec:
Economic Change and Indigenous Survival in Colonial Mexico,” The Hispanic American
Historical Review, 1989, 69 (1), 23–60.
35

A Descriptive Statistics
Appendix Table A1: Descriptive Statistics
Variable N Mean SD Min Max
IndigLabor 434 1.19 0.65 0 2
IndigTribute 425 0.83 0.91 0 2
IndigGov 425 1.15 0.60 0 2
Minerals 411 0.48 0.50 0 1
Timber 410 0.43 50 0 1
Cotton 411 0.27 0.45 0 1
Sugar 411 0.19 0.39 0 1
Livestock 411 0.35 0.48 0 1
log(Area) 436 9.87 1.87 4.54 14.56
log(Elevation) 436 5.92 1.32 2.30 8.27
Latitude 437 1.40 4.60 0.22 51.74
log(Distance) 415 9.10 0.60 2.30 9.77
Spanish Expedition 419 0.85 0.32 0 1
British Expedition 419 0.04 0.19 0 1
Free Labor 425 0.42 0.49 0 1
Repartimiento 425 0.38 0.49 0 1
Encomienda 425 0.28 0.45 0 1
IndigSlavery 425 0.30 0.46 0 1
AfrSlavery 425 0.22 0.41 0 1
Appendix Table A2: Cross-tabulation of frequencies by colonial institution
Free labor Repart Encom IndigSlavery AfrSlavery
Free Labor 178 11 23 17 44
Repart 163 25 42 35
Encom 117 35 40
IndigSlavery 93 46
AfrSlavery 130
Note: The diagonal indicates the total frequencies for each colonial institution.
36
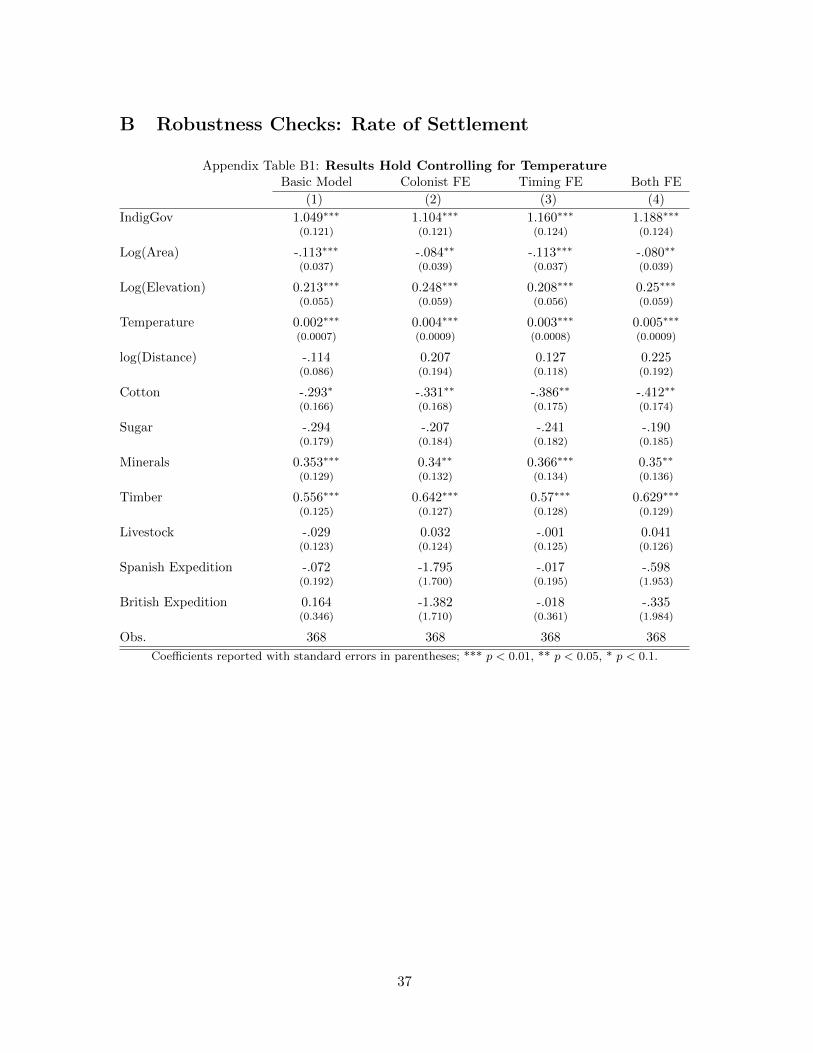
B Robustness Checks: Rate of Settlement
Appendix Table B1: Results Hold Controlling for TemperatureBasic Model Colonist FE Timing FE Both FE
(1) (2) (3) (4)
IndigGov 1.049∗∗∗ 1.104∗∗∗ 1.160∗∗∗ 1.188∗∗∗
(0.121) (0.121) (0.124) (0.124)
Log(Area) -.113∗∗∗ -.084∗∗ -.113∗∗∗ -.080∗∗
(0.037) (0.039) (0.037) (0.039)
Log(Elevation) 0.213∗∗∗ 0.248∗∗∗ 0.208∗∗∗ 0.25∗∗∗
(0.055) (0.059) (0.056) (0.059)
Temperature 0.002∗∗∗ 0.004∗∗∗ 0.003∗∗∗ 0.005∗∗∗
(0.0007) (0.0009) (0.0008) (0.0009)
log(Distance) -.114 0.207 0.127 0.225
(0.086) (0.194) (0.118) (0.192)
Cotton -.293∗ -.331∗∗ -.386∗∗ -.412∗∗
(0.166) (0.168) (0.175) (0.174)
Sugar -.294 -.207 -.241 -.190
(0.179) (0.184) (0.182) (0.185)
Minerals 0.353∗∗∗ 0.34∗∗ 0.366∗∗∗ 0.35∗∗
(0.129) (0.132) (0.134) (0.136)
Timber 0.556∗∗∗ 0.642∗∗∗ 0.57∗∗∗ 0.629∗∗∗
(0.125) (0.127) (0.128) (0.129)
Livestock -.029 0.032 -.001 0.041
(0.123) (0.124) (0.125) (0.126)
Spanish Expedition -.072 -1.795 -.017 -.598
(0.192) (1.700) (0.195) (1.953)
British Expedition 0.164 -1.382 -.018 -.335
(0.346) (1.710) (0.361) (1.984)
Obs. 368 368 368 368
Coefficients reported with standard errors in parentheses; *** p < 0.01, ** p < 0.05, * p < 0.1.
37
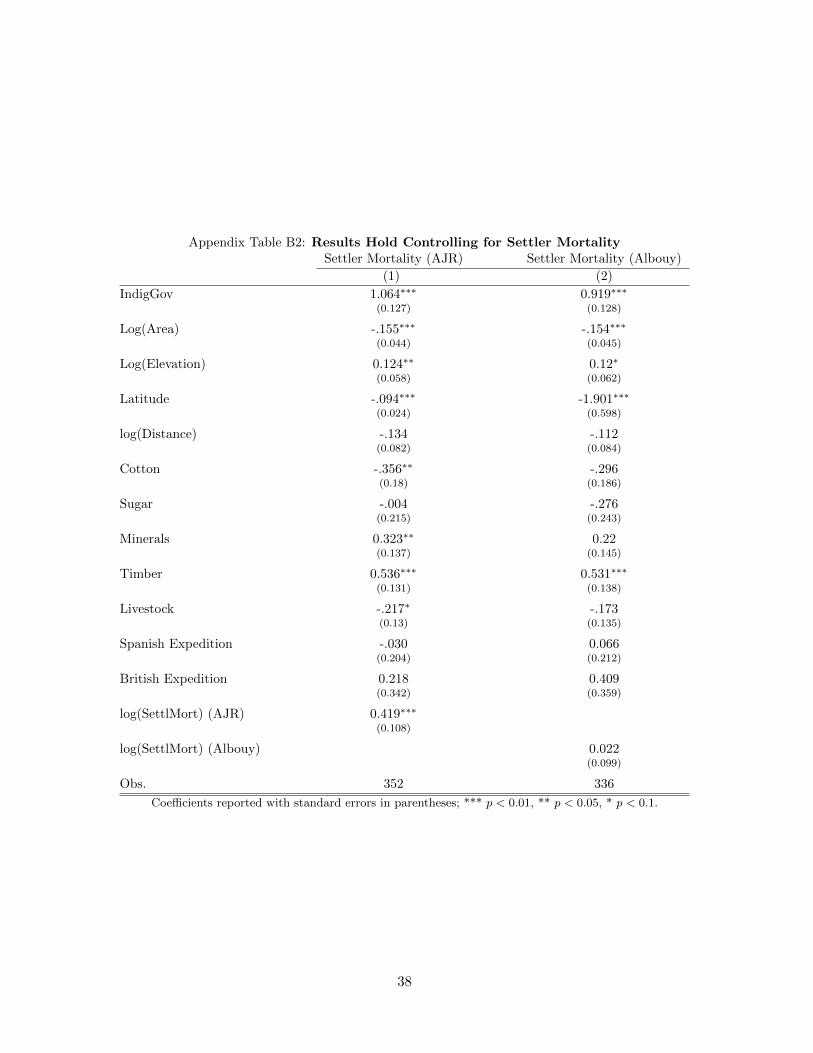
Appendix Table B2: Results Hold Controlling for Settler MortalitySettler Mortality (AJR) Settler Mortality (Albouy)
(1) (2)
IndigGov 1.064∗∗∗ 0.919∗∗∗
(0.127) (0.128)
Log(Area) -.155∗∗∗ -.154∗∗∗
(0.044) (0.045)
Log(Elevation) 0.124∗∗ 0.12∗
(0.058) (0.062)
Latitude -.094∗∗∗ -1.901∗∗∗
(0.024) (0.598)
log(Distance) -.134 -.112
(0.082) (0.084)
Cotton -.356∗∗ -.296
(0.18) (0.186)
Sugar -.004 -.276
(0.215) (0.243)
Minerals 0.323∗∗ 0.22
(0.137) (0.145)
Timber 0.536∗∗∗ 0.531∗∗∗
(0.131) (0.138)
Livestock -.217∗ -.173
(0.13) (0.135)
Spanish Expedition -.030 0.066
(0.204) (0.212)
British Expedition 0.218 0.409
(0.342) (0.359)
log(SettlMort) (AJR) 0.419∗∗∗
(0.108)
log(SettlMort) (Albouy) 0.022
(0.099)
Obs. 352 336
Coefficients reported with standard errors in parentheses; *** p < 0.01, ** p < 0.05, * p < 0.1.
38
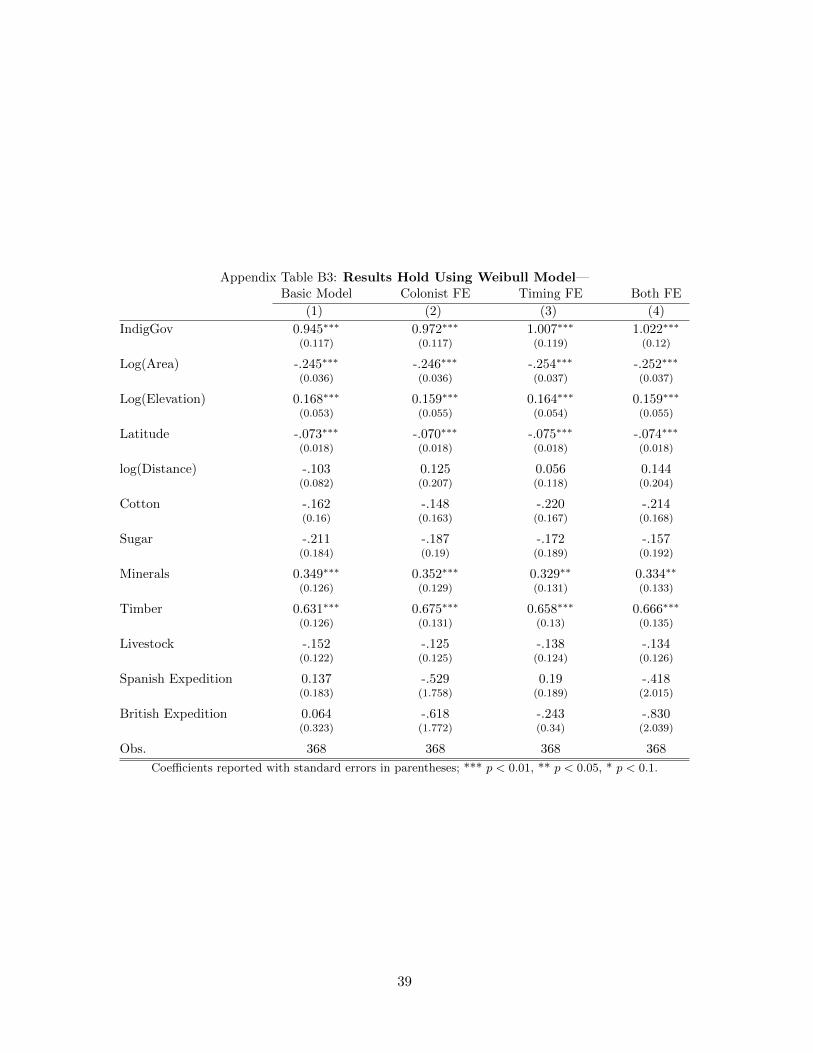
Appendix Table B3: Results Hold Using Weibull Model—Basic Model Colonist FE Timing FE Both FE
(1) (2) (3) (4)
IndigGov 0.945∗∗∗ 0.972∗∗∗ 1.007∗∗∗ 1.022∗∗∗
(0.117) (0.117) (0.119) (0.12)
Log(Area) -.245∗∗∗ -.246∗∗∗ -.254∗∗∗ -.252∗∗∗
(0.036) (0.036) (0.037) (0.037)
Log(Elevation) 0.168∗∗∗ 0.159∗∗∗ 0.164∗∗∗ 0.159∗∗∗
(0.053) (0.055) (0.054) (0.055)
Latitude -.073∗∗∗ -.070∗∗∗ -.075∗∗∗ -.074∗∗∗
(0.018) (0.018) (0.018) (0.018)
log(Distance) -.103 0.125 0.056 0.144
(0.082) (0.207) (0.118) (0.204)
Cotton -.162 -.148 -.220 -.214
(0.16) (0.163) (0.167) (0.168)
Sugar -.211 -.187 -.172 -.157
(0.184) (0.19) (0.189) (0.192)
Minerals 0.349∗∗∗ 0.352∗∗∗ 0.329∗∗ 0.334∗∗
(0.126) (0.129) (0.131) (0.133)
Timber 0.631∗∗∗ 0.675∗∗∗ 0.658∗∗∗ 0.666∗∗∗
(0.126) (0.131) (0.13) (0.135)
Livestock -.152 -.125 -.138 -.134
(0.122) (0.125) (0.124) (0.126)
Spanish Expedition 0.137 -.529 0.19 -.418
(0.183) (1.758) (0.189) (2.015)
British Expedition 0.064 -.618 -.243 -.830
(0.323) (1.772) (0.34) (2.039)
Obs. 368 368 368 368
Coefficients reported with standard errors in parentheses; *** p < 0.01, ** p < 0.05, * p < 0.1.
39
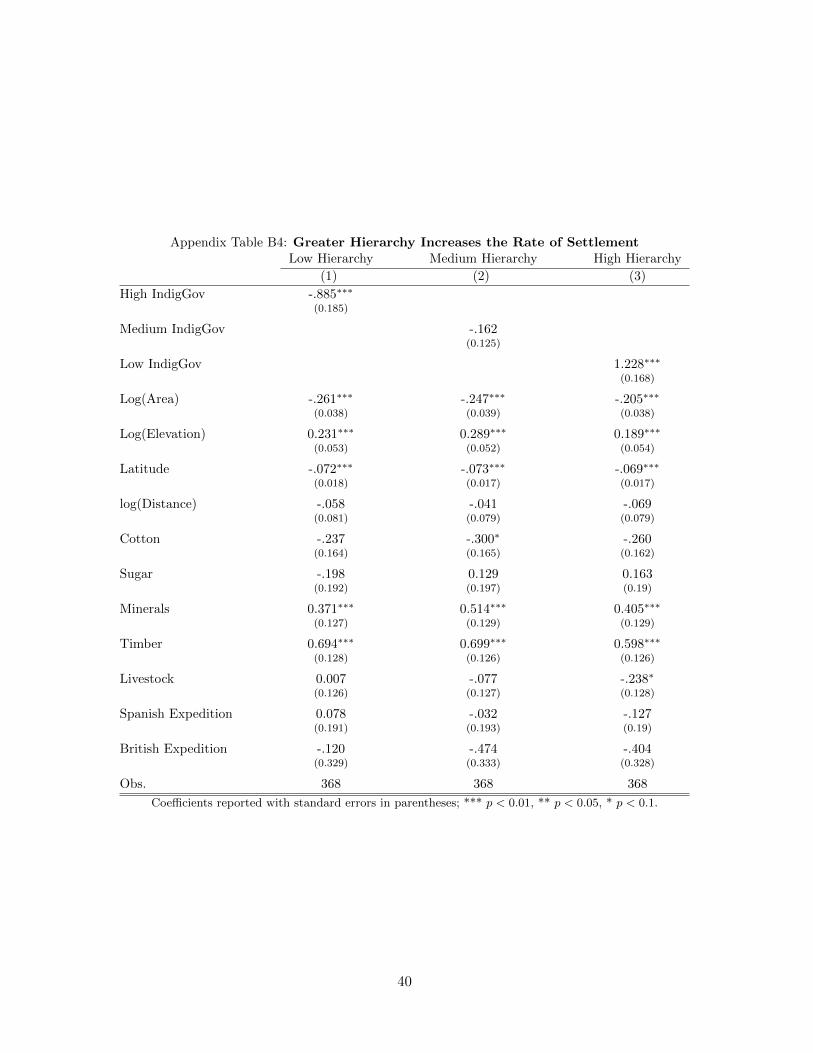
Appendix Table B4: Greater Hierarchy Increases the Rate of SettlementLow Hierarchy Medium Hierarchy High Hierarchy
(1) (2) (3)
High IndigGov -.885∗∗∗
(0.185)
Medium IndigGov -.162
(0.125)
Low IndigGov 1.228∗∗∗
(0.168)
Log(Area) -.261∗∗∗ -.247∗∗∗ -.205∗∗∗
(0.038) (0.039) (0.038)
Log(Elevation) 0.231∗∗∗ 0.289∗∗∗ 0.189∗∗∗
(0.053) (0.052) (0.054)
Latitude -.072∗∗∗ -.073∗∗∗ -.069∗∗∗
(0.018) (0.017) (0.017)
log(Distance) -.058 -.041 -.069
(0.081) (0.079) (0.079)
Cotton -.237 -.300∗ -.260
(0.164) (0.165) (0.162)
Sugar -.198 0.129 0.163
(0.192) (0.197) (0.19)
Minerals 0.371∗∗∗ 0.514∗∗∗ 0.405∗∗∗
(0.127) (0.129) (0.129)
Timber 0.694∗∗∗ 0.699∗∗∗ 0.598∗∗∗
(0.128) (0.126) (0.126)
Livestock 0.007 -.077 -.238∗
(0.126) (0.127) (0.128)
Spanish Expedition 0.078 -.032 -.127
(0.191) (0.193) (0.19)
British Expedition -.120 -.474 -.404
(0.329) (0.333) (0.328)
Obs. 368 368 368
Coefficients reported with standard errors in parentheses; *** p < 0.01, ** p < 0.05, * p < 0.1.
40
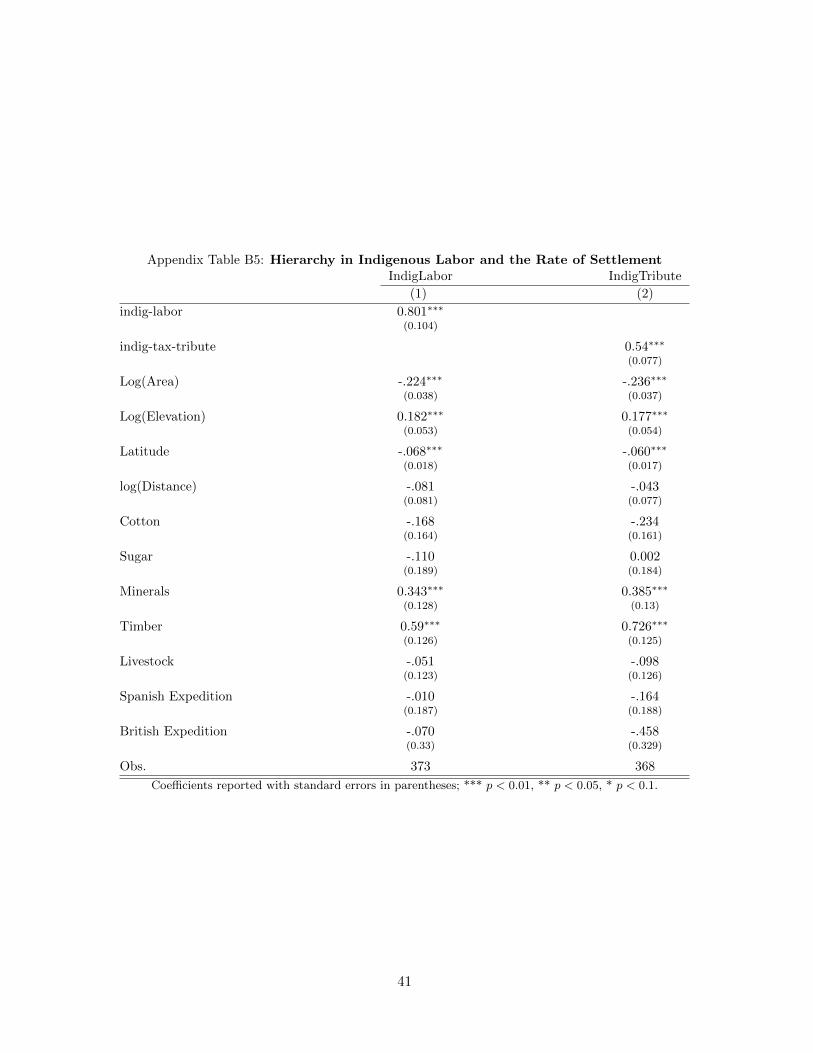
Appendix Table B5: Hierarchy in Indigenous Labor and the Rate of SettlementIndigLabor IndigTribute
(1) (2)
indig-labor 0.801∗∗∗
(0.104)
indig-tax-tribute 0.54∗∗∗
(0.077)
Log(Area) -.224∗∗∗ -.236∗∗∗
(0.038) (0.037)
Log(Elevation) 0.182∗∗∗ 0.177∗∗∗
(0.053) (0.054)
Latitude -.068∗∗∗ -.060∗∗∗
(0.018) (0.017)
log(Distance) -.081 -.043
(0.081) (0.077)
Cotton -.168 -.234
(0.164) (0.161)
Sugar -.110 0.002
(0.189) (0.184)
Minerals 0.343∗∗∗ 0.385∗∗∗
(0.128) (0.13)
Timber 0.59∗∗∗ 0.726∗∗∗
(0.126) (0.125)
Livestock -.051 -.098
(0.123) (0.126)
Spanish Expedition -.010 -.164
(0.187) (0.188)
British Expedition -.070 -.458
(0.33) (0.329)
Obs. 373 368
Coefficients reported with standard errors in parentheses; *** p < 0.01, ** p < 0.05, * p < 0.1.
41
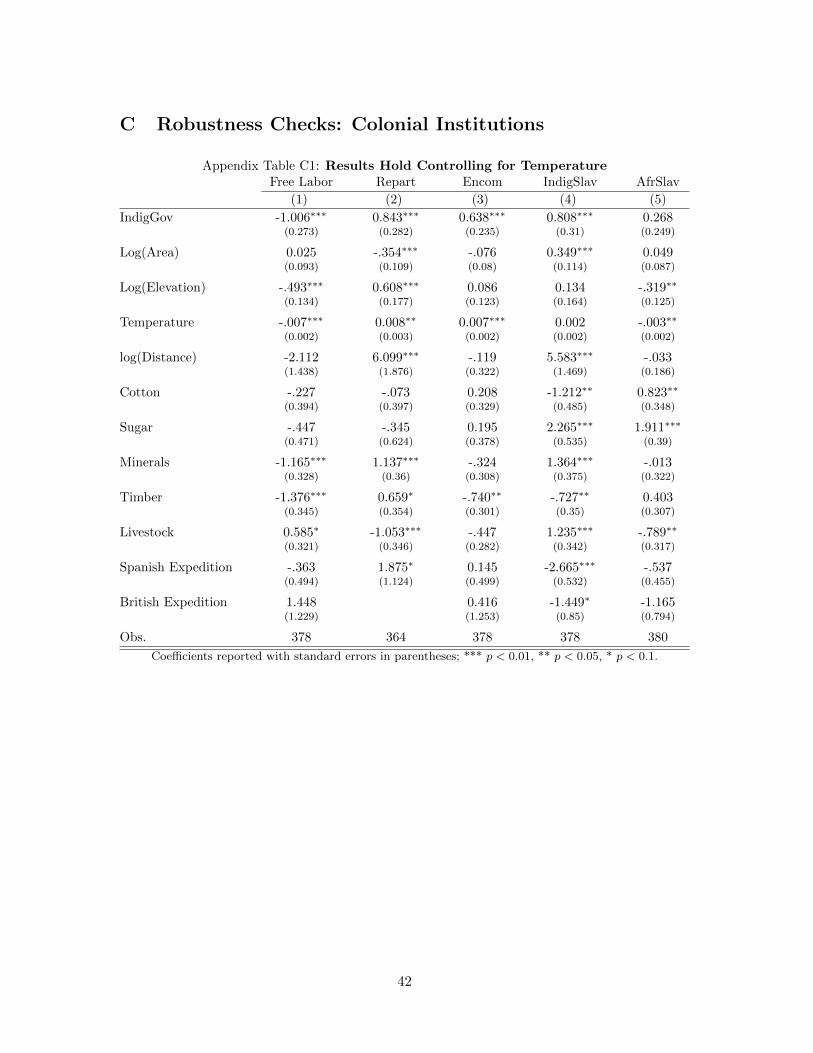
C Robustness Checks: Colonial Institutions
Appendix Table C1: Results Hold Controlling for TemperatureFree Labor Repart Encom IndigSlav AfrSlav
(1) (2) (3) (4) (5)
IndigGov -1.006∗∗∗ 0.843∗∗∗ 0.638∗∗∗ 0.808∗∗∗ 0.268
(0.273) (0.282) (0.235) (0.31) (0.249)
Log(Area) 0.025 -.354∗∗∗ -.076 0.349∗∗∗ 0.049
(0.093) (0.109) (0.08) (0.114) (0.087)
Log(Elevation) -.493∗∗∗ 0.608∗∗∗ 0.086 0.134 -.319∗∗
(0.134) (0.177) (0.123) (0.164) (0.125)
Temperature -.007∗∗∗ 0.008∗∗ 0.007∗∗∗ 0.002 -.003∗∗
(0.002) (0.003) (0.002) (0.002) (0.002)
log(Distance) -2.112 6.099∗∗∗ -.119 5.583∗∗∗ -.033
(1.438) (1.876) (0.322) (1.469) (0.186)
Cotton -.227 -.073 0.208 -1.212∗∗ 0.823∗∗
(0.394) (0.397) (0.329) (0.485) (0.348)
Sugar -.447 -.345 0.195 2.265∗∗∗ 1.911∗∗∗
(0.471) (0.624) (0.378) (0.535) (0.39)
Minerals -1.165∗∗∗ 1.137∗∗∗ -.324 1.364∗∗∗ -.013
(0.328) (0.36) (0.308) (0.375) (0.322)
Timber -1.376∗∗∗ 0.659∗ -.740∗∗ -.727∗∗ 0.403
(0.345) (0.354) (0.301) (0.35) (0.307)
Livestock 0.585∗ -1.053∗∗∗ -.447 1.235∗∗∗ -.789∗∗
(0.321) (0.346) (0.282) (0.342) (0.317)
Spanish Expedition -.363 1.875∗ 0.145 -2.665∗∗∗ -.537
(0.494) (1.124) (0.499) (0.532) (0.455)
British Expedition 1.448 0.416 -1.449∗ -1.165
(1.229) (1.253) (0.85) (0.794)
Obs. 378 364 378 378 380
Coefficients reported with standard errors in parentheses; *** p < 0.01, ** p < 0.05, * p < 0.1.
42

Appendix Table C2: Results Hold Controlling for Settler Mortality (AJR)Free Labor Repart Encom IndigSlav AfrSlav
(1) (2) (3) (4) (5)
IndigGov -.886∗∗∗ 0.645∗∗ 0.6∗∗ 0.822∗∗∗ 0.213
(0.277) (0.31) (0.241) (0.315) (0.255)
Log(Area) 0.171 -.116 -.340∗∗∗ 0.364∗∗∗ -.005
(0.111) (0.136) (0.094) (0.122) (0.1)
Log(Elevation) -.257∗ 0.174 -.101 0.017 -.285∗∗
(0.137) (0.178) (0.12) (0.164) (0.13)
Latitude 0.213∗∗∗ -10.984∗∗∗ -.058 -.216 -.044
(0.077) (2.372) (0.069) (0.391) (0.073)
log(Distance) -1.590 12.012∗∗∗ 0.055 6.310∗∗∗ -.003
(1.443) (2.589) (0.297) (1.576) (0.187)
Cotton -.625 0.253 0.406 -1.307∗∗∗ 0.783∗∗
(0.425) (0.504) (0.349) (0.478) (0.359)
Sugar -.508 -.390 0.524 2.396∗∗∗ 1.877∗∗∗
(0.495) (0.714) (0.416) (0.552) (0.425)
Minerals -1.362∗∗∗ 0.97∗∗ -.342 1.432∗∗∗ 0.128
(0.349) (0.418) (0.312) (0.388) (0.329)
Timber -1.306∗∗∗ 0.243 -.757∗∗ -.943∗∗ 0.311
(0.36) (0.398) (0.316) (0.368) (0.316)
Livestock 0.825∗∗ -1.162∗∗∗ -.545∗ 1.162∗∗∗ -.811∗∗
(0.336) (0.402) (0.287) (0.346) (0.331)
Spanish Expedition -.354 2.367∗∗ 0.387 -3.239∗∗∗ -.793∗
(0.499) (1.188) (0.508) (0.599) (0.461)
British Expedition 1.868 -1.020 -1.371 -1.199
(1.193) (1.168) (0.888) (0.78)
log(SettlMort) (AJR) -.743∗∗∗ 1.129∗∗ -.432∗ 0.791∗∗ -.535∗∗
(0.274) (0.527) (0.257) (0.339) (0.259)
Obs. 367 353 367 367 368
Coefficients reported with standard errors in parentheses; *** p < 0.01, ** p < 0.05, * p < 0.1.
43
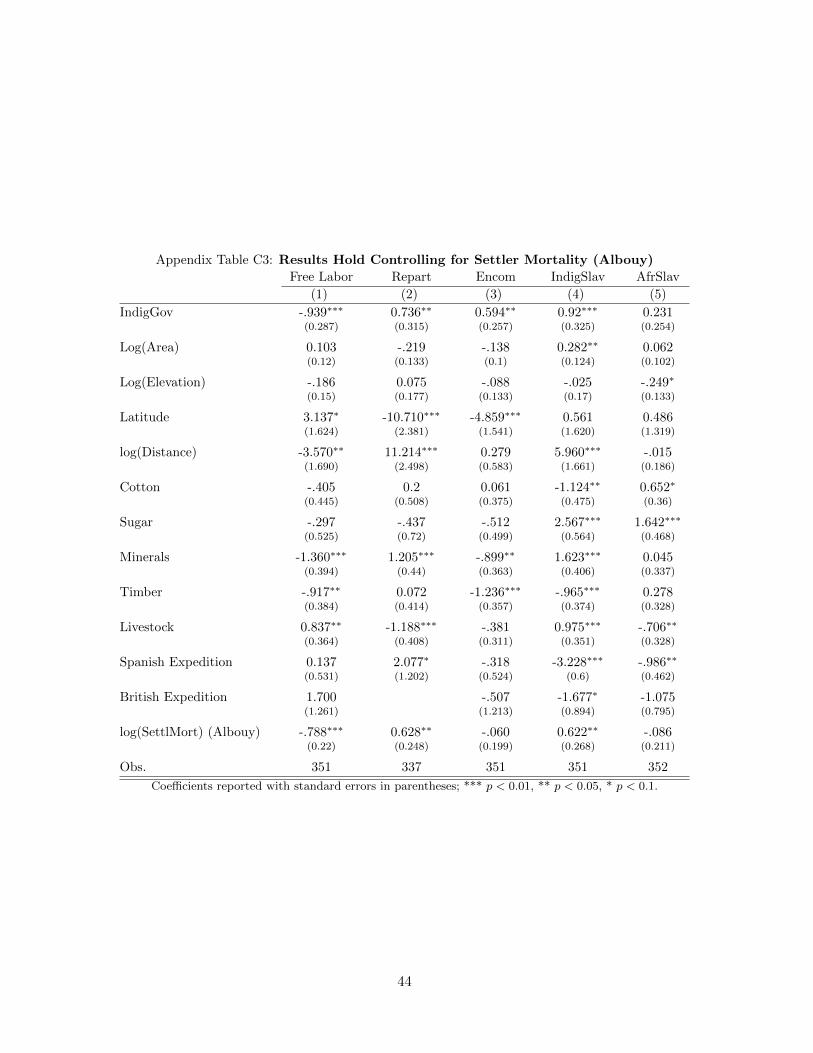
Appendix Table C3: Results Hold Controlling for Settler Mortality (Albouy)Free Labor Repart Encom IndigSlav AfrSlav
(1) (2) (3) (4) (5)
IndigGov -.939∗∗∗ 0.736∗∗ 0.594∗∗ 0.92∗∗∗ 0.231
(0.287) (0.315) (0.257) (0.325) (0.254)
Log(Area) 0.103 -.219 -.138 0.282∗∗ 0.062
(0.12) (0.133) (0.1) (0.124) (0.102)
Log(Elevation) -.186 0.075 -.088 -.025 -.249∗
(0.15) (0.177) (0.133) (0.17) (0.133)
Latitude 3.137∗ -10.710∗∗∗ -4.859∗∗∗ 0.561 0.486
(1.624) (2.381) (1.541) (1.620) (1.319)
log(Distance) -3.570∗∗ 11.214∗∗∗ 0.279 5.960∗∗∗ -.015
(1.690) (2.498) (0.583) (1.661) (0.186)
Cotton -.405 0.2 0.061 -1.124∗∗ 0.652∗
(0.445) (0.508) (0.375) (0.475) (0.36)
Sugar -.297 -.437 -.512 2.567∗∗∗ 1.642∗∗∗
(0.525) (0.72) (0.499) (0.564) (0.468)
Minerals -1.360∗∗∗ 1.205∗∗∗ -.899∗∗ 1.623∗∗∗ 0.045
(0.394) (0.44) (0.363) (0.406) (0.337)
Timber -.917∗∗ 0.072 -1.236∗∗∗ -.965∗∗∗ 0.278
(0.384) (0.414) (0.357) (0.374) (0.328)
Livestock 0.837∗∗ -1.188∗∗∗ -.381 0.975∗∗∗ -.706∗∗
(0.364) (0.408) (0.311) (0.351) (0.328)
Spanish Expedition 0.137 2.077∗ -.318 -3.228∗∗∗ -.986∗∗
(0.531) (1.202) (0.524) (0.6) (0.462)
British Expedition 1.700 -.507 -1.677∗ -1.075
(1.261) (1.213) (0.894) (0.795)
log(SettlMort) (Albouy) -.788∗∗∗ 0.628∗∗ -.060 0.622∗∗ -.086
(0.22) (0.248) (0.199) (0.268) (0.211)
Obs. 351 337 351 351 352
Coefficients reported with standard errors in parentheses; *** p < 0.01, ** p < 0.05, * p < 0.1.
44
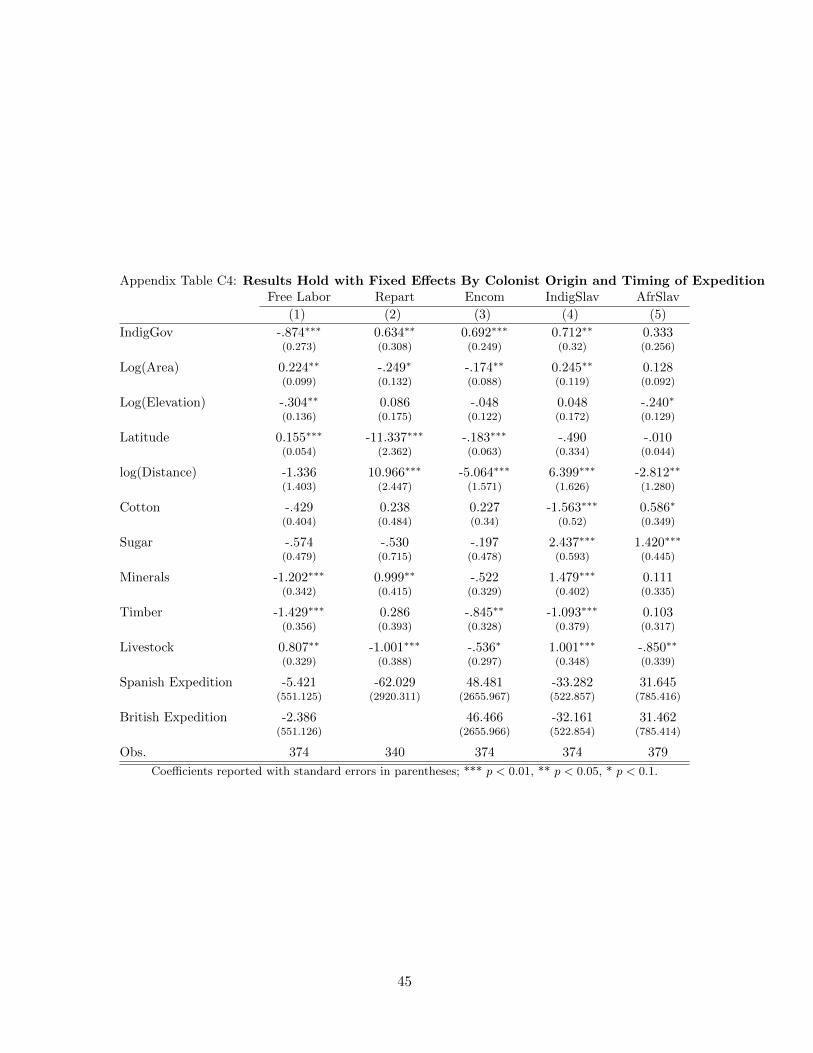
Appendix Table C4: Results Hold with Fixed Effects By Colonist Origin and Timing of ExpeditionFree Labor Repart Encom IndigSlav AfrSlav
(1) (2) (3) (4) (5)
IndigGov -.874∗∗∗ 0.634∗∗ 0.692∗∗∗ 0.712∗∗ 0.333
(0.273) (0.308) (0.249) (0.32) (0.256)
Log(Area) 0.224∗∗ -.249∗ -.174∗∗ 0.245∗∗ 0.128
(0.099) (0.132) (0.088) (0.119) (0.092)
Log(Elevation) -.304∗∗ 0.086 -.048 0.048 -.240∗
(0.136) (0.175) (0.122) (0.172) (0.129)
Latitude 0.155∗∗∗ -11.337∗∗∗ -.183∗∗∗ -.490 -.010
(0.054) (2.362) (0.063) (0.334) (0.044)
log(Distance) -1.336 10.966∗∗∗ -5.064∗∗∗ 6.399∗∗∗ -2.812∗∗
(1.403) (2.447) (1.571) (1.626) (1.280)
Cotton -.429 0.238 0.227 -1.563∗∗∗ 0.586∗
(0.404) (0.484) (0.34) (0.52) (0.349)
Sugar -.574 -.530 -.197 2.437∗∗∗ 1.420∗∗∗
(0.479) (0.715) (0.478) (0.593) (0.445)
Minerals -1.202∗∗∗ 0.999∗∗ -.522 1.479∗∗∗ 0.111
(0.342) (0.415) (0.329) (0.402) (0.335)
Timber -1.429∗∗∗ 0.286 -.845∗∗ -1.093∗∗∗ 0.103
(0.356) (0.393) (0.328) (0.379) (0.317)
Livestock 0.807∗∗ -1.001∗∗∗ -.536∗ 1.001∗∗∗ -.850∗∗
(0.329) (0.388) (0.297) (0.348) (0.339)
Spanish Expedition -5.421 -62.029 48.481 -33.282 31.645
(551.125) (2920.311) (2655.967) (522.857) (785.416)
British Expedition -2.386 46.466 -32.161 31.462
(551.126) (2655.966) (522.854) (785.414)
Obs. 374 340 374 374 379
Coefficients reported with standard errors in parentheses; *** p < 0.01, ** p < 0.05, * p < 0.1.
45