infection control for the surgeon gonzalo bearman, md, mph assistant professor of internal medicine...
TRANSCRIPT

Infection Control
for the SurgeonGonzalo Bearman, MD, MPH
Assistant Professor of Internal Medicine & EpidemiologyAssociate Hospital Epidemiologist
Michael Edmond, MD, MPH, MPAProfessor of Internal Medicine & Epidemiology
Hospital Epidemiologist & Medical Director of Performance Improvement

Nosocomial Infections
• 5-10% of patients admitted to acute care hospitals acquire infections– 2 million patients/year– ¼ of nosocomial infections occur in ICUs– 90,000 deaths/year– Attributable annual cost: $4.5 – $5.7 billion
• Cost is largely borne by the healthcare facility not 3rd party payors
Weinstein RA. Emerg Infect Dis 1998;4:416-420.Jarvis WR. Emerg Infect Dis 2001;7:170-173.

Nosocomial Infections
• 70% are due to antibiotic-resistant organisms
• Invasive devices are more important than underlying diseases in determining susceptibility to nosocomial infection
Burke JP. New Engl J Med 2003;348:651-656.Safdar N et al. Current Infect Dis Reports 2001;3:487-495.

Attributable Costs of Nosocomial Infections
Cost per Infection
Wound infections $3,000 - $27,000
Sternal wound infection $20,000 - $80,000
Catheter-associated BSI $5,000 - $34,000
Pneumonia $10,000 - $29,000
Urinary tract infection $700
Nettleman M. In: Wenzel RP, ed. Prevention and Control of Nosocomial Infections, 4th ed. 2003:36.

Impact of Infections Acquired in MCVH STICU, 2004
Number of infections
Estimated Impact of Infections
Deaths Extra hospital days Extra cost
Bloodstream 52 10 416 $1,560,000
Pneumonia 21 3 336 $420,000
UTI 42 0 0 $29,400
TOTAL 115 13 752 $2,009,400
Assumptions: • Each bloodstream infection on average adds 8 hospital days & $30,000 to cost of care; 20% of
patients die as a direct result of the bloodstream infection• Each case of ventilator-associated pneumonia on average adds 16 hospital days & $20,000 to cost of
care; 15% of patients die directly as a result of the pneumonia• Each urinary tract infection on average adds $700 to cost of care
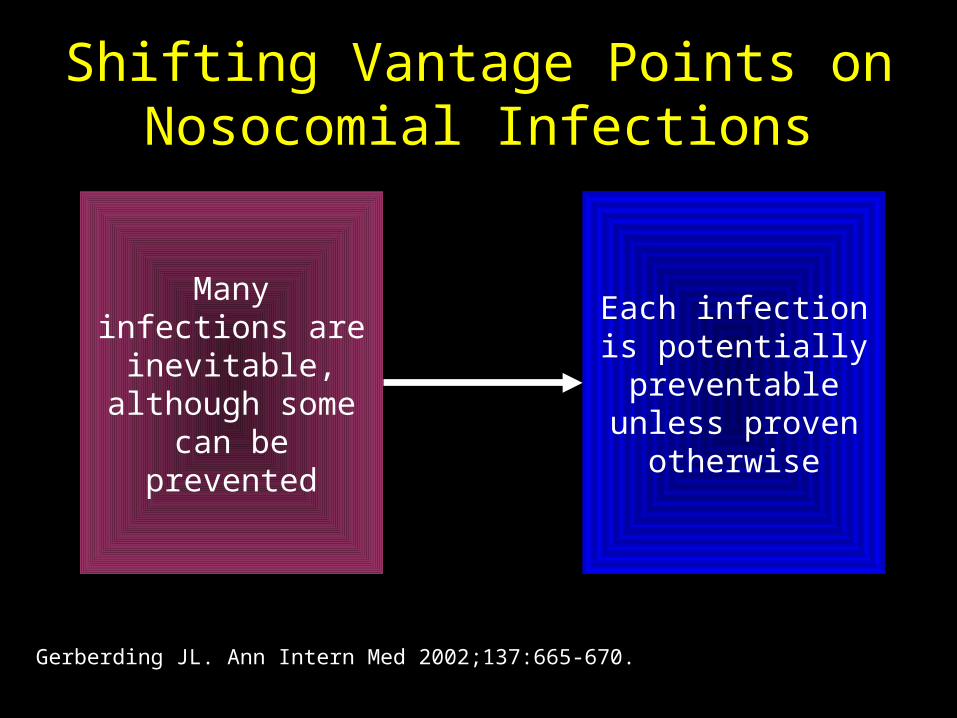
Shifting Vantage Points on Nosocomial Infections
Gerberding JL. Ann Intern Med 2002;137:665-670.
Many infections are inevitable, although
some can be prevented
Each infection is potentially
preventable unless proven otherwise

Consumer Advocacy Impacting Physician Practice
• Direct education of the public
• Working with state legislatures to mandate public reporting of healthcare quality issues
• Pay for performance (P4P)

Major Sites of Nosocomial Infections
• Urinary tract infection
• Bloodstream infection
• Pneumonia (ventilator-associated)
• Surgical site infection

Nosocomial Urinary Tract Infections
• Most common hospital-acquired infection (40% of all nosocomial infections)– 1 million cases of nosocomial UTI per year in the US
• Of nosocomial infections, lowest mortality & cost
• >80% associated with urinary catheter

Nosocomial Urinary Tract Infections• 25% of hospitalized patients will have a urinary catheter for part of their
stay• 20-25 million urinary catheters sold per year in the US• Incidence of nosocomial UTI is ~5% per catheterized day• Virtually all patients develop bacteriuria by 30 days of catheterization• Of patients who develop bacteriuria, 3% will develop bacteremia• Vast majority of catheter-associated UTIs are silent, but these comprise
the largest pool of antibiotic-resistant pathogens in the hospital
Safdar N et al. Current Infect Dis Reports 2001;3:487-495.

Risk Factors for Nosocomial UTIs• Female gender• Other active site of infection• Diabetes mellitus• Renal insufficiency• Duration of catheterization• Insertion of catheter late in hospitalization• Presence of ureteral stent• Using catheter to measure urine output• Disconnection of catheter from drainage tube• Retrograde flow of urine from drainage bag

Prevention of Nosocomial UTIs
• Avoid catheter when possible & discontinue ASAP
• Aseptic insertion by trained HCWs• Maintain closed system of drainage• Ensure dependent drainage• Minimize manipulation of the system• Condom or suprapubic catheter • Silver coated catheters

Nosocomial Bloodstream Infections
• 12-25% attributable mortality
• Risk for bloodstream infection:
BSI per 1,000 catheter/days
Subclavian or internal jugular CVC 5-7
PICC 0.2 - 2.2

Risk Factors for Nosocomial BSIs• Heavy skin colonization at the insertion
site
• Internal jugular or femoral vein sites
• Duration of placement
• Contamination of the catheter hub

Prevention of Nosocomial BSIs
• Limit duration of use of intravascular catheters– No advantage to changing catheters routinely
• Change CVCs to PICCs when possible• Maximal barrier precautions for insertion
– Sterile gloves, gown, mask, cap, full-size drape– Moderately strong supporting evidence
• Chlorhexidine prep for catheter insertion• Antibiotic coated catheters

Nosocomial Pneumonia
• Cumulative incidence = 1-3% per day of intubation• Early onset (first 3-4 days of mechanical ventilation)
– Antibiotic sensitive, community organisms (S. pneumoniae, H. influenzae, S. aureus)
• Late onset– Antibiotic resistant, nosocomial organisms (MRSA, Ps.
aeruginosa, Acinetobacter spp, Enterobacter spp)

Risk Factors for VAP
• Duration of mechanical ventilation
• Chronic lung disease• Severity of illness• Age• Head trauma• Elevated gastric pH
• Aspiration of gastric contents
• Reintubation• Upper abdominal or
thoracic surgery• Supine head position• NG tube

Prevention of VAP
• Semirecumbent position of ventilated patients (head of bed at 30-45°)
• Continuous oscillation: needs more study• Continuous aspiration of subglottic secretions
– Uses ETT with a dorsal lumen that opens into the subglottic region, allowing aspiration of pooled secretions with potential pathogens
– Delays onset of VAP, conflicting evidence on incidence of VAP, no effect on mortality

Prevention of VAP• Selective GI tract decontamination
– Many studies– Complicated literature
• Some studies used topical as well as IV antibiotics
– Major concern: development of antibiotic resistance
• Sucralfate– Allows prophylaxis of stress ulcers without raising gastric
pH ( pH leads to increased gastric colonization)– Mixed results in the literature– Disadvantages: requires NG tube, provides inferior
prophylaxis for GI bleeding
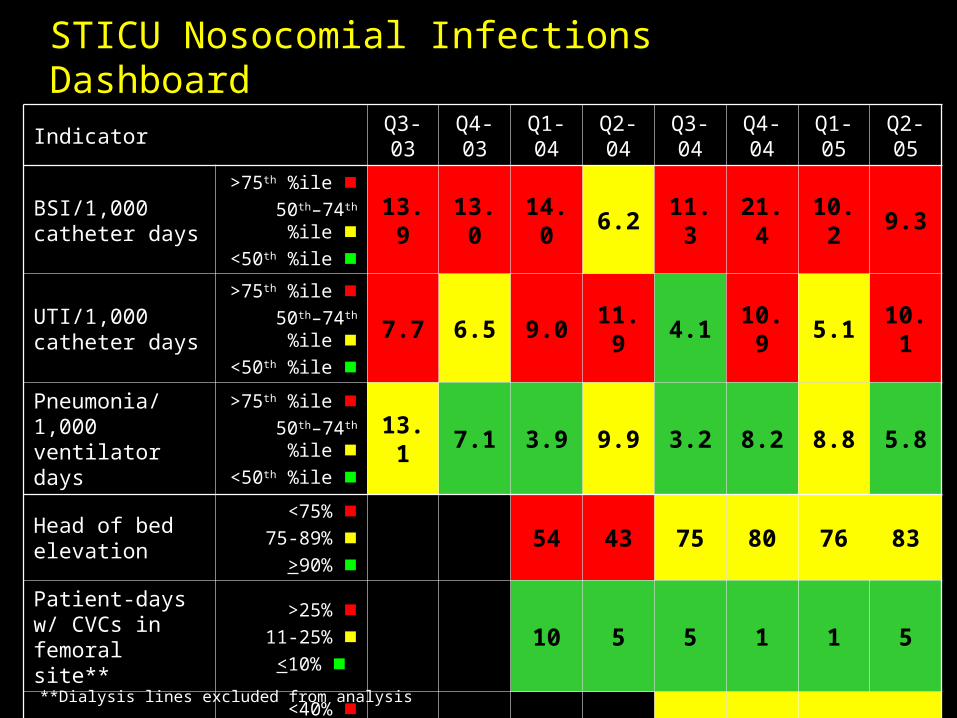
STICU Nosocomial Infections Dashboard
IndicatorQ3-03
Q4-03
Q1-04
Q2-04
Q3-04
Q4-04
Q1-05
Q2-05
BSI/1,000 catheter days
>75th %ile 50th–74th %ile
<50th %ile 13.9 13.0 14.0 6.2 11.3 21.4 10.2 9.3
UTI/1,000 catheter days
>75th %ile 50th–74th %ile
<50th %ile 7.7 6.5 9.0 11.9 4.1 10.9 5.1 10.1
Pneumonia/1,000 ventilator days
>75th %ile 50th–74th %ile
<50th %ile 13.1 7.1 3.9 9.9 3.2 8.2 8.8 5.8
Head of bed elevation
<75% 75-89%
>90% 54 43 75 80 76 83
Patient-days w/ CVCs in femoral site**
>25% 11-25%
<10% 10 5 5 1 1 5
Hand hygiene<40%
40-59% >60%
52 58 49 46
**Dialysis lines excluded from analysis

Epidemiology of SSI in the US
• 30 million surgical procedures performed annually
• SSIs occur in 2-5% of clean, extra-abdominal procedures & up to 20% of patients undergoing intra-abdominal procedures
• CDC estimates that 500,000 SSIs occur annually
• Direct + indirect costs = $1-$10 billion• 47-84% of SSIs occur after discharge

Sources of SSIs
• Endogenous: patient’s skin or mucosal flora– Increased risk with devitalized tissue, fluid collection,
edema, larger inocula• Exogenous
– Includes OR environment/instruments, OR air, personnel
• Hematogenous/lymphatic: seeding of surgical site from a distant focus of infection– May occur days to weeks following the procedure
• Most infections occur due to organisms implanted during the procedure

Downloaded from: Principles and Practice of Infectious Diseases
© 2004 Elsevier
Up to 20% of skin-associated bacteria in skin appendages (hair follicles, sebaceous glands) & are not eliminated by topical antisepsis. Transection of these skin structures by surgical incision may carry the patient's resident bacteria deep into the wound and set the stage for subsequent infection.

Surgical Site Infections
Pathogens
Rank Pathogen Percent
1 S. aureus 20%
2 Coagulase-negative Staph 14%
3 Enterococci 12%
4 E. coli 8%
4 Pseudomonas aeruginosa 8%
5 Enterobacter spp 7%
N= 23,655CDC. Am J Infect Control 1996;24:380-8.

Surgical Site Infections (SSI)
• Clean wound * elective, primarily closed, undrained * nontraumatic, uninfected• Clean-Contaminated wound * GI, resp, GU tracts entered in a controlled
manner * oropharynx, vagina, biliary tract entered• Contaminated wound * open, fresh, traumatic wounds * gross spillage from GI tract * infected urine, bile

Surgical Site Infections
Wound Class % of Operations SSI Rate (%)
Clean 58 3.3
Clean-contaminated 36 10.8
Contaminated 4 16.3
Dirty-infected 2 28.6
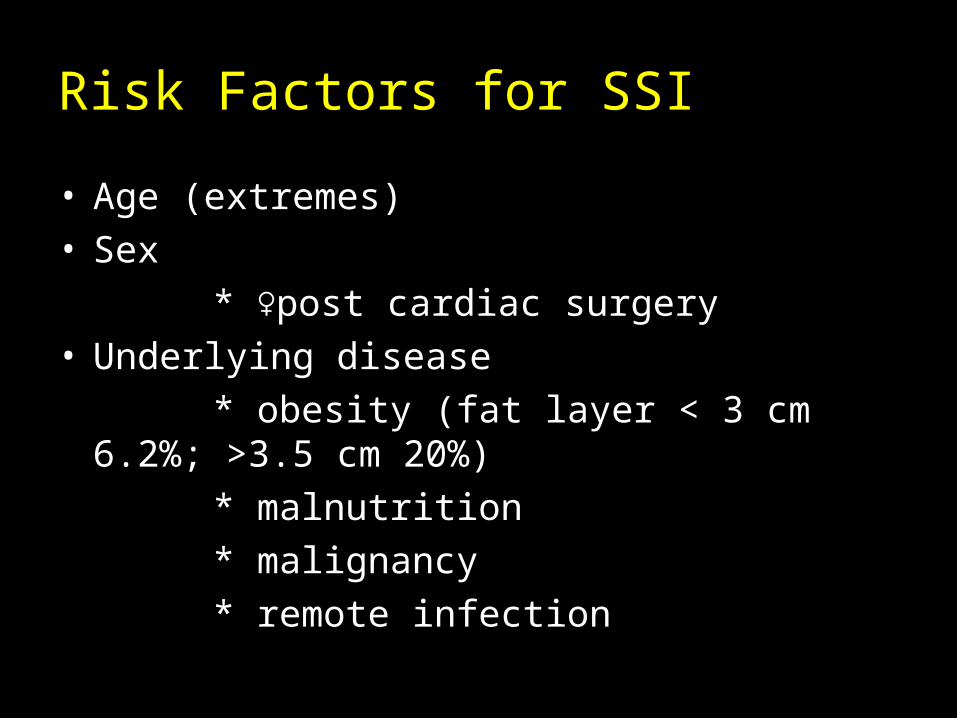
Risk Factors for SSI
• Age (extremes)• Sex
* ♀post cardiac surgery• Underlying disease
* obesity (fat layer < 3 cm 6.2%; >3.5 cm 20%)
* malnutrition
* malignancy
* remote infection

Risk Factors for SSI
• Duration of pre-op hospitalization * increase in endogenous reservoir• Pre-op hair removal * esp if time before surgery > 12 hours * shaving>>clipping>depilatories• Duration of operation * increased bacterial contamination * tissue damage * suppression of host defenses * personnel fatigue

Prevention of SSI
• Limit pre-op hospitalization• Stabilize underlying diseases• Avoid hair removal by shaving
– Clipping of skin is preferred• Skin decolonization of both patient and surgeon
– Chlorhexidine– Intranasal mupirocin for S. aureus carriers
• Impermeable drapes– Maximum sterile barrier precautions
• Perioperative antibiotic prophylaxis

SCIP
• A national partnership of organizations to improve the safety of surgical care by reducing post-operative complications through a national campaign
• Goal: reduce the incidence of surgical complications by 25 percent by the year 2010
• Initiated in 2003 by the Centers for Medicare & Medicaid Services (CMS) & the Centers for Disease Control & Prevention (CDC)– Steering committee of 10 national organizations– More than 20 additional organizations provide
technical expertise

SCIP Philosophy
• Surgeons, anesthesiologists, perioperative nurses, pharmacists, infection control professionals, & hospital executives work together to intensify their commitment to improving surgical care

SCIP Steering Committee Organizations
• Agency for Healthcare Research and Quality • American College of Surgeons • American Hospital Association • American Society of Anesthesiologists • Association of periOperative Registered Nurses • Centers for Disease Control and Prevention • Centers for Medicare & Medicaid Services • Department of Veterans Affairs • Institute for Healthcare Improvement • Joint Commission on Accreditation of Healthcare
Organizations

SCIP Performance Measures
Surgical infection prevention
• SSI rates
• Appropriate prophylactic antibiotic chosen
• Antibiotic given within 1 hour before incision
• Discontinuation of antibiotic within 24 hours of surgery
• Glucose control
• Proper hair removal
• Normothermia in colorectal surgery patients
Periop cardiac events
• In-hospital cardiac event rates
• 30-day readmission rate
• 30-day mortality rate
• Periop -blockers in noncardiac vascular surgery pts, pts with known CAD, in pts on -blockers before surgery
DVT prevention
•Rates of DVT/PE during hospitalization
•Proportion who receive VTE prophylaxis
VAP prevention
•Rate of postop VAP cases
•Rate of ventilated patients with head of bed elevated
•Proportion of vent pts put on a rapid weaning protocol
•Proportion of vent pts who receive PUD prophylaxis

Monetary incentives for promoting quality and compliance with SSI risk reduction guidelines:
March 12, 2005
In recent years, the healthcare industry has placed a stronger emphasis on reducing medical errors, monitoring everything from how long doctors sleep to whether or not their handwriting is legible.Now one organization is not only recognizing the hospitals that follow patient safety and clinical guidelines, but rewarding them for doing so. Anthem Blue Cross and Blue Shield recently gave a total of $6 million to 16 Virginia hospitals as part of the company's new Quality-In-Sights Hospital Incentive Program (Q-HIP).
http://www.richmond.com/health/output.aspx?Article_ID=3545364&Vertical_ID=15

Definition of SSI
Skin
Subcutaneoustissue
Deep soft tissue(fascia & muscle)
Organ/space
Superficial incisional SSI
Deep incisional SSI
Organ/space SSI
Horan C et al. Am J Infection Control 1992:20:271-74.

CDC Criteria for SSI Superficial
incisional SSIDeep incisional
SSIOrgan/Space
SSI
AnatomySkin &
subcutaneous tissueDeep soft tissues
Area other than incision
Timing Within 30 daysWithin 30 days if no implant; within
1 year if implant placed
At least 1 of the following:
Purulent drainage
From superficial incision
From deep incision
From drain placed in
organ/space
LabCulture from fluid or tissue from incision
Abscess present on imaging or on reoperation
Signs/
symptoms
At least 1 ( pain, tenderness,
swelling, redness, heat) + MD opens
incision
Deep incision dehisces or is
opened + 1 (fever, pain, tenderness)
MD diagnosis
Horan TC et al. Am J Infect Control 1992;20:271-4.

Timing of SSI Diagnosis
0
2
4
6
8
10
12
CT Vasc Urology Plastic GYN General Ortho
Att
ack
Rat
e (%
)
Postdischarge diagnosis
Predischarge diagnosis
Sands K et al. J Infect Dis 1996;173:963-70.

Proper Hair Removal

Preoperative Hair Removal
Not removing hair from the
surgical site unless
necessary to facilitate
surgery.
If hair is to be removed,
then this should be done
immediately before surgery
and preferably with electric
scissors and not by
shaving.
Category I A: Strongly recommended for implementation; supported by well designed, experimental, clinical or epidemiologic studies.
CDC Hospital Infection Control Practices
Advisory Committee Guideline for Prevention of
Surgical Site Infection. AJIC 1999;27:97-134.
July 2000 Bulletin of the American College of Surgeons

U.S. News and World Report, July 18, 2005.

Pathophysiology of Shaving & SSI
•Hair removal with a razor can disrupt skin integrity
•Microscopic exudative rashes and skin abrasions can occur during hair removal.
•These rashes and skin abrasions can provide a portal of entry for microorganisms

Preoperative Hair Removal: Summary of the Data
Study Conclusion
Mishriki et al. Journal of Hospital infection (1990) 16;223-230.
Prospective analysis of 702 consecutive surgical cases resulting in 51 infections. Age, preoperative stay, shaving and the surgeon were all statistically associated with SSI.
Moro et al. Ann Ital Chir LXVII 1,1996.13-19.
Prospective analysis of 2,262 clean surgeries in eight general wards and one thoracic ward.
3.7% developed SSI
Logistic regression analysis: 7 risk factors- advanced age,obesity, high risk procedures, OR duration>2 hours, preoperative shaving, open surgical drains > 3 days

Pre-op Hair Removal
• Conclusions from a review of 20 studies:– it is not strongly documented that hair removal results
in a higher frequency of SSIs than no hair removal– several randomized & observational studies with
controls show that either wet or dry shaving the evening before the procedure results in a significantly higher infection rate than depilation or electric clipping
– there are no convincing differences in the incidence of postoperative SSIs between electric clipping, depilation, or no hair removal
– hair removal with clippers should be performed as close as possible to the time of the procedure
Kjonniksen I et al. AORN J 2002;75:928-36,938,940.

Perioperative Normothermia

Physiologic Effects of Hypothermia
Anesthetic drugs, opioids, sedatives
Impaired thermoregulatory control
Production ofsuperoxide radicals
Vasoconstriction
Killing of pathogens by neutrophils
Tissue oxygenation
Collagendeposition
Risk of SSI

Preoperative Normothermia
• Blinded, randomized trial of 421 patients undergoing clean surgery (breast, varicose vein or hernia) comparing routine preoperative care to systemic warming (forced air warming blanket 30 minutes preop) to local warming (30 minute preop warming of planned incision with a radiant dressing)
Melling AC et al. Lancet 2001;358:876-80.
Non-warmed
Local warming
Systemic warming P
Infection rate 14%4% 6%
5% 0.001

Perioperative Normothermia
• Double-blinded, randomized trial of 200 patients undergoing colorectal surgery comparing routine intraoperative thermal care (34.5ºC) to normothermia (36.5ºC) using a forced air cover and heated fluids
Kurz A et al. New Engl J Med 1996;334:1209-15.
Hypothermia Normothermia P
Infection rate 19% 6% 0.009
Perioperative Glycemic Control

Perioperative Glucose Control
• Poor glucose control has been shown to be an independent risk factor for SSI in multiple studies
• Risk is increased due to vascular disease, neutrophil dysfunction, impairment of complement & antibodies
• Intervention: maintain glucose at 151-200 mg/dL via a continuous insulin infusion

Perioperative Glucose Control• 141 diabetic patients undergoing CABG were randomized
to tight glycemic control (125-200 mg/dL) with GIK or standard therapy (<250 mg/dL) using SQ SSI beginning before anesthesia & continuing for 12 hours after surgery
SSI GIK P
Infection (wound, pneumonia)
13% 0% 0.01
Post-op LOS 9.2 days 6.5 days 0.001
Mortality 0% 0% 0.99
Lazar HL et al. Circulation 2004;109:1497-1502.

Perioperative Glucose Control• 2,467 diabetic patients undergoing cardiac
surgery at a community hospital– 968 patients treated with sliding scale insulin (1987-91)– 1499 patients treated with CII to target glucose of 150-
200 until POD 3 (1991-97)
SSI CII P
Wound infection 1.9% 0.8% 0.01
LOS 10.7 days 8.5 days <0.01
Mortality 6.1% 3.0% 0.03
Furnary AP et al. Ann Thorac Surg 1999;67:352-360.

The Annals of Thoracic Surgery Volume 67, Issue 2 , February 1999, 352-360
Baseline Characteristics

Perioperative Glycemic Control
Furnary AP et al. Ann Thorac Surg 1999;67:352-360.

The Annals of Thoracic Surgery Volume 67, Issue 2 , February 1999, 352-360
Univariate Analysis

The final multivariate model (n = 2,353)
•CII (p = 0.005; relative risk, 0.34) produced a significant decrease in the risk of DSWI.
•Obesity, as measured by body mass index, increased the risk of DSWI (p = 0.03; relative risk, 1.06)
• Use of an ITA pedicle (p = 0.1; relative risk, 2.0) increased the risk of DSWI .
Multivariate analysis
Furnary AP et al. Ann Thorac Surg 1999;67:352-360.

Continuous intravenous insulin infusion reduces the incidence of deep sternal wound infection in diabetic
patients after cardiac surgical procedures
• Compared with subcutaneous insulin injections, continuous intravenous insulin infusion induced a significant reduction in perioperative blood glucose levels
• This led to a significant reduction in the incidence of deep sternal wound infection in the continuous intravenous insulin infusion group (0.8% [12 of 1,499]) versus the intermittent subcutaneous insulin injection group (2.0% [19 of 968], p = 0.01 by the 2 test).
• Multivariate logistic regression revealed that continuous intravenous insulin infusion induced a significant decrease in the risk of deep sternal wound infection (p = 0.005; relative risk, 0.34), whereas obesity (p < 0.03; relative risk, 1.06) and use of an internal thoracic artery pedicle (p = 0.1; relative risk, 2.0) increased the risk of deep sternal wound infection.
The Annals of Thoracic Surgery Volume 67, Issue 2 , February 1999, 352-360

Perioperative Glycemic Control
• An increasing body of evidence demonstrates that tight glycemic control of blood glucose improves overall outcomes for patients with DM.
• The best quality data currently available is in the CT surgical literature
• Data appear promising but quality studies in the non-cardiac surgical populations are not yet available.

Surgical Hand Antisepsis

Surgical Hand Antisepsis: 1999
“Surgical scrub of at least 2-5 minutes (up to elbow) using an appropriate antiseptic.”
Category IB recommendation
1999-ACS/CDC/HICPAC
July 2000 Bulletin of the American College of Surgeons

Surgical Hand Antisepsis: 2002
Surgical hand antisepsis using either an antimicrobial soap (2-5 minute scrub) or an alcohol-based handrub with persistent activity is recommended before donning sterile gloves when performing surgical procedures.
Category I B recommendation
CDC MMWR- Guideline For Hand Hygiene in Healthcare Setting, October 25, 2002

Surgical Hand Antisepsis: 2002
Study: Findings:•Meers et al. Journal of Hygiene. 1978•Kikuchi et al. Acta Derm Venereol. 1999.
Surgical hand preparation requiring scrubbing with a brush damages the skin and leads to increased shedding of bacteria and squamous epithelial cells
•Dineen,P. Surg Gynecol Obstet, 1973.•Bornside GH. Surgery, 1968.
Scrubbing with a disposable sponge or combination sponge-brush has reduced bacterial counts on the hands as effectively as scrubbing with a brush.
•Mulberry et al. Am J Infect Control, 2001•Loeb et al. Am J Infect Control, 1997
Neither brush nor sponge is necessary to reduce bacterial counts on the hands of surgical staff to acceptable levels
CDC MMWR- Guideline For Hand Hygiene in Healthcare Setting, October 25, 2002

Comparison of Different Regimens for Surgical Hand Preparation
•Prospective clinical trial
•To compare the microbiology and skin condition of hands when using a traditional surgical scrub (TSS) with a detergent-based antiseptic containing 4% chlorhexidine gluconate (CHG) vs. a short application without scrub of a waterless hand preparation (HP) containing 61% ethyl alcohol, 1% CHG, and emollients.
•Endpoints:
•antimicrobial effectiveness
• effect on skin condition
• time required Larson et al. AORN Journal, February 2001

Comparison of Different Regimens for Surgical Hand Preparation
Larson et al. AORN Journal, February 2001

Comparison of Different Regimens for Surgical Hand Preparation
Larson et al. AORN Journal, February 2001

Comparison of Different Regimens for Surgical Hand Preparation
Larson et al. AORN Journal, February 2001
Greater changes VSS observed in VSS vs HP

Comparison of Different Regimens for Surgical Hand Preparation
Larson et al. AORN Journal, February 2001
Greater Log CFU observed in TSS vs HP

Comparison of Different Regimens for Surgical Hand Preparation
Larson et al. AORN Journal, February 2001
Larson et al found the HP protocol less expensive

Comparison of Different Regimens for Surgical Hand Preparation
Larson et al. AORN Journal, February 2001

Comparison of Different Regimens for Surgical Hand Preparation
Conclusion:
•The HP was associated with less skin damage (P = .002) and lower microbial counts postscrub at days five (P = .002) and 19 (P = .02).
•The HP protocol had shorter contact time (HP mean [M] = 80.7 seconds; TSS M = 144.9 seconds; P < .0001), and more subjects preferred the HP regimen (P = .001).
•The HP performed better than the TSS, was less costly, and should be evaluated in larger trials and considered for widespread implementation.
Larson et al. AORN Journal, February 2001

Parienti et al; JAMA, Aug 14 2002 Vol 288, No.6, 722-727

Study Overview
• Objective: to compare the effectiveness of hand-cleansing protocols to prevent SSI
• Design: prospective, randomized equivalence trial with crossover
• Setting: six surgical services from teaching and non-teaching hospitals is France
• Patients: A total of 4387 consecutive patients who underwent clean and clean contaminated surgery between January 1- May 1, 2001.
Parienti et al. JAMA. Vol 288,No.6. 2002
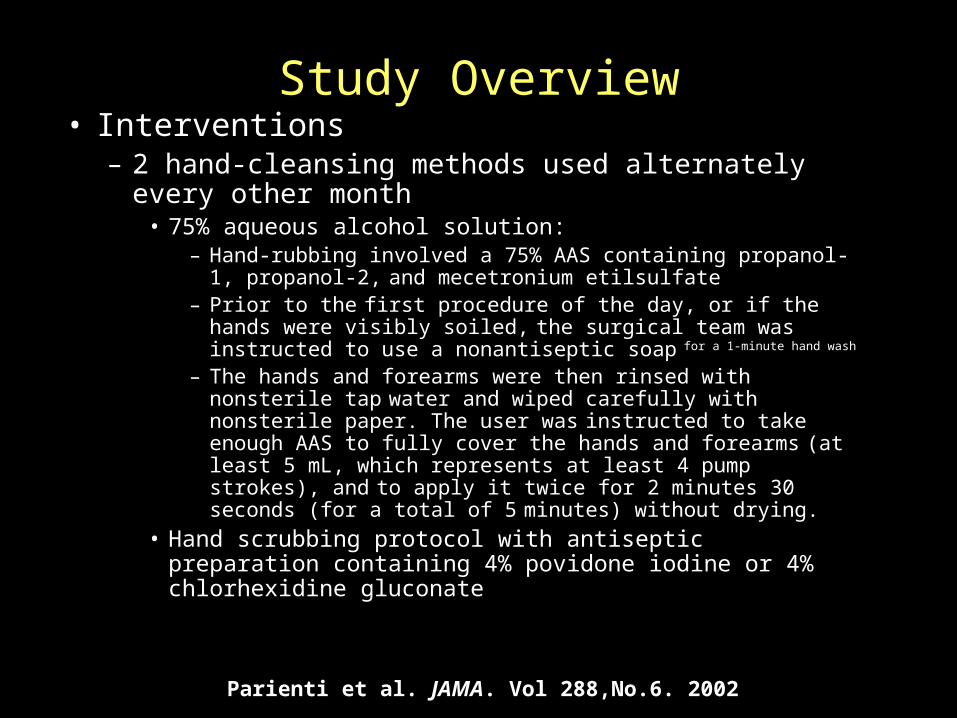
Study Overview• Interventions
– 2 hand-cleansing methods used alternately every other month
• 75% aqueous alcohol solution:– Hand-rubbing involved a 75% AAS containing propanol-1,
propanol-2, and mecetronium etilsulfate– Prior to the first procedure of the day, or if the hands were
visibly soiled, the surgical team was instructed to use a nonantiseptic soap for a 1-minute hand wash
– The hands and forearms were then rinsed with nonsterile tap
water and wiped carefully with nonsterile paper. The user was
instructed to take enough AAS to fully cover the hands and forearms (at least 5 mL, which represents at least 4 pump strokes), and to apply it twice for 2 minutes 30 seconds (for a total of 5 minutes) without drying.
• Hand scrubbing protocol with antiseptic preparation containing 4% povidone iodine or 4% chlorhexidine gluconate
Parienti et al. JAMA. Vol 288,No.6. 2002

Data Analysis
• Primary endpoint- SSI at 30 days– Equivalence study
• Secondary endpoints- compliance and tolerance
Parienti et al. JAMA. Vol 288,No.6. 2002

Overview of Study
Parienti et al. JAMA. Vol 288,No.6. 2002

Patient Characteristics
Parienti et al. JAMA. Vol 288,No.6. 2002
No differences in baseline characteristics between the 2 protocols

SSI Rates
Parienti et al. JAMA. Vol 288,No.6. 2002
No differences in overall SSI rates observed

Compliance With Hand Antisepsis
Parienti et al. JAMA. Vol 288,No.6. 2002
Greater compliance observed with hand rubbing alcohol

Study Conclusions• Hand rubbing protocol with aqueous alcoholic
solution was as effective as traditional hand scrubbing with antiseptic soap in preventing surgical site infections in a 30 day follow-up.
• Hand rubbing protocol with aqueous alcoholic solution was better tolerated by surgical teams and improved compliance with hygiene guidelines.
• Hand rubbing protocol with aqueous alcoholic solution can be safely used as an alternative to traditional surgical hand-scrubbing.
Parienti et al. JAMA. Vol 288,No.6. 2002

Perioperative Antibiotics

Antibiotic Prophylaxis for Surgery• Goal: reduce intraoperative microbial contamination to a
level that will not overwhelm host defenses & result in infection
• Characteristics of good prophylactic antimicrobials:– Safe– Inexpensive– Bactericidal– Spectrum of activity covers the most likely contaminants for the
operation• A bactericidal concentration should be present in serum
& tissues at time of incision• Therapeutic concentrations should be maintained until,
at most, a few hours after the incision is closed
Auerbach AD. Making Health Care Safer. AHRQ, 2001:221.

Downloaded from: Principles and Practice of Infectious Diseases
Infe
ctio
n R
ate
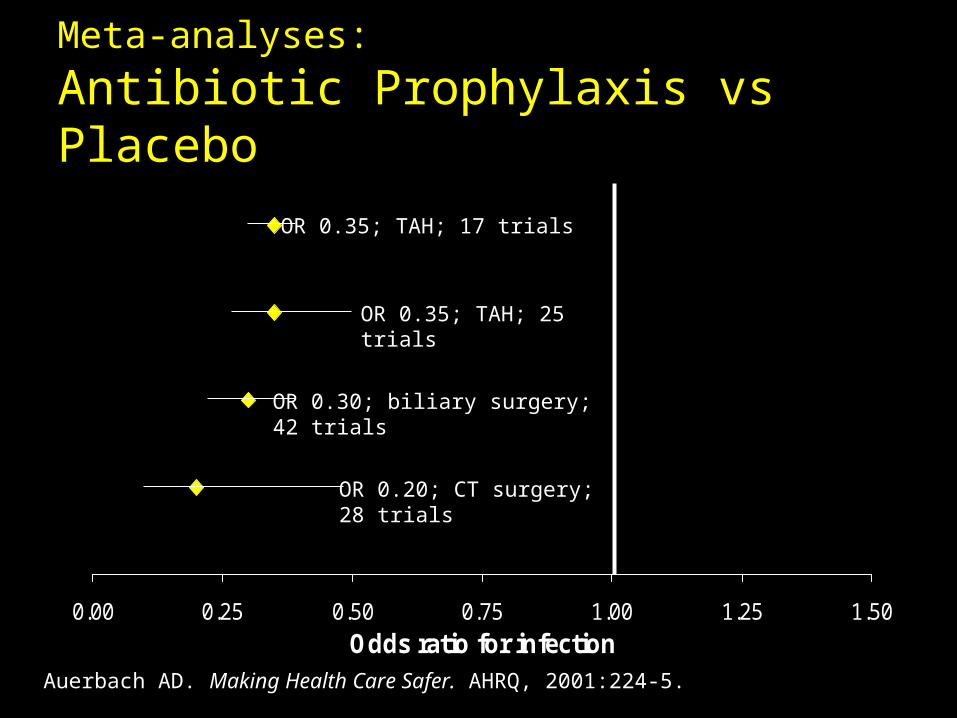
Meta-analyses: Antibiotic Prophylaxis vs Placebo
0.00 0.25 0.50 0.75 1.00 1.25 1.50
Odds ratio for infection
Auerbach AD. Making Health Care Safer. AHRQ, 2001:224-5.
OR 0.35; TAH; 17 trials
OR 0.35; TAH; 25 trials
OR 0.30; biliary surgery; 42 trials
OR 0.20; CT surgery; 28 trials

Indications for Antibiotic Prophylaxis
• Clean-contaminated procedures
• Clean procedures that require placement of prosthetic material
• Clean procedures in which infection would be catastrophic
• Contaminated procedures

Rates of SSI based on Timing of Antibiotic Administration
• Prospective study evaluating timing of antibiotic prophylaxis and incidence of surgical site infection
• Evaluated 2,847 patients undergoing clean or clean—contaminated procedures in a 540 bed teaching hospital
Classen DC et al. New Engl J Med 1992;326:281-6.

0
1
2
3
4
5
6
7
>-2 -2 -1 1 2 3 4 5 6 7 8 9 10 >10
Timing (hours before or after incision)
Infe
ctio
n R
ate
(%)
Rates of SSI based on Timing of Antibiotic Administration
Classen DC et al. New Engl J Med 1992;326:281-6.
N 369 699 1009 180 61 41 47 44 49 45 38 20 15 230

Rates of SSI based on Timing of Antibiotic Administration
Classen DC et al. New Engl J Med 1992;326:281-6.
Timing (related to incision) N
Infection rate (%) RR 95% CI
2-24 hrs before 369 3.8 6.7 1.8-10.4
0-2 hrs before 1,708 0.6 1.0
0-3 hrs after 282 1.4 2.4 0.6-7.4
3-24 hrs after 488 3.3 5.8 2.4-13.8
All 2,847 1.5
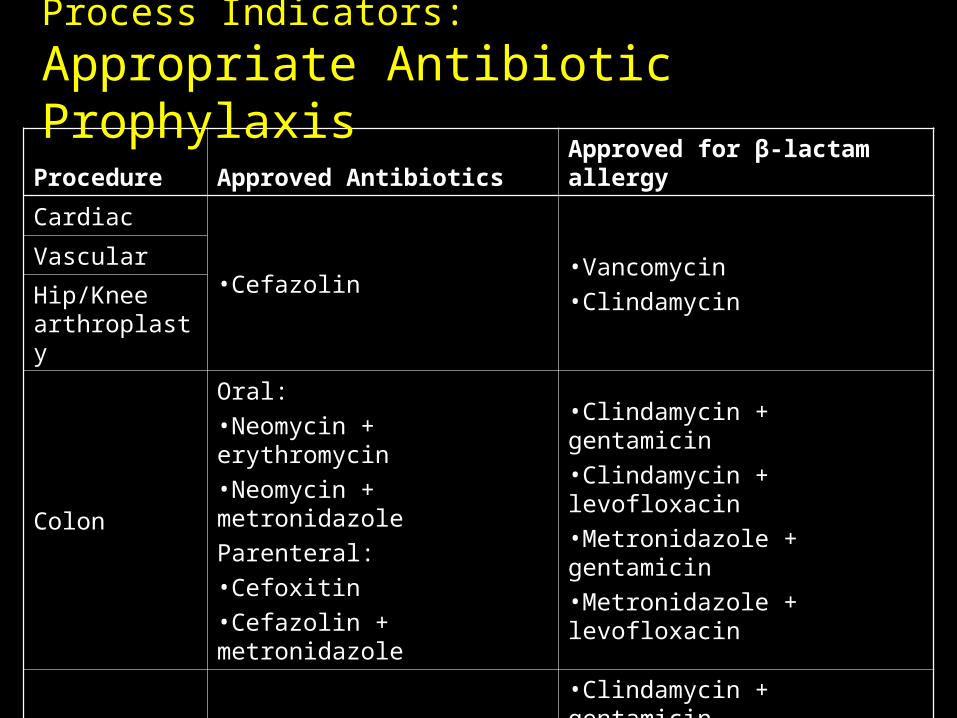
Procedure Approved Antibiotics Approved for β-lactam allergy
Cardiac
•Cefazolin•Vancomycin
•ClindamycinVascular
Hip/Knee arthroplasty
Colon
Oral:
•Neomycin + erythromycin
•Neomycin + metronidazole
Parenteral:
•Cefoxitin
•Cefazolin + metronidazole
•Clindamycin + gentamicin
•Clindamycin + levofloxacin
•Metronidazole + gentamicin
•Metronidazole + levofloxacin
Hysterectomy•Cefazolin
•Cefoxitin
•Clindamycin + gentamicin
•Clindamycin + levofloxacin
•Metronidazole + gentamicin
•Metronidazole + levofloxacin
•Clindamycin
Process Indicators:
Appropriate Antibiotic Prophylaxis

Process Indicators:
Timing of First Antibiotic Dose
Infusion should begin within 60 minutes of the incision
•Little controversy regarding this indicator
Bratzler DW et al. Clin Infect Dis 2004;38:1706-15.

Process Indicators:
Duration of Antimicrobial Prophylaxis
Prophylactic antimicrobials should be discontinued within 24 hrs after the end of surgery
•Areas of controversy: – ASHP recommends continuing prophylaxis
for CT surgery procedures for up to 72 hrs after the operation; Society of Thoracic Surgeons recommends 48 hrs
Bratzler DW et al. Clin Infect Dis 2004;38:1706-15.

VCU Medical Center
Appropriate Antibiotic Selected
% compliance
9697
95
90
92
94
96
98
100
Q3, 2004 Q4, 2004 Q1, 2005

VCU Medical Center
Antibiotic within 1 Hour of Incision
% compliance
62
6771
60
70
80
90
100
Q3, 2004 Q4, 2004 Q1, 2005

VCU Medical Center
Appropriate Discontinued within 24 Hours
% compliance
55 5560
50
60
70
80
90
100
Q3, 2004 Q4, 2004 Q1, 2005


Supplemental Perioperative Oxygen
• Surgical wounds disrupt the local vascular supply as a result of injury & thrombosis of vessels, which cause wounds to be hypoxic as compared to normal tissue (often <30 mmHg)
• Increasing the PaO2 increases bactericidal superoxide radicals, but also cause endothelial cell damage, tissue necrosis, & impair the antibacterial function of macrophages

Supplemental Perioperative Oxygen
• 500 patients undergoing elective colorectal resection randomized to 30% O2 vs. 80% O2 during surgery & first 2 hours of recovery
30% O2 80% O2 P
Wound infection 11.2% 5.2% 0.01
ICU admission 4.8% 2.0% 0.14
LOS after surgery 11.9 days 12.2 days 0.26
Mortality 2.4% 0.4% 0.13
Greif R et al. New Engl J Med 2000;342:161-7.

Supplemental Perioperative Oxygen
• 165 patients undergoing elective abdominal surgery randomized to 35% O2 vs. 80% O2 during surgery & first 2 hours of recovery
35% O2 80% O2 P
Wound infection 11.3% 25.0% 0.02
ICU admission 8.8% 11.3% 0.60
LOS after surgery 6.4 days 8.3 days 0.07
Pryor KO et al. JAMA 2004;291:79-97.