intel® parallel amplifier sample code guide -
TRANSCRIPT

Intel® Parallel Amplifier Sample Code Guide
The Intel® Parallel Amplifier analyzes the performance of your application and provides information on the performance bottlenecks in your code. It enables you to focus your tuning efforts on the most critical sections of your code to get the best performance boost in the least amount of time.
The goal of this guide is to introduce the Amplifier features for supporting:
• Multithreaded applications with OpenMP* threading, compiled using the Intel® Parallel Composer.
• Multithreaded applications that use Intel® Threading Building Blocks (Intel® TBB) and are compiled using the Intel® Parallel Composer.
The Amplifier uses the instrumented code that the Intel Parallel Composer generates, to correlate performance measurements with source code OpenMP constructs, enabling you to easily navigate the code from Amplifier views.
NOTE: The Intel® Parallel Composer is part of the Intel Parallel Studio. If you use the Microsoft* compiler some analyses will be incomplete. For OpenMP applications, the OpenMP constructs are not recognized as such. The more complete analysis requires longer execution times during instrumentation.
After completing this guide, you will be able to use the Amplifier to analyze your OpenMP or TBB code and understand where to focus your tuning efforts to gain the most performance improvement.
For a basic scenario of tuning your code using the Amplifier, see the Getting Started Guide available in the <install-dir>\documentation\<locale> folder of your
installation.
Contents
1 Preparation ......................................................................................................2
2 The OpenMP* Application ...................................................................................2
3 The Intel® Threading Building Blocks Application ..................................................9
4 User and Reference Documentation ...................................................................15
Legal Information ...............................................................................................................15

Intel® Parallel Amplifier
Sample Code Guide
2 Document Number: 321686-001US
1 Preparation 1. Copy the IS.zip and TBB_reduction.zip files to a writable share on your
system, such as C:\My Documents\Amplifier\Samples. This returns the source code to its original state in case the sample application has been run previously.
NOTE: By default, <install_dir> is C:\Program Files\Intel\Parallel Studio\Amplifier. For systems with Intel® 64 architecture, it is C:\Program Files (x86)\Intel\Parallel Studio\Amplifier.
2. Extract the sample files from the .zip files.
2 The OpenMP* Application
Before you start, you need to build the sample application in the Microsoft* Visual Studio* environment. The IS application, referred to in this guide, performs a sorting operation that is important in particle method codes. It tests both integer computation speed and communication performance.
NOTE: This guide describes the IS8 project that uses the Intel® Parallel Amplifier and the Intel® Parallel Composer, integrated into Visual Studio 2005. The Visual Studio 2008 project is named IS9. Additional files for this project are provided in the IS\IS9 folder
in the location you used to unzip the sample.
To build the IS application:
1. From Visual Studio, go to File > Open > Project/Solution and browse to the local folder where you copied the solution files to. The solution is added to Visual Studio and shows up in the Solution Explorer.
2. In the Solution Explorer, right-click the project and select Intel Parallel Composer > Use Intel C++. The project in the solution appears with the
Composer icon .
3. Set the application to release mode, go to Build > Configuration Manager and set the Configuration row to Release.
4. Go to Build > Build Solution. The IS.exe application is built, using the Intel Parallel Composer.

The OpenMP* Application
The IS application in this guide is built in the Release configuration with Optimizations on. The latter is recommended for the performance analysis. The debug symbol generation is enabled so that the Amplifier can open the source code.
The results in this guide were taken while analyzing the application on a two-core system. Different system configuration will provide different results.
Where is My Program Spending Time? After building the application, you can analyze its performance. The Intel® Parallel Amplifier provides several types of analysis to collect different types of performance data. In this step, you will run the Hotspot analysis to collect data, view the results, and zoom into the specific problem areas of the source code. The Hotspot analysis helps you understand where your application is spending time, identifies the most time-consuming functions, and shows how they were called. Some hotspots may indicate bottlenecks that can be removed, while other hotspots are inevitable and take a long time to execute due to their nature.
The Hotspot analysis is useful for both serial and parallel applications.
After building your application, run the Hotspot analysis:
1. Run the Hotspot analysis of the application in Visual Studio. From the Amplifier toolbar, select Hotspots – Where is my program spending time running?
2. Click the Profile button. The Amplifier launches the IS8 application that sorts large integers and exits.
When data collection completes, the Hotspots Bottom-up window opens. You will analyze the information in this window later in this document. For the purpose of a baseline, note the Summary Tab information. The Elapsed Time is your baseline for this phase of examining the application.
NOTE: The screen images and execution time data provided in this guide are created on a system with two CPU cores. Your data may vary on systems with different numbers of CPU cores.
Look at the Hotspots analysis window and identify the hotspots - functions/code sections that took a long time to execute.
Sample Code Guide 3
Intel® Parallel Amplifier
Sample Code Guide
4 Document Number: 321686-001US
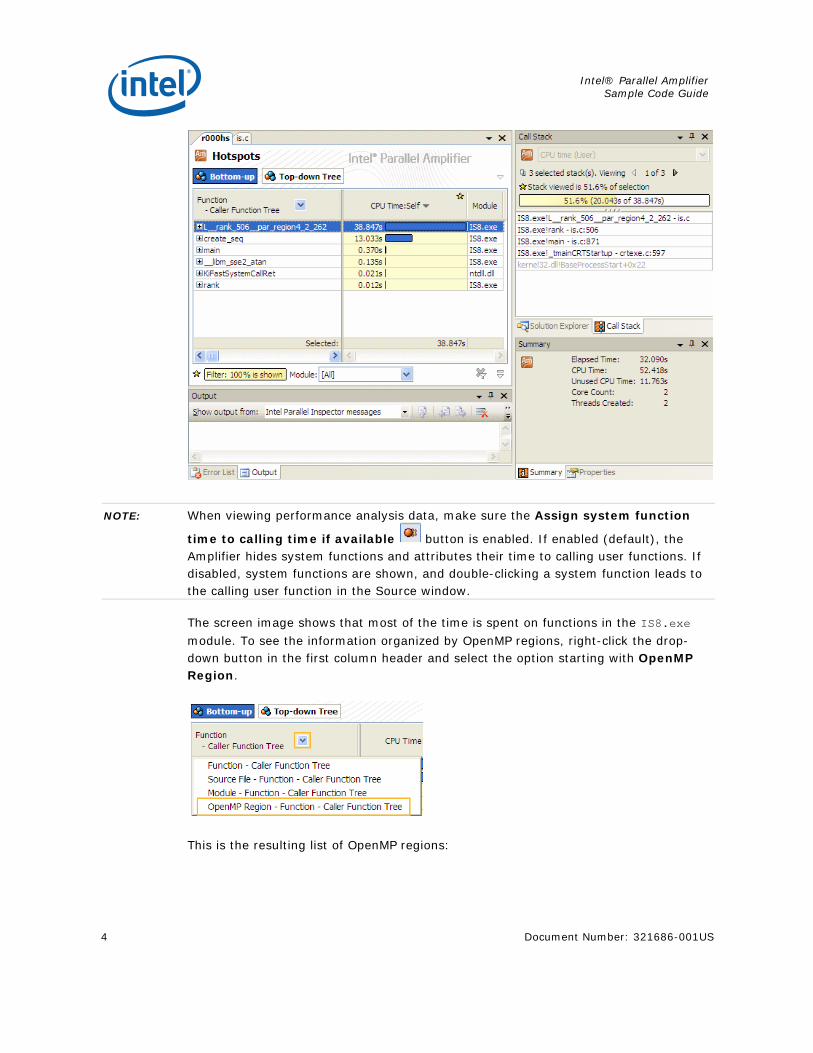
NOTE: When viewing performance analysis data, make sure the Assign system function
time to calling time if available button is enabled. If enabled (default), the Amplifier hides system functions and attributes their time to calling user functions. If disabled, system functions are shown, and double-clicking a system function leads to the calling user function in the Source window.
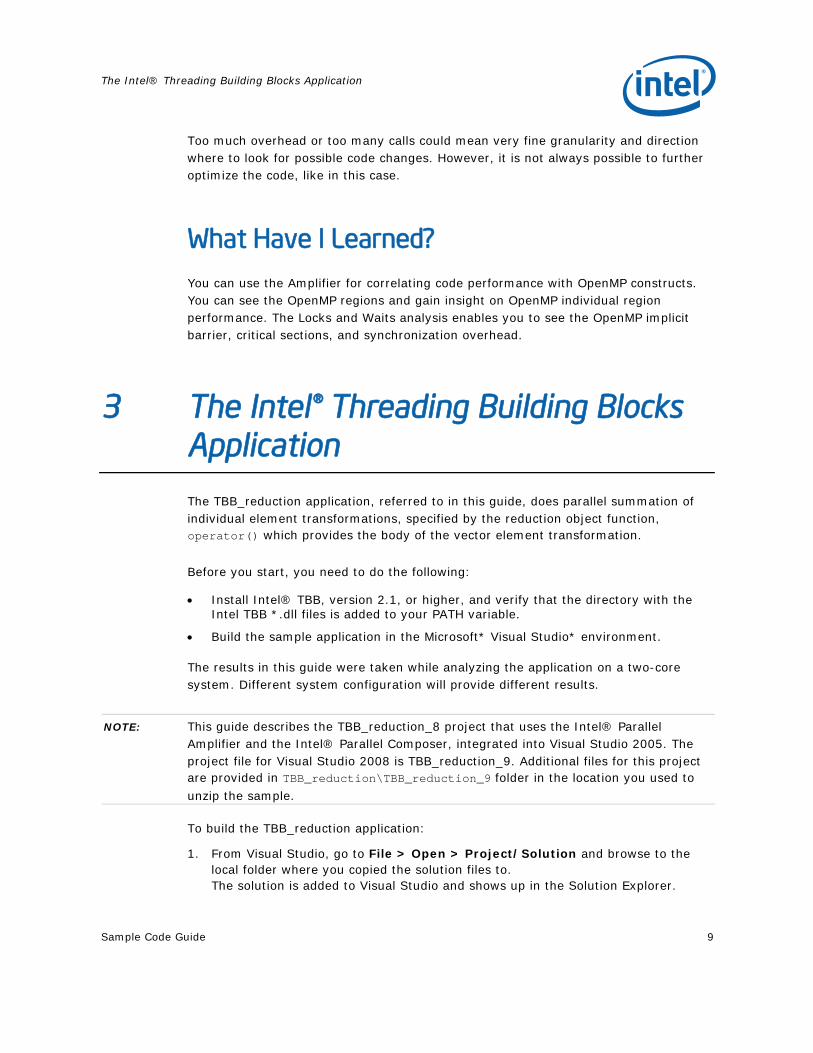
The screen image shows that most of the time is spent on functions in the IS8.exe
module. To see the information organized by OpenMP regions, right-click the drop-down button in the first column header and select the option starting with OpenMP Region.
This is the resulting list of OpenMP regions:

The OpenMP* Application
This screen image shows that the main bulk of CPU time is spent in OpenMP regions relating to rank() and main().
Where is My Concurrency Poor? The next step is to use the other analysis types to get more information on the application and on the hotspots.
To run the Concurrency analysis, from the Amplifier toolbar, select Concurrency – Where is my concurrency poor? and click Profile. When the IS8 application exits, the Amplifier finalizes the results and opens the Concurrency Bottom-up window:
The Concurrency Bottom-up window shows that this application is threaded and the average utilization is very close to two which is the best possible utilization on this system with two logical CPUs.
Sample Code Guide 5

Intel® Parallel Amplifier
Sample Code Guide
6 Document Number: 321686-001US
Look at the OpenMP regions for the Concurrency results: right-click the drop-down in the Function header and select OpenMP Region.
Notice that the OpenMP region related with main() shows Ideal concurrency for almost all of the CPU time. However, the region related with rank() shows that some
of the CPU time had poor concurrency. This is the function that you should investigate further.
Click on the + sign next to the function name to see the next level of callers to that function. These are the functions that are related to the OpenMP region highlighted earlier. Click on the + sign next to the function name to see the next level of callers to that function. These functions are all in the OpenMP runtime library:

The OpenMP* Application
Double-click the hotspot L__rank_506__par_region4_2_262 function to view the
source code:
Where is My Program Waiting The next step is to use the Lock and Waits analysis to get more information on the application synchronization events.
To run the Locks and Waits analysis, from the Amplifier toolbar, select Locks and Waits – Where is my program waiting? and click Profile. When the IS8 application exits, the Amplifier finalizes the results and opens the Locks and Waits Bottom-up window.
Sample Code Guide 7

Intel® Parallel Amplifier
Sample Code Guide
8 Document Number: 321686-001US
Again, set the view to show the OpenMP synchronization events and click the Assign
system function time to calling time if available button to view system functions data.
Locks and Waits show the cost of using OpenMP in user code. Click on the Call Stack tab on the right to see the functions that called the OpenMP code. This is overhead spent in Intel OpenMP runtime library: libiomp5md.dll.
If threads waited on an implicit barrier, this indicates imbalance of parallel work distribution by threads. In this case you can consider another type of parallel work scheduling to remove barriers.
The Intel® Threading Building Blocks Application
Too much overhead or too many calls could mean very fine granularity and direction where to look for possible code changes. However, it is not always possible to further optimize the code, like in this case.
What Have I Learned? You can use the Amplifier for correlating code performance with OpenMP constructs. You can see the OpenMP regions and gain insight on OpenMP individual region performance. The Locks and Waits analysis enables you to see the OpenMP implicit barrier, critical sections, and synchronization overhead.
3 The Intel® Threading Building Blocks Application
The TBB_reduction application, referred to in this guide, does parallel summation of individual element transformations, specified by the reduction object function, operator() which provides the body of the vector element transformation.
Before you start, you need to do the following:
• Install Intel® TBB, version 2.1, or higher, and verify that the directory with the Intel TBB *.dll files is added to your PATH variable.
• Build the sample application in the Microsoft* Visual Studio* environment.
The results in this guide were taken while analyzing the application on a two-core system. Different system configuration will provide different results.
NOTE: This guide describes the TBB_reduction_8 project that uses the Intel® Parallel Amplifier and the Intel® Parallel Composer, integrated into Visual Studio 2005. The project file for Visual Studio 2008 is TBB_reduction_9. Additional files for this project are provided in TBB_reduction\TBB_reduction_9 folder in the location you used to
unzip the sample.
To build the TBB_reduction application:
1. From Visual Studio, go to File > Open > Project/Solution and browse to the local folder where you copied the solution files to. The solution is added to Visual Studio and shows up in the Solution Explorer.
Sample Code Guide 9

Intel® Parallel Amplifier
Sample Code Guide
10 Document Number: 321686-001US
2. In the Solution Explorer, right-click the project and select Intel Parallel Composer > Use Intel C++. The projects in the solution appear with the
Composer icon .
3. Go to Build > Build Solution. The TBB_reduction.exe application is built, using the Intel Parallel Composer.
NOTE: By default, on 32-bit Windows* based systems, <install_dir> is C:\Program Files\Intel\Parallel Studio\Amplifier. For 64-bit systems, it is C:\Program Files (x86)\Intel\Parallel Studio\Amplifier
The TBB_reduction application in this guide is built in the release mode with full optimizations. The latter is recommended for the performance analysis. The debug symbol generation is enabled so that the Amplifier can open the source code.
Where is My Concurrency Poor? After building the application, you can analyze its performance. The Intel® Parallel Amplifier provides several types of analysis to collect different types of performance data. Since this application is already multi-threaded, you will start with the Concurrency analysis to collect data, view the results, and investigate a specific threading issue.
After building your application, run the Concurrency analysis:
1. Run the Concurrency analysis of the application in Visual Studio. From the Amplifier toolbar, select Concurrency – Where is my concurrency poor?
2. Click the Profile button. The Amplifier launches the TBB_reduction application and exits.

The Intel® Threading Building Blocks Application
The Summary tab shows that the overall Elapsed time is 0.682s and the average utilization is 1.18. The best possible utilization on this system with two logical CPUs is 2.0, so there is an opportunity to improve the concurrency and the overall performance of this application.
Expand the function with the longest CPU time. You can see that this time is spent on Intel TBB system functions.
Where is My Program Waiting The next step is to use the Lock and Waits analysis to get more information on the application synchronization events.
Sample Code Guide 11

Intel® Parallel Amplifier
Sample Code Guide
12 Document Number: 321686-001US
To run the Locks and Waits analysis, from the Amplifier toolbar, select Locks and Waits – Where is my program waiting? and click Profile.
When the TBB_reduction application exits, the Amplifier finalizes the results and opens the Locks and Waits Bottom-up window.
The Locks and Waits Bottom-up window shows the longest wait on the tbb::spin_mutex 0x6ab070fc synchronization object.
To fix this issue, you need to rebuild the code in Debug mode:
1. Go to Build > Configuration Manager and set the item under the Configuration column, to Debug.
2. Rebuild the solution.
3. Run the Locks and Waits analysis again.
Double-click the tbb::spin_mutex 0x6ab070fc synchronization object in the Locks
and Waits Bottom-up window to view the source code:

The Intel® Threading Building Blocks Application
This code line is causing a long wait.
To check whether this code line can be removed:
1. Double-click the line to open the Editor. Add “//” before this code line to comment it out.
2. Save and Rebuild the project in the Release mode.
3. Run the Concurrency analysis again.
This is the result:
The Ideal concurrency is much longer in this result. The Summary tab shows that the overall Elapsed time is 0.368s and the average utilization is 1.70.
Use the Amplifier compare feature to compare the results before and after the code change you implemented:
1. Click the button from the toolbar.
Sample Code Guide 13

Intel® Parallel Amplifier
Sample Code Guide
14 Document Number: 321686-001US
2. In the Compare results dialog box, enter the result names of the two results you wish to compare. You can see the list of results for your project in the Solution Explorer, under the My Amplifier Results folder.
3. Click Compare to create a compare window that shows the results side by side.
These are the Self Time Compare results for the 003 result (after removing the mutex) and the 000 result (with the mutex).
And this is the Summary tab for the comparison:
The 003 result (without the mutex) has reduced Elapsed Time and higher Ideal Concurrency time.
What Have I Learned? You can use the Amplifier to correlating code performance to Intel TBB constructs. The Locks and Waits analysis enables you to see the Intel TBB mutexes, and

User and Reference Documentation
synchronization overhead, helping you to understand the cost of using Intel TBB concurrency. The Compare feature enables view two results side by side.
4 User and Reference Documentation
This guide focuses on basic OpenMP and Intel TBB features of the Intel® Parallel Amplifier. To explore more features and get most of the Amplifier, try the following resources:
Resource Notes
Intel® Parallel Amplifier Documentation
Use this HTML page to locate other amplifier resources. To open this HTML page, from the Windows* Start menu, choose Intel Parallel Studio > Parallel Studio Documentation > Amplifier Help.
Intel® Parallel Studio resources
Intel Parallel Studio provides the most comprehensive set of tools for parallelism including Intel® Parallel Amplifier, Intel® Parallel Composer, and Intel® Parallel Inspector.
Refer to the Getting Started with the Parallel Studio for an overview of all the components in the Parallel Studio. From the Windows* Start menu, choose Intel Parallel Studio > Getting Started > Parallel Studio Getting Started Guide.
To open documentation that points to more resources for each installed Intel Parallel Studio tool, from the Windows* Start menu, choose Intel Parallel Studio > Parallel Studio Documentation > tool name Documentation.
You can find additional information on the Intel® Parallel Studio at http://www.intel.com/software/products
Legal Information
INFORMATION IN THIS DOCUMENT IS PROVIDED IN CONNECTION WITH INTEL® PRODUCTS. NO LICENSE, EXPRESS OR IMPLIED, BY ESTOPPEL OR OTHERWISE, TO ANY INTELLECTUAL PROPERTY RIGHTS IS GRANTED BY THIS DOCUMENT. EXCEPT AS PROVIDED IN INTEL'S TERMS AND CONDITIONS OF SALE FOR SUCH PRODUCTS, INTEL ASSUMES NO LIABILITY WHATSOEVER, AND INTEL DISCLAIMS ANY EXPRESS OR IMPLIED WARRANTY, RELATING TO SALE AND/OR USE OF INTEL PRODUCTS INCLUDING LIABILITY OR WARRANTIES RELATING TO FITNESS FOR A PARTICULAR PURPOSE, MERCHANTABILITY, OR INFRINGEMENT OF ANY PATENT, COPYRIGHT OR OTHER INTELLECTUAL PROPERTY RIGHT.
UNLESS OTHERWISE AGREED IN WRITING BY INTEL, THE INTEL PRODUCTS ARE NOT DESIGNED NOR INTENDED FOR ANY APPLICATION IN WHICH THE FAILURE OF THE INTEL PRODUCT COULD CREATE A SITUATION WHERE PERSONAL INJURY OR DEATH MAY OCCUR.
Intel may make changes to specifications and product descriptions at any time, without notice. Designers must not rely on the absence or characteristics of any features or instructions marked "reserved" or "undefined." Intel reserves these for future definition and shall have no responsibility whatsoever for conflicts or incompatibilities arising from future changes to them. The information here is subject to change without notice. Do not finalize a design with this information.
The products described in this document may contain design defects or errors known as errata which may cause the product to deviate from published specifications. Current characterized errata are available on request.
Sample Code Guide 15

Intel® Parallel Amplifier
Sample Code Guide
16 Document Number: 321686-001US
Contact your local Intel sales office or your distributor to obtain the latest specifications and before placing your product order.
Copies of documents which have an order number and are referenced in this document, or other Intel literature, may be obtained by calling 1-800-548-4725, or by visiting Intel's Web Site.
Intel processor numbers are not a measure of performance. Processor numbers differentiate features within each processor family, not across different processor families. See http://www.intel.com/products/processor_number for details.
BunnyPeople, Celeron, Celeron Inside, Centrino, Centrino logo, Core Inside, FlashFile, i960, InstantIP, Intel, Intel logo, Intel386, Intel486, Intel740, IntelDX2, IntelDX4, IntelSX2, Intel Core, Intel Inside, Intel Inside logo, Intel. Leap ahead., Intel. Leap ahead. logo, Intel NetBurst, Intel NetMerge, Intel NetStructure, Intel SingleDriver, Intel SpeedStep, Intel StrataFlash, Intel Viiv, Intel vPro, Intel XScale, IPLink, Itanium, Itanium Inside, MCS, MMX, Oplus, OverDrive, PDCharm, Pentium, Pentium Inside, skoool, Sound Mark, The Journey Inside, VTune, Xeon, and Xeon Inside are trademarks of Intel Corporation in the U.S. and other countries.
* Other names and brands may be claimed as the property of others.
Copyright © 2009, Intel Corporation.
Microsoft product screen shot(s) reprinted with permission from Microsoft Corporation.