interconnection process overview - pjm
TRANSCRIPT

PJM©2020www.pjm.com | Public
Interconnection Process Overview
Jason ConnellManager – Interconnection Projects
Susan McGillManager – Interconnection Analysis

PJM©20202www.pjm.com | Public
Purpose of the Interconnection Process
• Facilitate interconnection of new generation by performing planning analyses and coordinating with the transmission owners to ensure system reliability and generation deliverability to all PJM load.
• Guide developers through the interconnection process on a timely basis while maintaining fair and equitable treatment between customers within the terms and conditions of the PJM Tariff.
• Provide the cost to physically connect the generator to the transmission system along with all necessary network upgrades.

PJM©20203www.pjm.com | Public
Foundations of the Interconnection Process
• Adherence to federal policy
• Studies conducted consistent with annual RTEP studies
• Generation deliverable to all PJM load
• Cost assigned to the causer
• All projects treated equally regardless of size, location or fuel

PJM©20204www.pjm.com | Public
Topics
• Process overview
• Interim deliverability and rights
• Recent trends
• Recent changes
• Other RTO processes

PJM©2020www.pjm.com | Public
PJM Interconnection Process Overview

PJM©20206www.pjm.com | Public
Process Diagram

PJM©20207www.pjm.com | Public
PJM Department Roles
Interconnection Projects• Single point of contact for
study phases– Interconnection
customers– Transmission owner– Interconnection Analysis
engineers
• Process facilitation and mediation
• Draft & review reports
• Draft service agreements
Interconnection Analysis• Model and study all
projects– Load flow, short circuit and
stability analysis
• Test system upgrades from transmission owners
• Calculate cost responsibility
• Coordinate with neighboring RTOs
Infrastructure Coordination• Single point of contact for
construction phase– Interconnection customers– Transmission owner– Interconnection Analysis
engineers
• Oversight of billing
• Coordination of model in operations systems and final testing
PJM©20208www.pjm.com | Public
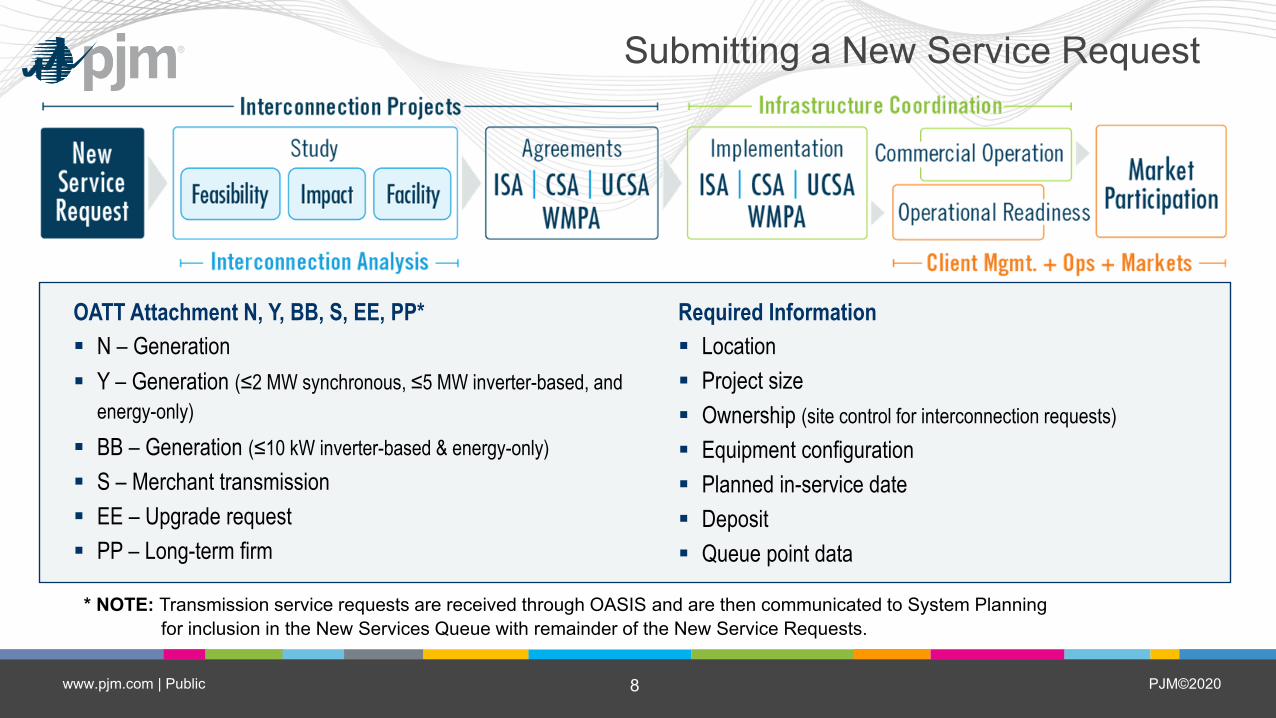
Submitting a New Service Request
* NOTE: Transmission service requests are received through OASIS and are then communicated to System Planningfor inclusion in the New Services Queue with remainder of the New Service Requests.
OATT Attachment N, Y, BB, S, EE, PP* N – Generation Y – Generation (≤2 MW synchronous, ≤5 MW inverter-based, and
energy-only) BB – Generation (≤10 kW inverter-based & energy-only) S – Merchant transmission EE – Upgrade request PP – Long-term firm
Required Information Location Project size Ownership (site control for interconnection requests) Equipment configuration Planned in-service date Deposit Queue point data

PJM©20209www.pjm.com | Public
Feasibility Study
Required− Deposit for interconnection requests based
on request receipt timing and MW size − Site control for generation requests− In-service date within 7 years of entering queue
Customer can select a primary and secondary Point of Interconnection (POI) Study Completion: Target approximately
120 days after close of queue Study participants: PJM & TO (Contractor under TO)
Results− Attachment facilities needed for interconnection − Powerflow Analysis – Identify thermal overloads
and required upgrades (costs and construction schedule estimates for primary POI)
− Powerflow Analysis – Identify thermal overloads with secondary POI (no cost/schedule estimates)
− Short-Circuit Analysis Customers receive a Feasibility Study Report and have
30 days to sign a System Impact Study Agreement (SISA)

PJM©202010www.pjm.com | Public
System Impact Study
Required− Deposit based on MW size − Initial Air Permit Application (N/A for solar/wind projects)
− Ownership (Transmission Interconnection Requests)
Customer must select a single POI (if two were evaluated in the Feasibility Study) Study Completion: Target 120 days after start of queue
study or execution of System Impact Study Agreement Study participants: PJM & TO (contractor under TO)
and affected systems (FSA)
Results− Summer-peak powerflow analysis − Light-load powerflow analysis (if applicable)
− Short-circuit analysis− Other Powerflow analyses as applicable− Cost estimates and allocations
Customers receive a System Impact Study Report and have 30 days to sign a Facility Study Agreement (FSA)

PJM©202011www.pjm.com | Public
Facilities Study
Conduct governed by procedures as set forthin Attachment D of Manual M-14A
Required− Deposit based on MW size
Completion − Dependent on individual transmission
owner zone and queue volume Study By
− TO (or contractor under direction of TO)− Affected system study
Potential for System Impact Study re-tool analysis Stability analysis Additional studies as required by type of technology
being connected Facility Study Report: conceptual design Attachment facilities Network upgrades
− Cost estimates− Preliminary engineering and construction schedule

PJM©202012www.pjm.com | Public
Interconnection Process Timing
Year 1 Year 1 Year 1
Year 1
J F M A M J J A S O N D
Year 2
J F M A M J J A S O N D
Queue Window FeasibilityStudy
System Impact Study Facilities Study
Year 3
J F M A M J J A S O N D
Queue Window Feasibility Study
System Impact Study Facilities Study
PJM model build and analysis
Customer reviews reports and returns next study
agreement
Customer reviews final reports and executes Interconnection
Service Agreement
Ideal timeline – 26 months

PJM©202013www.pjm.com | Public
Small Generation Timeline (≤20 MW)
• Feasibility and System Impact Studies combined during the Feasibility Study window.
• Permitted when:– Project is 20 MW or less– Does not cause any transmission system violations– Does not request a Secondary Point of Interconnection

PJM©202014www.pjm.com | Public
Small Generation Timeline (≤20 MW)
J F M A M J J A S O N D
Year 1
J F M A M J J A S O N D
Year 2
Queue Window
Feasibility Study
System Impact Study Facilities Studies
J F M A M J J A S O N D
Year 3
Feas & Imp Study
Small generationexpedited process
Large generationprocess
ISA or WMPA issued to customer

PJM©202015www.pjm.com | Public
Interim Interconnection Service Agreement
Interim Interconnection Service Agreement
Can be requested at any time prior to the issuance of an Interconnection
Service Agreement
Allows engineering and procurement to start while the project is under
study
Scope must be mutually agreed to by customer and transmission owner
Does not allow a project to interconnect or grant any rights

PJM©202016www.pjm.com | Public
Material Modification: A change that has a material adverse impact/effect to any later subsequently queued project in relation to scope, cost or time.
Changes that result in a Material Modification will not be accepted by PJMfor current queue position held.
A project may never increase the Maximum Facility Output (MFO) or Capacity Interconnection Rights (CIR) without an additional new service request.
A change in fuel type would require a Material Modification review.
Significant changes to POI are considered material. Project must be withdrawn, and a new interconnection request submitted for the modification.(Tariff Section 36.2A.3)
Project Modifications: Tariff Section 36.2A

PJM©202017www.pjm.com | Public
A Technological Advancement submitted to PJM no later than the return of an executed Facilities Study Agreement (or return of an executed ISA if a Facilities Study is not required) is classified as a Permissible Technological Advancement if the proposed change does not:
Increase the capability of the generating facility
Represent a different fuel type
Cause any material adverse impact(s) on the transmission system
If a proposed technological advancement is deemed a Permissible Technological Advancement, then the proposed change will not be considered a Material Modification, and no additional PJM study will be required. All other proposed technological changes will require a study to determine if the change would constitute a Material Modification.
Permissible Technological Advancement: New Tariff Section 36.2A.22

PJM©202018www.pjm.com | Public
Modification Prior to the Commencement of the Feasibility Study (Tariff Section 36.2A.1.1)
Interconnection customer may reduce its project by up to 60 percent of the electrical output. Timing of the announcement depends on which month of the queue they entered:
i. For projects that enter the queue in months 1–5, customer must identify the change prior to the close of business on the last day of the sixth month.
ii. For projects that enter the queue in month 6, the customer must identify the change no later than close of business on the day following the completion of the scoping meeting.
Reduction Rules: Tariff Section 36.2A.1.1

PJM©202019www.pjm.com | Public
Reduction Rules: Tariff Section 36.2A.1.2
Modification After the Start of the Feasibility Study but Prior to Executing a System Impact Study Agreement (Tariff Section 36.2A.1.2)
Interconnection customer may reduce its project by up to 15 percent of the electrical output. For a request to reduce by more than 15 percent, customer must request PJM to determine whether such a change would be a Material Modification. PJM will allow the customer to reduce the size of its project:
i. To any size if PJM determines the change is not a Material Modification, or
ii. By up to 60 percent of the electrical output if PJM determines it is material; however, in this casethe project would be removed from its current position and be assigned a new queue position at the beginning of the subsequent queue, and your future studies will be performed consistent with the timing of studies for projects submitted in the subsequent queue.

PJM©202020www.pjm.com | Public
Reduction Rules: Tariff Section 36.2A.2
Modifications After the System Impact Study Agreement but Prior to Executing an Interconnection Service Agreement (Tariff Section 36.2A. 2)
Interconnection customer may reduce its project by the greater of 10 MW or 5 percent of the electrical output. For a request to reduce by more than this, customer must request PJM to determine whether such a change would be a Material Modification. PJM will allow the customer to reduce the size of its project:
i. To any size if PJM determines the change is not a Material Modification, or
ii. By up to the greater of 50 MW or 20 percent of the electrical output if PJM determines it is material; however, in this case the project would be removed from its current position and be assigned a new queue position at the beginning of the subsequent queue, and a new System Impact Study will be performed consistent with the timing of studies for projects submitted in the subsequent queue.

PJM©202021www.pjm.com | Public
Agreements
Agreement Type New Service Customer FERC Jurisdictional ?
Interconnection Service Agreements (ISA) Generation/Transmission Interconnection Customer Yes
Wholesale Market Participation Agreements (WMPA) Generation Interconnection Customer No
Interconnection ConstructionService Agreement (CSA) Generation/Transmission Interconnection Customer Yes
Upgrade Construction Service Agreement (UCSA)
Transmission Interconnection Customer(Merchant Network Upgrades) Yes

PJM©202022www.pjm.com | Public
ISA and CSA Overview
Interconnection Service Agreement
Grants rights to interconnect and generate Defines project milestones Describes the project’s point of
interconnection Describes system upgrades and costs Outlines metering requirements Security requirement Persists after construction
Construction Service Agreement
Outlines construction responsibility Contains upgrade construction schedule Contains notification and insurance
obligations Terminates after construction

PJM©202023www.pjm.com | Public
WMPA Overview
Wholesale Market Participant Agreement
Connects to distribution line
No prior wholesale sales
Requires customer to pursue a two-party Interconnection
Agreement with TO
Grants rights to participate in PJM’s market
Persists after construction

PJM©202024www.pjm.com | Public
Agreement Implementation
Periodic construction status meetings Outage coordination Billing and cost tracking for each
network upgrade number
PJM’s Responsibilities:
Metering and telemetry from IC to PJM Test energy injection Project close out

PJM©2020www.pjm.com | Public
Interim Deliverability and Rights

PJM©202026www.pjm.com | Public
Interim Deliverability Study is targeted toward: Projects coming into service prior to the study year Projects that are dependent on a network or baseline upgrade
that expect the dependent reinforcement to be not completed at the time of the project coming online*
Interim Deliverability Study
*Only facilities identified at constraints in the System Impact Study will be monitored

PJM©202027www.pjm.com | Public
Incremental Auction Study Timeline
Ongoing Bilateral Market
Delivery YearBase Residual Auction
3 years
Second Incremental Auction
Third Incremental Auction
June May
3 months
10 months
First Incremental Auction
20 months
EFORd Fixed
May
Feb.July
Sept.

PJM©202028www.pjm.com | Public
Example Schedule for 2020
2nd IA 2021
Study Begin: February 2020 Study End: June 2020 Auction Date: August 1st Week
1st IA 2022
Study Begin: June 2020 Study End: August 2020 Auction Date: October 1st Week
3rd IA 2021
Study Begin: September 2020 Study End: January 2021 Auction Date: March 1st Week
*BRA studies are performed as needed
Scheduled Interim Studies
1st IA 2022
2nd IA 2021
3rd IA 2021

PJM©2020www.pjm.com | Public
Recent Trends

PJM©202030www.pjm.com | Public
New Generation Requests
495 408244 239 280 352 424 387 470
708
970
2010 2011 2012 2013 2014 2015 2016 2017 2018 2019 2020 YTD
New Requests Submitted to PJM
23,936 MW 28,958 MW22,808 MW
15,368 MW22,874 MW
38,043 MW 37,823 MW27,266 MW
62,001 MW 65,350 MW 67,550 MW
2010 2011 2012 2013 2014 2015 2016 2017 2018 2019 2020 YTD
Proposed Generating Capability, MW
As of Oct. 20, 2020

PJM©202031www.pjm.com | Public
Study Volume and On-Time Rates
86%
65%
34%30%
70%
100%
0
100
200
300
400
500
600
700
800
2015
2016
2017
2018
2019
2020
Num
ber o
f Stu
dies
Feasibility Studies
75%
39%
31%
22%
57%
95%
0
100
200
300
400
500
600
2015
2016
2017
2018
2019
2020
Num
ber o
f Stu
dies
System Impact Studies
8% 6% 9%5%
0% 1%0
20
40
60
80
100
120
140
160
180
200
2015
2016
2017
2018
2019
2020
Num
ber o
f Stu
dies
Facilities Studies
As of Oct. 20, 2020
-

PJM©202032www.pjm.com | Public
Current Interconnection Queue Volume
9375 71
90
393
336318
162
404
Projects by Proposed Capability
Natural Gas11,626 MW
Solar73,820 MW
Storage15,078 MW
Wind28,369 MW
Other Fuel1,000 MW Multiple Fuels
17,882 MW
1,600projects under study
147,775 MWproposed generation
capability
As of Oct. 20, 2020

PJM©2020www.pjm.com | Public
Recent Changes

PJM©202034www.pjm.com | Public
Recent Changes
• Order 845 metrics• Pre-queue / Post-ISA training• Improved manual language for site control
Education / Transparency• Streamlined small generation analysis• Improved Attachment Y treatment• Improved PJM tools for analysis and
reporting• 6-month schedule for TOs• Delayed start of stability analysis
Process
Flexibility• Order 845 permissible technological
advancement• Deficiency cure changes PJM Personnel
• Increased contractor support• Realigned interconnection departments

PJM©202035www.pjm.com | Public
Education and Transparency
Change Realized BenefitsOrder 845 performance metrics (link)
Standard method to compare the volume, performance rate and study duration for interconnection processes across the country
Pre-queue training (link) Recorded training walking through the application process and Queue Point along with high-level overview of process
Improved manual language for site control
Increased clarity on requirements for site-control evidence
PJM©202036www.pjm.com | Public
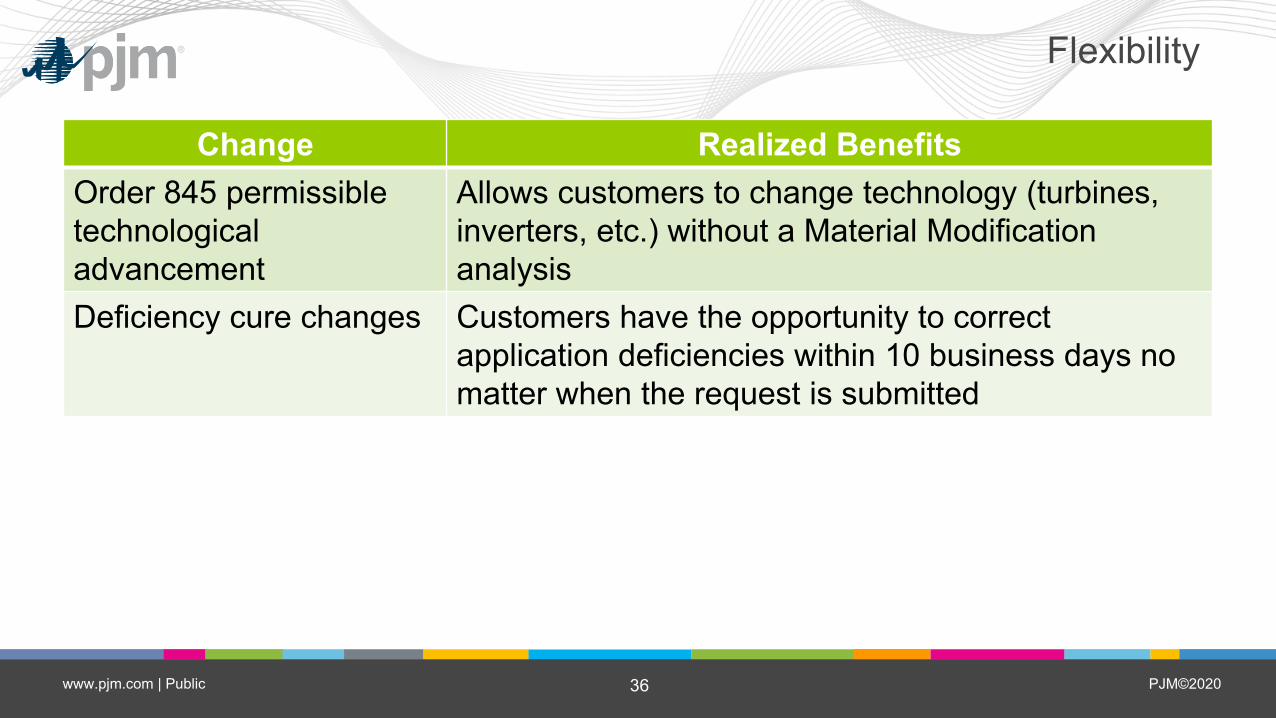
Flexibility
Change Realized BenefitsOrder 845 permissible technological advancement
Allows customers to change technology (turbines, inverters, etc.) without a Material Modification analysis
Deficiency cure changes Customers have the opportunity to correct application deficiencies within 10 business days no matter when the request is submitted

PJM©202037www.pjm.com | Public
Process
Change Realized BenefitsStreamlined small generation analysis
Improved internal processes to increase the number of small projects eligible for a combined Feasibility/System Impact Study
Updated Attachment Y treatment
Updated procedures to issue Attachment Y studies for requests on distribution lines within 90 days of submission of all required information
Improved PJM Tools for analysis and reporting
Improvements to TO analysis reports and standardized format of interconnection study reports
6-month schedule for TOs Schedule shared with TOs to assist in work planning in advance of interconnection deadlines
Delayed start of stability analysis
Reduced scope for System Impact Studies to help issue studies on time

PJM©202038www.pjm.com | Public
PJM Staffing
Change Realized BenefitsContractor support Supplementing PJM staff with contractors to perform
study work, draft reports and manage projectsDepartment realignment Creation of geographic teams to improve focus and
communication with TOs and customers

PJM©202039www.pjm.com | Public
Continued Challenges
• Large volume of projects leading to large volume of violations and upgrades– Total queued generation just below installed capability– Pockets of high density of proposed generation requests– Lower-voltage system infrastructure not designed to deliver high quantities of
energy
• Timeline to complete Facilities Studies– Large scope from network upgrades
• Duration to complete study process versus timeline to construct facilities
• Timelines with Affected System Studies

PJM©2020www.pjm.com | Public
RTO Comparison

PJM©202041www.pjm.com | Public
Distinctive Features of PJM
• Analysis of the transmission system and upgrades to ensure deliverability to all RTO load
• Planning criteria focuses on reliability not economics
• Planning criteria more conservative than NERC standards
• Cost for upgrades not reimbursed by load
• No obligation for ongoing transmission service

PJM©202042www.pjm.com | Public
RTO Benchmarks
PJM CAISO ERCOT ISO-NE MISO NYISO SPP
RTO statistics
Peak load, MW 165,492 50,116 74,850 25,000 127,125 33,956 50,662
Installed capability, MW 180,086 51,765 78,000 31,000 175,000 40,191 90,466
NERC Planning Authority Yes Yes Yes Yes Yes Yes
NERC Transmission Planner Yes No Yes No Yes Yes
Interconnection queue
Active projects 1,600 231 633 149 693 346 790
Proposed generation, MW 147,775 67,335 126,464 38,390 105,453 47,737 135,535
As of Oct. 20, 2020

PJM©202043www.pjm.com | Public
RTO Benchmarks
PJM CAISO ERCOT ISO-NE MISO NYISO SPP
Ratios
Queued generation / peak load 89% 134% 169% 154% 83% 141% 268%
Queued generation / installed 82% 130% 162% 124% 60% 119% 150%
Order 845 Metrics (aggregated)January–June 2020
N/A
Total studies issued (A) 650 101 17 526 34 0
Total studies issued late (B) 62 101 11 256 32 0
Backlogged studies (C) 198 0 0 429 14 0
Aggregate performance rate(B+C)/(A+C)
30.7% 0% 64.7% 71.7% 95.8%
As of Oct. 20, 2020
Performance rate measures late studies and backlogged studies. Any study phase with a rate greater than 25 percent for two consecutive reporting periods require a detailed filing to FERC explaining causes and corrective actions.

PJM©202044www.pjm.com | Public
Contact
Presenters: Jason [email protected] McGillSusan.McGil [email protected]
Interconnection Process Overview
Member Hotl ine(610) 666 – 8980(866) 400 – [email protected]