interim results presentation - mcbride - europe's … · interim results presentation. ... •...
TRANSCRIPT

Interim results presentationSix months to 31 December 2016Rik De Vos & Chris Smith22 February 2017
1 McBride plc McBride Interim Results Presentation February 2017
Agenda
1. Headlines
2. Repair, Prepare, Grow timeline
3. Market update
4. Commercial results
5. Achievements
6. Financial update
7. Prepare – strategy update
8. Outlook
Appendices
Financial schedules

2 McBride plc McBride Interim Results Presentation February 2017
Prepare phase – on track Quality of earnings continuing to improveStrategic•Growth strategy and associated capital
expenditure plans mostly complete
•Board considering expressions of interest to acquire the Group’s Aerosols activities
Tactical•Key feedstock prices have moved higher
in recent months and the outlook is for further increases
•Retail dynamics remain mixed in core markets
Financial•Adjusted operating profit £22.9 million,
up 30.1% (9.6% at constant currency), margin at 6.4% (2015: 5.1%)
•Underlying revenues down 4.5% (at constant currency), “customer choices” an additional 2.5%
•ROCE further developing to 28.0%, now within our strategic target range
• Interim payment to shareholders up 16.7% to 1.4 pence (2015: 1.2p)
3 McBride plc McBride Interim Results Presentation February 2017
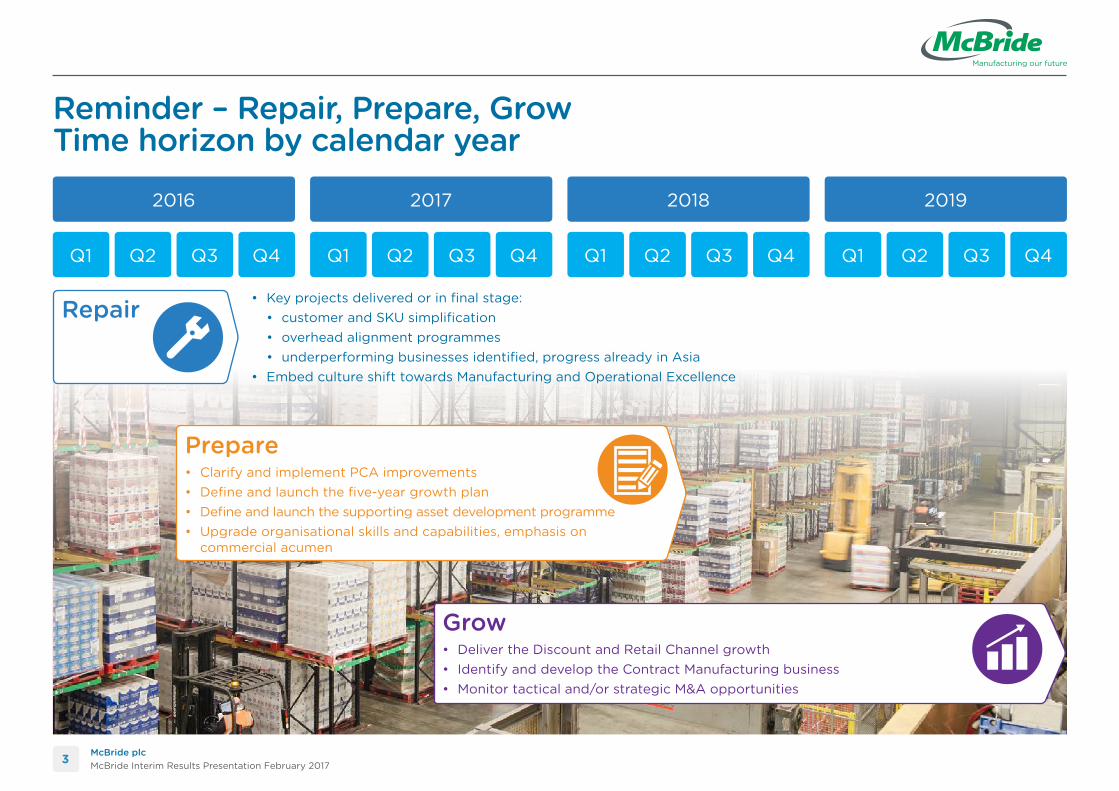
Grow• DelivertheDiscountandRetailChannelgrowth• IdentifyanddeveloptheContractManufacturingbusiness• Monitortacticaland/orstrategicM&Aopportunities
Reminder – Repair, Prepare, Grow Time horizon by calendar year
2016 2017 2018 2019
Q1 Q1 Q1 Q1Q2 Q2 Q2 Q2Q3 Q3 Q3 Q3Q4 Q4 Q4 Q4
Repair
Prepare• ClarifyandimplementPCAimprovements• Defineandlaunchthefive-yeargrowthplan• Defineandlaunchthesupportingassetdevelopmentprogramme• Upgradeorganisationalskillsandcapabilities,emphasisoncommercialacumen
• Keyprojectsdeliveredorinfinalstage: • customerandSKUsimplification • overheadalignmentprogrammes • underperformingbusinessesidentified,progressalreadyinAsia• EmbedcultureshifttowardsManufacturingandOperationalExcellence

4 McBride plc McBride Interim Results Presentation February 2017
Market update
•European FMCG market broadly flat
•Brands winning share over Private Label (“PL”)
•PL in Personal Care (“PC”) losing share
•Limited assortment discounters (“LADs”), varying growth
•EDLP reducing promotional activity, fading deflation
•Contract manufacturing requirements with brand owners increasing
•Asia growing in contract manufacturing, accelerating SE Asian PL presence
5 McBride plc McBride Interim Results Presentation February 2017
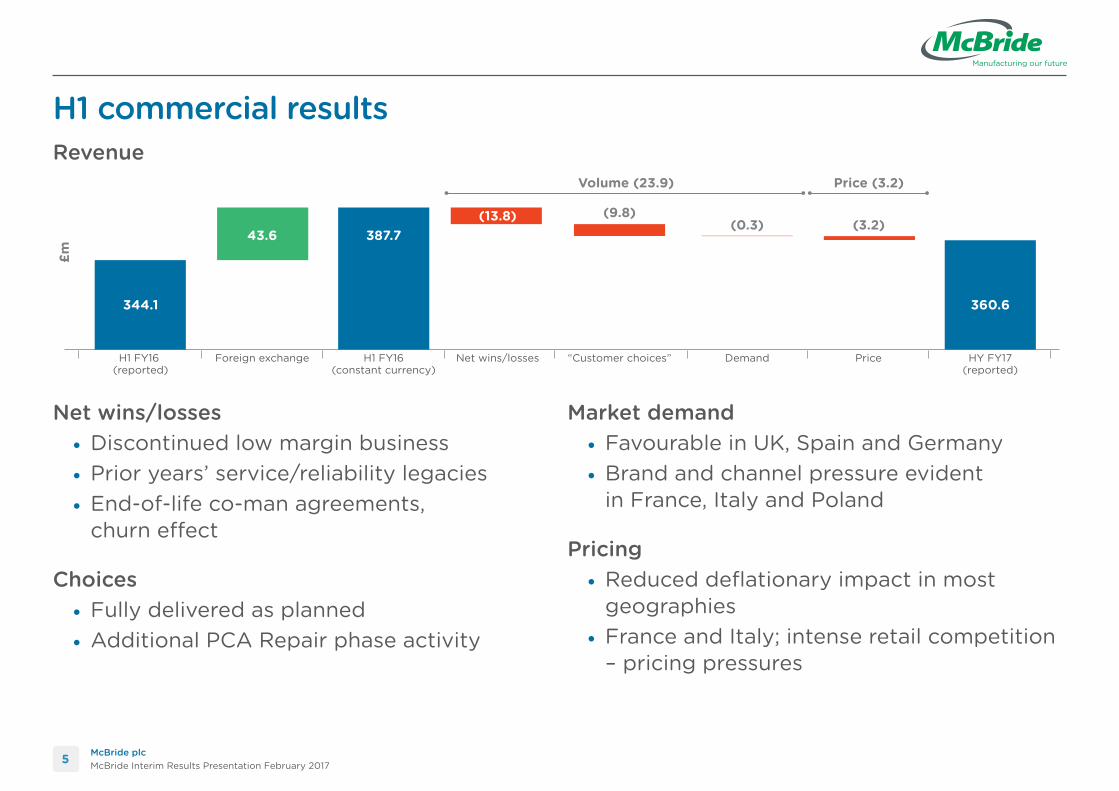
H1 FY16 (reported)
Foreign exchange H1 FY16(constant currency)
Net wins/losses “Customer choices” Demand Price HY FY17(reported)
344.1 360.6
43.6(13.8) (9.8)
Volume (23.9) Price (3.2)
(0.3)
£m
(3.2)387.7
H1 commercial results
Net wins/losses•Discontinued low margin business•Prior years’ service/reliability legacies•End-of-life co-man agreements,
churn effect
Choices•Fully delivered as planned•Additional PCA Repair phase activity
Market demand•Favourable in UK, Spain and Germany•Brand and channel pressure evident
in France, Italy and Poland
Pricing•Reduced deflationary impact in most
geographies•France and Italy; intense retail competition
– pricing pressures
Revenue
6 McBride plc McBride Interim Results Presentation February 2017
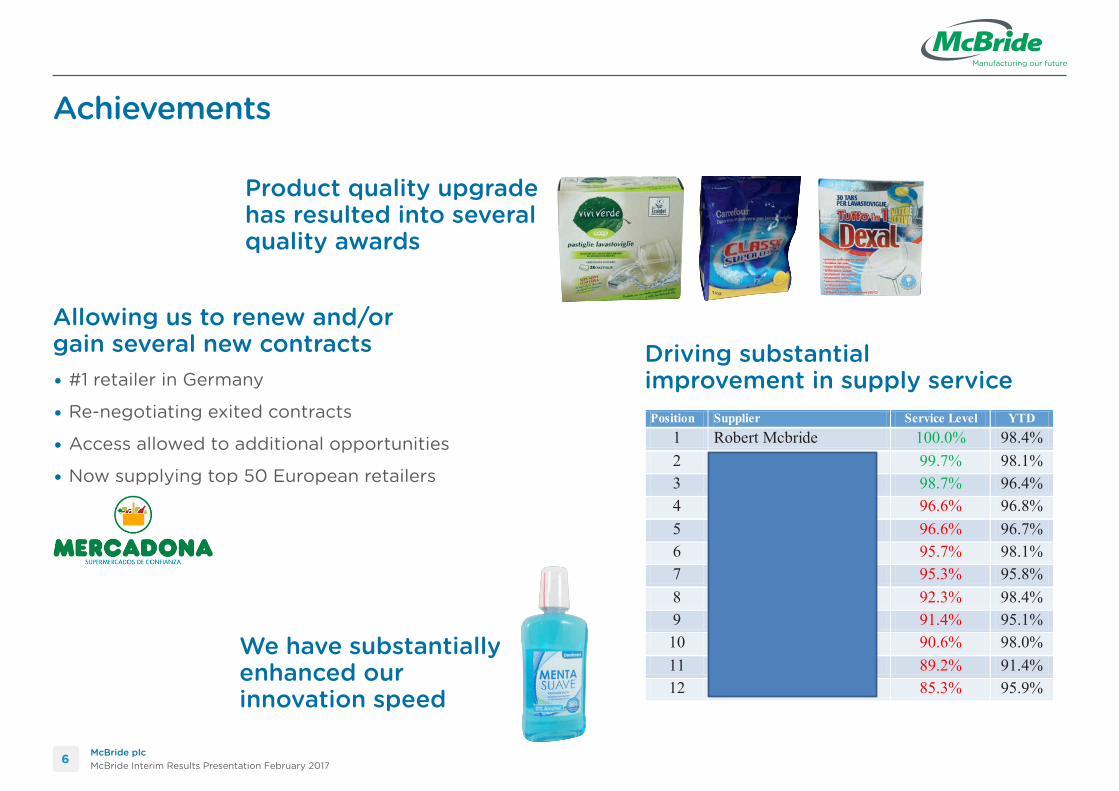
Achievements
Driving substantial improvement in supply service
Product quality upgrade has resulted into several quality awards
Allowing us to renew and/or gain several new contracts•#1 retailer in Germany
•Re-negotiating exited contracts
•Access allowed to additional opportunities
•Now supplying top 50 European retailers
We have substantially enhanced our innovation speed
Position Supplier Service Level YTD 1 Robert Mcbride 100.0% 98.4% 2 Unilever 99.7% 98.1% 3 SC Johnson 98.7% 96.4% 4 Procter & Gamble 96.6% 96.8% 5 Nestle Purina 96.6% 96.7% 6 Mars Petcare 95.7% 98.1% 7 Northwood & Wepa 95.3% 95.8% 8 Bob Martin 92.3% 98.4% 9 RB 91.4% 95.1% 10 SCA 90.6% 98.0% 11 C & D Foods 89.2% 91.4% 12 Kimberly-Clark 85.3% 95.9%
7 McBride plc McBride Interim Results Presentation February 2017
Financial headlines
•Adjusted operating profit £22.9 million, up by 9.6% at constant currency
•Positive progress on margin, adjusted operating margin now 6.4% (2015: 5.1%)
•Underlying Group revenues 4.5% lower at constant currency, “customer choices” project accounting for a further 2.5%
•Adjusted profit before taxation up 43.4% to £19.5 million (2015: £13.6m)
•Adjusted diluted EPS up 42.3% to 7.4 pence (2015: 5.2p)
•Strong cash generation continues with underlying net cash inflow of £14.8 million, net debt cover ratio down to 1.4x from 1.7x at year end 2016
•Positive progress on ROCE at 28.0%
• Interim payment to shareholders of 1.4 pence (2015: 1.2p), up 16.7% on last half year

8 McBride plc McBride Interim Results Presentation February 2017
• Impact of “customer choices”
•Price/volume drivers
•Raw materials
•Cost reduction
•Segment profits
•EPS development
Income statement
H1 H2
2014/15 2015/16
Constant currency
2016/17
383.6 376.8361.1
387.7360.6
HH PCA Corporate
2015/16 H1 2015/16 H2 2016/17 H2
0.91.51.6
-4.7 -4.5-4.5
26.523.723.8
Constant currency
2014/15 2015/16 2016/17
13.7
18.0
20.9 20.522.9
H1 H2Constant currency
Revenue £m
Adjusted EBITA by segment £m
Adjusted EBITA £m
Labour cost % of revenue and overhead % of gross profit
Labour cost % of revenue
FY 2014/15
19.7%
19.0%
18.5%
88.3%
85.2%
82.7%
FY 2015/16 H1 2016/17
Overhead % of gross profit

9 McBride plc McBride Interim Results Presentation February 2017
Balance sheet and cash flow
•Low level exceptional items
•Stable working capital
•FX impact on headline borrowings
•Debt cover and covenants
FY 2014/15
18.8%
FY 2015/16 H1 2016/17
23.4%
28.0%
ROCE %
86.390.9
82.91.9
1.7
1.4
1.7
Jun 15 Dec 15 Jun 16 Dec 16
Net debt Debt cover
92.4
Net debt £m/ debt cover x
24.922.7
32.9
H1 2014/15 H1 2015/16 H1 2016/17
Cash flow from operations £m
10 McBride plc McBride Interim Results Presentation February 2017
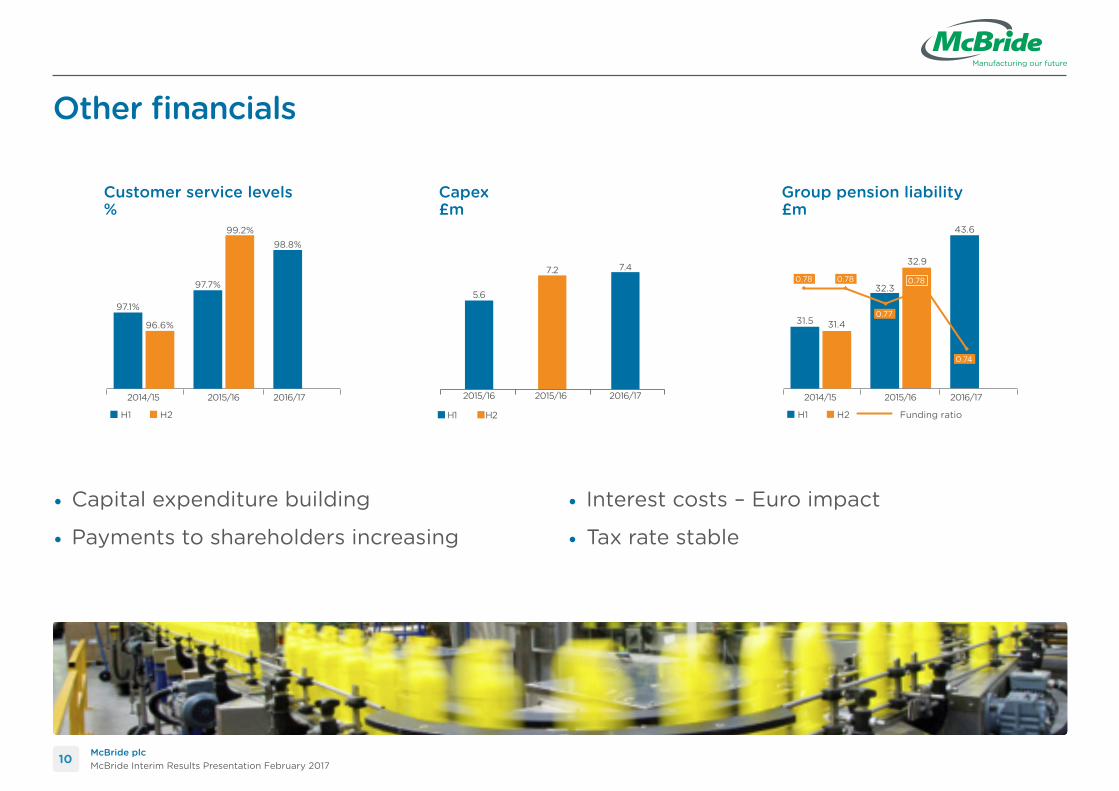
Other financials
•Capital expenditure building
•Payments to shareholders increasing
• Interest costs – Euro impact
•Tax rate stable
5.6
7.2 7.4
2015/16 2015/16 2016/17
H1 H2H1 H2
2014/15 2015/16
97.1%
96.6%
97.7%
2016/17
99.2%98.8%
Customer service levels %
43.6
Funding ratioH1 H2
2014/15 2015/16
31.5 31.4
2016/17
32.9
32.30.78 0.78
0.74
0.78
0.77
Group pension liability £m
Capex £m

11 McBride plc McBride Interim Results Presentation February 2017
Prepare phase – update
Sales strategy/proposition
Asset configuration
Organisational development
Mergers and acquisitions
PrepareMcBride will invest into its manufacturing assets and optimise its warehousing and distribution network. We will align the new organisational set-up aiming to institutionalise our new way of working with our people. We will provide a clear way forward for identified sub-optimal customer/categories and products.

12 McBride plc McBride Interim Results Presentation February 2017
Prepare phase – update
Sales strategy/proposition
•Householdambitiondefined,prioritisedcategories,marketsandchannels
•Co-manufacturingstrategyandtargets
•Costtoserveandpropositionmodel
•PCAmarketstrategyconcluded
PrepareMcBride will invest into its manufacturing assets and optimise its warehousing and distribution network. We will align the new organisational set-up aiming to institutionalise our new way of working with our people. We will provide a clear way forward for identified sub-optimal customer/categories and products.

13 McBride plc McBride Interim Results Presentation February 2017
Prepare phase – update
Assetconfiguration
•4yearcapexplanfinalised,linkedtogrowthambition–£100millionover4years
•CentreofExcellenceplansforkeygrowthcategories
•SeparationofPCandHHmanufacturingactivities
•Polandfactoryupgradeprojectcompletingspring2017
PrepareMcBride will invest into its manufacturing assets and optimise its warehousing and distribution network. We will align the new organisational set-up aiming to institutionalise our new way of working with our people. We will provide a clear way forward for identified sub-optimal customer/categories and products.
14 McBride plc McBride Interim Results Presentation February 2017
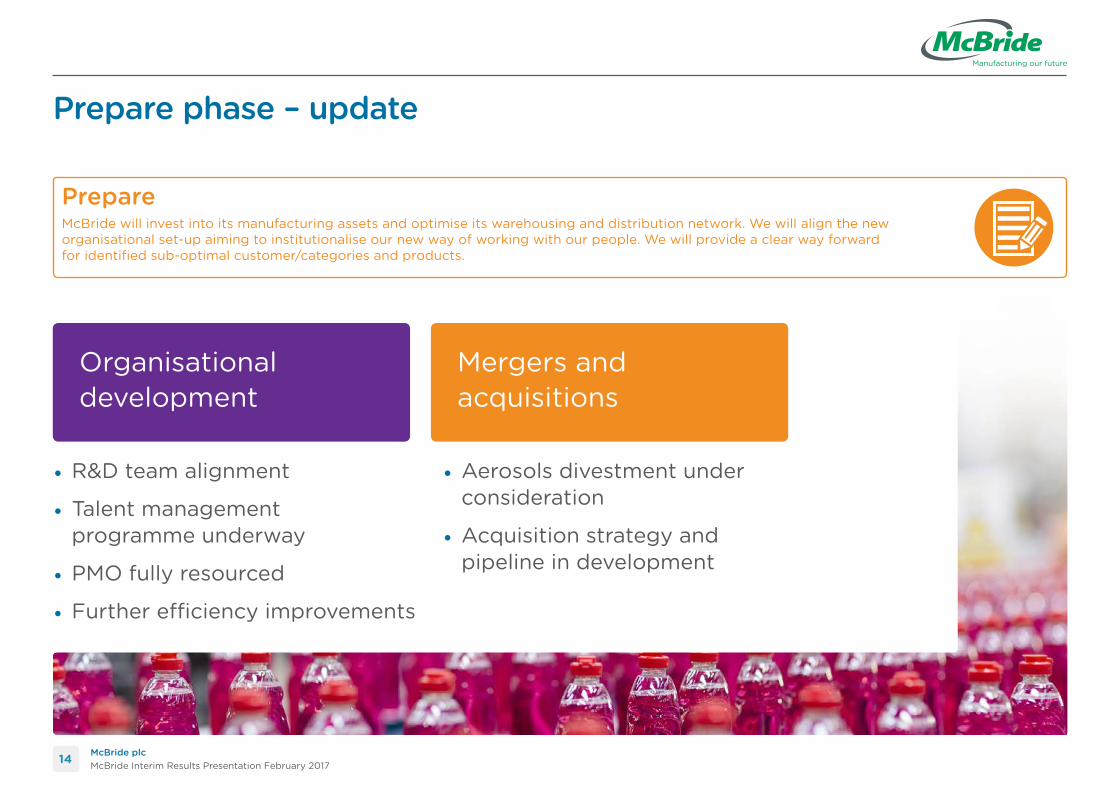
Prepare phase – update
Organisational development
Mergers and acquisitions
•R&Dteamalignment
•Talentmanagementprogrammeunderway
•PMOfullyresourced
•Furtherefficiencyimprovements
•Aerosolsdivestmentunderconsideration
•Acquisitionstrategyandpipelineindevelopment
PrepareMcBride will invest into its manufacturing assets and optimise its warehousing and distribution network. We will align the new organisational set-up aiming to institutionalise our new way of working with our people. We will provide a clear way forward for identified sub-optimal customer/categories and products.

15 McBride plc McBride Interim Results Presentation February 2017
Prepare phase – what does it look like?
Manufacturing choices
Geographic priorities
Channel strategies
Product category focus
16 McBride plc McBride Interim Results Presentation February 2017
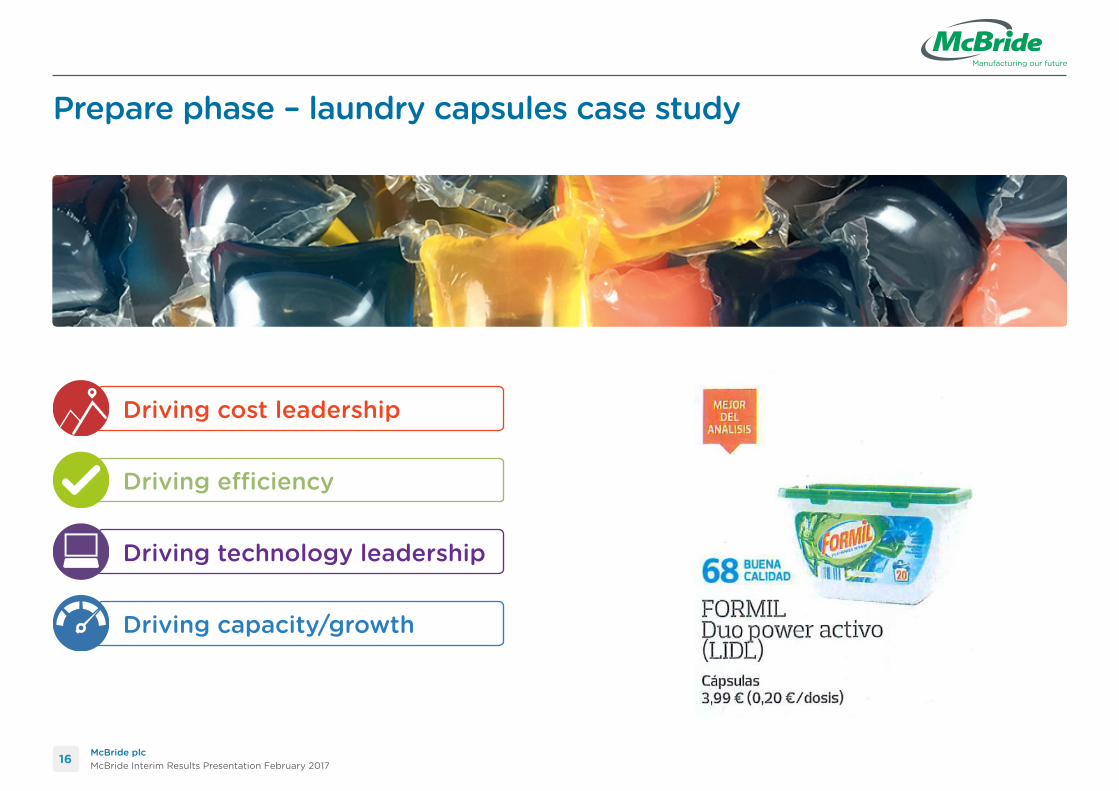
Prepare phase – laundry capsules case study
Driving cost leadership
Driving efficiency
Driving technology leadership
Driving capacity/growth

17 McBride plc McBride Interim Results Presentation February 2017
Outlook
•H1 trend evident in H2 revenue outlook
•Actions in hand to mitigate imminent raw material rises, lag anticipated
•Full year expectations remain unchanged
•Extended timeframe likely for major co-man contracts
•Run rate of recent business wins indicating growth next financial year
• Investment programme advancing during H2 into FY18
•Strategy on track, building blocks being assembled to prepare the Company for future growth

18 McBride plc McBride Interim Results Presentation February 2017
Questions

19 McBride plc McBride Interim Results Presentation February 2017
Appendices
1. Income statement
2. Segmental reporting
3. Balance sheet
4. Cash flow
5. Use of cash
6. Funding headroom

20 McBride plc McBride Interim Results Presentation February 2017
Appendix 1: income statement
Constant currency(1)
H1 2016/17 H1 2015/16 H1 2015/16 £m £m Y/Y £m Y/Y
Revenue 360.6 344.1 4.8% 387.7 (7.0%)Gross profit 132.7 122.2 8.6% 137.3 (3.4%)Gross margin 36.8% 35.5% +1.3ppts 35.4% +1.4pptsDistribution costs (23.8) (24.1) (1.2%) (27.5) (13.5%)Administration costs (86.0) (80.5) +6.8% (88.9) (3.3%)EBITA(2) 22.9 17.6 +30.1% 20.9 +9.6%Net financing costs: – borrowings (2.9) (3.4) (14.7%) (3.4) (14.7%)– pension (0.5) (0.6) (16.7%) (0.6) (16.7%)Adjusted profit before taxation(3) 19.5 13.6 +43.4% 16.9 15.4%Taxation (6.0) (4.1) +46.3% (5.1) +17.6%Adjusted profit after taxation(3) 13.5 9.5 +42.1% 11.8 +14.4%Adjusted diluted earnings per share (p)(3) 7.4 5.2 +42.3% Amortisation 0.4 0.5 (0.1) Exceptional items — — — Unwind of discount on contingent consideration 0.1 — 0.1Unwind of discount on provisions 0.2 0.1 0.1Taxation – effective rate 31% 30% 1ppts
(1) Comparatives translated at 2017 exchange rates.(2) Adjustments were made for the amortisation of intangible assets and exceptional items.(3) Adjustments were made for the amortisation of intangible assets, exceptional items, non-cash financing costs from
unwind of discount on initial recognition of contingent consideration; unwind of discount on provisions and any related tax.

21 McBride plc McBride Interim Results Presentation February 2017
Appendix 2: segmental reporting
Constant currency H1 2016/17 H1 2015/16 H1 2015/16 £m £m Y/Y £m Y/Y
Revenue UK 79.7 85.8 (7.1%) 85.8 (7.1%)North 96.0 90.2 6.4% 107.5 (10.7%)South 39.2 34.2 14.6% 40.9 (4.2%)East 69.5 60.9 14.1% 72.3 (3.9%)Household 284.4 271.1 4.9% 306.5 (7.2%)PCA 76.2 73.0 4.4% 81.2 (6.2%)Group 360.6 344.1 4.8% 387.7 (7.0%)
Trading profit Household 26.5 20.8 27.4% 23.8 11.3%PCA 0.9 1.3 (30.8%) 1.6 (43.8%)Corporate (4.5) (4.5) — (4.5) —Group 22.9 17.6 30.1% 20.9 9.6%
ROS Household 9.3% 7.7% 1.6ppt 7.8% 1.5pptPCA 1.2% 1.8% (0.6ppt) 2.0% (0.8ppt)Corporate n/a n/a n/a n/a n/aGroup 6.4% 5.1% 1.3ppt 5.4% 1.0ppt

22 McBride plc McBride Interim Results Presentation February 2017
Appendix 3: balance sheet
Dec 2016 Dec 2015 June 2016 £m £m £m
Goodwill and other intangible assets 20.3 19.7 20.0Property, plant and equipment 136.4 126.9 136.2Other non-current assets 26.2 21.6 22.5Working capital 26.2 27.7 29.7Net other debtors/(creditors) (4.8) (3.9) (0.3)Provisions (5.6) (4.7) (6.4)Pension (43.6) (32.3) (32.9)Non-current liabilities (7.4) (6.3) (8.8)Net debt (82.9) (86.3) (90.9)Net assets 64.8 62.4 69.1
Average capital employed 148.2 150.3 155.0ROCE 28.0% 23.6% 23.4%Working capital % of sales 3.8% 4.1% 4.4%
23 McBride plc McBride Interim Results Presentation February 2017
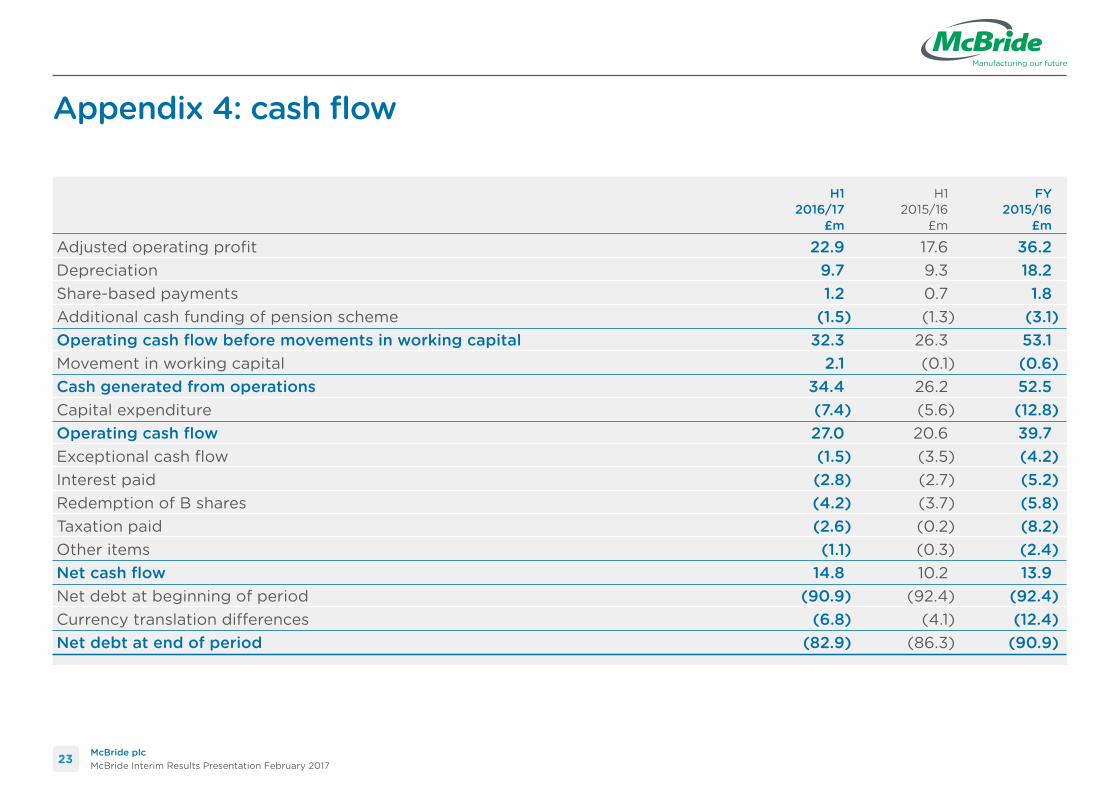
Appendix 4: cash flow
H1 H1 FY 2016/17 2015/16 2015/16 £m £m £m
Adjusted operating profit 22.9 17.6 36.2Depreciation 9.7 9.3 18.2Share-based payments 1.2 0.7 1.8Additional cash funding of pension scheme (1.5) (1.3) (3.1)Operating cash flow before movements in working capital 32.3 26.3 53.1Movement in working capital 2.1 (0.1) (0.6)Cash generated from operations 34.4 26.2 52.5Capital expenditure (7.4) (5.6) (12.8)Operating cash flow 27.0 20.6 39.7Exceptional cash flow (1.5) (3.5) (4.2)Interest paid (2.8) (2.7) (5.2)Redemption of B shares (4.2) (3.7) (5.8)Taxation paid (2.6) (0.2) (8.2)Other items (1.1) (0.3) (2.4)Net cash flow 14.8 10.2 13.9Net debt at beginning of period (90.9) (92.4) (92.4)Currency translation differences (6.8) (4.1) (12.4)Net debt at end of period (82.9) (86.3) (90.9)
24 McBride plc McBride Interim Results Presentation February 2017
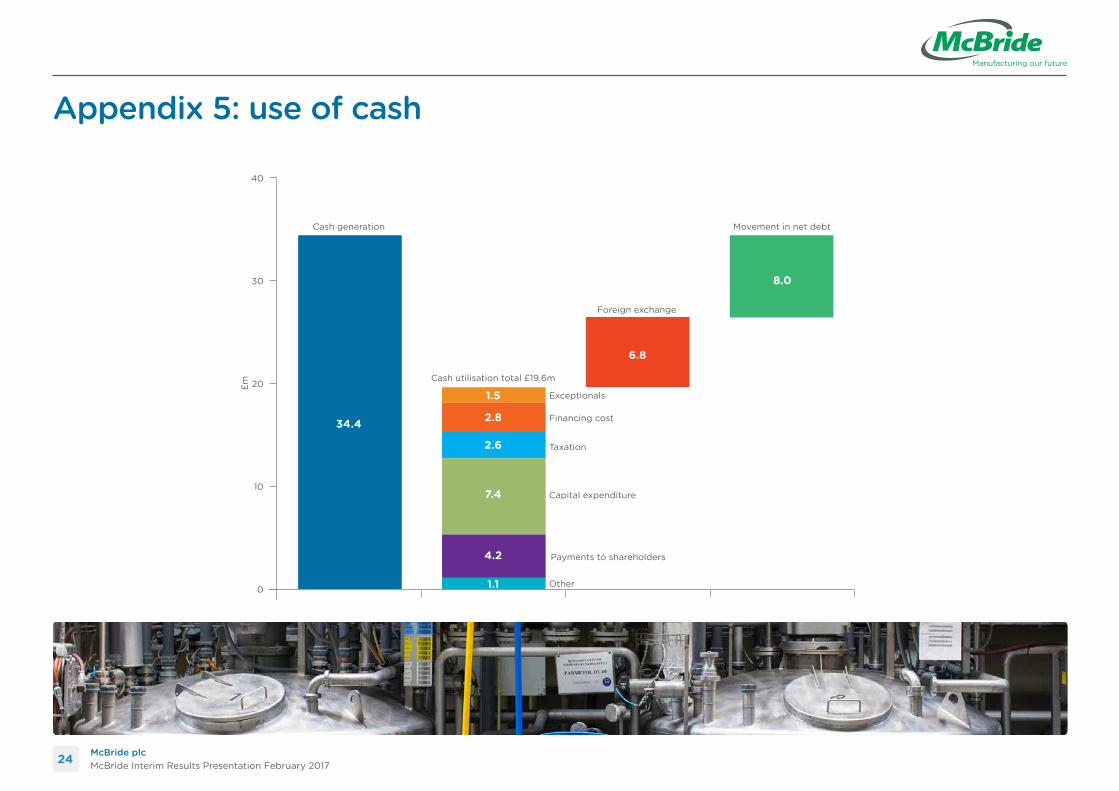
Appendix 5: use of cash
£m
Cash generation
Cash utilisation total £19.6m
Other
Payments to shareholders
Capital expenditure
Taxation
Financing cost
Exceptionals
0
10
30
20
40
34.4
1.5
2.8
2.6
7.4
4.2
1.1
6.8
8.0
Foreign exchange
Movement in net debt

25 McBride plc McBride Interim Results Presentation February 2017
Appendix 6: funding headroom
31 December Committed Facility 2016 headroom £m £m £m
Committed facilities: – US Private Placements (November 2020 and April 2022) 73.1 (73.1) —– revolving facilities (April 2019) 119.9 — 119.9– invoice discounting facilities 46.4 (32.3) 14.1– other loans 2.2 (2.2) — 241.6 (107.6) 134.0Uncommitted facilities 64.5 (4.2) Total facilities 306.1 (111.8) Cash and cash equivalents 28.9Net debt (82.9)