internally sealed concrete, monahans, texas - ctr library · internally sealed concrete monahans,...
TRANSCRIPT

Internally Sealed Concrete Monahans, Texas
0 U.S. Department of Transportation
Federal Highway , Administration
Eastern Direct Federal Division
Demonstration Projects Program
dP Demonstration Project No. 49 Report No. FHWA-DP-49-2 Interim Report January 1982
63~ -;

•
Technical Report Documentation Page
1. Report No. 2. Government Accession No. 3. Recipient's Catalog No.
FHWA-DP-49-2
4. Title and Subtitle 5. Report Date
Internally Sealed Concrete January 1982 ~Performing Organi zotion Code
1-::M-O--:-n-a-:-h-a-:-n--:-S_,_T_e_x_a_S _________________ J,- Perf~=;~~ :rgani zation Report No.
7. Authorl s)
H. D. Butler, Tom S. Patty, and Fred A. Schindler, Jr. 9. Performing Orgoni zotion Name and Address
Texas State Department of Highways and Public Transportation
Austin, Texas 78701
FHWA/TX-81/42+538-1 10. Work Unit No. (TRAIS)
11. Contract or Grant No.
DTFH71-80-C-00020 13. Type of Report and Period Covered
~1-2--:-.-S-p-an-s-or-in_g_A-ge-n-cy_N_a_m_e-an_d_A-:-dd-:-re_s_s---------------4 Interim Report Federal Highway Administration September 1980 thru Demonstration Projects Program August 1981 1000 North Glebe Road Arlington, Virginia 22201
14. Sponsoring Agency Code
15. Supplementary Notes
FHWA Experimental Project TX-78-06 Darrell E. Maret, Project Manager
16. Abstract
HDP-15
This report describes the construction, heat treatment, and evaluation of an internally sealed concrete bridge deck on IH-20 near Monahans, Texas. The deck contained wax beads throughout its full depth, however, only the top two inches were heated to internally seal the concrete. The overall objective of this study was to obtain additional information on the performance of internally sealed concrete under service conditions.
The heating system and method of heat treatment are described. The tests used to evaluate the effectiveness of the internally sealed concrete are discussed. These include dye penetration, chloride analysis, flexural and compressive, half-cell potential, a crack survey, and a petrographic examination of both the aggregate and the hardened concrete. The results of these tests and observations showed that internally sealing concrete enhances its ability to resist the penetration of chlorides.
AUG (} 8 2014
17_ Key Wards 18. Distribution Statement
Internally Sealed, Concrete, Wax Beads, Bridge Deck Concrete, Heat Treatment, No Restrictions Texas
19. Security Clossif_ (of this report) 20. Security Classif. (of this page) 21. No. of Pages 22_ Price
Unclassified L•ncl assi fi ed 77
Form DOT F 1700.7 C8-72l Repr•)duction of completed page authorized

"
INTERNALLY SE~.LED CONCRETE
~10NAHANS, TEXAS
By
H. D. Butler
Senior Designing Engineer
Texas State Department of Highways & P~blic Transportation
Tom S. Patty
Geologist
Texas State Department of Highways & Public Transportation
Fred A. Schindler, Jr.
Supervising Concrete Engineer
Texas State Department of Highways & Public Transportation
Demonstration Study No 1-5-79-538
"Internally Sealed Concrete Bridge Decks"
~lark Done in Cooperation with U.S. Department of Transportation Federal Highway Administration
FHWA Demonstration Project No. 49
"Internally Sealed Concrete"
January 1982
....... z; w ( --- -~ -__,........ - - ·- ---
......
......
......
Symbol
,, yd
··' "' vd1
mo2
oz lb
tsp
Tbsp ft Ol
c pi
qt
gal ft3
yd3
..
•
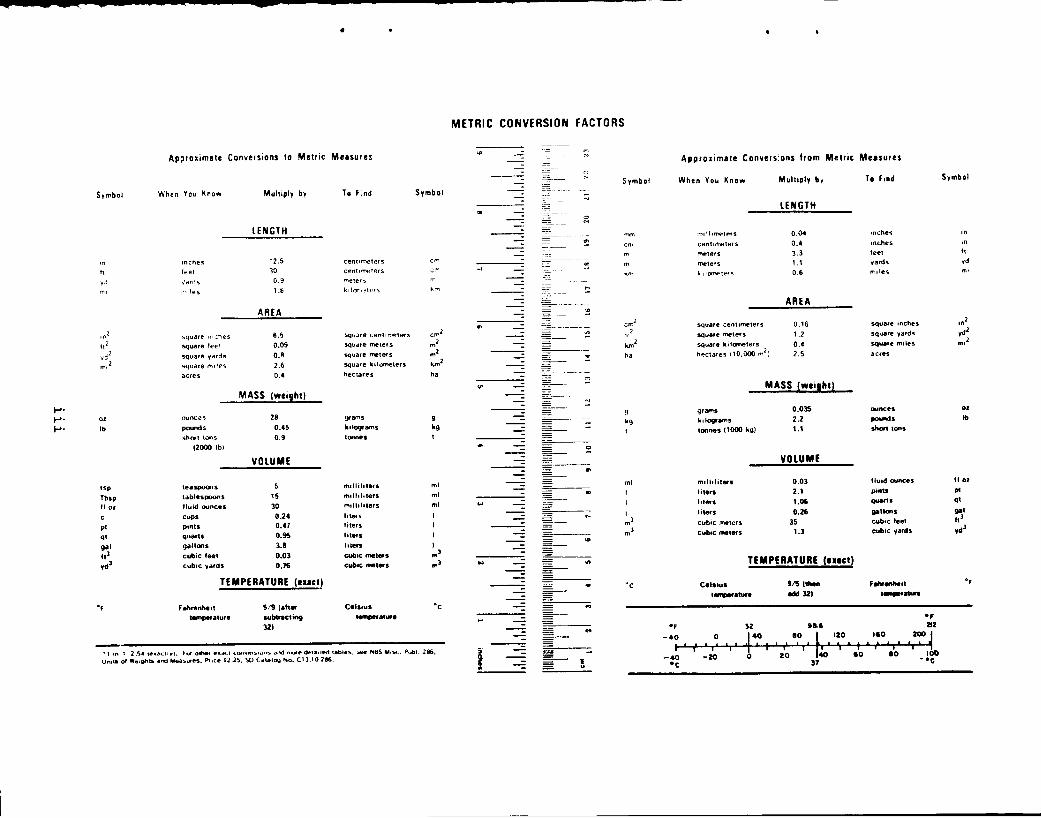
Ap~roximate Conversions to Metric Measures
When You !<now
.nc:hes ft>el
;.trd~
·~,:les
squar~ .n•.::hes
square tee!
square yards
square m• If'S
acres
ounces
pounds
shf:Wt tons
12000 tbl
teaspoons
tablespoons
fluid ounces
cups
ptnts quarts
gallons
cubic feet cubec 'fards
Multiply by
LENGTH
"2.5 30
0.9
1.6
AREA
6.5 0.09
o.e 2.6 o.•
MASS jweightl
28 o.•s 0.9
VOLUME
15 30 0.2. 0 •• 1 0.¥.. 3.1 0.03 0.16
TEMPERATURE (UictJ
F_..renhett tempet"ature
5/9 tah .. ouboractiflt 321
To f :nd
cent•meters ceniHT~ters
meter!>
klltYo"tf!f'i
sq•JJre cent•metefs squ.ne meters
square metets
s,quare kilometers
hectares
grams ktloqrams
IOA08S
mtlltlttets
mtlltl•ters nulhhters
hten ltters
liters ltlltfS
cubtc met•s cub•c meters
Cels•v• templrfetwe
Symbol
c"' err
'"'
err1
m' m2
km2
ha
9 kg
ml ml
mt
I "'3 ,..3
•c
"1 '" : 2.S• t••.tCIIvJ. f..- other e•<kf l.OIW~!o•un!o dnd mor• Oeta.led table!>.~ I'II&S ,_.,!oc... Publ. 286. Umbo of Weogh~ ~ Wea~urn. Pr,ce t2.2S. SO Cottaloy No. C1J.10.286.
METRIC CONVERSION FACTORS
-::
-
-
; -~ .. -
~.
~
o• N
~
~
~
!::
~
~
------ . -:- -
-----
I
"
2
..
Svmbol
em
km
em1
n''
km' ho
9 kg
ml I
I
I ml
m'
•c
Appro1imate Convers:ons from Metric Musures
When You Kno,.
m•ll•meters
cenft~t~rs
meters
meters
kii()Tif>fPfS
square centimeters
square meters
square kilometers
hF.>ctate! 110.000 , 2 ~
Multiply b1
LENGTH
0.04 0.4 3.3 1.1 0.6
AREA
0.16 , .2
0.4 2.5
MASS {weight]
grams
kilograms
tonnes (1000 kg)
mllhhters
liten hten
liters
cub•c meters cubtc meters
0.035 2.2 1.1
VOLUME
0.03 2.1 1.06 0.26
35 1.3
TEMPERATURE (IIICtl
Celstus ,_ ...... 115ttllen -32)
To fond
mche'\
tnches
teet
yards
mtles
square mches square yards
square m1les
acres
ounces pounds
shor1 tons
tlu•d ounces ptnts _... pllons cub•c teet cubic yards
Falw-ot ............. "F
°F 32 11.6 . 212
-40 0 140 10 ~ 120 110 200 ~ I I 0 I I I I I I I I I I I I I I I I I I I I I r • 1 , a ' , , , , -40 -zo o zo 40 eo eo 100
•c 37 • •c
Svmbol
It yd
'"' yd2
m•'
oz lb
tl Ol
pi
ql
gal lt3
ydl
..

TABLE OF CONTENTS
INTRODUCTION
Objectives Description of Test Bridge
CONSTRUCTION
Materials for Concrete Test Slab Mixing and Placing Concrete
HEAT TREATMENT
Heating System Heat Treating Cost Analysis
TESTS PERFORMED
Dye Penetration Freeze-Thaw Chloride Penetration Crack Survey Strength Half-Cell
PETROGRAPHIC EXAMINATION OF CONCRETE
SUMMARY AND CONCLUSIONS
REFERENCES
APPENDIX A
Special Specifications
APPENDIX B
Concrete Design Work Sheet
v
Paqe ---1
1 2
3
3 3 4
6
6 6
11
15
15 15 16 16 22 22
23
31
33
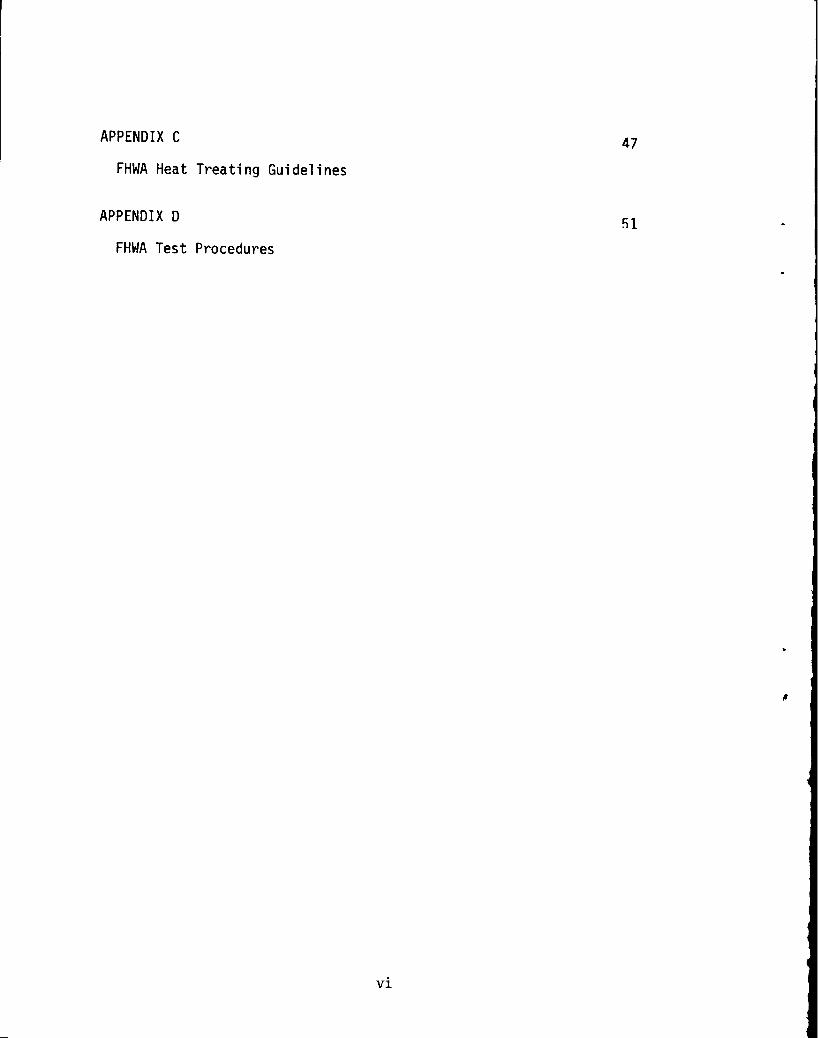
APPENDIX C 47
FHWA Heat Treating Guidelines
APPENDIX D ~1
FHWA Test Procedures
,
vi
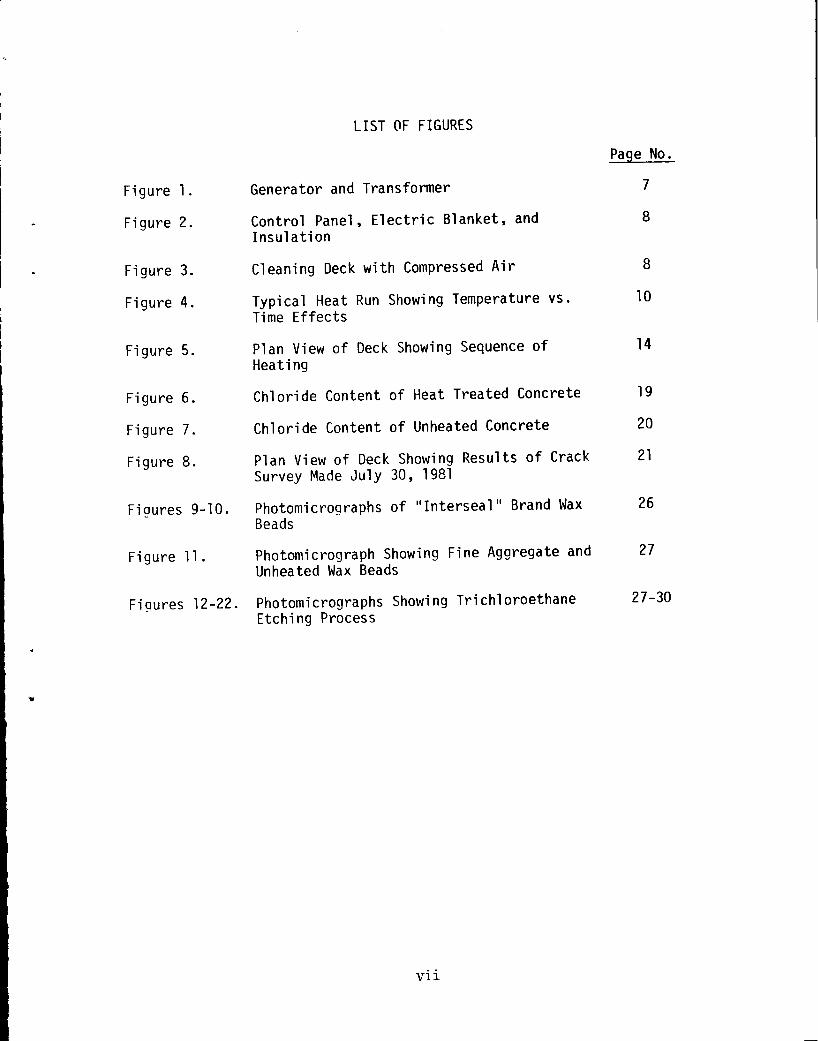
LIST OF FIGURES
Figure 1. Generator and Transformer
Figure 2. Control Panel, Electric Blanket, and Insulation
Figure 3. Cleaning Deck with Compressed Air
Figure 4. Typical Heat Run Showing Temperature vs. Time Effects
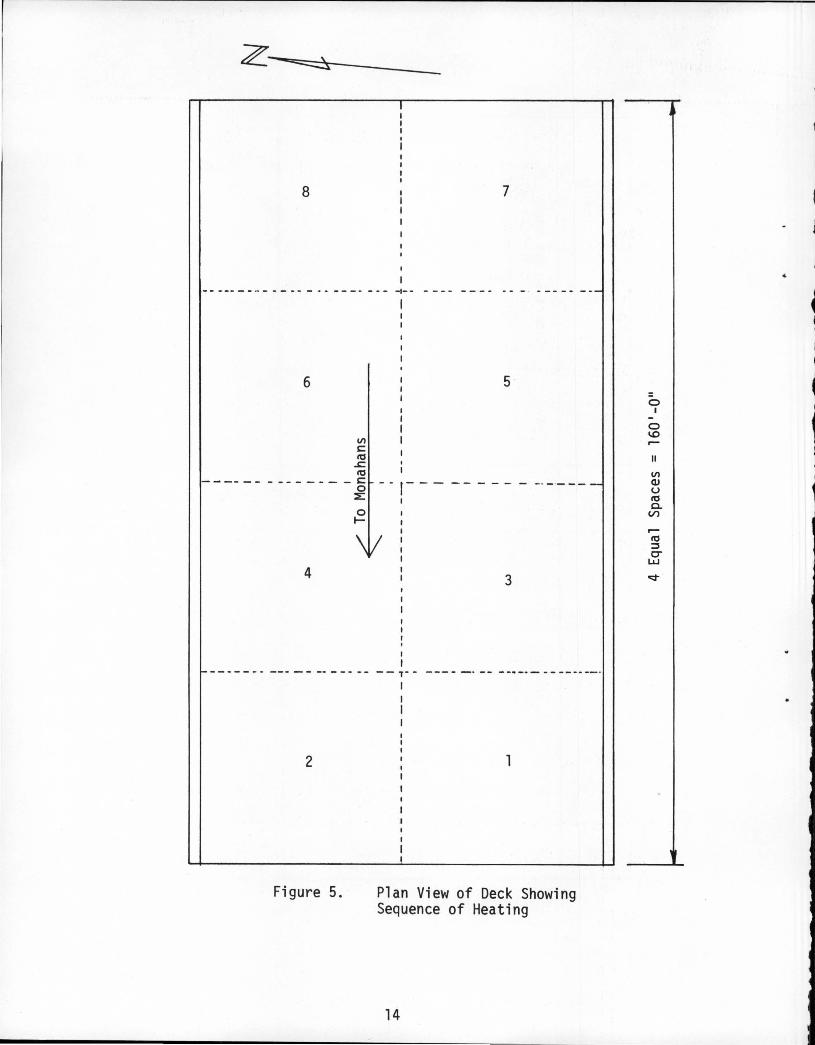
Figure 5. Plan View of Deck Showing Sequence of Heating
Figure 6. Chloride Content of Heat Treated Concrete
Figure 7. Chloride Content of Unheated Concrete
Figure 8. Plan View of Deck Showing Results of Crack Survey Made July 30, 1981
Figures 9-10. Photomicrographs of ,. Intersea 111 Brand \4ax Beads
Figure 11. Photomicrograph Showing Fine Aggregate and Unheated Wax Beads
Figures 12-22. Photomicrographs Showing Trichloroethane Etching Process
vii
Page No.
7
8
8
10
14
19
20
21
26
27
27-30
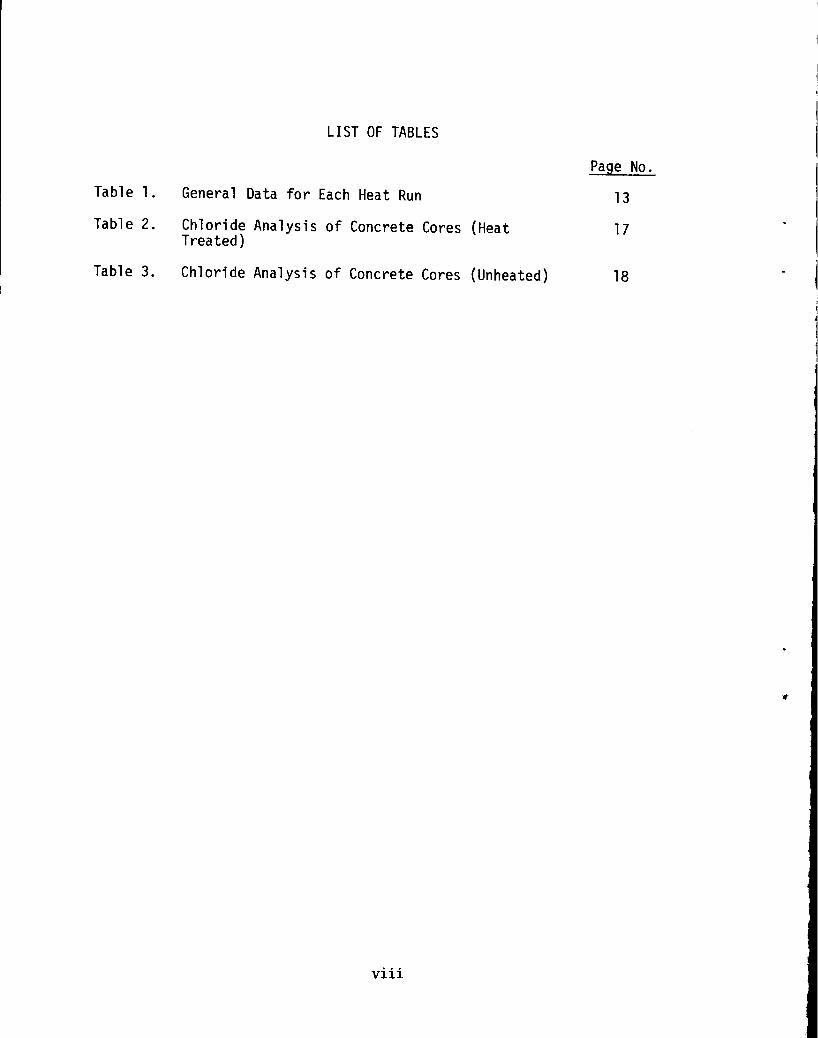
LIST OF TABLES
Page No.
Table 1. General Data for Each Heat Run 13
Table 2. Chloride Analysis Treated)
of Concrete Cores (Heat 17
Table 3. Chloride Analysis of Concrete Cores (Unheated) 18
viii
INTRODUCTION
Chloride induced corrosion of the top mat of reinforcing steel
with the resultant crackinq and spalling of surface concrete are
considered major causes of the premature deterioration of bridge decks.
Through the efforts of the Federal Highway Administration, a method
using wax beads was developed to internally seal concrete against the
intrusion of deicing salts and other corrosive compounds.
Internally sealed concrete is a standard portland cement concrete
modified by replacing a small portion of the aggregate with a like
amount of small spherical particles of wax. After the concrete has
hardened, the deck is heated to a temperature of approximately 185°F
which causes the wax to melt and flow into the pores and capillaries
of the concrete. Upon removal of the heat, the wax solidifies and the
capillary network becomes a discontinous, closed system that effectively
blocks the penetration of water and chlorides.(l)
Objectives
The objectives of this studywereto construct a bridge deck
impregnated with wax beads, heat treat the deck to internally seal the
concrete, and evali.Jate the performance of the internally sealed concrete
deck under service conditions. This study was conducted as a part
of the Federal Highway Administration's Demonstration Project 49
"Internally Sea 1 ed Concrete".
Description of Test Bridge
The experimental bridge is located approximately five miles east
of Monahans, Texas, and carries the west bound lanes of Interstate
Highway 20 over Texas Park Road 41. The 1979 Average Daily Traffic
was 4250 vehicles per day with 19% trucks.
The bridge is 160 1 -0 11 long with three prestressed concrete girder
spans (40 1 -80 1 -40 1) and a 7.5 inch thick deck slab. The girders are
simply supported and the slab is continuous over the interior bents.
The overall width of the bridge is 44.0 feet and the clear roadway
.,..,idth is 42.0 feet. The rail is a concrete parapet type and was not
constructed until after the heat treatment was completed.
2
CONSTRUCTION
Internally sealed concrete has generally been placed as a two
to three inch overlay over conventional bridge deck concrete, although
it has been placed full depth on some experimental projects. The
overlay method is very labor intensive, requiring compaction of the
bottom course before applying and finishing the overlay, or cleaning
the bottom course surface and coating it with grout if the overlay is
not placed immediately. Additionally, the contractors experience and
ability to successfully perform an overlay construction must be con
sidered. (l) After consideration of these and other factors, it was
decided to use the full depth method for this project.
Materials for Concrete
The materials used in the Class C internally sealed concrete
included Type II portland cement from Southwestern Portland Cement
Company of Odessa, Texas, fine and coarse aggregates from Trans-Pecos
Materials Company, wax beads from Concrete Additives Corporation, Wayne,
Pennsylvania, and a set retarding agent.
A petrographic examination was made of the aggregates. It was
found that the fine aggregate consisted of Rhyolite fines and siliceous
quartz sands. The coarse aggregate was made up of Rhyolite and similar
extrusive volcanic rock types.
Test Slab
Prior to placing any bridge deck concrete, a 6'-0 11 x 8'-011
x 811
thick test slab was cast by the contractor. This test slab was used to
3
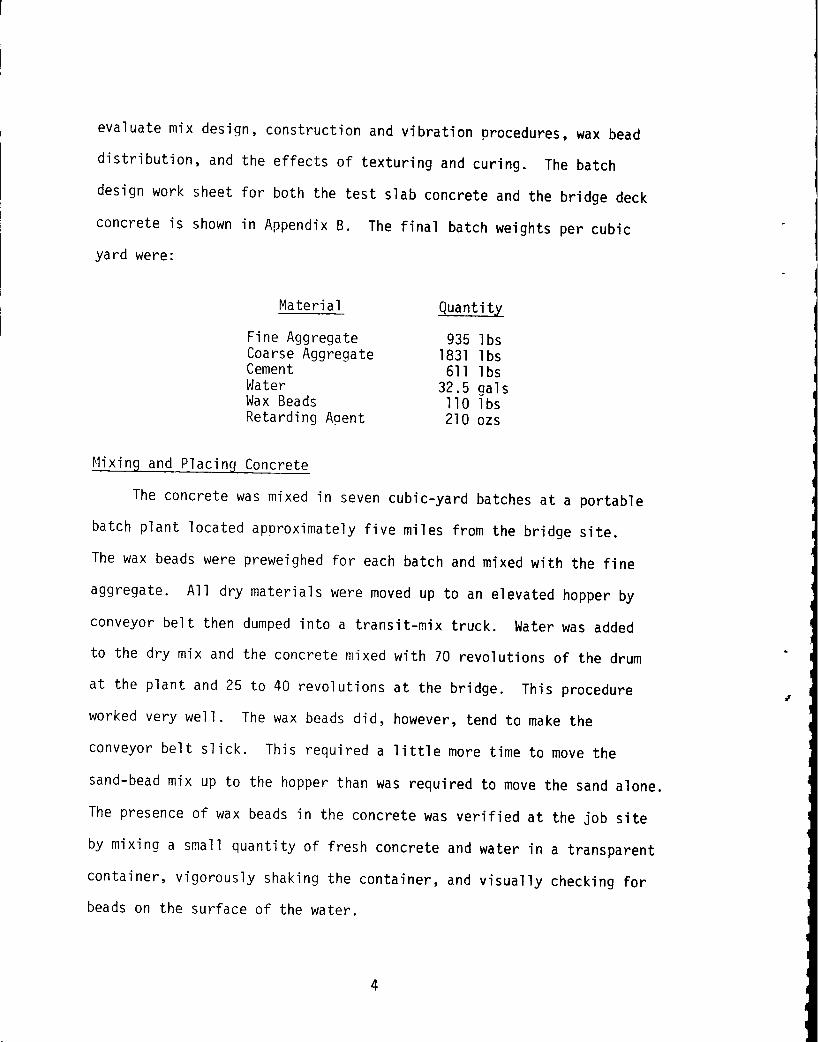
evaluate mix desiqn, construction and vibration procedures, wax bead
distribution, and the effects of texturing and curing. The batch
design work sheet for both the test slab concrete and the bridge deck
concrete is shown in Appendix B. The final batch weights per cubic
yard were:
Material
Fine Aggregate Coarse Aggregate Cement ~later Wax Beads Retarding Agent
Mixing and Placing Concrete
Quantity
935 lbs 1831 lbs
611 1 bs 32.5 gals 110 1 bs 210 ozs
The concrete was mixed in seven cubic-yard batches at a portable
batch plant located approximately five miles from the bridge site.
The wax beads were preweighed for each batch and mixed with the fine
aggregate. All dry materials were moved up to an elevated hopper by
conveyor belt then dumped into a transit-mix truck. Water was added
to the dry mix and the concrete mixed with 70 revolutions of the drum
at the plant and 25 to 40 revolutions at the bridge. This procedure
worked very well. The wax beads did, however, tend to make the
conveyor belt slick. This required a little more time to move the
sand-bead mix up to the hopper than was required to move the sand alone.
The presence of wax beads in the concrete was verified at the job site
by mixing a small quantity of fresh concrete and water in a transparent
container, vigorously shaking the container, and visually checking for
beads on the surface of the water.
4

There were no problems encountered during mixing and placing the
wax bead concrete. Placement of the deck slab began about 11:30 in
the morning and was completed at 5:00 in the afternoon. The concrete
was placed on the deck with a crane and dumping bucket then finished
with a transverse finishing machine. No problems were encountered
during finishing and texturing the wax bead concrete and a good riding
surface was obtained.
5
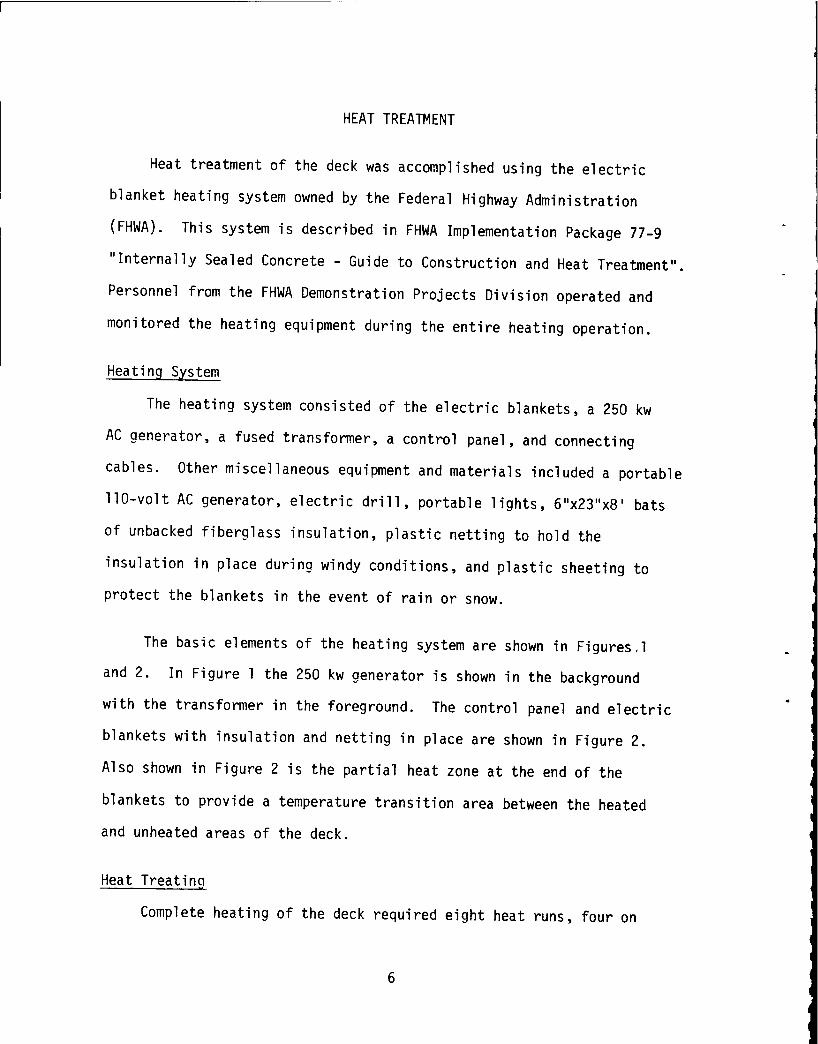
HEAT TREATMENT
Heat treatment of the deck was accomplished using the electric
blanket heating system owned by the Federal Highway Administration
(FHWA). This system is described in FHWA Implementation Package 77-9 11
Internally Sealed Concrete- Guide to Construction and Heat Treatment 11 •
Personnel from the FHWA Demonstration Projects Division operated and
monitored the heating equipment during the entire heating operation.
Heating System
The heating system consisted of the electric blankets, a 250 kw
AC generator, a fused transformer, a control panel, and connecting
cables. Other miscellaneous equipment and materials included a portable
110-volt AC generator, electric drill, portable lights, 611 x23 11 x8' bats
of unbacked fiberglass insulation, plastic netting to hold the
insulation in place during windy conditions, and plastic sheeting to
protect the blankets in the event of rain or snow.
The basic elements of the heating system are shown in Figures.l
and 2. In Figure 1 the 250 kw generator is shown in the background
with the transformer in the foreground. The control panel and electric
blankets with insulation and netting in place are shown in Figure 2.
Also shown in Figure 2 is the partial heat zone at the end of the
blankets to provide a temperature transition area between the heated
and unheated areas of the deck.
Heat Treatina
Complete heating of the deck required eight heat runs, four on
6

I ~ .
t
r
Figure 1. Generator (background) and Transformer
7

Figure 2.
Figure 3.
Control Panel, Electric Blankets, and Insulation
Cleaning Deck with Compressed Air
8
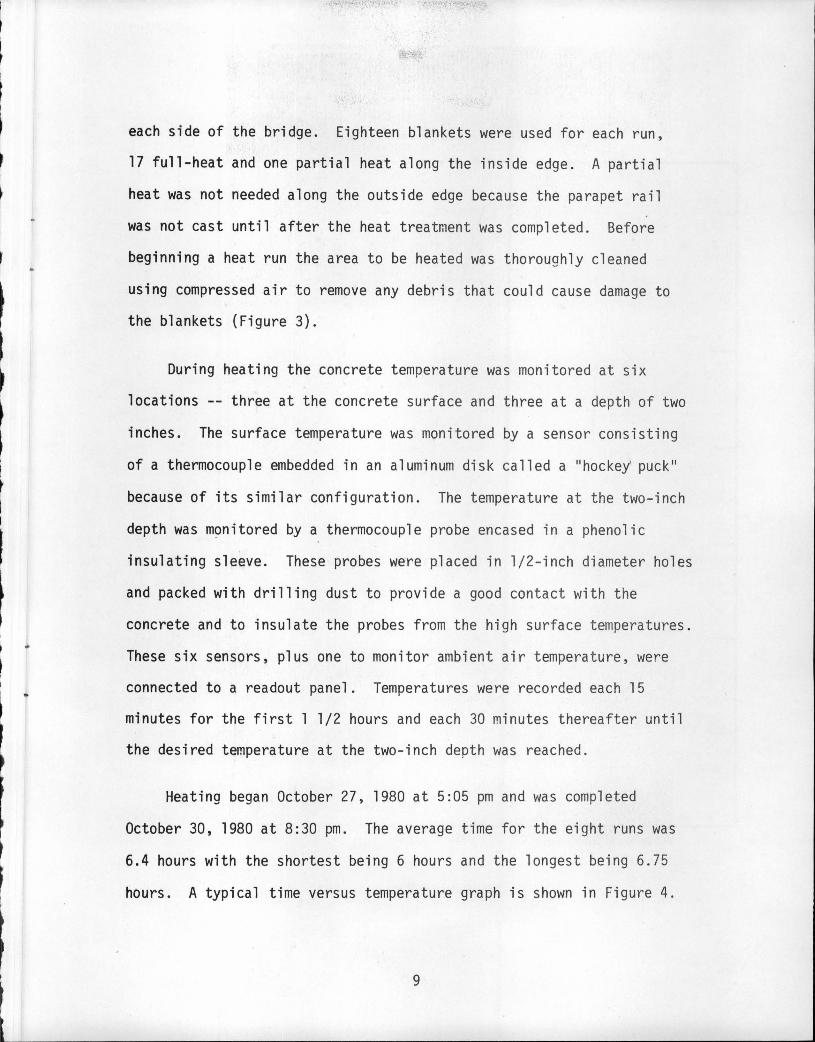
each side of the bridge. Eighteen blankets were used for each run,
17 full-heat and one partial heat along the inside edge. A partial
heat was not needed along the outside edge because the parapet rail
was not cast until after the heat treatment was completed. Before
beginning a heat run the area to be heated was thoroughly cleaned
using compressed air to remove any debris that could cause damage to
the blankets (Figure 3).
During heating the concrete temperature was monitored at six
locations -- three at the concrete surface and three at a depth of two
inches. The surface temperature was monitored by a sensor consisting
of a thermocouple embedded in an aluminum disk called a "hockey' puck"
because of its similar configuration. The temperature at the two-inch
depth was monitored by a thermocouple probe encased in a phenolic
insulating sleeve. These probes were placed in 1/2-inch diameter holes
and packed with drilling dust to provide a good contact with the
concrete and to insulate the probes from the high surface temperatures.
These six sensors, plus one to monitor ambient air temperature, were
connected to a readout panel. Temperatures were recorded each 15
minutes for the first 1 l/2 hours and each 30 minutes thereafter until
the desired temperature at the two-inch depth was reached.
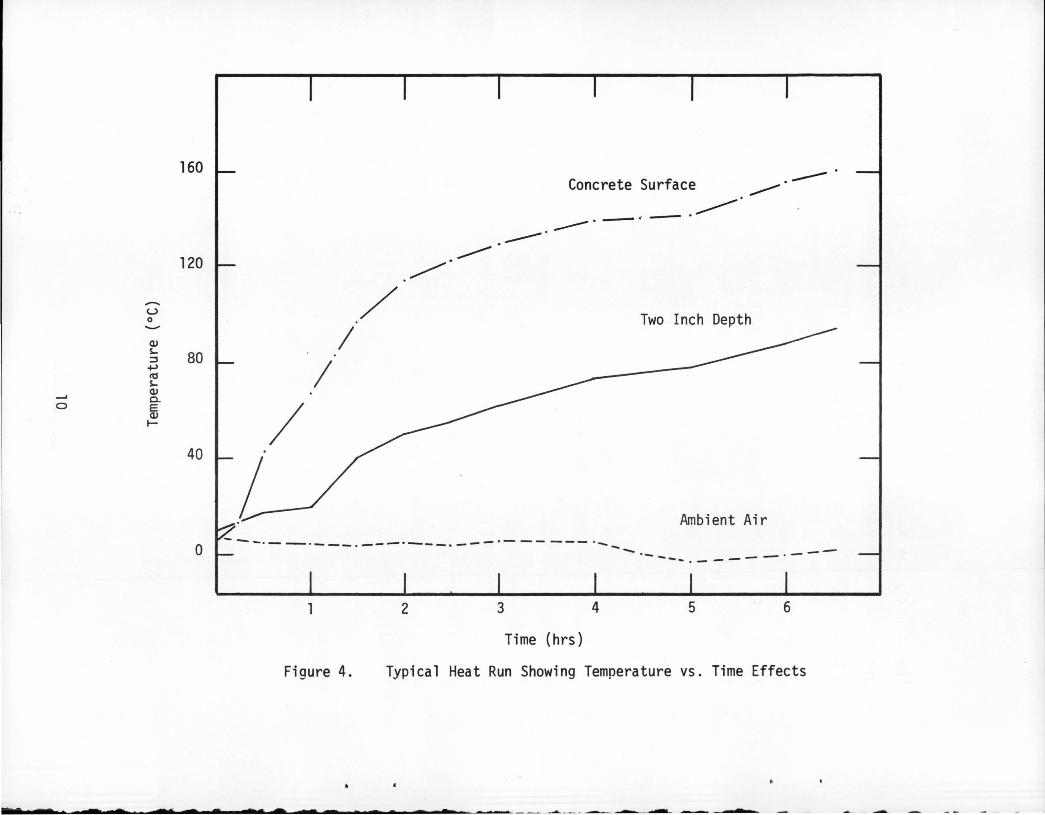
Heating began October 27, 1980 at 5:05pm and was completed
October 30, 1980 at 8:30 pm. The average time for the eight runs was
6.4 hours with the shortest being 6 hours and the longest being 6.75
hours. A typical time versus temperature graph is shown in Figure 4.
9
160
120
-u 0 -Q) s...
80 :3 +l Ia s... Q) ..... 0..
0 E Q) 1-
40
0
I
/ I
_....,.-~
Concrete S f ur ace ~--------·-·-·-·----Two Inch Depth
Ambient Air -·--·---.---·-------·- ----- ........
Figure 4.
-2 3 4
Time (hrs)
·- -- ·-----·---5 6
Typical Heat Run Showing Temperature vs. Time Effects
me - z-r o at ,., • sec z,A ..- ,_ • -. • ~ -
Approximately one hour was required between runs to move the blankets
and prepare for another run. Table 1 shows the times for each run along
with the ambient air temperature range and weather conditions.
The deck was heated in a stair-step fashion as shown in Figure 5.
Heat was applied and controlled according to the procedure outlined in
the FHWA Guidelines for Heat Treating Internally Sealed Concrete and
shown in Appendix C. This procedure was designed to permit potentially
damaging moisture vapor to escape before the wax starts to block
capillaries and cause damaging pressure buildups.
No significant problems were encountered during the heating
operation. A strong wind was blowing during the first heat run but
the plastic netting did a good job of keeping the insulation in place.
Light snow fell during part of the second heat run but the buildup of
water never became great enough to require shutting the system down.
Cost Analysis
The contract price for Class 11 C11 internally sealed reinforced
concrete bridge slab was $2.60 per square foot more than for the ordinary
Class 11 C11 reinforced concrete slab on the project. The following
additional costs were incurred when the slab was heat treated:
11

Generator Rental Fuel for Generator Insulation Plastic Sheeting Salaries and Wages Travel Miscellaneous Supplies
$1691 . 632.
1214. 48.
3984. 496. 341.
$8406.*
*This represents a cost of $1.19 per square foot
The cost of the internally sealed concrete deck was $3.79 per square
foot above that for a conventional concrete deck. This does not
include the cost of personnel and equipment furnished by the FHWA.
12

r - - - - --· - - - - -. - -- - - - -------- -- -- .. _______.......- - .._...- - - - --...........-- - - ·- - ...... -~
TABLE 1. General data for each heat run
----
Total Air Temp. Run Begin End Time Range No. Date Time Time (hrs) (oc) Weather Conditions
1 10-27-80 5:05 pm 11:05 pm 6 : 9-20 Clear, 30 mph wind '
2 10-28-80 8:00 am 3:30 pm 6.5 1-5 Windy, overcast, snow
3 10-28-80 4:30 pm 11:15pm 6.75 -3-9 Overcast, light w~nd
4 10-29-80 7:45 am 2:30 pm 6.75 2-18 Clear, cold
5 10-29-80 3:15pm 9:25 pm 6.2 7-15 Clear _, w 6 10-29-80 10:15 pm 4:30 am 6.25 0-6 I Clear, calm I
7 10-30-80 7:45 am 1 :45 pm 6.25 0-19 Clear, calm
8 10-30-80 2:30 pm 8:30 pm 6.0 10-22 Clear, light wind
---
z-~----I
8 7
-- --- - -.. -- - -- - .. -- -. - -- -- - --- -- - - . - - --- -- ---
6
Cll c: ttl
..c. ttl --------C:
4
0 :::E
0 1-
\V
5
-- - - - - -· - ·--- -
3
---.---. --- -- -· -- •• - -- T" -
2
Figure 5.
I
1
Plan View of Deck Showing Sequence of Heating
14
0 I
0 \0
II
Cll Q)
u ttl 0.
V'l
l

TESTS PERFORMED
Dye Penetration
Dye penetration tests were performed on three two-inch diameter
cores taken from the deck approximately two months after heating and
on one four-inch core taken from the unheated test slab. These dye
penetration tests were performed in accordance with the FHWA "Dye
Penetration Test" shown in Appendix o. Without variation, none of the
split cores (bridge deck and test slab) that were immersed in a
solution of red dye, 1.5% Calgon and water, showed any absorption, even
at the four-inch depth where the wax had not been melted.
Freeze-Thaw
The rapid dry freeze-wet thaw procedure of ASTM C 666 was used to
test the durability of four-inch diameter cores taken from the heated
deck and the unheated test slab. The dynamic modulus of elasticity of
each core was measured before freeze-thaw testing began. Subsequent
measurements, however, were not possible because the specimens would
not respond to being driven to any measurable resonant frequency.
Total dynamic modulus loss occurred before 80 cycles were completed.
The freeze-thaw cycling was continued to 300 cycles. The cores did
not show any distress in the melted wax zone. One core had severe spalling
below the 2-3" depth and cracked horizontally across at this depth.
At 255 cycles, three cores had severe spalling around the bottom 3''
but did not sustain damage in the upper half of the core through 300
cycles.
15
The test slab cores had slight surface spalling before 85 freeze
thaw cycles and the cores were breaking up at 120 cycles. Testing was
stopped at 144 cycles because cores had been reduced to rubble.
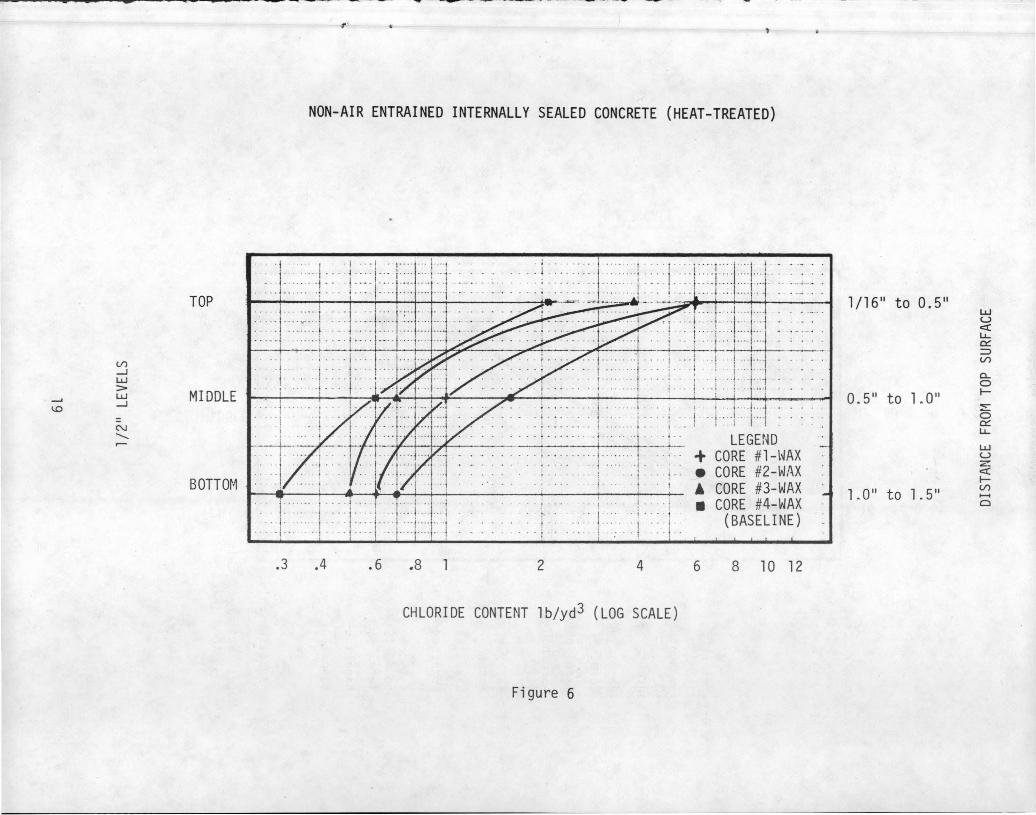
Chloride Penetration
The chloride penetration test was performed on both the bridge
deck cores and the test slab cores. One core, No. 4, from each
condition was used for the baseline chloride content and was not ponded
with sodium chloride. The· 90 day ponding procedure and chloride
analysis for three l/2-inch layers, l/16 11 to 0.5 11, 0.5 11 to 111 and 111 to
1-1/2 11 was the same as outlined in FHWA's Test .. Resistance of Concrete
to Chloride Ion Penetration .. shown in Appendix D. The results of the
chloride analyses are shown in Table 2 for the heat treated
bridge deck cores and Table 3 for unheated test slab cores. Figures 6
and 7 show the baseline and total chloride content of these cores
graphically.
Crack Survey
The deck was examined before and immediately after heating and no
cracks were found that could be related to the heat treatment. There
was one transverse crack across the deck over each interior bent but
this is typical for deck slabs placed continuously over interior bents.
Another survey was made on July 30, 1981, approximately nine months after
heating, and the results of this survey are shown in Figure 8. The
bridge has not been opened to traffic at this time and these cracks are
believed to be the result of shrinkage.
16
1
1 I
1
l 1 I

•
TABLE 2: Chloride Analysis of Concrete Cores (Heat Treated)
Material: Non-Air-Entrained Internally Sealed Concrete (Heat Treated)
Specimen Location: Top 1/2" Level 1 (1/16" to 0.5" from top surface)
Middle 1/2" Level 2 (0 • 5 II to 1. O" from top surface)
Bottom 1/2" Level 3 (1.0" to 1.5" from top surface)
Determinations - Chloride Ion Content:
Specimen Level 1 2 3
Content % PPM lb/cu yd % PPM lb/ cu yd % PPM lb/cu yd
Core Ill-Wax Total 0.15 1524 6.1 0.03 258 1.0 . 0.02 160 0.6
Baseline* 0.05 528 2.1 0.02 160 0.6 0.01 86 0.3
Absorbed 0.10 996 4.0 0.01 98 0.4 0.01 74 0.3
Core /12-Wax Total 0.15 1524 6.1 0.04 406 1.6 0.02 172 0.7
Baseline* 0.05 528 2.1 0.02 160 0.6 0.01 86 0.3
Absorbed 0.10 996 4.0 0.02 246 1.0 0.01 86 0.4
Core /13-Wax Total 0.10 971 3.9 0.02 184 0.7 0.01 135 0.5
Baseline* 0.05 528 2.1 0.02 160 0.6 0.01 86 0.3
Absorbed 0.05 443 1.8 0.00 24 0.1 0.00 49 0.2
*Baseline values determined from Core #4-Wax (Not ponded with chloride).
Note: Weight of chloride per cubic yard based on concrete density of 4000 lb/cu yd.
17
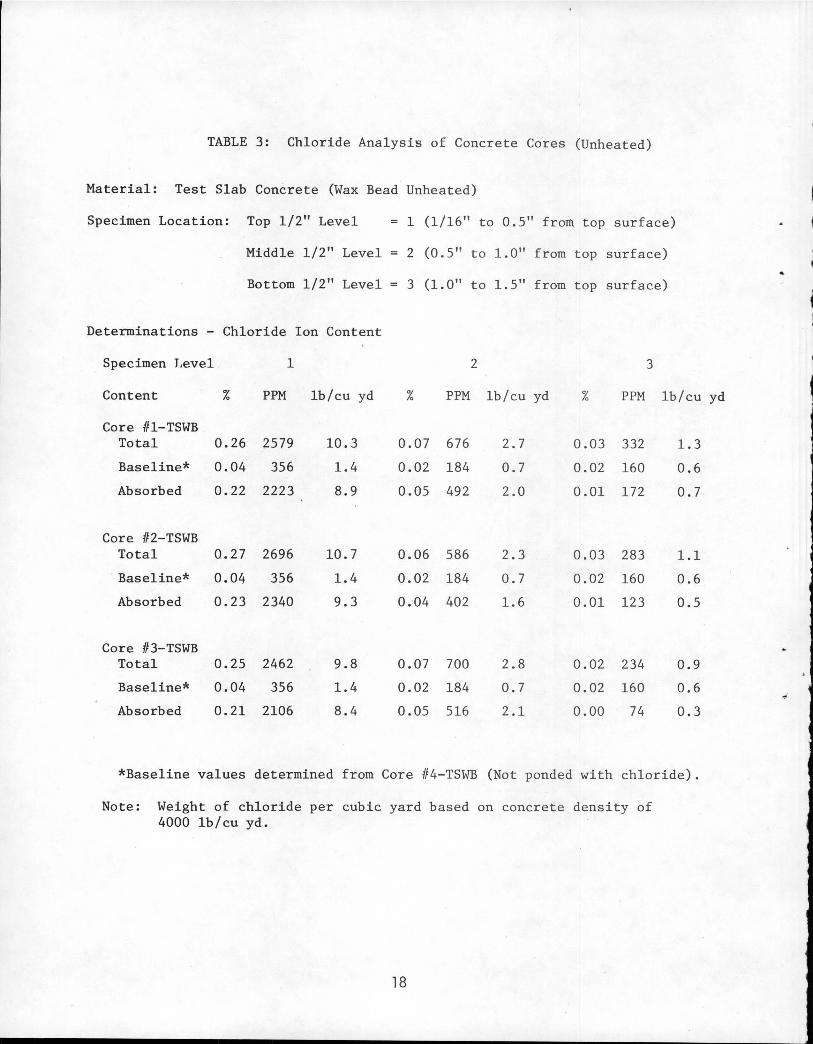
TABLE 3: Chloride Analysis of Concrete Cores (Unheated)
Material: Test Slab Concrete (Wax Bead Unheated)
Specimen Location: Top 1/2" Level 1 (1/16" to 0.5" from top surface)
Middle 1/2" Level 2 (0.5" to 1.0" from top surface)
Bottom 1/2" Level 3 (1. O" to 1. 5" from top surface)
Determinations - Chloride Ion Content
Specimen Level 1 2 3
Content % PPM lb/cu yd % PPM lb/cu yd % PPM lb/cu yd
Core #1-TSWB Total 0.26 2579 10.3 0.07 676 2.7 0.03 332 1.3
Baseline* 0.04 356 1.4 0.02 184 0.7 0.02 160 0.6
Absorbed 0.22 2223 8.9 0.05 492 2.0 0.01 172 0.7
Core 1/2-TSWB Total 0.27 2696 10.7 0.06 586 2.3 0.03 283 1.1
Baseline* 0.04 356 1.4 0.02 184 0.7 0.02 160 0.6
Absorbed 0.23 2340 9.3 0.04 402 1.6 0.01 123 0.5
Core #3-TSWB Total 0.25 2462 9.8 0.07 700 2.8 0.02 234 0.9
Baseline* 0.04 356 1.4 0.02 184 0.7 0.02 160 0.6
Absorbed 0.21 2106 8.4 0.05 516 2.1 0.00 74 0.3
*Baseline values determined from Core #4-TSWB (Not ponded with chloride).
Note: Weight of chloride per cubic yard based on concrete density of 4000 lb/cu yd.
18
..
TOP
(/) __J
LJJ > LJJ MIDDLE
1..0 __J
= N -r-
BOTTm~
,.
NON-AIR ENTRAINED INTERNALLY SEALED CONCRETE (HEAT-TREATED)
. . ! :. . . i .. !. :::!:. t.:l,· .l ... . .. . I ...... j. . .. ' I I I
' I . . . . . .. t...... , ... . .... 1'. . .. LEGEND ~ I I :A" -~, - --+-· --+--~
....... . I .. . . .. ' ! ........ I + CORE #1-\~AX
;::·:.: i :·· f .. i.: e CORE #2-W/\X · · I t · ; A CORE #3-WAX
·.. · I • CORE #4-WAX .. : : .1: · : : · .. . ( BASE LI N E ) . - . . . . . . . . . ! . :
.3 .4 . 6 .8 2 4 6 8 10 12
CHLORIDE CONTENT 1b/yd3 (LOG SCALE)
Figure 6
1/16 11 to 0.5 11
0.5 11 to 1.011
1 . 0 11 to 1 . 511
LJJ u c::( LL 0::: ::::> (/)
0... 0 I-
~ 0 0::: LL
LJJ u z c::( I(/) ....... Cl

TOP
(/) .....J LLJ >
Nl LLJ MIDDLE .....J
0
N .......... r-
BOTTOM
-
TEST SLAB CONCRETE (viAX BEAD UNHEATED)
r -- t~::::l ::: '::::l:::rtl·' : ; ::-: , :', :: :: ': : I II :::..~--:- L· ·: J :: : j;·::•;:·;c::j · , : . ~ :: :: ;,; .. ;: '!' ·. · · , .. ' , ....... ··: ·11/1611
to 0.511 .. -- ._. ···-1 " ' . . . ! .... I I I I - ' i . . ! ' . . .
···· t··· t '"f
~~;-==1r=~=lrw~tH~~~~~~~~~=~-:.t~~+t-t:~....:...::....:...Jo. 511 to 1. o~~
: ; . ! ; : ' . : ~ - . - . . . - .• : ! . - . • ' : -1 t ~ t I · · • · • · · · · · . . . . f ... :-:- ; : l ~ : .. : . ....... - . . . . . . .
·-··- j'·"· .. f .. ·!··-]····, ' . : ~ ~: :; ~::: :::: ::::1
- • .J · - ; !-t I H 1- j i '1 '·. ·--. ''f .. . T .. L · :: . : ~B ~ ; ; r: :1 ·~ c:~·:: ::::1::~
1. 0" to 1. 5"
.3 .4 .6 .8 2 4 6 8 10 12
• CHLORIDE CONTENT 1b/yd3 (LOG SCALE)
Figure 7
.. ...
LLJ u <( LL. 0:: =-(/)
0... 0 1-
:::E 0 ~ LL.
LLJ u z: <( IV) ...... Cl

.. -
... ...
-1-- ..........- o • ,.. n ..,- • en ,r, ~ r:ftr .. ••
--
.. -4'0.-7...., _____ --..... .---... ?~""' ..... __ ;:::-.. ~--,. .... --................ ____ _. __ _
Figure 8.
-,...... .. -
Plan View .of Deck Showing Results of Crack Survey Made July 30, 1981
21
0 I -
0 -=t'
0 I -0 co
0 I -0
-=t'
Strength
The flexural strength of the concrete for both the test slab and
the bridge deck was determined from bending tests performed on 15
6"x6"x20" beams, three from the test slab and 12 from the bridge deck.
The concrete was seven days old at the time of testing. The range of
strengths for the test slab was from 550 psi to 665 psi with an average
of 612 psi. The beams from the deck concrete ranged from 600 psi to
738 psi with an average of 684 psi. With the exception of one beam
from the test slab that broke at 550 psi, all other beams tested
greater than the minimum required seven-day strength of 550 psi.
In addition to the flexural strength tests~ four cores from the
test slab were tested in compression at 37 days and one was tested at
97 days. At 37 days the compressive strength ranged from 3840 psi to
4469 psi with an average of 4125 psi. The core tested at 97 days had
a compressive strength of 4440 psi. Nine cylinders were made at the
time of deck placement and tested approximately 13 months later. The
compressive stress ranged from 4754 psi to 5124 psi with the average
being 4959 psi.
Ha 1 f-Ce 11
Approximately nine months after the brid9e deck was heated, a
half-cell survey was conducted. The bridge was not open to traffic and
no deicing salts had been applied. All measured half-cell potentials
were less than -0.20v with respect to a copper-copper sulphate reference
cell. This range of values is generally considered to be indicative
of non-corroding reinforcing steel.
22
..
PETROGRAPHIC EXAMINATION OF CONCRETE
Cores taken from the test slab were examined microscopically
to determine the presence and distribution of wax beads in the
hardened concrete. Under a polarizing microscope the spherical wax
beads display an amorphous structure with internal air voids as shown
in Figures 9 and 10. When incorporated into hatched concrete the
minute-sized wax beads look no different than clear-to amber-colored
sand grains and on a cut and smoothly ground surface appear virtually
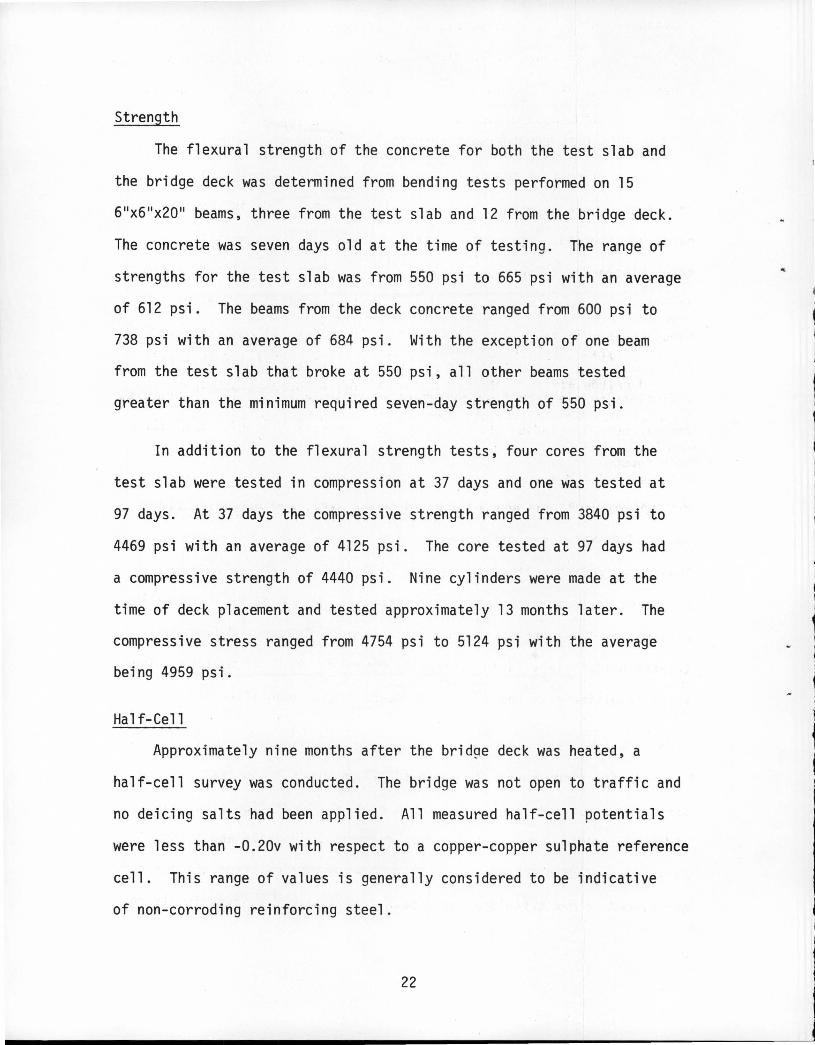
indistinguishable from fine aggregate as shown in Figure 11. Therefore,
for microscopic studies the wax beads must be conditioned to make them
more recognizable.
When sufficient heat is applied to concrete containing wax beads
to cause melting, the wax migrates into the capillary system, thus
leaving a void where the wax bead existed. This is the principal
mechanism involved with internally sealing of bridge decks. Generally,
a visual or low-magnification examination of cores removed from heat
treated bridge slabs is sufficient to determine depth of melting. The
voids resulting from the melted wax beads can be identified and
measured.
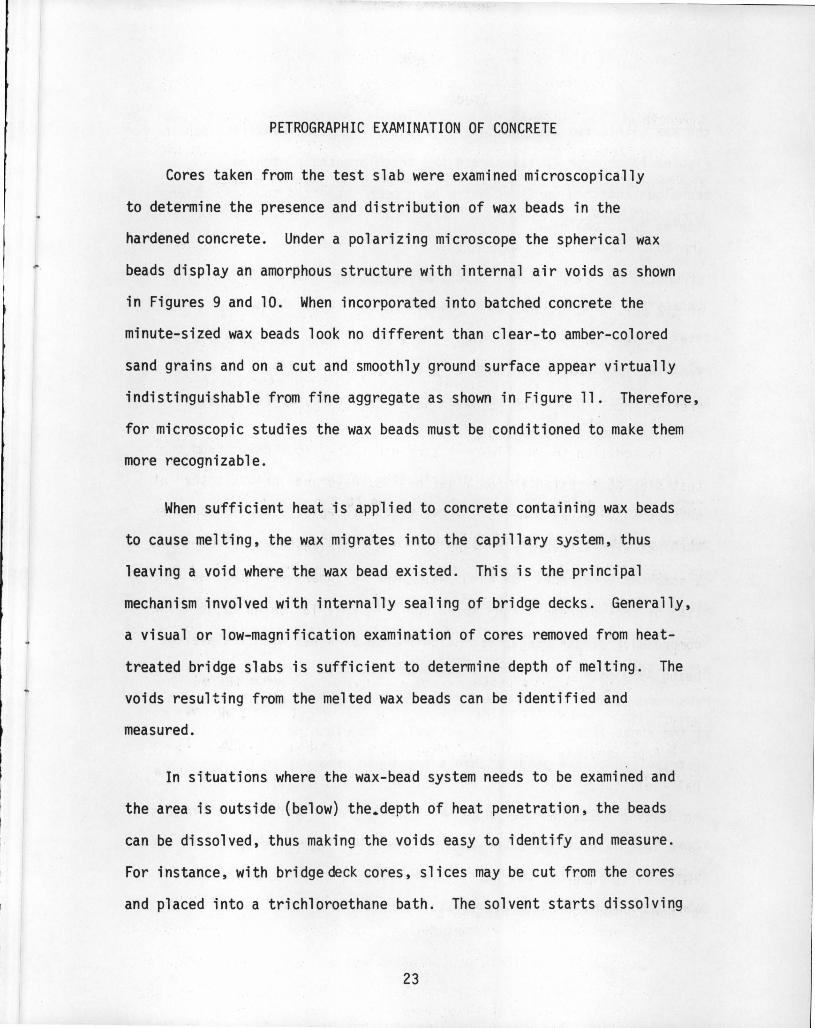
In situations where the wax-bead system needs to be examined and
the area is outside (below) the.depth of heat penetration, the beads
can be dissolved, thus making the voids easy to identify and measure.
For instance, with bridge deck cores, slices may be cut from the cores
and placed into a trichloroethane bath. The solvent starts dissolving
23

the wax within two minutes to a degree that permits identification.
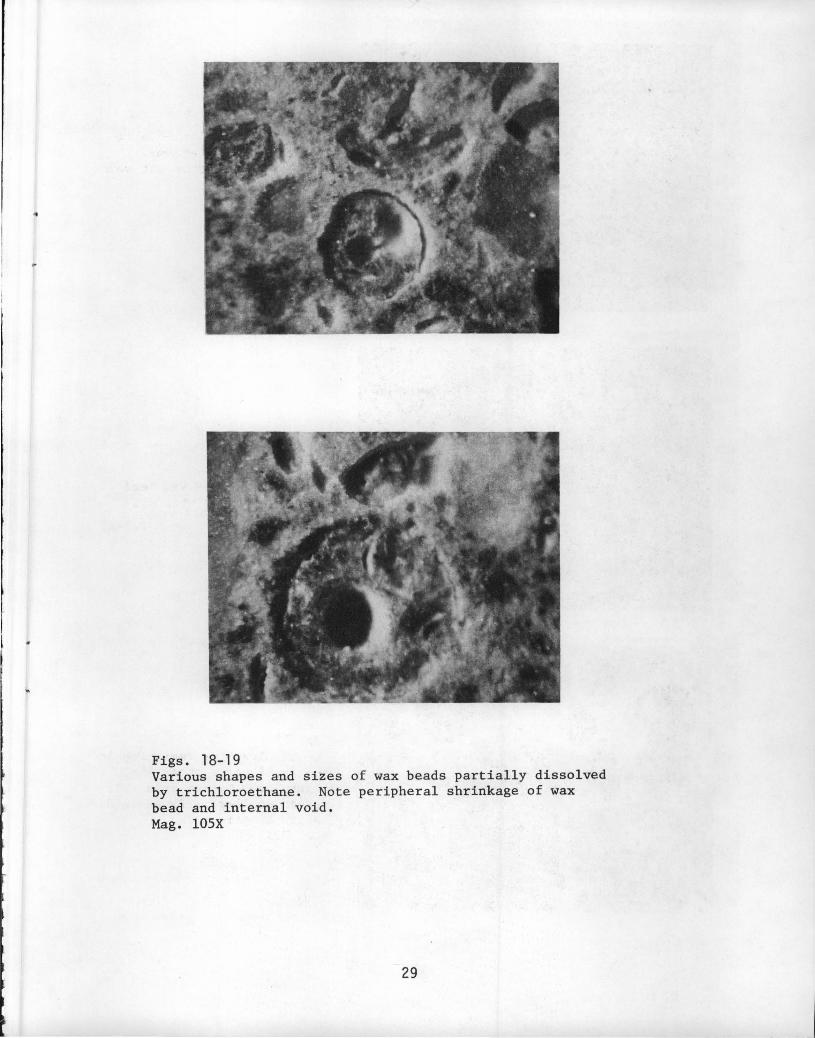
Figures 12 through 22 illustrate the trichloroethane etching
technique and show surfaces which have been subjected to dissolution
etching up to one hour.
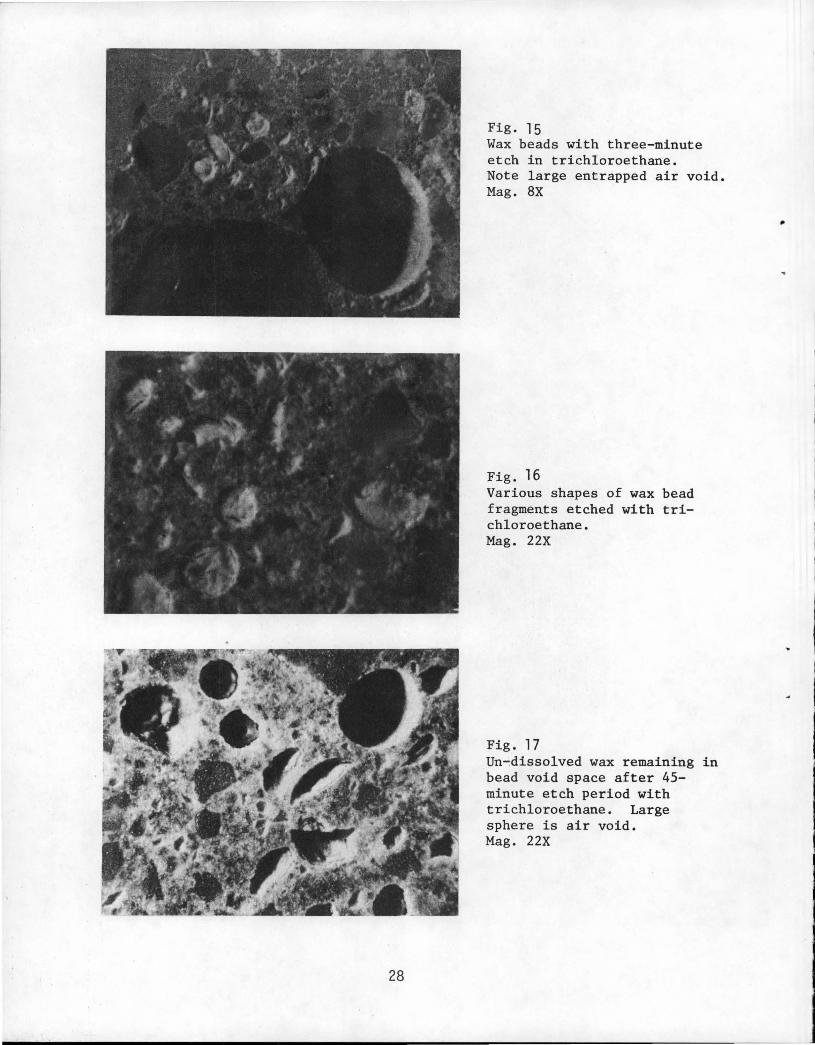
As shown in the figures, the spherical wax beads do not
necessarily remain intact when batched in concrete. Because of the
shearing and agitation action of mixing the plastic concrete, the
relatively soft wax beads generally break up and are found in the
hardened concrete mass as variously, but typically, crescent shaped
fragments (Figures 16 through 22).
In order to evaluate the distribution of the wax beads in the
experimental slab at Monahans, cores were horizontally sectioned at
depths of 2 l/2, 5 and 7 l/2 inches from the top surface. These
sections were polished and examined microscopically by linear
traverse methods as outlined in ASTM C 457. Instead of counting and
measuring the entrained _air void system the wax-bead voids present
after dissolution etching in trichloroethane were examined.
Measurements of 6.2, 5.5 and 5.2 percent 11Wax beads 11 were determined
at the above-listed depths respectively. No clumping or irregular
distribution of the beads within a sectioned area was observed.
Sections cut vertically in the experimental slab cores removed
after the 11 heat blanket .. treatment showed that the wax migrated into
surrounding paste for the area within 1/2 inch of the slab surface.
Below that depth the wax was still intact. Within the .. melted .. zone,
24

the wax voids still had a thin lining of residual material.
25

26
Fig. 9 "Interseal" brand wax beads. Note internal voids. Polarized light. Mag. 62X
Fig. l 0 Same as above. Mag. 125X
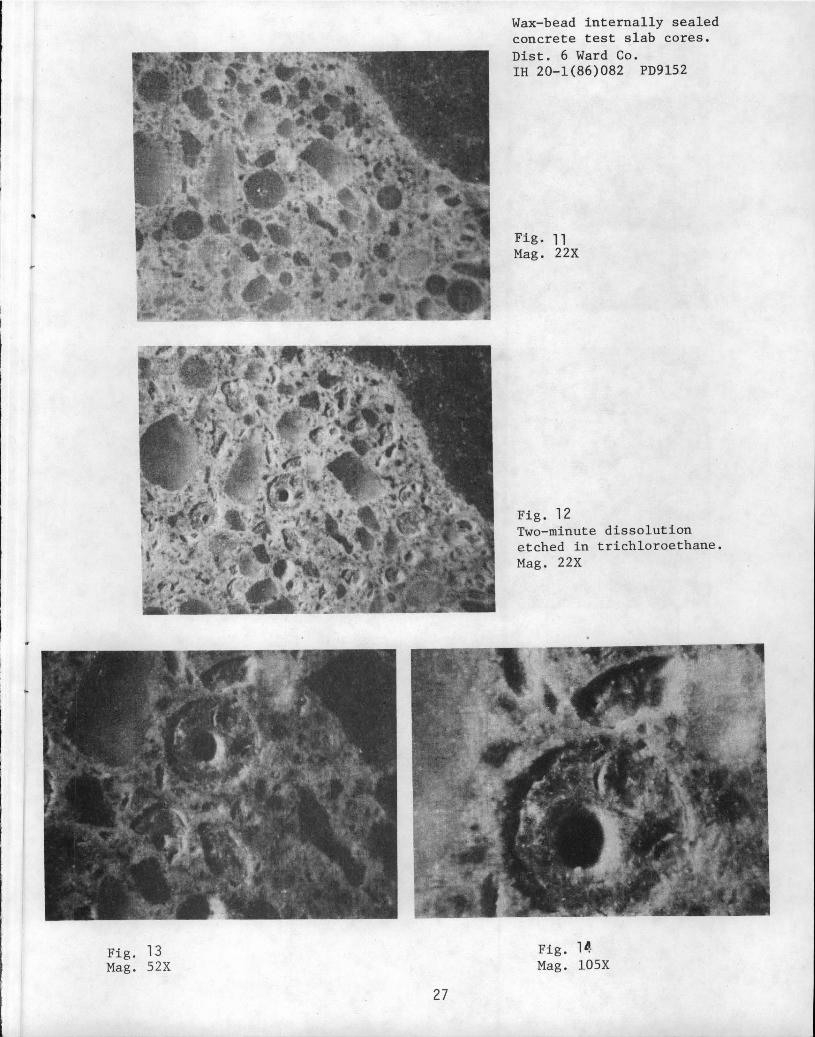
Fig. 13 Mag. 52X
27
Wax-bead internally sealed concrete test slab cores. Dist. 6 Ward Co. IH 20-1(86)082 PD9152
Fig. 11 Mag. 22X
Fig. 12 Two-minute dissolution etched in trichloroethane. Mag. 22X
Fig. 1~Mag. 105X
.f f
' ,.,
1!'11' f.
.• ..,~ . .,. \
I t . ,
' .. I
I \ ~ .. ,,
' ~)
1 !
<!J
i/
J I
28
Fig. 15 Wax beads with three-minute etch in trichloroethane. Note large entrapped air void. Mag. 8X
Fig. 16 Various shapes of wax bead fragments etched with trichloroethane. Mag. 22X
Fig. 17 Un-.dissolved wax remaining in bead void space after 45-minute etch period with trichloroethane. Large sphere is air void. Mag. 22X
..
..
...
Figs. 18-19 Various shapes and sizes of wax beads partially dissolved by trichloroethane. Note peripheral shrinkage of wax bead and internal void. Mag. 105X
29

30
Fig. 20 Wax-bead voids after one·-hour dissolution etch with trichloroethane. Mag. 22X
Fig. 21 Same view above. Note crescentshape wax bead fregments. Mag. 52X
Fig. 22 Same view above. Note insoluble residue in smaller wax-bead void. Mag. 105X
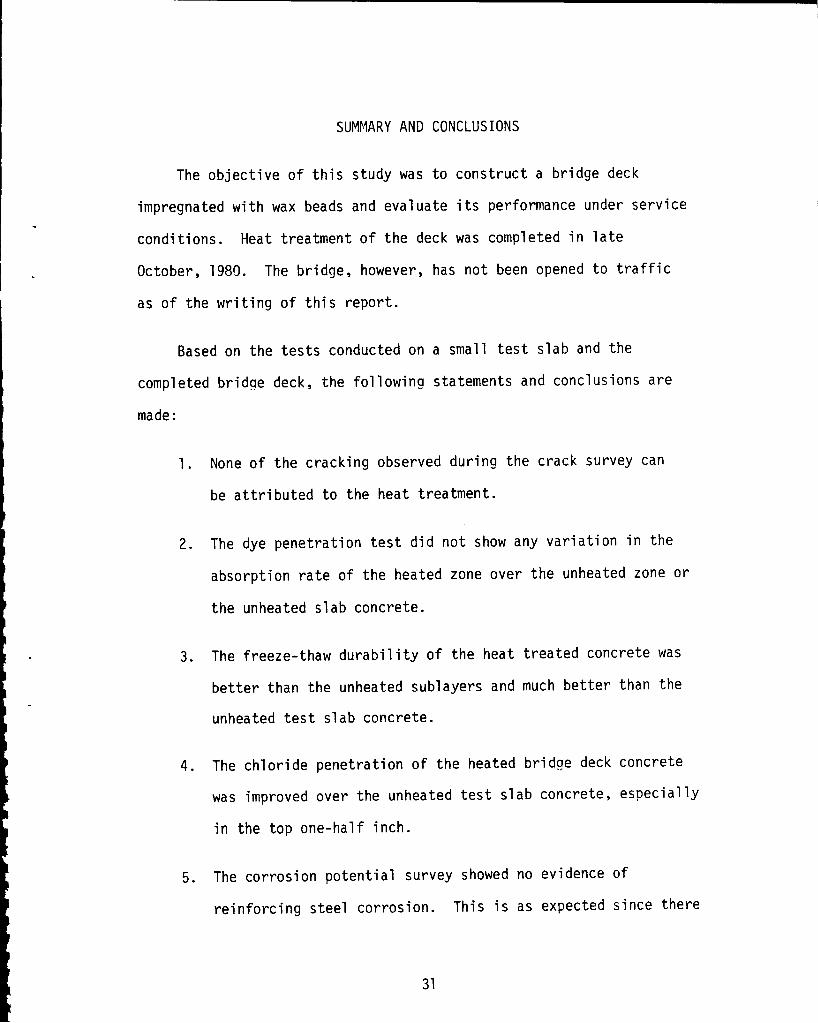
SUMMARY AND CONCLUSIONS
The objective of this study was to construct a bridge deck
impregnated with wax beads and evaluate its performance under service
conditions. Heat treatment of the deck was completed in late
October, 1980. The bridge, however, has not been opened to traffic
as of the writing of this report.
Based on the tests conducted on a small test slab and the
completed bridge deck, the following statements and conclusions are
made:
1. None of the cracking observed during the crack survey can
be attributed to the heat treatment.
2. The dye penetration test did not show any variation in the
absorption rate of the heated zone over the unheated zone or
the unheated slab concrete.
3. The freeze-thaw durability of the heat treated concrete was
better than the unheated sublayers and much better than the
unheated test slab concrete.
4. The chloride penetration of the heated bridge deck concrete
was improved over the unheated test slab concrete, especially
in the top one-half inch.
5. The corrosion potential survey showed no evidence of
reinforcing steel corrosion. This is as expected since there
31

has been no salt applied to the deck.
6. The wax beads in the concrete caused no apparent reduction
in concrete strengths. The measured strengths were equal to
or greater than required for normal Class 11 C11 bridge slab
concrete.
32
REFERENCES
1. Implementation Package 77-9 "Internally Sealed Concrete- Guide
to Construction and Heat Treatment", U.S. Department of
Transportation, Offices of Research and Development, Implementation
Division, April 1977.
33

APPENDIX A
SPECIAL SPECIFICATIONS
35

ward county I 20-1{86)082 cont. 4-4-46,etc.
STATE DEPARTMENT OF HIGHWAYS AND PUBLIC TRANSPORTATIONr
SPECIAL SPECIFICATIONS
ITEM 4222
INTERNALLY SEALED CONCRETE
4222.1. Description. This item shall govern for the concrete required to construct an internally sealed concrete bridge slab.
4222.2. Materials.
(1) Concrete. The concrete shall be Class "C" complying with the Item, "Concrete for Structures", except as modified by the following:
{a) The coarse aggregate shall be either Grade 2 or Grade 3.
{b) The internally sealed concrete shall contain a minimum of 6.5 sacks of Type II cement per cubic yard: have a water-cement ratio not to exceed 5.0 gallons per sack: have a coarse aggregate factor not less than 0.70: shall be nQn-air entrained: and shall contain 2.1 cubic feet of wax beads per cubic yard. The wax beads shall replace an equal volume of fine aggregate or combination of fine and coarse aggregate. Approved water reducing and retarding admixtures may be used. The slump range shall be 2 to 4 inches.
( 2) wax Beads. 'l'he wax beads sha 11 consist of a physical blend of 75 ~ 5 percent parafin wax, (melt point 149 ~ 2 F), and 25 ~ 5 percent crude Montan wax.
wax beads shall be spherical in shape and have a specific gravity of 0.845 (± 0.020), with a void volume of 8.0 to 12.0 percent. At least 60 percent of the wax beads shall have discernible voids. The gradation shall be as follows:
Siev~ No.
No. 20 No. 80
Percent Passing
99-100 0-5
The Contractor shall furnish certification of compliance with the above requirements.
1-2
37
4222.000 2-79

The wax beads shall be packaged in moisture proof containers not to exceed 250 lbs. Maximum temperature indicators shall be placed in two of the ~ax bead containers for each lot or separate shipment and plainly marked. The wax beads shall be shipped and stored so that they are not exposed to temperatures in excess of 120 F. lmy container of beads showing evide:~ce of melting or agglomerating shall be rejected.
4222.3. Construction Methods. Construction of the bridge deck wi !:h intr,;rnally sealed concrete shall b0 in accordanc,~ with all pert~inent requirements of the Item "Concrc·tc Structures" supplemented with the following requirements:
If an insulated bin is provided for the wax b~ads, they may ~e weighed and batched with the other materi2ls. If such a bin arrangement is not provided, the wax beads shall be pre--weighed
I
for each bate~ and added manually, after all othar materials have been charged into the mixer, except that approximately l/3 of the mixing water shall be withheld and then added after Lhe beads have been introduced. The concrete shall then be mixed at mixing speed for 70 to 100 revolutions.
The internally sealed concrete shall be covered with wet burlap as soon as possible after texturing, to ~e followed by a ten da~ ~ater cure, in accordance with th·e I1_em, "Concrete St.ructures". Interim membrane curing will not be permitt(2d.
The parapet ,railing shall not be placed prior to co;npletion of the heat treatment.
4222.4. Heat Treatment. Heat treatment will be accomplished with personnel and equipment of the Department after the deck has been in place at least 21 days.
Prior to heat treatm-2nt, the Contractor will be required to remove all equipment, forms, mats, and other rnateri~ls froffi the deck. The deck shall be swept clean of any loose dirt, s~nd
and other debris. Oil anC/or grease spots shall be removcJ.
4222.5. Measureme~t :1nd Payment. No direct .11~;asurement. or payment will be made under this Item; the requirements herein being measured and paid for in accord2ncc '.vith the It(~:n 4223, "Re;nforc!~d
Concrete Slab".
2-2
38
4222.000 2-1'9

Ward County I 20-1(86)082 Cont. 4-4-46,etc.
S'l'ATE DEPARTMENT OF HIGHWAYS AND PUBLIC TRANSPORTA'I'ION
SPECIAL SPECIFICATION
ITEM 4223
REINFORCED CONCRET!~ SLAB
4223.1. Description. This item shall govern the method of forming, the materials used, and the construction of a reinforced concrete slab in accordance with the details shown on the plans. The Contractor shall have' the option of constructing a cast-in-place slab using convention<ll forms or a cast-in-place slab using permanent metal dec\: fo t•ms.
4223~2. Materials. All materials for concrete shall conform to t-he requir-ements of the Items, "Concrct.e Structures", "Concrete for Structures'1 and/or "Internally Sealed Concrete".
Reinforcing steel shall conform to the requirements of the Item, "Reinfordng Steel" and the details shown on the plans.
Materials for permanent metal deck forms shall be in accordance with the Item, "Permanent Metal Deck Forms".
The slab concrete for the westbound structure over Park Road 41 shall be Class "C" (Internally Sealed Concrete), for the eastbound structure shall be Class "C-C", and for the Structure at FM 1053 shall be Class "C".
4223.3. Test Slabs.. After adequate t.ri~tl batches have been made and tested for spec.i.fication requirements on the Class "C"
(Internally Sealed Concrete} and on the Class "C--C" concrele, and a minimum of 30 days prior to placiny slab concrete in th::: structures, the Contractor shall cast a t.est s L<b fro;n each type of concrete for eva'luation. The test slabs shall be approximately 6' 0" X 8' 0'" and 8 inches in th ickne::.;s. The test slabs shall be form~d on the bottom and ull side~;.
The test slabs shal,l be cast simulatir.g actual placing conditions for the bridge slabs as nearly as possible.
The test slabs will be used to evaluate mix design; construction and vibration procedures~ air-entrainment, when required: wax bead distribution, when required; and the effecv~ of curing and texturin~.
l-3 39
4223.000 2-79
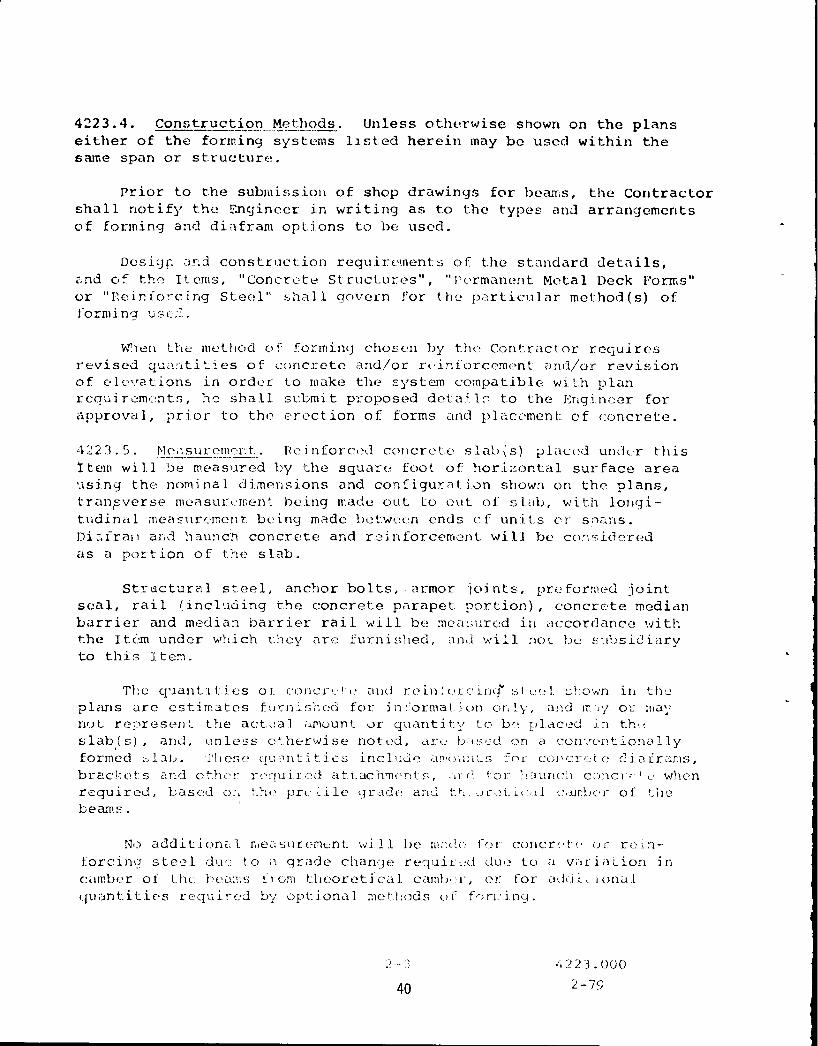
4223.4. Constr_uc:t_~Q.D ... r<!f.!J:-.!.l~.?ds_. Unless otherwise shown on the plans either of the forming sys toms llstcd herein may be used within the same span or st.ructure.
Prior to the submission of shop drawings for beams, the Contractor shall notify the Engineer in writing as to the types and arrangements of forming and dit\fram options to be used.
Desiy~ and construction rcquir~nents of lhe standard details, <-nd of thr~ It. ems, "Concrete St ruclures", "Pc'rma.nent Meta 1 Deck Forms" or "I-~c.ir..fo.!:c i.ng Stec!l" sh<1 ll govern for the! p<:lrticular method ( s) of forming usc:2 ..
W'1en th<.:: method of F.ormincJ chosc·n by tile' Contractor recjuircs r~vised qu<!!"Jti ~i es of cuncrete and/or rviniorcement <md/or revision of c·l c:va t ions in order t..o rnu.ke the system c:ompa tible vJi t.h plan n::qt;jr.:'!m(·nts, h-2 shilll st;bmit proposed dctai.l[~ t.o the Engineer for approval, ,prior to the erection of forms and placement cf concrete.
•12:21.5. r~~~-~~~.S']D_cr:t. Hcinforc.~d cnncrctc sla1.1(s) t-Jlilc(xl undt~r this Item will be measured by the square foot of horizontal surface area '.ising the nominal dimen::;ions and configu:r-<1lion sbown on the plans, transverse measur<.'Tr.cn~_ being rr.ade out to cut of s lt~b, \oJtt.h lollqi-' . t.udinal me<1~nrc•mcnt. be-ing ronde bct.wo:~cn ends cf units cr sn<.ns. Di .:.fra11 ar,d haunch concrete and r2inforcem"!nt will be co.""\sidf.~red
as a portion of the slab.
Str~ctural steel, anchor bolts, armor joints, preformed joint. seal, rail (incl~ding the concrete parapet portion), concrete mcdidn barrier and media:! barrier rail will be mca~;urcd in dccorcJance with t:he Item under wr1ich t.hcy u.r!': furni~;hed, '1n,J • .. :ill nol he s•.J!.)siciary to this ltem.
Tl:c quanl:tl.ics ot concr\_.,,, <111d rl~in:urcinqtr:,;t,_~r:J. :..;!~o· ...... ·n in t])~
plc.u1s arc est:irr.atcs fu"Cn_is:~c:c) fc>r in::orinat.it>n c,nly, a!1cl rr,_·ly or :na~7
nr.Jt.. re~resent lhe act.\:a] <.-:.P1ount or quantity l.o b'~ plac·~d i'l t.h<'
slab,( s), and, unless c~.henoJise not.(~d . .:.1r,: b·t:~·:.d on a con·Jc·n~iona lly formed ~ol.:"iL•. l'hc~;e qu<1 nt1tic::.; incluur:> ;_l''•uu:l' ... s ~nr coPcr,::le (~ia[rc:.ms,
brc.cl:t~t:s ar.d other r'-'1uirr.:d at.Lc.tch'llt'nt_::, ·" r' for '1:nnH:l1 CY1Ct ··• c· when required, base.] or, L'-1•' pn: ,_ ile qr.::ldc· anr.l th._ · .. JC·~L i.<' .. ll •.'.-:tir.l .. c·r of the beam!':.
No addit:ion<,l me<'•SlHHTlt::nt \v:i ll be m::llc· for concn·t·.· oc r;_:i.~l
t:orcin<J stc•:?l du::- to <1 grade chanqe re•p.1irc:d du •. : to il Vc•r iat:.ion in c,unbcr oi Lhc 1-)v.:..u:.s f1om t.11corctfcal cambt·l·, ()r for chkli~ 1ona.l qu<:tnt.it.iE>s t·cqu.i.n:d b1· opLional metl:od~; ur f•)n,·ing.
40
<'+223.000
2-79

4223.6. Payment. The quantity to be paid for shall be measured in place, as specified in Article 4223.5. above.
The unit price bid per square foot for "Reinforced Concrete Slab, (Class "C")", "Reinforced Concrete Slab (Class "C-C")", or for "Reinforced Concrete Slab, (Class "C" Internally Sealed Concrete)", shall be full compensation for furnishing, hauling, mixing, placing, curing and finishing of concrete: furnishing and placing all reinforcing steel; furnishing wax beads: furnishing water reducing plasticizer; all grouting and pointing~ for casting of test slabs; furnishing and placing drains and expansion joint material except where specifically furnished under another Item; furnishing and placing metal flashing strips; for all forms (removable and/or permanent) and all falsewor~ and for all labor, tools, equipment, and incidentals necessary to complet.e the 'tJork •
. 3-3
4i


APPENDIX 8
CONCRETE DESIGN WORK SHEET
43
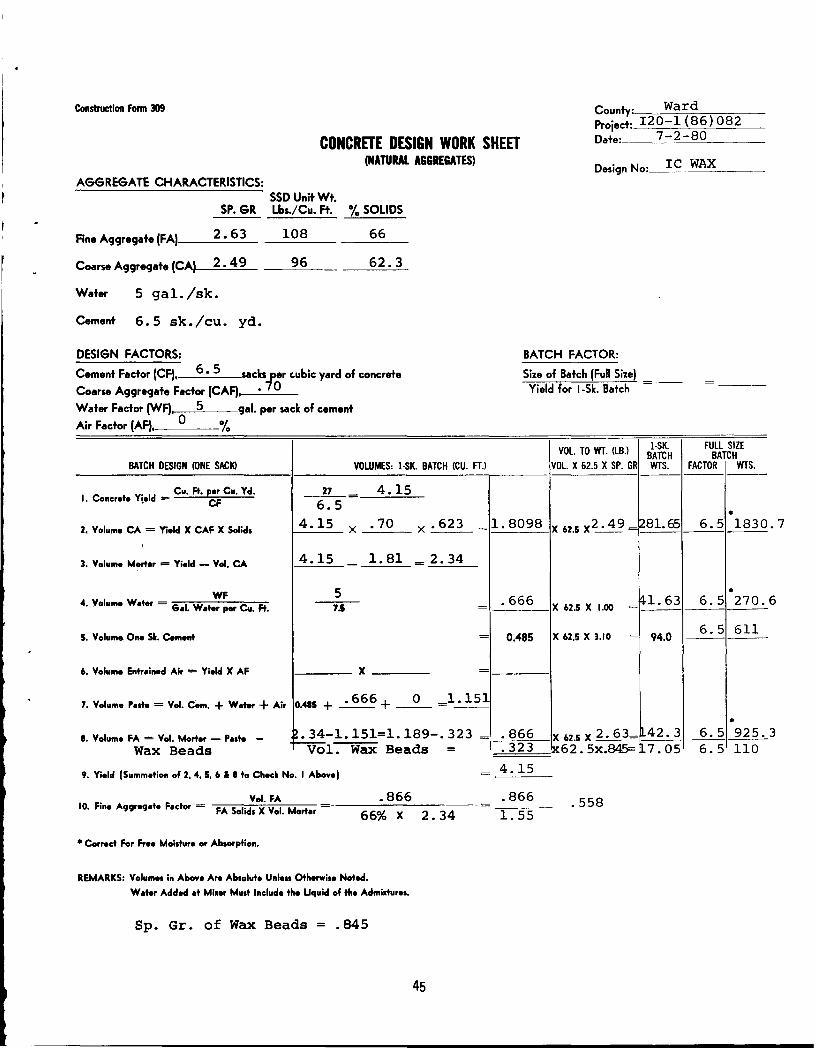
County: Ward Project: I20-1 (86) 082
Construction Form 309
CONCRETE DESIGN WORK SHEET (NATURAL AGGREGATES)
Date: 7-2-80
Design No: IC WAX
AGGREGATE CHARACTERISTICS: SSD UnitWt.
SP. GR Lbs./Cu. Ft. % SOLIDS
Fine Aggregate (FA)1 ___ 2_. _6_3 ___ 1_0_8 _____ 6_6 __
Coarse Aggregate (CA.)J---=2-=-. --=-4-==-9- __ _::9_::6:__ 62. 3
Water 5 gal. /sk.
Cement 6. 5 sk. /cu. yd.
DESIGN FACTORS: BATCH FACTOR:
Cement Factor (CF), 6 • 5 sacks per c.ubic yard of concrete Coarse Aggregate Factor (CAF), • 7 0
Size of Batch (Full Size) Yield for 1-Sk. Batch = --
Water Factor (WF), 5 gal. per sack of cement Air Factor (AF) O o,'. I 0
VOL TO WT. !LB.) 1-SK. BATCH
BATCH DESIGN (ONE SACIO VOWMES: 1-SK. BATCH (CU. FTJ VOL X 62.5 X SP. GR WTS. -
I. Concrete Yield = Cu. Ft. l!er Cu. Yd. _.!!.._= 4.15
CF 6.5
2, Volume CA = Yield X CAF X Solids 4.15 X .70 X. 623 = 1. 8098 x 62.5 x2- 4 9 = ~81.65
3. Volume Morter = Yield - Vol. CA 4.15 - 1.81 = 2. 34
WF 5 4. Volume Water = 6al. Water per Cu. Ft. 7.5 =
5. Volume One Sit. Cement =
6. Volume Entrained Air = Yield X AF X -
7. Volume Paste = Vol. Citm. + Water + Air 0_485 + • 666 + _o_ =1. 151
8. Volume FA = Vol. Morter - Paste - ~i~·;:;=~~!~:--:23 =
Wax Beads I
9. Yield (Summation of 2, 4, 5, 6 & 8 to Check No. I Above)
• Vol. FA 10. F•ne Aggregate Factor = FA Solids X Vol. Morter
.866 66% X 2.34
* Correct For Free Moisture or Absorption.
REMARKS: Volumes in Above Are Absolute Unless Otherwise Noted.
Water Added at Mixer Must Include the Uquid of the Admixtures.
Sp. Gr. of Wax Beads = .845
45
.666
0.485
.866
.323
4.15
.866
1. 55
X 62.5 X 1.00 =~1. 63
X 62.5 X 3.10 = 94.0
X 62.5 X 2 • 63= 42.3 ---~62. 5x.845= 7.05
.558
FULL SIZE BATCH
FACTOR WTS. ------
e 6.5 1830 ---
• 6.5 270.
------6.5 611
------
• 6.5 925. 6.5 110
• 7
6
3
APPENDIX C
FHWA HEAT TREATING GUIDELINES
47

GUIDELINES AND FIELD OPERATIONS CHECKLIST FOR
HEAT TREATING INTERNALLY SEALED CONCRETE
HEATING PARAHETERS
Limit surface temperature (at 1/16 inch depth) to maximum of 160°F in first 1.3 hours of the heat run. This procedure permits potentially damaging quantities of moisture vapor to escape before the wax starts to block capillaries and cause pressure buildup.
In addition to the above, the following limitations are applicable:
1. Limit surface temperature (at 1/16 inch depth) during initial 0.5 hour of heating, to not more than 145°F, nor less than 30°F above the ambient air temperature. These precautions are to insure removal of moisture to the extent necessary.
2. A temperature of 320°F is the maximum permitted, as a precaution against damage to the concrete due to excessive temperatures. These are monitored at equivalent 1/16 inch depth surface temperature.
Heat treating is complete when concrete has reached 185°F at a 2-inch depth in all areas being heat treated, but will not be attained in less than 5 hours.
The thermocouples used to monitor the heat applied to the concrete during heat treatments have been calibrated, and the following limitations will apply:
Time Hours
0 - 0.5
0.5 - 1.3
After 1.3
Heat Required
Depth
Surface
Surface
Surface
2 inches
Monitor Reading
oc
80
87
166
93
49
Corrected oc
63
71
160
85
Monitor Reading Corrected
oF oF
176
188.6
330.8
199.4
145
160
320
185
Maximum
Maximum
Maximum
Minimum
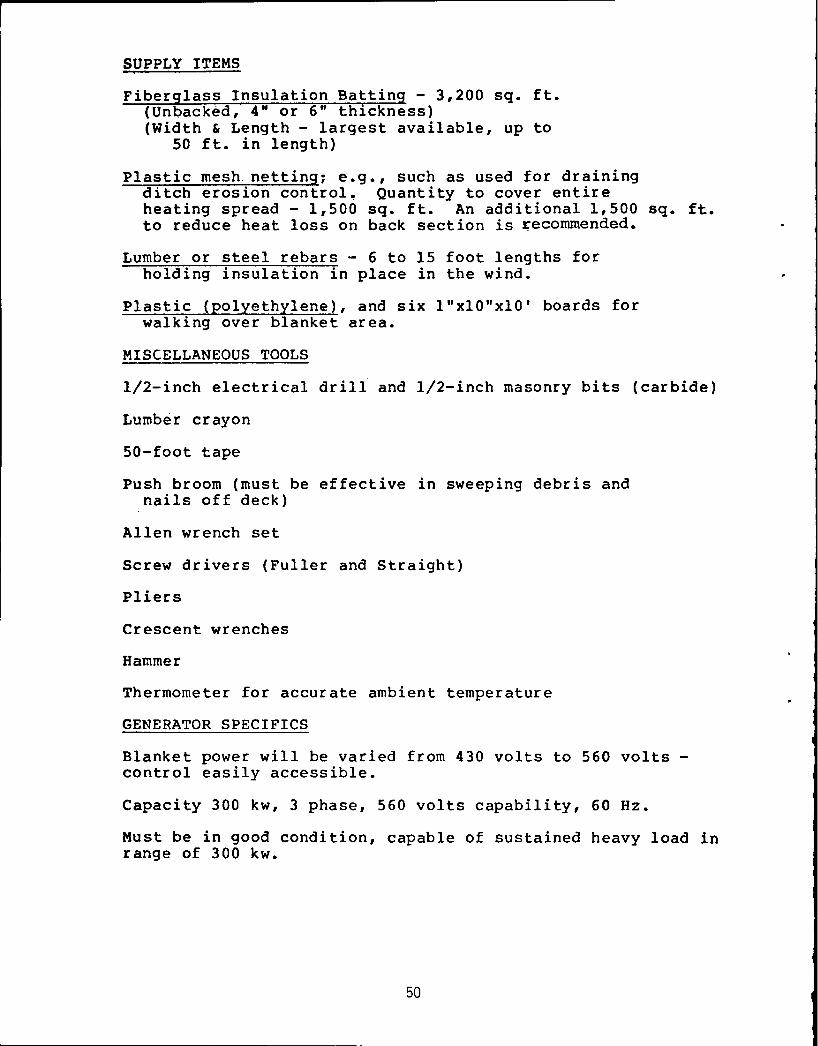
SUPPLY ITEMS
Fiberglass Insulation Batting - 3,200 sq. ft. (Unback~d, 4" or 6" thickness) (Width & Length - largest available, up to
50 ft. in length)
Plastic mesh netting; e.g., such as used for draining ditch erosion control~ Quantity to cover entire heating spread - 1,500 sq. ft. An additional 1,500 sq. ft. to reduce heat loss on back section is ~ecornrnended.
Lumber or steel rebars - 6 to 15 foot lengths for holding insulation in place in the wind.
Plastic (polyethylene), and six l"xlO"xlO' boards for walking over blanket area.
MISCELLANEOUS TOOLS
1/2-inch electrical drill and 1/2-inch masonry bits (carbide)
Lumber crayon
50-foot tape
Push broom (must be effective in sweeping debris and nails off deck)
Allen wrench set
Screw drivers (Fuller and Straight)
Pliers
Crescent wrenches
Hammer
Thermometer for accurate ambient temperature
GENERATOR SPECIFICS
Blanket power will be varied from 430 volts to 560 volts -control easily accessible.
Capacity 300 kw, 3 phase, 560 volts capability, 60 Hz.
Must be in good condition, capable of sustained heavy load in range of 300 kw.
50
APPENDIX 0
FHWA TEST PROCEDURES
!ll
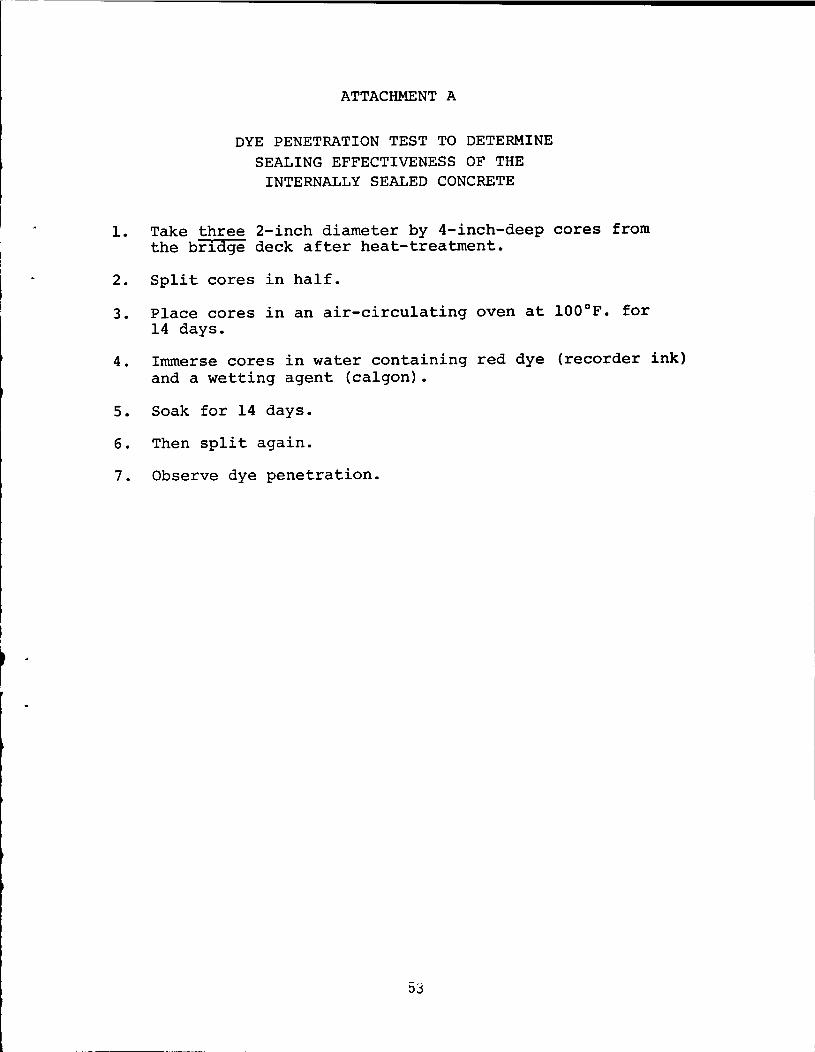
ATTACHMENT A
DYE PENETRATION TEST TO DETERMINE SEALING EFFECTIVENESS OF THE
INTERNALLY SEALED CONCRETE
1. Take three 2-inch diameter by 4-inch-deep cores from the bridge deck after heat-treatment.
2. Split cores in half.
3. Place cores in an air-circulating oven at 100°F. for 14 days.
4. Immerse cores in water containing red dye (recorder ink) and a wetting agent (calgon).
5. Soak for 14 days.
6. Then split again.
7. Observe dye penetration.
53
----------------------
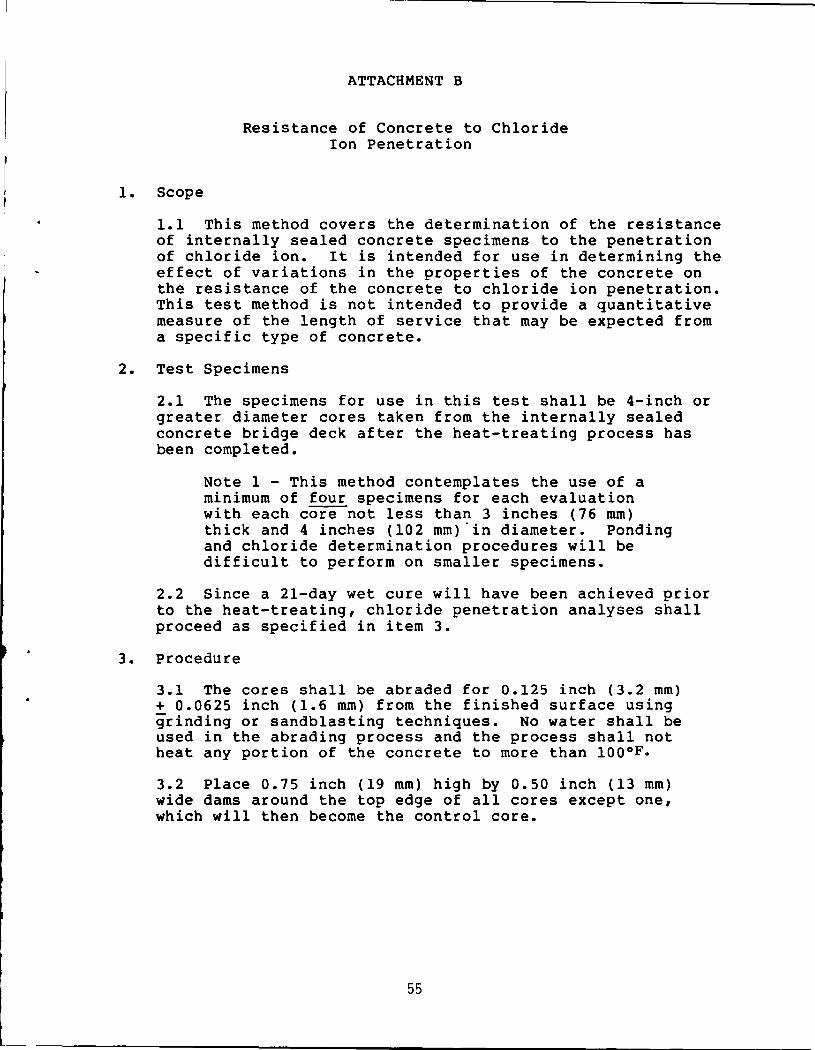
1. Scope
ATTACHMENT B
Resistance of Concrete to Chloride Ion Penetration
1.1 This method covers the determination of the resistance of internally sealed concrete specimens to the penetration of chloride ion. It is intended for use in determining the effect of variations in the properties of the concrete on the resistance of the concrete to chloride ion penetration. This test method is not intended to provide a quantitative measure of the length of service that may be expected from a specific type of concrete.
2. Test Specimens
2.1 The specimens for use in this test shall be 4-inch or greater diameter cores taken from the internally sealed concrete bridge deck after the heat-treating process has been completed.
Note 1 - This method contemplates the use of a minimum of four specimens for each evaluation with each core-not less than 3 inches (76 mm) thick and 4 inches (102 mm) "in diameter. Ponding and chloride determination procedures will be difficult to perform on smaller specimens.
2.2 Since a 21-day wet cure will have been achieved prior to the heat-treating, chloride penetration analyses shall proceed as specified in item 3.
3. Procedure
3.1 The cores shall be abraded for 0.125 inch (3.2 mm) + 0.0625 inch (1.6 mm) from the finished surface using grinding or sandblasting techniques. No water shall be used in the abrading process and the process shall not heat any portion of the concrete to more than 100°F.
3.2 Place 0.75 inch (19 mm) high by 0.50 inch (13 mm) wide dams around the top edge of all cores except one, which will then become the control core.
55

3.3 All cores shall be placed in a drying room of the type specified by AASHTO: T-160, "Length Change of Cement Mortar and Concrete" at a temperature of 100°F for a period of 6 days. After drying, the cores with dams will be subjected to continuous ponding with a 0.50 inch (13 mm) deep 3 percent sodium chloride solution for 90 days. Glass plates shall be placed over the ponded solutions to retard evaporation of the solution. Additional solution shall be added if necessary to maintain the 0.50 inch depth.
3.4 After 90 days of exposure the solution shall be removed from the cores. The cores shall be allowed to dry and then the surfaces shall be wire brushed until all salt crystal buildup is completely removed.
3.5 Samples for chloride ion analysis shall then be taken from all cores in accordance with the rotary hammer procedure described in report FHWA-RD-74-5 or by dry coring (1.5 inch (38 mm) minimum diameter cores) and dry sawing. Three samples shall be obtained from each core at each of the following depths:
1/16 inch (1.6 mm) to 0.5 inch (13 mm) 0.5 inch (13 mm) to 1.0 inch (25 mm) 1.0 inch (25 mm) to 1.5 inch (38 mm)
The chloride content (parts per million by weight) of each sample shall be determined in accordance with the procedures described in attachment C.
4. Calculations
4.1 The baseline chloride ion content for the test specimens shall be determined as the average chloride ion content of samples obtained from the 1/16 inch (1.6 mm) to 0.5 inch (13 mm), 0.5 inch (13 mm) to 1.0 inch (25 mm), and 1.0 inch (25 mm) to 1.5 inch (38 mm) depths within the core that was not ponded with 3 percent NaCl solution.
4.2 The absorbed chloride ion content of each sample from the ponded cores shall be determined as the difference between the total chloride ion content of that sample and the baseline value calculated in Section 4.1. If the result is less than zero, the result shall be reported as zero. The average chloride ion absorbed at each sampling depth shall be calculated.
5. Report
5.1 Reporting shall include: (1) each total chloride ion value determined in Section 3.57 (2) the average and maximum baseline chloride ion (Section 4.1); (3) each calculated absorbed chloride ion value determined in Section 4.2; and (4) the average and maximum absorbed chloride ion values calculated in Section 4.2 for each depth.
57

1. Scope
ATTACHMENT C
STANDARD METHOD OF SAMPLING AND TESTING FOR TOTAL
CHLORIDE ION IN CONCRETE
1.1 This method covers a procedure for the determination of the total chloride ion content of aggregates, portland cement, mortar, or concrete. The method is limited to material that does not contain sulfides, but the extraction procedure, paragraphs 5.1 through 5.6, may be used for all such materials.
2. Apparatus
2.1 Samples may be obtained by one of two methods, 2.1.1 or 2.1.2
2.1.1
2.1.2
2.1.2.1
2.1.2.2
2.1.2.3
2.1.2.4
2.2 Testing
Core drill.
Rotary impact type drill with a depth indicator and drill or pulverizing bits of sufficient diameter to provide a representative sample of sufficient size for testing.
Sample container capable of maintaining the sample in an uncontaminated state.
Spoons of adequate size to collect the sample from the drilled holes.
A "blow out" bulb or other suitable means or removing excess pulverized material from the hole prior to redrilling operations.
A pachometer capable of determining the location and depth of steel reinforcement to+ 1/8 inch (+3 mm).
2.2.1 Chloride ion or silver/sulfide ion selective electrode and manufacturer-recommended filling solutions.
Note: Suggested electrodes are the Orion 96-17 Combination Chloride Electrode or the Orion 94-6 Silver/Sulfide Electrode or
59
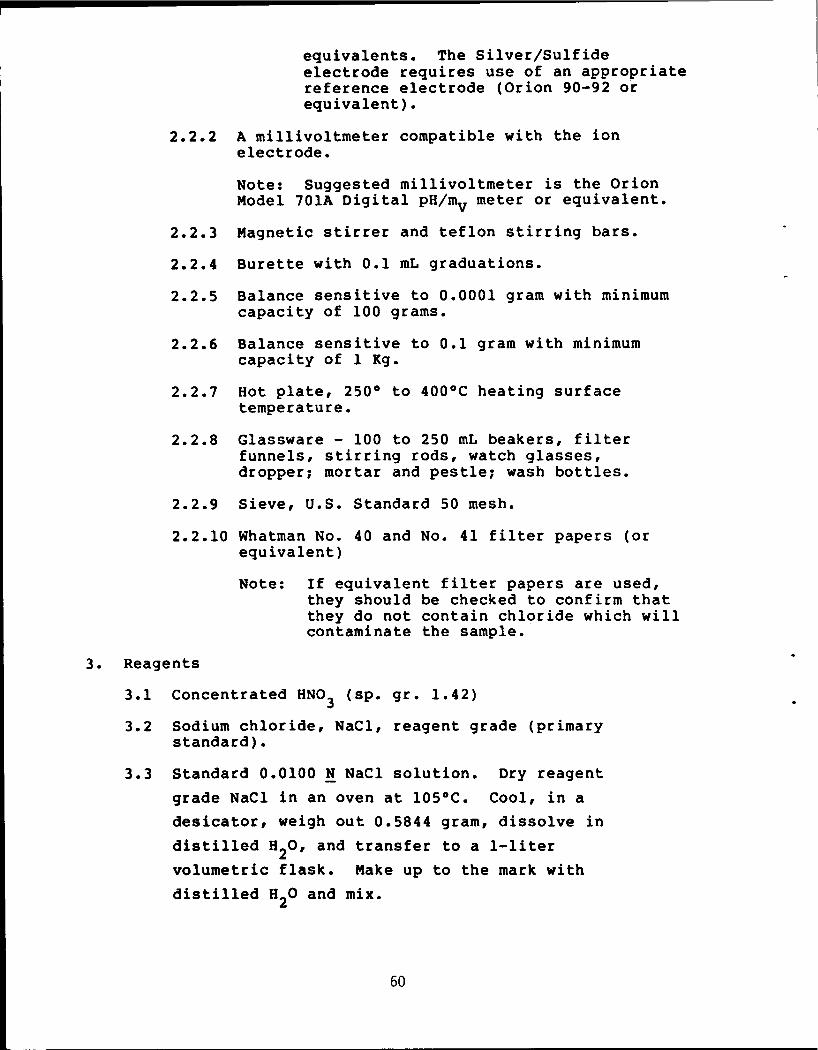
equivalents. The Silver/Sulfide electrode requires use of an appropriate reference electrode (Orion 90-92 o~ equivalent).
2.2.2 A millivoltmeter compatible with the ion electrode.
Note: Suggested millivoltmeter is the Orion Model 701A Digital pH/mv meter or equivalent.
2.2.3 Magnetic stirrer and teflon stirring bars.
2.2.4 Burette with 0.1 mL graduations.
2.2.5 Balance sensitive to 0.0001 gram with minimum capacity of 100 grams.
2.2.6 Balance sensitive to 0.1 gram with minimum capacity of 1 Kg.
2.2.7 Hot plate, 250° to 400°C heating surface temperature.
2.2.8 Glassware - 100 to 250 mL beakers, filter funnels, stirring rods, watch glasses, dropper~ mortar and pestle~ wash bottles.
2.2.9 Sieve, u.s. Standard 50 mesh.
2.2.10 Whatman No. 40 and No. 41 filter papers (or equivalent)
3. Reagents
Note: If equivalent filter papers are used, they should be checked to confirm that they do not contain chloride which will contaminate the sample.·
3.1 Concentrated HN03 (sp. gr. 1.42)
3.2 Sodium chloride, NaCl, reagent grade (primary standard).
3.3 Standard 0.0100 N NaCl solution. Dry reagent
grade NaCl in an oven at 105°C. Cool, in a desicator, weigh out 0.5844 gram, dissolve in
distilled H2o, and transfer to a 1-liter
volumetric flask. Make up to the mark with
distilled a2o and mix.
60

•
3.4 Standard 0.01 N AgN03 • Weigh 1.7 grams of reagent
grade AgN03 , dissolve in distilled a2o, filter into a 1-liter brown grass bottle, fill, and mix thoroughly. Standardize against 25.00 mL of the NaCl solution by the titration method given in
paragraph 5.7.
3.5 Distilled water.
3.6 Methyl orange indicator.
3.7 Ethyl alcohol, technical grade.
4. Method of Sampling
4.1 Determine the depth within the concrete for which the chloride content is desired. use the pachometer to determine reinforcement bar location and depth.
4.2 Core Method - Drill the core to chosen depth and retrieve.
4.2.1 When samples are received in the laboratory in other than pulverized condition, the sample shall be crushed and ground to a powder. All sawing or crushing shall be done dry (i.e. without water). All material shall pass a No. 50 mesh sieve. All pulverizing tools and sieves shall be washed with ethyl alcohol or distilled water and shall be dry before use with each separate sample (see note para. 4.3.7).
4.3 Pulverizing Method
4.3.1 Set the rotary hammer depth indicator so that it will drill to 1/4 inch (6 mm) above the desired depth.
4.3.2 Using a drill or pulverizing bit, drill until the depth indicator seats itself on the concrete surface.
4.3.3 Thoroughly clean the drilled hole and surrounding area utilizing the "blow out" bulb or other suitable means.
4.3.4 Reset the depth indicator to permit 1/2 inch (13 mm) additional drilling.
4.3.5 Pulverize the concrete until the depth indicator again seats itself on the concrete.
61

Note: Care must be exercised during this pulverizing operation to prevent the drill bit from abrading concrete from the sides of the hole above the sampling depth. To insure against this, some users utilize an 0.2S inch (6 mm) smaller diameter bit in this step than that used in para. 4.3.2.
4.3.6 Collect at least 10 grams of the material remaining in the hole using a spoon and place in the sample container.
4.3.7 If the sample, as collected, does not completely pass a SO mesh screen, additional pulverizing shall be performed until the entire sample is finer than SO mesh.
s. Procedure
Note: During sample collection and pulverizing, personnel shall use caution to prevent contact of the sample with hands, or other sources of body perspiration or contamination. Further, all sampling tools (drill bits, spoons, bottles, sieves, etc.) shall be washed with ethyl alcohol or distilled water and shall be dry prior to use on each separate sample. Ethyl alcohol is normally perferred for washing because of the rapid drying which naturally occurs.
S.l Weigh to the nearest milligram a 3 gram powdered sample representative of the material under test.
Note: Some users dry the sample to constant weight in a 10S°C oven and determine the dry sample weight prior to analysis. This optional procedure provides a constant base for comparison of all results by eliminating moisture content as a variable. It is generally believed that drying is only necessary when very high accuracy is desired (see Reference 1 for data in this area).
Transfer the sample quantitatively to a mortar~ add
10 mL of hot (90° to 100°C) distilled a2o to the
mortar, swirling to bring the powder into suspension.
62
•
I j
j
Carefully grind the slurry with a pestle until all lumps are gone. Very little grinding will be necessary for soft aggregates, but considerable effort will be required for samples containing hard aggregates.
Note: Sample particle size after grinding should be such that it will pass a 100 mesh screen. Further, about 75 percent of a properly ground sample will pass a 200 mesh screen. It is suggested that the analyst grind several trial samples, in accordance with the above procedure and then dry the samples and determine the particle size as a means of defining the grinding required for actual samples.
5.2 Transfer the slurry quantitatively from the mortar
through a funnel into a 100 mL beaker, rinsing the
funnel lightly with hot distilled H20. Add 3 mL
concentrated HN03
to the mortar and stir with the
pestle to completely dissolve any cement left in the
mortar. Transfer the contents of the mortar through
the funnel while continuously stirring the beaker
with a glass stirring rod. Rinse the mortar, pestle,
inside of the funnel and the tip of the funnel with
hot distrilled H20.
Note: Too rapid transfer of the acid into the 100 mL beaker will cause excessive foaming or frothing of samples with calcareous aggregates or organic components and resultant risk of sample loss.
5.3 Make up the solution in the 100 mL beaker to
approximately 50 mL with hot distilled H2o. Stir
thoroughly to ensure complete sample digestion.
Add five drops of methyl orange indicator and stir.
If yellow to yellow-orange color appears solution is
not sufficiently acidic. Add additional concentrated
HN03
dropwise with continuous stirring until a
faint pink or red color persists in the solution.
Cover with a watch glass, retaining the stirring
rod in the beaker.
63
Note: Due to the presence of relatively insoluble materials in the sample, the solution generally will have a strong gray color, making the detection of the indicator color difficult at times. Running of several trial samples is suggested to give the analyst practice in detecting the indicator color.
5.4 Bring the solution in the covered 100 mL beaker to a boil on a medium heat (250 to 400°C) hot plate, and then boil for a full minute with care to avoid frothing and spillovers. Remove from heat.
Note: The analysis can be stopped at this point and the sample allowed to cool in an HCl fume-free area if it is necessary. Before proceeding to the next step, however, the solution must again be brought to a boil.
5.5 Prepare a funnel fitted with double filter paper
(Whatman No. 41 over No. 40 filter paper or equivalents)
and a 250 mL beaker to receive the filtrate. Carefully
lift the watch glass from the 100 mL beaker without
tilting it, and wash any adhering drops into the filter
paper with hot distilled water. Then filter the hot
solution into the 250 mL beaker. Proceed carefully,
employing the stirring rod to aid quantitative transfer
of the solution into the filter funnel. Wash the inside
of the 100 mL beaker and the stirring rod twice with hot
distilled H20. Transfer the washings through the
filter into the 250 mL beaker. Finally, carefully wash
the outside of the pouring lip of the 100 mL beaker
with hot distilled H2
0 into the filter.
5.6 wash the filter paper five to ten times with hot
distilled H20, being careful not to lift the paper
away from the funnel surface. Finally, lift the
filter paper carefully from the funnel and wash the
outside surface of the paper with hot distilled H20;
then wash the tip of the funnel. The final volume of
the filtered solution should be 125 to 150 mL. Cover
with a watch glass and allow to cool to room temperature
in an HCl fume-free atmosphere.
64
5.7 Two alternate methods are available to determine the Cl- content of the solution. Both methods utilize an ion selective electode (Cl- or Ag+) and both methods for the purpose of this analysis give results of essentially equal accuracy and precision. However, Method !!.offers a substantial decrease in time required for analysis over Method I.
5.7.1 Alternate Method I: Potentiometric Titration
Fill the Cl- or the Ag+ electode with the
solution(s) recommended by the manufacturer,
plug it into the millovoltmeter (preferably
the type with a digital rather than a dial
readout), and determine the approximate
equivalence point by immersing the electrode
in a beaker of distilled H20. Note
the approximate millivoltmeter reading
(which may be unsteady in H20.
Take the cooled sample beaker from 5.6
and carefully add 4.00 mL of 0.01 N NaCl,
swirling gently. Remove the beaker of
distilled H2
0 from the electrode, wipe the
electrode with absorbent paper, and immerse
the electrode in the sample solution. Place
the entire beaker-electrode assembly on a
magnetic stirrer and begin gentle stirring.
Using a calibrated buret, add gradually and
record the amount of standard 0.01 N AgN03
solution necessary to bring the millivoltmeter
reading to -40 mv of the equivalence point
determined in distilled H20. Then add
standard 0.01 N AgN03
solution in 0.10 mL
increments recording the millivoltmeter
reading after each addition.
65
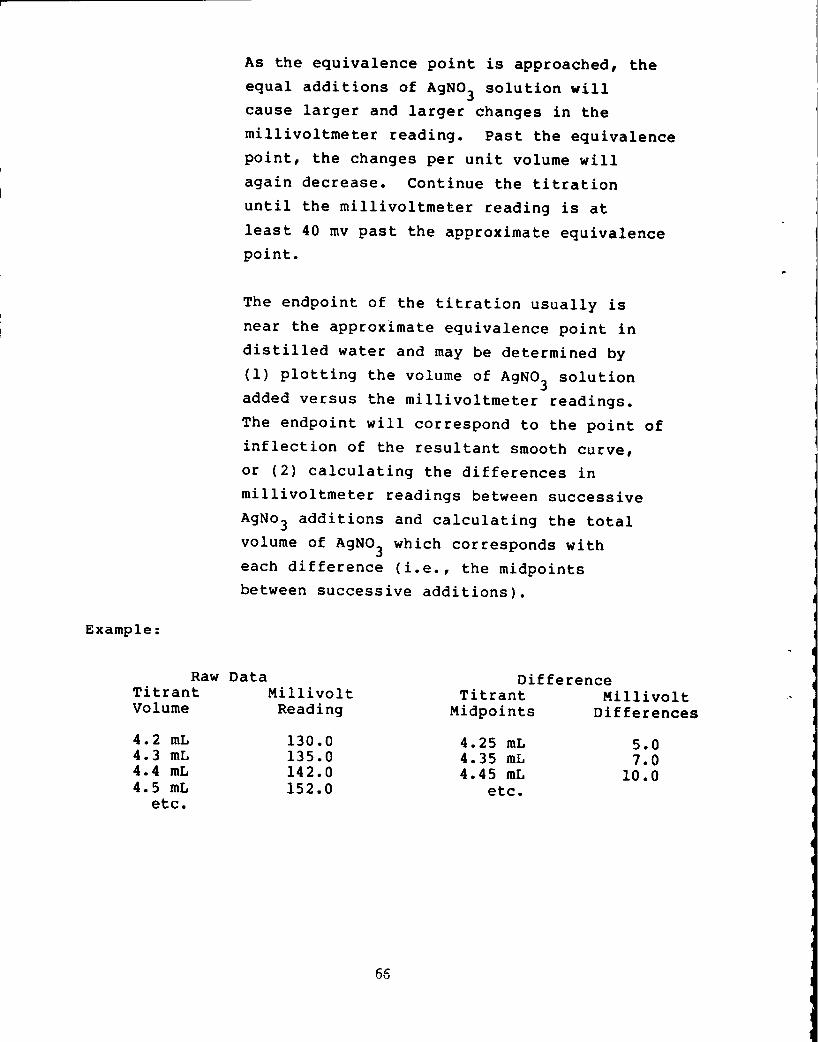
Example:
As the equivalence point is approached, the
equal additions of AgN03 solution will
cause larger and larger changes in the
millivoltmeter reading. Past the equivalence
point, the changes per unit volume will
again decrease. Continue the titration
until the millivoltmeter reading is at
least 40 mv past the approximate equivalence point.
The endpoint of the titration usually is
near the approximate equivalence point in
distilled water and may be determined by
(1) plotting the volume of AgN03
solution
added versus the millivoltmeter readings.
The endpoint will correspond to the point of
inflection of the resultant smooth curve,
or (2) calculating the differences in
millivoltmeter readings between successive
AgNo 3 additions and calculating the total
volume of AgN03
which corresponds with
each difference (i.e., the midpoints
between successive additions).
Raw Data Difference Titrant Millivolt Titrant Millivolt Volume Reading Midpoints Differences
4.2 mL 130.0 4.25 mL 5.0 4.3 mL 135.0 4.35 mL 7.0 4.4 mL 142.0 4.45 mL 10.0 4.5 mL 152.0 etc.
etc.
66
The endpoint will be near the midpoint which produced the largest change in millivoltmeter reading. It may be determined by plotting midpoints versus differences and defining the AgNO volume which corresponds to the maximum difference on a smooth, symmetrical curve drawn through the points. However, it can usually be estimated accurately without plotting the curve by choosing the midpoint which corresponds to the maximum difference and adjusting for asymmetry, if any. In other words, if the differences on each side of the largest difference are not symmetrical, adjust the endpoint mathematically in the direction of the larger differences. Detailed examples of this adjustment are contained in Reference 1.
5.7.2 Alternate Method II: Gran Plot Method
6. Calculations
This method is comparable with either a Clor Ag+ ion-selective electrode. Attach the electrode of choice to a compatible digital millivoltmeter after filling with required solutions as per the electrode manufacturer's instructions. Clean the electrode with distilled H
20 and pat dry
with absorbent paper.
Weigh the cooled sample and beaker from 5.6 without the watch glass and record the weight. Using a calibrated buret, titrate the sample to 225 mv + 5 mv (Cl- electrode) or 310 + 5 mv (Ag+ electrode) with standard O.OlN AgN0 3 solution. Record the volume added and ~he millivoltmeter reading.
Continue to titrate in 0.50 mL increments recording the volume added and the millivoltmeter reading for each increment. Add and record the data for at least five increments. Empty, clean, dry, and weigh the beaker. Subtract beaker weight from beaker + solution weight determined above to define solution weight.
Additional information on the Gran Plot Method is given in Reference 2.
6.1 Alternate Method I - Potentiometric Titration
67
Determine the endpoint of the titration as described in para. 5.7.1 by either plotting a curve or estimating from the numerical data. Calculate the percent Cl- ion from the equation:
% Cl = 3.5453 (Vl Nl - V2 N2) w
Where: v
1 = endpoint in mL
N1 = normality of AgNO
v2
= Volume of NaCl solution added,
N2 = Normality of NaCl solution
W = Weight of original concrete sample in grams.
6.2 Alternate Method II - Gran Plot Method
in mL
Calculate corrected values for each of the volumes recorded in 5.7.2 by the equation:
Where:
Vcorrect = v record W/100
W = original solution weight in grams V record = Volumes recored in mL
If any of the V correct values are greater than 10, see para. 6.3. If less than 10, plot these corrected values versus the corresponding millivolt readings on Orion Gran Plot Paper (10 percent volume corrected type with each major vertical scale division equal to 5 millivolts) or equivalent. Draw the best straight line through the points and read the endpoint at the intersection of the line with the horizontal axis of the graph. Calculate the actual endpoint by the equation:
Where:
Then
Where:
E , ACTUAL ENDPOINT = E ( W ) a g 100
E = Endpoint determined from graph g
w = Weight of solution in grams
% Cl- = 3.5453 E N a We
E = Actual endpoint, in mL Na= Normality of AgNO W = Concrete sample ~eight in grams c
68
in mL
..
6.3 Supplementary Gran Method Calculations:
When the V correct vo~umes determined in 6.2 are greater than 10, discard the values and follow the following procedure.
Choose a constant which, when subtracted from all V record volumes, yields values less than 10 ml.
Note: This constant, designated as X in the formulas below, is normally assigned an even value such as 5, 10, 15, 20, etc.
Calculate a revised solution weight Wr
wr = w + x Where: W = original solution weight in grams
X = the constant
Then calculate corrected volumes for each recorded volume as:
V corrected = V record - X wr/100
Plot these values and determine the graph endpoint
Eg as described in para. 6.2. The actual endpoint,
E is then: a
Where: E
= E i~.Q +X g
a = actual endpoint in rnl
Eg = endpoint from graph in rnl
Wr = revised solution weight in grams X = the constant chosen above
Calculate the chloride content using the formula given in para. 6.2.
6.4 The percent chloride may be converted to pounds of Clper cubic yard of concrete as follows:
lbs. Cl-/yd3 = %Cl = ( UW ) !Oo
69
Where:
7. References
OW = Unit weight of concrete per cubic yard.
Note: A unit weight of 3915 lbs/yd3 is often assumed for normal structural weight concrete when the actual unit weight is unknown.
1. Clear, K. C., "Evaluation of Portland Cement Concrete for Permanent Bridge Deck Repair," Federal Highway Administration, Report FHWA-RD-74-5, February 1974. National Technical Information Service PB 232-604/AS.
2. Clemena, G. c., Reynolds, J. w., and McCormick, R. M., "Comparative Studies of Chloride in Hardened Concrete," Virginia Highway and Transportation Research Council, Report 77-R7, August 1976. This report is available from the National Technical Information Service, Springfield, Virginia 22161.
70
•
•
ATTACHMENT D
Procedure for Determining Percent wax Beads by Volume in Plastic Concrete
1. Equipment Required:
a. b. c. d.
Chace Air Meter (Calibrated as per attachment). Squeeze bottle of saturated NaCl solution Squeeze bottle of H2o Screen: 14 mesh
2. Since wax beads have a lower specific gravity than the saturated NaCl solution, they will float. Due to this fact, the Chace Air Meter can be utilized to determine the percent wax beads by volume in plastic concrete.
3. Procedure:
a. Screen a sample (approximately 1 lb.) of the plastic concrete through a 14 mesh screen to remove the coarse aggregate.
b. Fill the sample cup of the Chace Air Meter with a sample of the screened plastic concrete.
c. Remove the excess plastic concrete from the sides of the sample cup and stopper with a squeeze bottle of H,o (i.e., rinse the outside of the sample cup and stopper with water).
d. Place the sample cup containing the concrete sample inside the Chace Air Meter. Make sure that the stopper is in tightly.
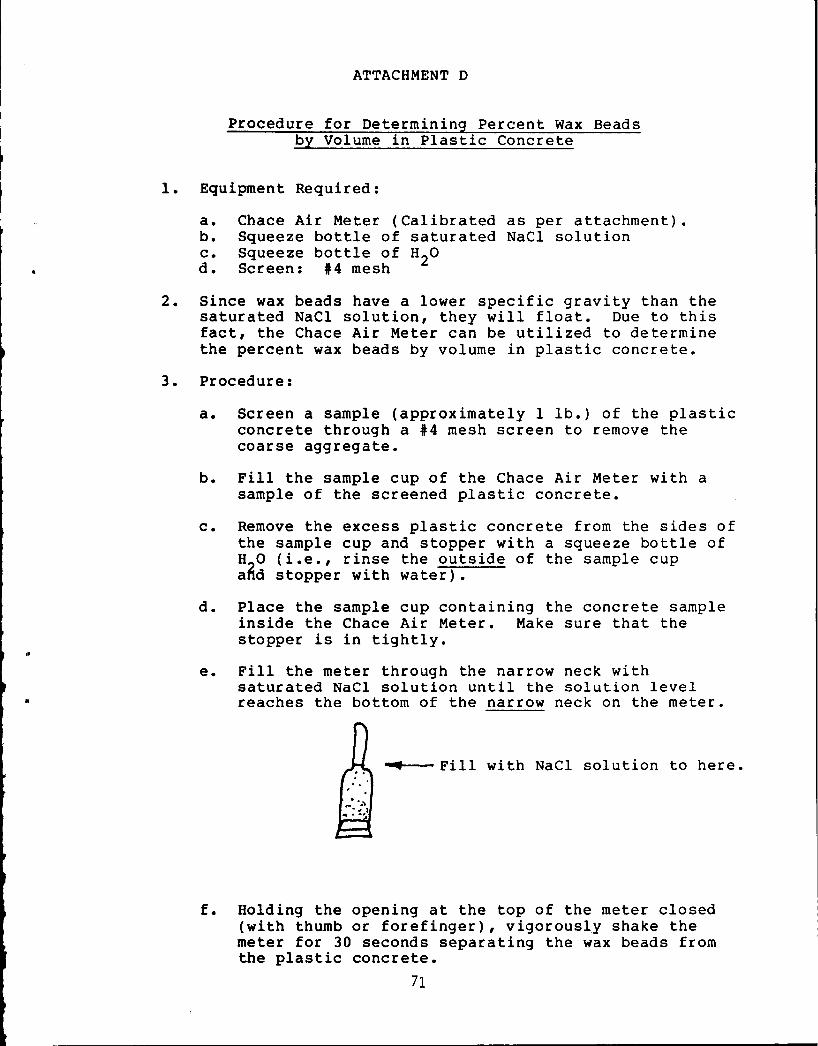
e. Fill the meter through the narrow neck with saturated NaCl solution until the solution level reaches the bottom of the narrow neck on the meter.
-. Fill with NaCl solution to here.
f. Holding the opening at the top of the meter closed (with thumb or forefinger), vigorously shake the meter for 30 seconds separating the wax beads from the plastic concrete.
71

g. Add NaCl solution through the neck of the meter until the top of the wax bead column is even with the top mark on the neck of the meter. (Meter must be vertical.)
h. Holding the meter vertically, gently tap the rubber stopper against a solid surface for a period of 15 seconds. This will cause any stray beads to float up into the neck of the meter.
i. Allow the meter to set on flat surface for a • period of 1 minute (note: meter must be setting on its rubber stopper in the vertical position).
j. Determine the height of the bead column to the nearest 1/10 of a division by counting the number of divisions that the column occupies in the neck of the meter.
k. To determine the percent wax beads by volume in the mix, simply convert the meter column height reading to percent wax beads by using your calibration curve.
1. Note: In order to obtain an accurate percent wax bead value, it is necessary to run three samples using the average of the three as the actual percent wax beads in the concrete mixture.
72
I
1
• 1 I 1

•
Calibration of Chace Air Meter to Read Percent Wax Beads by Volume
1. Since all Chace Meters do not yield the results for the same sample mix, it is necessary to calibrate the meter that will be used for wax bead volume determinations. Also, since the calibration procedure is time-consuming (approximately 3 hours), it is suggested that 1 meter be set aside and used exclusively for wax bead volume determinations (Note: This eliminates the need for continual recalibration because the same meter will be used each time.)
2. To calibrate the meter, four mix designs are needed: 5 percent wax beads by volume, 6 percent wax beads by volume, 8 percent wax beads by volume, and 10 percent wax beads by volume. Also, a total mix weight of approximately 2600 grams is desirable to facilitate hand mixing. Use the following table to design those mixes. (Note: 3 The table is based on: CF = 7 bags/yd , w/c = 0.55, air = 3 percent.)
Solid Volumes in ft. 3 /yd 3
Percent Wax 5 6 8 10
Cement 3.35 3.35 3.35 3.35 Air 0.81 0.81 0.81 0.81 Water 5.80 5.80 5.80 5.80 Fine Aggregate 8.22 7.95 7.41 6.87 Coarse Aggregate 7.47 7.47 7.47 7.47 Wax Beads 1.35 1.62 2.16 2.70
To obtain the s.s.o. weight of each material for a small (2600+ grams) batch that can be hand mixed easily, multiply each volume in the table by the following:
s.s.o. weight of material in grams = (43.00)x(S.G.)x(Volume from table)
Constant f
73
Where:
S.G. = Specific gravity of material Volume from table = Volume of that material for
the percent wax beads desired. (Example: For a 4 percent wax bead mix, the sement volume is 3.35 ft. ).
Next, obtain the batch weights and adjust for moisture in the aggregates as necessary to obtain final mix weights.
*Note: A sample for a 5 percent by volume wax bead mix is attached. Do not use this as a standard mix, it is only for reference.
3. Calibration Procedure:
a. Prepare the first mix (5 percent wax beads by volume). b. Follow the instructions, (Attachment D.3. - "Procedure for
Determining Percent Wax Beads by Volume in Plastic Concrete") through step J. (Note: Do the procedure four times to obtain four readings.)
c. Follow steps a and b for the other three mixes (i.e., 6 percent, 8 percent, 10 percent).
d. Average the four readings for each mix. e. Plot the average readings against the actual percent wax
beads in each mix to obtain the calibration curve. f. Make up a conversion sheet that can be kept with the
meter for field use. g. Samples of the calibration curve and conversion sheet
follow.
4. Once the meter has been calibrated, it may be used in the field to monitor wax bead content (percent by volume) ~ while the concrete is being placed.
•
74

'\
-
•
I
<::) <::) ~ <::) to.: ~ ~ ~
( 9NIOY3Y Y3l3N 3Nn10A OY38 XVM
75
~ ~-
~ I
El
~ ~ -> lJ
3:>VH:> ) 03YnSY3W
<::) ~ -.;;:
-<::) ~ ~ -~
""' ('j :E :) ..J
<::) 0 t...: >
<::) 0
~ <(
""' m ~ I() X
<(
~ ~
~ ..J <(
<::) :)
l(j ~ 0 <(
~ 'J
~ '..;.
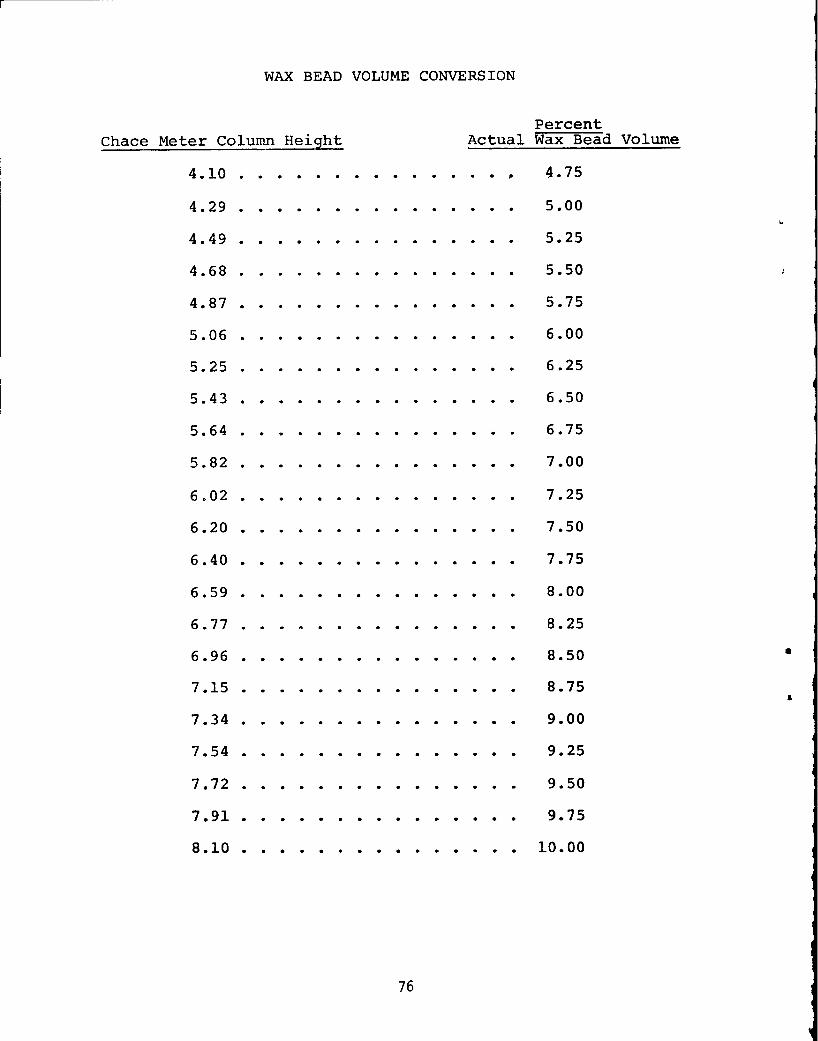
WAX BEAD VOLUME CONVERSION
Percent Chace Meter Column Height Actual Wax Bead Volume
4.10 ,. ~.75
4.29 5.00
4.49 5.25
4.68 5.50
4.87 5.75
5.06 6.00
5.25 6.25
5.43 6.50
5.64 6.75
5.82 7.00
6.02 7.25
6.20 7.50
6.40 7.75
6.59 8.00
6.77 8.25
6.96 8.50 • 7.15 8.75
• 7.34 9.00
7.54 9.25
7.72 9.50
7.91 9.75
8.10 10.00
l6

'
,,.
Sample 5 Percent by Volume Wax Bead Mix
C.F. = 7 bags/yd 3 W/C = 0.55 percent No Admixture
3 percent total moisture in sand
0 percent absorption in sand
3 percent Air
3 percent free H2
0 in sand
0.5 total moisture in stone
0.5 percent absorption 0.0 percent free H2o in stone
in stone
Specific Gravities: Cement= 3.15, Sand (F.A.) = 2.65, Stone (C.A.) = 2.77, Wax Beads = 0. 84
SSD Weights (Grams)
Cement = 453.76 Air = Water = 249.4 Fine Aggregates = 936.67 Coarse Aggregates = 889.75 Was Beads = 48.76
TOTAL WT. 2578.34
Final Batch Weights (Grams)
Cement = 453.76 Air = Water = 225.98 -----Fine Aggregate = 960.09 -----Coarse Aggregate = 889.75 Wax Beads = 48.76
TOTAL WT. 2578.34
'7'7 I I
[249.4 - (960.09 - 936.67)] [(936.67)(1.025)]
*U.S.GOVERNMENT PRINTING OFl'ICE: 1982--JH-426/1501
L_ __________________________________________________________ ~

..
J

The contents of this report reflect the views of the authors who are responsible for the facts and the accuracy of the data presented herein. The contents do not necessarily reflect the official views of the Texas State Department of Highways and Public Transportation or the Federal Highway Administration. This report does not constitute a Standard, Specification, or Regulation.
•
..