introductory probability - mathsbooks.net quest 11 methods/ch 10.pdf · 2 twenty letters were...
TRANSCRIPT

10
VCEVCEcocovverageerageArea of studyUnit 1 • Probability
In thisIn this chachapterpter10A Estimated probability and
expected number of outcomes
10B Calculating probabilities10C Tree diagrams and lattice
diagrams10D The Addition Law of
probabilities10E Karnaugh Maps and
probability tables10F Conditional probability10G Independent events10H Simulation
Introductoryprobability

424
M a t h e m a t i c a l M e t h o d U n i t s 1 a n d 2
Introduction to probability
Tossing a fair coin or rolling a standard 6-sided die will result in a range of outcomes.The coin can land on Head or Tail while the number appearing uppermost on the diewill be one of the numbers 1, 2, 3, 4, 5, 6. Probability involves assigning a numericalvalue to the likelihood of such events occurring.
In this respect certain events will clearly be more probable than others; for examplegetting only 1 of the required 6 numbers in the lottery game, Tattslotto is more likelythan obtaining all 6 winning numbers.
A numerical value for the probability of an event can be established in a number ofways. It can be based on results arising from experiments; alternatively, a reasoned esti-mate of the likelihood of the event can be provided on the strength of personal experienceand knowledge (the
subjective probability
). A third way is to consider the ‘symmetry’of the situation where the activity has
equiprobable
or
equally likely
outcomes. Forexample, if we toss a coin 50 times and note how many times it lands ‘Heads’ (Headfacing up), we may conclude (based on the experiment) that the probability of a coinlanding Heads up is ‘even-money’. We may also reason that a tossed coin has twoequally likely outcomes (Head and Tail) of which Heads is one possibility, so there is 1chance in 2, or , of a Head. However, deciding what the chances are of a runner winningher race will be subjective and dependent on considerations such as the runner’s pastperformances, her current state of fitness and the abilities of the other competitors.
Random outcome experiments
What is the probability of a fair coin landing Tails? For a single trial of this experiment(one toss of the coin), we know the coin will land either Heads or Tails, but we cannotbe sure the toss will produce a
favourable outcome
(that is, a Tail). The result is arandom outcome. (To close one’s eyes and take out a marble from a box containing dif-ferent coloured marbles or shuffling a pack of playing cards and choosing the topmostcard are also activities that produce random outcomes.)
For our example of the coin, if many trials are conducted we will observe that the
ratio , which is the
estimated probability
for the favourable out-
comes, converges (‘gets closer’) to a particular value. This particular value is known asthe
long-run proportion
.
Similarly, we observe that the ratio , the
estimated probability
for a Head, converges to a particular value.For a coin tossed many times the long-run proportion of a Head is 0.5 and the long-
run proportion of a Tail is 0.5.
Estimated probability and expected number of outcomes
In general, the estimated probability is given by:
estimated probability
=
The number of times an outcome of an activity is expected to occur is given by:
expected number of favourable outcomes
=
estimated probability (long-run proportion)
×
number of trials
12---
EXCEL
Spreadsheet
Long runproportion
number of Tailstotal number of trials--------------------------------------------------
EXCEL
Spreadsheet
GCpro
gram
One die
number of Headstotal number of trials--------------------------------------------------
GCpro
gram
Coin flip
number of favourable outcomes observedtotal number of trials
---------------------------------------------------------------------------------------------------
EXCEL
Spreadsheet
GCpro
gram
Two dice

C h a p t e r 1 0 I n t r o d u c t o r y p r o b a b i l i t y
425
A 6-sided die (not necessarily a fair one) was rolled 12 times and the number showing uppermost was noted each time. The numbers uppermost on the die were:
2, 4, 1, 1, 5, 6, 4, 3, 4, 5, 6, 1Estimate the probability of rolling a 5 with this die.THINK WRITE
There are 2 favourable outcomes.There are 12 outcomes altogether.
Use the formula: estimated probability = Estimated probability =
=
12
3number of favourable outcomes observed
total number of trials---------------------------------------------------------------------------------------------------
212------
16---
1WORKEDExample
A fair 6-sided die is rolled 48 times. How many times is an even number expected to show uppermost?THINK WRITE
There are 6 equally likely outcomes for the roll of the die and 3 favourable outcomes corresponding to an even number.
Estimated probability of an even number =
=
There are 48 trials. Use the formula: expected number of favourable outcomes = estimated probability × number of trials.
Expected number of even numbers = × 48
= 24
136---
12---
2 12---
2WORKEDExample
Inside a bag are 18 marbles, some white and the rest green. One marble is taken out without looking, its colour is noted and the marble put back inside the bag. When this is done 30 times it is found that a green marble was taken out 5 times. Estimate how many marbles of each colour are in the bag.THINK WRITE
A green marble was taken out 5 times and a white marble 25 times. Work out the estimated probabilities.
Estimated probability of green marble =
=
Estimated probability of white marble =
=
Calculate the expected number of each colour marble.
Expected number of green marbles = × 18
= 3
Expected number of white marbles = × 18
= 15Estimated number of each type of marble:15 white, 3 green.
1530------
16---
2530------
56---
216---
56---
3WORKEDExample

426 M a t h e m a t i c a l M e t h o d U n i t s 1 a n d 2
Estimated probability and expected number of outcomes
1 A coin was tossed 10 times and the outcomes noted as H, T, H, H, T, T, T, T, H, Twhere H is a Head and T is a Tail. Find the estimated probability of a Tail.
2 Twenty letters were chosen at random from the alphabet and recorded as either conso-nant, c, or vowel, v. The results were c, c, v, c, v, c, c, c, c, v, c, v, v, c, c, c, c, v, c, c.Calculate the estimated probability of choosing a consonant.
3 A biased coin is tossed 50 times. Thirty-three Tails and 17 Heads were recorded.a What is the estimated probability of tossing a Tail with this coin?b What is the estimated probability of tossing a Head with this coin?
4 A die is tossed 96 times. How many times is an odd number expected to appearuppermost on the die?
5 A coin is tossed 500 times. What is the expected number of Heads?
6 A die is rolled 300 times. How many odd numbers or the number 2 are expected toturn up?
7A die is tossed 102 times. The number of times a number between 1 and 3 inclusive isexpected to appear uppermost on the die is:
8A box contains 2 blue beads, 3 green beads and 1 yellow bead. One bead is taken out,its colour noted and it is put back in the box. This is repeated 246 times. The numberof times a bead that is not yellow is expected to be taken out of the box is:
9 Inside a box are 42 plastic shapes. Some of the shapes are squares and the remainderare circles. One shape is taken out at random, its shape is noted and it is put back inthe box. After this is repeated 84 times it is found that a square was taken out 36times. Estimate how many squares and how many circles are in the bag.
10 A closed box with a hole in one corner contains coloured marbles. Four are red, 2 areblue, 3 are white and 1 is green. The box is shaken and 1 marble falls out. Its colouris recorded and it is placed back in the box. This is done 200 times.a How many times is a red or blue marble expected to fall out of the box after 200
trials?b How many times is a marble that has a colour other than white expected to fall out
of the box after 200 trials?
A 51 B 34 C 20 D 64 E 68
A 41 B 82 C 205 D 123 E 164
remember1. Estimated probability =
2. Expected number of favourable outcomes = estimated probability (long-runproportion) × number of trials
number of favourable outcomes observedtotal number of trials
---------------------------------------------------------------------------------------------------
remember
10AWORKEDExample
1
WORKEDExample
2
mmultiple choiceultiple choice
mmultiple choiceultiple choice
WORKEDExample
3

C h a p t e r 1 0 I n t r o d u c t o r y p r o b a b i l i t y 42711
A moneybox contains 128 coins. There are 5-cent and 10-cent coins. The box isshaken, a coin falls out, the value of the coin is noted and it is placed back inside thebox. After this is repeated 96 times it is noted that a 5-cent coin fell out 60 times. Theestimated number of 10-cent coins in the moneybox is:
12 During a period of one week 190 people telephoned Hot-Shot Electrics for information.During the same period Zap Inc received 305 enquiries. Based on this information,how many enquiries did Hot-Shot and Zap Inc expect during a week where the totalnumber of phone calls made to the two businesses was 650?
13 The estimated probability that the Last Legs football team can win a match is . If theteam is to play 35 matches during the season, how many wins should it expect?
14 In a 9-game chess tournament, Adam won 6 games, lost 2 games and drew 1 game.a Based on this information, if
Adam is to play 108 games next year, how many games should he expect to:
i win?ii lose?iii draw?
b Based on the fact that Adam won 81 of the 108 games, how many games does he expect to lose or to draw in a tournament comprising 16 games?
15Inside a bag are red, blue and black marbles. Sally takes out one marble, notes itscolour and puts it back in the bag. When she has taken out a marble 360 times it isfound that a red marble was taken out 140 times and a black marble 200 times. IfSally takes out a marble 270 times, the number of blue marbles expected is:
16 A post-office has two letterboxes, Domestic and Overseas. Letters to be deliveredwithin Australia are placed in the Domestic box and letters intended for overseasdestinations are deposited in the Overseas box. During the month of January therewere 980 Domestic and 310 Overseas letters handled.a Estimate the probability of a particular letter having an Australian destination.b Estimate the probability of a particular letter having an overseas destination.c During February there were 1580 letters posted in total. How many of these would
you expect to have been delivered: i within Australia? ii overseas?
A 24 B 64 C 60 D 36 E 48
A 15 B 90 C 105 D 150 E 125
mmultiple choiceultiple choice
27---
mmultiple choiceultiple choice
WorkS
HEET 10.1

428 M a t h e m a t i c a l M e t h o d U n i t s 1 a n d 2
Calculating probabilitiesMany of the methods arising from a study of probability can be investigated by
using set theory. A review of the basic work on sets is provided on the Maths QuestCD-Rom.
This section describes how to calculate exact theoretical probabilities rather thanuse experimental results to estimate probabilities. We know that the theoreticalprobability of a fair coin coming up Heads is exactly . We must remember that thisdoes not mean that exactly half the tosses of the coin will be Heads, but rather thatthe long-run proportion of Heads will approach as the number of tosses becomesvery large.
If n is the number of trials, then as n → ∞ (→ means ‘approaches’, or ‘gets closer to’):proportion of successes → theoretical probability of a ‘success’
Before describing how to calculate theoretical probability (and avoid the need toperform a large number of trials), we need to discuss the ideas of event space andfavourable outcome in more detail.
Event spaceThe event space (or sample space) consists of all possible outcomes of an experiment.The event space is the universal set and is denoted by ε.
extensioneextensionxtension— Setsand Venn diagrams
12---
12---
A 6-sided die is rolled. List the elements of the event space and state the cardinal number.
THINK WRITE
List the elements of the event space. ε = {1, 2, 3, 4, 5, 6}Count the number of elements in the event space.
n(ε) = 61
2
4WORKEDExample
A coin and a die are tossed.a List the elements of the event space.b List the elements of the event E = ‘Head and a number greater than 4’.
THINK WRITE
a What are the different outcomes using a coin and a die together?
a Let H be Head, T be Tail and H4 mean ‘Head on the coin and a 4 on the die’. Then ε = {H1, H2, H3, H4, H5, H6, T1, T2, T3, T4, T5, T6}.
b List all the possible ways of obtaining event E = ‘Head and a number greater than 4’.
b Event E consists of the 2 sample points.E = {H5, H6}.
5WORKEDExample

C h a p t e r 1 0 I n t r o d u c t o r y p r o b a b i l i t y 429
ProbabilitiesThe game of ‘Zilch’ involves tossing a fair 6-sided die, and scoring points for rolling a6 or a 1.
The events ‘rolling a 6’ and ‘rolling a 1’ are called ‘favourable outcomes’.The total number of (equally likely) outcomes is 6 (a result of 1, 2, 3, 4, 5 or 6 could
be rolled).Intuition may lead us to assert that the probability of scoring by rolling a die in a
game of Zilch is = . More formally, for equally likely outcomes:
probability of a favourable outcome =
or
Pr(favourable outcome) =
So in our Zilch example,
Pr(scoring) =
Pr(scoring) =
= as before.
There are other, equivalent expressions for calculating probability, including
Pr(E) =
Or, using set notation,
where Pr(E) is the probability of event E, n(E) is the cardinal number of event E andn(ε) is the cardinal number of the event space. The above Zilch example may beillustrated as follows, where E = getting a 6 or a 1.
Notice that Pr(E) + Pr(E ′) = +
= 1.In general, if E and E ′ are complementary events,
Pr(E) + Pr(E′) = 1and
Pr(E′) = 1 − Pr(E)
26--- 1
3---
number of favourable outcomestotal number of possible outcomes----------------------------------------------------------------------------------
number of favourable outcomestotal number of possible outcomes----------------------------------------------------------------------------------
number of favourable outcomestotal number of possible outcomes----------------------------------------------------------------------------------
26---
13---
number of favourable outcomes in Etotal number of possible outcomes
-----------------------------------------------------------------------------------------
Pr E( ) n E( )n ε( )------------=
ε E'E1 2 3
546
26--- 4
6---

430 M a t h e m a t i c a l M e t h o d U n i t s 1 a n d 2
Range of probabilitiesIf there is no favourable outcome for event E, then n(E) = 0 and so:
We interpret this to mean that impossible events have a probability of zero.If every outcome in the event space for E is a favourable outcome, then
n(E) = n(ε) and
We interpret this to mean that events certain to happen have a probability of 1. Thusthe range of values for the probability of an event is given by 0 ≤ Pr(E) ≤ 1. Theprobability line below illustrates the range of probabilities and the likelihood of theevent occurring.
A number is randomly chosen from the first 12 positive integers. Find the probability of:a choosing the number 8b choosing any number except 8.
THINK WRITE
a Pr(favourable outcome) = a
There is one favourable outcome (choosing an 8), and 12 possible outcomes.
Pr(8) =
b We require the complementary probability. Pr(E′) = 1 − Pr(E).
b Pr(not 8) = 1 −
=
1
number of favourable outcomestotal number of possible outcomes----------------------------------------------------------------------------------
2112------
112------
1112------
6WORKEDExample
Pr E( ) n E( )n ε( )------------=
0n ε( )----------=
0=
Pr E( ) n E( )n ε( )------------=
n ε( )n ε( )----------=
1.=
Impossible Unlikely Equallylikely
Likely Certain
1–2
1–4
3–40 1

C h a p t e r 1 0 I n t r o d u c t o r y p r o b a b i l i t y 431
Notice that if A is the event ‘even number’ then the complement A′ of A is the event‘odd number’ and
Pr(A) + Pr(A′) = + = 1.
Similarly, if B is the event ‘a number less than 1’ then B′ is the event ‘a number greaterthan or equal to 1’ so that
Pr(B) + Pr(B′) = + = 1
A fair cubic die with faces numbered 1, 3, 4, 6, 8, 10 is rolled. Determine the probability that the number appearing uppermost will be:a even b odd c less than 1 d greater than or equal to 1. THINK WRITEa There are 6 possible outcomes when
rolling the die.a n(ε) = 6
Four of the outcomes correspond to an even number.
Pr(even number) =
=
b Two of the outcomes correspond to an odd number.
Also 1 − = since Pr(odd number) + Pr(even number) = 1
b Pr(odd number) =
=
c None of the outcomes correspond to a number less than 1.
c Pr(number is less than 1) =
= 0
d All 6 outcomes correspond to a number greater than or equal to 1.
d Pr(number is greater than or equal to 1) = = 1
1
246---
23---
23--- 1
3---
26---
13---
06---
66---
WORKEDExample 7
46--- 2
6---
06--- 6
6---
One letter is randomly selected from the letters in the sentence LITTLE MISS MUFFETT. Calculate the probability that the letter is:a a vowel b a consonant other than a T. THINK WRITE
a Pr(favourable outcome) = a
A vowel is a favourable outcome. There are 17 possible outcomes (letters), of which 5 are vowels.
Substitute this information into the probability formula.
Pr(vowel) =
b There are 8 consonants other than T. bUse the probability formula. Pr(consonant other than T) =
1
number of favourable outcomestotal number of possible outcomes----------------------------------------------------------------------------------
2
3517------
1
2817------
8WORKEDExample

432 M a t h e m a t i c a l M e t h o d U n i t s 1 a n d 2
Calculating probabilities
1 A spinner is divided into 4 equal sections as shown at right.For one spin:a List the elements in the event space.b State the cardinal number of the event space.
2 A numberplate is made up of 3 letters followed by 3 numbers.What is the event space for the first position on the numberplate?
3 A card is chosen from a pack of 52 playing cards.a State, in words, the event space.b What is the cardinal number of the event space?
4 A card is chosen from a pack of 52 playing cards and its suit noted, then a coin istossed.a List the elements in the event space.b List the elements in the event S = ‘a spade is chosen’.
5 A coin is tossed twice. List the elements in the event space.
6 A student is chosen at random from a class of 12 girls and 14 boys, then a chocolatebar is chosen from a bag containing a Time Out, a Mars Bar and a Violet Crumble.a List the elements in the event space.b List the elements in the event M = ‘a Mars Bar is chosen’.
7 One player is chosen at random from the senior netball team to be the captain. If thereare 7 players in the team, what is the probability the person who plays Goal Attack is:a chosen?b not chosen?
8 One Year 11 student must be chosen to represent the year level at a staff meeting. Ifall 81 girls’ and 73 boys’ names are put into a container and one name is chosen atrandom, find the probability that:a a Year 11 student is chosenb any particular Year 11 student is chosenc a boy is chosen.
remember1. Pr(favourable outcome) =
2. For event E, Pr(E) =
3. Pr(E) + Pr(E ′) = 1 so Pr(E ′) = 1 − Pr(E)4. If event E is impossible, Pr(E) = 0. If event E is certain to occur, Pr(E) = 1.5. 0 ≤ Pr(E) ≤ 16. Pr(ε) = 1 and Pr(φ) = 0
number of favourable outcomestotal number of possible outcomes----------------------------------------------------------------------------------
n E( )n ε( )------------
remember
10B
Blue
GreenYellow
Red
WORKEDExample
4
WORKEDExample
5
WORKEDExample
6

C h a p t e r 1 0 I n t r o d u c t o r y p r o b a b i l i t y 4339 One card is chosen from a pack of 52
playing cards. What is the probability thatthe card is:a a queen?b a heart?c a picture card (J, Q, K)?d not a picture card?e red or black?
10 Four hundred thousand tickets are sold in araffle. The winner of the raffle will toss thecoin at the AFL grand final. If you bought10 tickets, what is the probability that youwill win?
11 A standard die is rolled. What is theprobability of rolling:a an even number?b a 5?c a number from 2 to 4 inclusive?d a number less than 7?
12 A bag has 20 marbles numbered 1, 2, 3, . . . , 20. One marble is randomly drawn. Findthe probability that the number on the marble is:a evenb greater than 4c a multiple of 4d not even.
13 One letter is randomly selected from the letters of the palindrome: Madam, I’mAdam. Calculate the propability that the letter is:a a vowel b a consonant other than a d.
14 What is the probability of randomly choosing a consonant other than P from theletters of the palindrome: A man, a plan, a canal, Panama?
15 One letter is randomly selected from the words Mathematical Methods. What is theprobability of randomly selecting:a the letter m?b a vowel?c a consonant?d a letter from the first half of the alphabet?
16 A lolly shop has 85 different types of lollies in clear plastic containers. Forty of thelollies contain chocolate. If one container is chosen at random, what is the probabilityit contains:a a lolly containing chocolate?b Smarties?c a biscuit?
WORKEDExample
7
WORKEDExample
8

434 M a t h e m a t i c a l M e t h o d U n i t s 1 a n d 2
Tree diagrams and lattice diagramsTree diagramsA useful way of representing all possible outcomes for sequentialactivities is by means of a tree diagram. A tree diagram consists ofpaths formed from ‘branches’. Each sample point (possible outcome)corresponds to a unique path which is found by following thebranches. For example, a tree diagram could be drawn to show allpossible outcomes when a coin is tossed twice.
The first set of branches shows the possible outcome of the ‘first’ activity, in thiscase tossing the coin the first time.
The second set of branches is then joined onto the endsof the first set to show all outcomes of both tosses of thecoin.
Note that the outcomes are written at the end of eachpath through the tree diagram.
The cardinal number of the sample space is the totalnumber of ‘end’ branches at the end of each path. If alloutcomes are equally likely, the probability can then be
determined as before by using Pr(E) = .
1st coin
H
T
1st coin 2nd coin
H
T
H
T
H
T
HH
HT
TH
TT
Outcome
n E( )n ε( )------------
A card is chosen from a pack of 52 playing cards and its suit noted; then it is returned to the pack before another card is chosen.a Draw a tree diagram showing all possible suit outcomes.b Calculate the probability of choosing
i two hearts ii a diamond then a spade iii a heart and a club. THINK WRITEa Draw a tree diagram as shown.
S — spade
H — heart
D — diamond
C — club
a
b i Use the probability formula with one favourable outcome (heart, heart) of 16 possible.
b i Pr(2 hearts) =
ii Use the probability formula with one favourable outcome (diamond, spade) of 16 possible.
ii Pr(diamond then spade) =
iii Use the probability formula with two favourable outcomes (heart then club or club then heart) of 16 possible.
iii Pr(a heart and a spade) =
=
1st card 2nd card Outcome
S
H
D
C
SSSHDCSHDCSHDCSHDC
SHSDSCHSHHHDHCDSDHDDDCCSCHCDCC
116------
116------
216------
18---
9WORKEDExample

C h a p t e r 1 0 I n t r o d u c t o r y p r o b a b i l i t y 435
Lattice diagramsWhen showing all possible outcomes of 2 activities such as ‘a die is rolled twice’ a treediagram can become very large. An alternative method of showing all possibleoutcomes in this situation is a lattice diagram.
A lattice diagram is a graphical representation, where the axes show the possibleoutcomes of each activity. The ‘coordinates’ or points inside the graph show thepossible outcomes from the combination of both activities, for example a total. Thesecan be written as dots, as totals or by using a symbol for each outcome.
Two letters are selected from the word BIRD.a Draw a tree diagram to illustrate the event space.b What is the probability that the second letter is a vowel or that the first letter is D?
THINK WRITE
a There are 4 letters to choose from as the first letter of the pair of letters.
a
For each letter chosen as the first letter there are 3 letters remaining to choose from.
b There are 4 favourable outcomes (BI, RI, DI and DR) and 12 altogether.
b Pr(second letter is a vowel or first letter is D)
=
=
1 First letter Second letter
BRD
BID
BIR
IRD
I
B
R
D
B IBRBD
IBIRID
RBRIRD
DBDIDR
2
412------
13---
10WORKEDExample
Die 1
Die
2
0
1
2
3
4
5
6
0 1 2 3 4 5 6Die 1
Die
2
0
1
2
3
4
5
6
0 1 2 3 4 5 6
2
3
4
5
6
7
3
4
5
6
7
8
4
5
6
7
8
9
5
6
7
8
9
10
6
7
8
9
10
11
7
8
9
10
11
12
Die
Coi
n
0
H
T
0 1 2 3 4 5 6
MM1&2 fig 10.28c
H1
T1
H2
T2
H3
T3
H4
T4
H5
T5
H6
T6

436 M a t h e m a t i c a l M e t h o d U n i t s 1 a n d 2
A die is rolled twice.a Draw a lattice diagram to show all possible outcomes.b Find the probability of rolling a 2, then a 1.c Find the probability of getting a total of 7.
THINK WRITE
a The possible outcomes from both activities are 1, 2, 3, 4, 5, 6. Put these numbers on each axis.
a
The question asks for the probability of 2 numbers and the probability of a total of 7, so write totals to show the possible outcomes of both events.
b The probability of obtaining a 2 on the first die and a 1 on the second is shown by one outcome only. There are 36 total possible outcomes.
b Pr(2, 1) =
c There are 6 ways of getting a total of 7 from a total of 36 possible outcomes.
c Pr(total = 7) =
=
1
2
Die 1D
ie 2
01
23
45
6
0 1 2 3 4 5 6
2
3
4
56
7
3
4
5
67
8
4
5
6
78
9
5
6
7
89
10
6
7
8
910
11
7
8
9
1011
12
136------
636------
16---
11WORKEDExample
remember1. Outcomes can be illustrated by a tree diagram. The order of activities
determines the structure of the ‘tree’.
2. Pr(favourable outcome) =
3. A lattice diagram can be used to show the possible outcomes when two activities occur. It is particularly useful when dealing with outcomes from the roll of a die.
number of favourable outcomestotal number of possible outcomes----------------------------------------------------------------------------------
remember

C h a p t e r 1 0 I n t r o d u c t o r y p r o b a b i l i t y 437
Tree diagrams and lattice diagrams
1 A psychic powers test kit contains 10 blue, 10 red and 10 green cards, each withoutany markings. In one particular test session, ‘Mental Mal’ selects a card, replaces it,and selects a card again.a Draw a tree diagram showing the possible colour outcomes at each stage. b Calculate the probability of Mal’s choosing:
i two blue cardsii a red, then a green cardiii a green and a red card.
2 A coin is tossed together with a disc that is red on one side and white on its other side.a Show all possible outcomes on a tree diagram.b Calculate the probability that the coin lands Tails and the disc lands red.
3 Two letters from the word CAT are chosen.a Show all possible outcomes on a tree diagram.b Calculate the probability that the letter A is chosen first and the letter T is chosen
second.
4 Two coins are tossed.a Show all possible outcomes on a tree diagram.b Find the probability that one head and one tail turned up.
5 The two spinners shown are spun and the colour on whicheach stops is noted.Find the probability that the spinners land on:a red and greenb yellow and bluec yellow and green.
6
A coin is tossed and a wheel that is coloured blue, white andyellow is spun.The probability of getting Tails and the colour yellow is:
7 A pentagonal solid whose faces are numbered 2, 4, 6, 8, 10 is rolled and a disc that isred on one side and blue on its other side is tossed. Draw a tree diagram and calculatethe probability that a number greater than 4 is rolled and the colour showing upper-most on the disc is red.
8 An integer from 2 to 3 inclusive is chosen from one hat and an integer from 4 to 6inclusive is chosen from another hat.
Draw a tree diagram showing the possible outcomes and determine the probabilityof selecting:a two even numbersb two odd numbersc two even numbers or two odd numbers.
A B C D E
10CWORKEDExample
9
Spinner 2Spinner 1
mmultiple choiceultiple choice
56--- 1
6--- 4
5--- 1
2--- 3
4---
WORKEDExample
10

438 M a t h e m a t i c a l M e t h o d U n i t s 1 a n d 2
9 Peter chooses to wear a jacket andtie from the available jackets andties on his clothes rack which isshown in the photo at right. Use thephoto to draw a tree diagramshowing the possible jacket and tiechoices. Calculate the probability ofchoosing the darker brown jacketwith the red and yellow tie.
10A letter from the word MATHS isselected at random and then asecond letter is chosen from thoseremaining. The probability that twoconsonants are selected is:
11 Each of the smaller triangles formed by the intersection of the diagonals of a square ispainted using either red, green or blue before covering each one with a low-sheen orfull-gloss varnish. If the colour of each triangle is chosen at random, draw a suitabletree diagram and find the probability that the triangle is not coloured red or green andis covered with full-gloss varnish.
12 A coin is tossed three times.a Show all possible outcomes on a tree diagram.b Find the probability of getting Heads, Tails, Tails.c What is the probability of getting at least two Tails?
13 Johnny wishes to try all combinations of a supercone ice-creamwhich has three scoops of different flavours chosen from choco-late, vanilla, strawberry, lime and banana. The middle scoopmust be chocolate.
If Johnny randomly chooses his supercone ice-cream, show allpossible outcomes on a tree diagram.
14 Alan, Bjorn and Carl each toss a coin at the same time. Draw an appropriate tree dia-gram and use it to find the probability that Alan’s and Carl’s result will both be Tails.
15 A consonant is selected from each of the words MATHS IS FUN.a Show the possible outcomes on a tree diagram.b Find the probability that the letters H and S will appear in the selection.
16 Two coins are tossed and a die is rolled. One of the coins is double-headed. Find theprobability that you get:a two Heads and an even numberb Heads then Tails and an odd numberc a Head, a Tail and a number less than 4.
A B C D E
mmultiple choiceultiple choice
45--- 2
5--- 1
5--- 3
5--- 1
2---
��
Chocolate

C h a p t e r 1 0 I n t r o d u c t o r y p r o b a b i l i t y 43917 Find the probability of obtaining an odd number and at least one Tail when a die and
two coins are tossed.
18Three coins are tossed once. The probability that at least one coin shows Heads is:
19 Four coins are tossed.a Show all possible outcomes on a tree diagram.b Find the probability of obtaining Head, Tail, Head, Tail in that order.c Find the probability of getting two Heads and two Tails.d Find the probability of obtaining at least two consecutive Tails.
20 a Draw a lattice diagram to show all possible outcomes when two dice are rolled.b Use your lattice diagram to find the probability that both the numbers appearing
uppermost are odd numbers.c Find the probability of getting a total of 9.
21 A die is rolled and a coin is tossed.a Draw a lattice diagram to show all possible outcomes.b Find the probability of obtaining a 3 and a Tail.c Find the probability of obtaining an even number and a Head.
22 Two dice are rolled. Find the prob-ability:a of obtaining two 6s, the result
shownb of rolling a 3 and a 4c that the sum of the numbers
appearing uppermost is lessthan 10
d that the first number is a 3and the sum of the numbersappearing uppermost is lessthan 8
e of rolling two multiples of 2.
23 A die labelled with the letters T, O, M, A, T, Oand a die numbered 3, 4, 5, 6, 7, 8 are rolled together.Determine the probability that the first die shows a vowel and the second die shows anumber greater than 6.
24 A diner orders an entree, main course and dessert from a lunch menu that offers 3different entrees, 2 main courses and 2 desserts. Show these choices on a tree diagramand find the probability that the diner orders a particular entree and main course.
A B C D E
mmultiple choiceultiple choice
34--- 3
8--- 2
3--- 7
8--- 1
4---
WORKEDExample
11

440 M a t h e m a t i c a l M e t h o d U n i t s 1 a n d 2
The Addition Law of probabilitiesRecall from our review on set theory that
n(A ∪ B) = n(A) + n(B) − n(A ∩ B) [1]We also know that:
Pr(A ∪ B) = [2]
Substituting [1] into [2], we get:
So, Pr(A ∪ B) = Pr(A) + Pr(B) − Pr(A ∩ B).Since we may equate ∪ with OR, and ∩ with AND, we can say:
Pr(A or B) = Pr(A) + Pr(B) − Pr(A and B)This is known as the Addition Law of probability.
Mutually exclusive eventsIf A ∩ B = φ then A, B are mutually exclusive. That is, events A and B cannot happen atthe same time. If A and B are mutually exclusive then Pr(A ∩ B) = 0, so the AdditionLaw becomes:
Pr(A ∪ B) = Pr(A) + Pr(B)or
Pr(A or B) = Pr(A) + Pr(B)
n A B∪( )n ε( )
-----------------------
Pr A B∪( ) n A( ) n B( ) n A B∩( )–+n ε( )
-----------------------------------------------------------=
n A( )n ε( )------------ n B( )
n ε( )----------- n A B∩( )
n ε( )-----------------------–+=
If A and B are events such that Pr(A) = 0.8, Pr(B) = 0.2 and Pr(A ∩ B) = 0.1, calculatePr(A ∪ B).THINK WRITE
Substitute the values for Pr(A), Pr(B) and Pr(A ∩ B) in the Addition Law to find Pr(A ∪ B).
Pr(A ∪ B) = Pr(A) + Pr(B) − Pr(A ∩ B)Pr(A) = 0.8, Pr(B) = 0.2, Pr(A ∩ B) = 0.1Pr(A ∪ B) = 0.8 + 0.2 − 0.1Pr(A ∪ B) = 0.9
12WORKEDExample
If A and B are events such that Pr(A ∪ B) = 0.55, Pr(A) = 0.2 and Pr(B) = 0.45, calculatePr(A ∩ B).THINK WRITE
Substitute the values for Pr(A ∪ B), Pr(A), Pr(B).
Pr(A ∪ B) = Pr(A) + Pr(B) − Pr(A ∩ B)0.55 = 0.2 + 0.45 − Pr(A ∩ B)
Rearrange the expression to findPr(A ∩ B).
0.55 = 0.65 − Pr(A ∩ B)Pr(A ∩ B) = 0.1
1
2
13WORKEDExample

C h a p t e r 1 0 I n t r o d u c t o r y p r o b a b i l i t y 441
Note: The Addition Law could also be used to determine any one of Pr(A ∪ B), Pr(A), Pr(B), Pr(A ∩ B) when the other 3 quantities are known.For example, to find Pr(A ∪ B) we have:
Pr(A ∪ B) = Pr(A) + Pr(B) − Pr(A ∩ B)
= + −
=
If Pr(A ∩ B) = 0.2 and Pr(A ∪ B) = 0.9 calculate Pr(A) and Pr(B) if events A and B are equally likely to occur.
THINK WRITE
Use the Addition Law. Pr(A ∪ B) = Pr(A) + Pr(B) − Pr(A ∩ B)If events A and B are equally likely to occur then Pr(A) = Pr(B).
Let x represent Pr(A) and hence Pr(B).
Substitute the information into the Addition Law and solve.
0.9 = x + x − 0.20.9 = 2x − 0.21.1 = 2x
so x = 0.55Pr(A) = 0.55, Pr(B) = 0.55
12
3
14WORKEDExample
A box contains 16 marbles numbered 1, 2, 3, . . . , 16. One marble is randomly selected.Let A be the event ‘the marble selected is a prime number greater than 3’ and let B be the event ‘the marble selected is an odd number’.a Evaluate: i Pr(A) ii Pr(B) iii Pr(A ∩ B) iv Pr(A ∪ B).b Are A and B mutually exclusive events?
THINK WRITE
a Write down the elements of A, B, A ∩ B and A ∪ B.
a A = {5, 7, 11, 13}, B = {1, 3, 5, 7, 9, 11, 13,15}, A ∩ B = {5, 7, 11, 13}, A ∪ B = {1, 3, 5, 7, 9, 11, 13, 15}
What is n(ε)? n(ε) = 16
Calculate the probability of A, B,A ∩ B and A ∪ B.
i Pr(A) = ii Pr(B) =
= =
iii Pr(A ∩ B) = iv Pr(A ∪ B) =
= =
b Check to see if A ∩ B = φ [or Pr(A ∩ B) = 0].
Since Pr(A ∩ B) ≠ 0, it follows that A and B are not mutually exclusive.
b Pr(A ∪ B) = Pr(A) + Pr(B) − Pr(A ∩ B)
= + − Pr(A ∩ B)
so Pr(A ∩ B) = A and B are not mutually exclusive.
1
2
3416------ 8
16------
14--- 1
2---
416------ 8
16------
14--- 1
2---
1
2
12--- 1
4--- 1
2---
14---
15WORKEDExample
416------ 8
16------ 4
16------
12---

442 M a t h e m a t i c a l M e t h o d U n i t s 1 a n d 2
The Venn diagram below left may be adapted to show probabilities rather than out-comes and used to solve problems (below right).
ε
A B
(A ∪ B)'
A ∩ BA ∩ B' A' ∩ B
ε
A B
Pr(A ∪ B)'
Pr(A ∩ B)Pr(A ∩ B)' Pr(A' ∩B)
An 8-sided die is rolled once. Find the probability that the number appearing uppermost is:a an even number b an even number or a multiple of 3. THINK WRITE
a Let E = even number = {2, 4, 6, 8} and M = multiple of 3 = {3, 6}.The probability of getting an even
number = .
a Pr(E) =
n(E) = 4, n(ε) = 8 Pr(E) =
=
b The probability of an even number or a multiple of 3 = Pr(E ∪ M).
b Pr(E ∪ M) = Pr(E) + Pr(M) − Pr(E ∩ M)
Pr(E) = , Pr(M) = = ,
E ∩ M = {6} so Pr(E ∩ M) = .
Pr(E ∪ M) = + −
=
1
n E( )n ε( )------------
n E( )n ε( )------------
248---
12---
1
212--- 2
6--- 1
3---
18---
12--- 1
3--- 1
8---
1724------
16WORKEDExample
If Pr(A) = 0.6, Pr(B) = 0.45 and Pr(A ∪ B) = 0.7, show this information on a Venn diagram and calculate Pr(A ∪ B)′.THINK WRITE
Draw a ‘2 set Venn diagram’ with overlapping region.Calculate the probability of the overlap, Pr(A ∩ B) using the Addition Law.
Pr(A ∪ B) = Pr(A) + Pr(B) − Pr(A ∩ B)0.7 = 0.6 + 0.45 − Pr(A ∩ B)
Pr(A ∩ B) = 1.05 − 0.7= 0.35
Complete the Venn diagram using the available information.
Calculate Pr(A ∪ B)′. Pr(A ∪ B) + Pr(A ∪ B)′ = 1Pr(A ∪ B)′ = 1 − Pr(A ∪ B)
= 1 − 0.7= 0.3
1
2
3 εA B
(A ∪ B)'
0.25 0.35 0.1
4
17WORKEDExample

C h a p t e r 1 0 I n t r o d u c t o r y p r o b a b i l i t y 443
The Addition Law of probabilities
1 If Pr(A) = 0.4, Pr(B) = 0.5 and Pr(A ∩ B) = 0.2, what is Pr(A ∪ B)?
2 If Pr(A) = 0.75, Pr(B) = 0.13 and Pr(A ∩ B) = 0.22, what is Pr(A ∪ B)?
3 If A and B are mutually exclusive events and Pr(A) = 0.38, Pr(B) = 0.51, what isPr(A ∪ B)?
4 If A and B are events such that Pr(A) = 0.15, Pr(B) = 0.6 and Pr(A ∪ B) = 0.5, calcu-late Pr(A ∩ B).
5 For events X, Y, if Pr(Y) = 0.44, Pr(X ∪ Y) = 0.16 and Pr(X ∩ Y) = 0.73, what isPr(X)?
6 For events D, E, if Pr(D) = 0.86, Pr(D ∪ E) = 0.72 and Pr(D ∩ E) = 0.59, what isPr(E)?
7 If Pr(A) = 2 × Pr(B), Pr(A ∩ B) = 0.23 and Pr(A ∪ B) = 0.94, determine the values ofPr(A) and Pr(B).
8 If Pr(A ∪ B) = 0.75, Pr(A) = 0.28 and Pr(B) = 0.47, what can be concluded about therelationship between A and B?
9 If Pr(A ∩ B) = Pr(A), what is the relationship between A and B?
10 A card is chosen at random from a pack of 52 playing cards. Let H be the event‘choosing a heart’ and P be the event ‘choosing a picture card’.a Evaluate:
i Pr(H)ii Pr(P)iii Pr(H ∩ P)iv Pr(H ∪ P).
b Are H and P mutually exclusive events?
11 A box of chocolates contains 12 with hard centres and 8 with soft centres. One choco-late is chosen at random. Let H be the event ‘choosing a hard centre’ and S be theevent ‘choosing a soft centre’.a Evaluate:
i Pr(H)ii Pr(S)iii Pr(H ∩ S)iv Pr(H ∪ S).
b Are H and S mutually exclusive events?
remember1. For events A, B, Pr(A ∪ B) = Pr(A) + Pr(B) − Pr(A ∩ B).2. ‘or’ = ∪, ‘and’ = ∩3. Two events are mutually exclusive if they cannot occur at the same time.4. If A ∩ B = φ then A, B are mutually exclusive and Pr(A ∩ B) = 0.
remember
10DWORKEDExample
12
WORKEDExample
13
WORKEDExample
14
WORKEDExample
15

444 M a t h e m a t i c a l M e t h o d U n i t s 1 a n d 2
12 From a group of 100 people 25 said they drink tea, 40 drink coffee and 15 stated theydrink both beverages. If one member of the group is randomly chosen what is theprobability that the person:a drinks only tea?b drinks neither tea nor coffee?c drinks tea and coffee?d drinks tea or coffee?
13 A box contains 20 marbles numbered 1 to 20. Find the probability of obtaining:a an even numberb a multiple of 3c a multiple of 2 or 3.
14 Find the probability of an odd number or a multiple of 4 appearing uppermost when adie is rolled.
15 Find the probability that a number divisible by 4 or 5 is drawn from a ‘lucky dip’containing the first 50 natural numbers.
16 From a standard pack of 52 playing cards one card is randomly drawn. State theprobability that the card is a:a tenb diamondc king or a jackd diamond, a spade or the ace of hearts.
17 A mixed bag of lollies contains 8 peppermint twists, 10 red jelly beans, 10 caramels,18 chocolates, 4 peppermint twirls, 5 yellow jelly beans and 25 toffees. If Tararandomly selects one lolly, what is the probability that it is:a a peppermint or a jelly bean?b not a toffee, a caramel or a jelly bean?c a peppermint, given that the jelly beans are stuck together and cannot be selected?
18 Sarah is competing in a 400-metre race against 13 other runners. If each contestanthas the same probability of winning, find the probability that Sarah:a wins the raceb comes first or secondc comes at least fourthd does not qualify for the final 5.
19 A moneybox containing eight $1 coins, five $2 coins, nine 50c coins and two 20ccoins is shaken and one coin falls out. Assuming that each coin is equally likely to fallout, calculate the probability that the coin’s value is:a between 10c and $2b not 50cc $1 or $2d less than $1.
20 Inside a dresser drawer are 4 ties, 10 socks, 4 handkerchiefs and 2 towels. If Tony ran-domly takes out one item, find the probability that it is:a something to be wornb not a towel and not a sockc either a sock or not a sockd either a towel or not a handkerchief.
WORKEDExample
16

C h a p t e r 1 0 I n t r o d u c t o r y p r o b a b i l i t y 44521 A patron in a restaurant is presented with a fruit platter consisting of 6 whole apples,
8 slices of orange, 5 sliced pear pieces, 11 whole strawberries, 6 whole plums and 4sliced apricot halves. The waiter accidentally trips and a piece of fruit falls off theplatter. Assuming that each piece of fruit was equally likely to fall, state theprobability that the fallen fruit is:a not a plum and not an apricotb not slicedc sliced or is not a strawberryd either a pear or an orange and has not been sliced.
22 The games Alotto, Blotto and Clotto involve guessing a number from 1 to 100inclusive. To win Alotto the number guessed must be a multiple of 3. To win Blottothe number must be a multiple of 5 or a multiple of 8. To win Clotto the guessednumber is to be between 10 and 20 or greater than 77.
Decide which game is easier to win.
23 If Pr(A) = 0.3, Pr(B) = 0.4 and Pr(A ∪ B) = 0.65, show this information on a Venndiagram and find Pr(A′ ∪ B).
24 Of 20 people interviewed, 7 stated that they use both a tram and a train to get to workand 2 said they drive their own car. No other form of transport or combination oftransport is used. If 5 people travel only by train, find the probability that a personselected at random travels by tram only.
25 A dartboard consists of 10 concentric circles, with 1024 points given for a dartlanding within the first (smallest) circle, 512 points for a hit within the area boundedby the first and second circle, 256 points if the dart lands within the area bounded bythe second and third circles, and so on. The area bounded by any two consecutivecircles is the same.
a Find the probability that a dart randomly hitting the board will score:i 64ii a multiple of 128iii a number from 16 to 256 inclusiveiv a number from 17 to 1023 inclusive or a number less than 256.
b Why is it necessary to state that the areas bound by any two consecutive circles arethe same?
WORKEDExample
17
Area 11024 points
Area 2512 points
Area 3256 points
Area 4128 points
WorkS
HEET 10.2

446 M a t h e m a t i c a l M e t h o d U n i t s 1 a n d 2
Karnaugh Maps and probability tablesWe have seen how Venn diagrams provide a visualrepresentation of sets and probabilities. Another effectiveapproach is to display the information by means of aKarnaugh Map. Consider a Venn diagram for two sets A and B.
Notice that the Venn diagram consists of 4 mutually exclu-sive regions, A ∩ B′, A ∩ B, A′ ∩ B and A′ ∩ B′. These 4 subsets of ε can be presentedas a Karnaugh Map.
Comparing the table entries with the Venn diagram provides equality relationshipsacross rows and down columns. That is, in terms of regions we can see that for column1, (A ∩ B) ∪ (A′ ∩ B) = B and for column 2, (A ∩ B′) ∪ (A′ ∩ B′) = B′.
Similarly, for row 2, (A ∩ B) ∪ (A ∩ B′) = A and for row 3, (A′ ∩ B) ∪ (A′ ∩ B′) = A′.The third row and column can be used to check the sum totals of each row and column.This type of verification can be useful in practical problems.
The probability tableWe can present a Karnaugh Map in terms of the probability of each of the 4 subsetsA ∩ B′, A ∩ B, A′ ∩ B and A′ ∩ B′ of ε.
Note the value of 1 at the bottom right of the table. This is the sum of theprobabilities across the last row and the sum of the probabilities down the last column.
That is, Pr(B) + Pr(B′) = 1 and Pr(A) + Pr(A′) = 1.Notice that unknown quantities can be calculated sequentially but the order often
depends on the information and personal preference.Consider the following example. A survey of 1000 taxi drivers revealed that 450 of
them drive a Falcon and 500 drive a Commodore. It was also found that 350 taxidrivers have occasion to use both types of car. This information can be represented as aVenn diagram, Karnaugh map or probability table.
Venn diagram Karnaugh Map Probability table
Column 1 Column 2 Column 3
B B′Row 1 A A∩B A∩B′Row 2 A′ A′∩B A′∩B′Row 3
B B′A Pr(A∩B) Pr(A∩B′) Pr(A)
A′ Pr(A′∩B) Pr(A′∩B′) Pr(A′)Pr(B) Pr(B′) 1
εA B
A ∩ B' A ∩ B A' ∩ B
εF C
150350100
400
C C ′Row 1 F 350 100 450
Row 2 F ′ 150 400 550
Row 3 500 500 1000
C C ′F 0.35 0.1 0.45F ′ 0.15 0.4 0.55
0.5 0.5 1.0

C h a p t e r 1 0 I n t r o d u c t o r y p r o b a b i l i t y 447The Karnaugh Map provides a wealth of information, including:1. 350 drivers drive both a Falcon and a Commodore (row 1, column 1: F ∩ C)2. 100 drivers drive only a Falcon (row 1, column 2: F ∩ C ′)3. the total number of Falcon drivers is 450 (350 + 100)4. 150 drivers drive only a Commodore (row 2, column 1: F ′ ∩ C)5. 400 drivers do not drive either a Falcon or a Commodore (row 2, column 2: F ′ ∩ C ′)6. there are 500 Commodore drivers altogether (350 + 150)7. there are 1000 drivers in total (row 3, column 3).
Complete the Karnaugh Map shown below and represent the information as a Venn diagram.
THINK WRITE
Find the value for row 2, column 3 and for row 3, column 2.
Find the value for row 2, column 1 and for row 1, column 2.
Find the value for row 1, column 1.
Represent the information as a Venn diagram.
Column 1 Column 2 Column 3
B B′
Row 1 A 0.3
Row 2 A′ 0.25
Row 3 0.65 1
1B B′
A 0.3
A′ 0.25 0.7
0.65 0.35 1
2B B′
A 0.1 0.3
A′ 0.45 0.25 0.7
0.65 0.35 1
3B B′
A 0.2 0.1 0.3
A′ 0.45 0.25 0.7
0.65 0.35 1
4 εA B
0.450.20.1
0.25
18WORKEDExample

448 M a t h e m a t i c a l M e t h o d U n i t s 1 a n d 2
Complete a Karnaugh Map, given that Pr(A′ ∩ B) = 0.24, Pr(A) = 0.32 and Pr(B) = 0.35.THINK WRITE
Place the known information in the appropriate cells of the Karnaugh Map.
Build up the table using the given information, and the fact that the probability totals 1.
1 B B′A 0.32A′ 0.24
0.35 1
2
B B′A 0.11 0.32A′ 0.24 0.68
0.35 0.63 1
B B′A 0.11 0.21 0.32A′ 0.24 0.42 0.68
0.35 0.63 1
19WORKEDExample
A group was surveyed in relation to their drinking of tea and coffee. From the results it was established that if a member of the group is randomly chosen then the probability that that member drinks tea is 0.5, drinks coffee is 0.6, and drinks neither tea nor coffee is 0.1.a Use the information to complete a Karnaugh Map.b Calculate the probability that a randomly selected person of the group:
i drinks tea but not coffeeii drinks tea and coffee.
THINK WRITEa Let T and C be the set of people who
drink tea and coffee respectively. Place the given information in the table.
a
Build up the table as shown.
b Use the appropriate probability from the table.
b i Pr(T ∪ C′) = 0.3ii Pr(T ∪ C) = 0.2
1 C C ′T 0.5T ′ 0.1
0.6 1
2
C C′T 0.5
T ′ 0.1 0.5
0.6 0.4 1
20WORKEDExample
C C′T 0.3 0.5
T′ 0.4 0.1 0.5
0.6 0.4 1
C C′T 0.2 0.3 0.5
T′ 0.4 0.1 0.5
0.6 0.4 1

C h a p t e r 1 0 I n t r o d u c t o r y p r o b a b i l i t y 449
Karnaugh Maps and probability tables
1 Complete each Karnaugh Map and represent the information as a Venn diagram.
a b
c d
2
Decide which of the follow-ing statements is true.
3 Complete a Karnaugh Map given that n(A ∩ B) = 87, n(A′ ∩ B) = 13, n(A ∩ B′) = 63and n(ε) = 218.
4 Complete a Karnaugh Map given that n(A ∩ B) = 35, n(A ∩ B′) = 29, n(A′ ∩ B′) = 44and n(A′ ∩ B) = 56.
5 Draw a Karnaugh Map representing each Venn diagram.
a b c d
A U = 0.15 B V + W = 0.42 C X + Y = 0.55D V − X = W − 0.58 E U + Z = W − Z
remember1. Karnaugh Maps and probability tables summarise all
combinations of two events (for example A and B) and their complements (for example A′ and B′).
2. Use known values, subtotals and the fact that the sum of the probabilities in the outer row and column is equal to 1 to fill in any missing values.
AA'
B'B
1
remember
10EWORKEDExample
18 B B′A 17 25
A′ 13
15
B B′A 33
A′ 27 72
114
B B′A 0.3 0.57
A′ 0.4
B B′A 0.03
A′ 0.22 0.36
B B′A 0.31 Y 0.75
A′ X U Z
V 0.58 W
mmultiple choiceultiple choice
εA B
0.3
0.11
0.450.14
εA B
0.120.610.27
εA B
4610
εA B
18
5
715

450 M a t h e m a t i c a l M e t h o d U n i t s 1 a n d 2
6 Determine the probability values and complete a Karnaugh Map using the given infor-mation.a ε = {letters of the alphabet from a to k}, A = {a, b, c, d, e, f, g}, B = {e, f, g, h}b ε = {first 20 natural numbers}, A = {natural numbers less than 11}, B = {natural
numbers from 8 to 15 inclusive}
7
If A = {2, 7, 8, 10}, B = {3, 5, 7, 9, 10} and ε = {1, 2, . . ., 10}, then row 1, column 2of the probability table will contain the set:
8 A survey of students revealed that 30 of them like football, 26 like soccer, 6 like bothsports and 10 prefer a sport other than football or soccer. Represent this informationas a:a Venn diagramb Karnaugh Map.
9 Complete a probability table for the information in question 8.
10
Of a group of 200 people, 48% drink coffee (C) each day and 39% drink tea (T). If38% of the people do not drink tea or coffee, the probability table is:
11 Complete a Karnaugh Map, given:a Pr(A ∩ B) = 0.3, Pr(A′ ∩ B′) = 0.2 and Pr(A) = 0.6b Pr(B ∩ A′) = 0.7, Pr(B) = 0.8 and Pr(B′ ∩ A) = 0.1c Pr(A ∩ B) = 0.5, Pr(A′ ∩ B′) = 0.1 and Pr(B′) = 0.4d Pr(A′ ∩ B) = , Pr(A ∩ B′) = and Pr(B′) = .
12 Two hundred and eighty children were asked to indicate their preference for ice-creamflavours. It was found that 160 of the children like chocolate flavour, 145 like straw-berry and 50 like both flavours. Use this information to complete a Karnaugh Map.
A {3, 5, 7} B {1, 4} C {2, 6, 9} D {6, 7, 10} E {2, 8}
A B
C D
E
mmultiple choiceultiple choice
mmultiple choiceultiple choice
T T′C 0.25 0.23
C′ 0.14 0.38
T T′C 0.23 0.14
C′ 0.38 0.25
T T′C 0.25 0.35
C′ 0.48 0.38
T T′C 0.39 0.38
C′ 0.48 0.23
T T′C 0.25 0.23
C′ 0.14 0.38
WORKEDExample
19
14--- 1
4--- 3
4---

C h a p t e r 1 0 I n t r o d u c t o r y p r o b a b i l i t y 45113 An examination of 250 people showed that of those in the group who are less than or
equal to 20 years of age, 80 wear glasses and 55 do not. Also, 110 people over 20years of age must wear spectacles.a Represent the information as a Karnaugh Map.b Calculate the probability that a randomly selected person of the group:
i does not wear glasses and is over 20 years of ageii is less than 20 years of age.
14 For the probability table shown, A isthe event ‘no more than 15 years ofage’ and B is the event ‘smoker’.a Complete the probability table.b What is the probability that:
i a person older than 15 years ofage does not smoke?
ii a person is a smoker and is older than 15 years of age?iii the person is a smoker over the age of 15 or is a non-smoker less than or equal
to 15 years of age?
15 A survey of a group of busi-ness people indicates that42% of those surveyed readthe Daily Times newspaperonly each day and 18% readboth the Daily Times and theBugle. Additionally, 12% ofthose questioned stated thatthey do not read either ofthese newspapers.a Show this information
as a Karnaugh Map.b What is the probability
that a randomly selectedmember of the group:
i does not read theDaily Times?
ii reads the Bugle only?iii does not read the
Bugle or does not readeither newspaper?
c If the group consists of 150 businesspeople, determine how many members read atleast one newspaper.
16 A lucky dip box contains 80 marble tokens which are exchanged for prizes. Some ofthe marbles have a red stripe, some have a blue stripe, some have both a red and ablue stripe and some marbles have no stripes at all. It is known that 25% of themarbles have a red stripe on them, 20% of them have a blue stripe and 65% have nostripe.a Present the information as a Karnaugh Map.b What is the probability of choosing a marble that has a red stripe only?c Find the probability of choosing a marble that has a red and a blue stripe or no stripe.
WORKEDExample
20
Figure 65
B B′A 0.08
A′ 0.6
0.67

452 M a t h e m a t i c a l M e t h o d U n i t s 1 a n d 2
Conditional probabilityErin thinks of a number from 1 to 10 (say 8) and asks Peter to guess what it is. Theprobability that Peter makes a correct guess on his first try is . If, however, Erin firsttells Peter that the number is greater than 7, his chances are better because he nowknows that the number must be one of the numbers 8, 9 or 10. His probability ofsuccess is now .
This problem may be stated as: What is the probability of Peter choosing the rightnumber from 1 to 10 if the fact is given that the number is greater than 7?
This is an example of conditional probability, where the probability of an event isconditional (depends) on another event occurring first. The effect in this case is toreduce the event space and thus increase the probability of the desired outcome.
For two events A and B the conditional probability of event B given that event Aoccurs is denoted by Pr(B | A) and is given by:
, Pr(A) ≠ 0
Event A is sometimes called the reduced event space.For the example above, if we let A be the event ‘numbers greater than 7’ and B be the
event ‘Erin’s secret number’ then we may write
The reduced event space can be illustrated by the Venn diagram below.
110------
13---
Pr B A( ) Pr A B∩( )Pr A( )
-------------------------=
Pr B A( ) Pr A B∩( )Pr A( )
-------------------------=
110------
310----------=
13---=
εB
A
8 9 10
1234
567
If Pr(A ∩ B) = 0.8 and Pr(A) = 0.9, find Pr(B | A).
THINK WRITE
Substitute the values given into the expression for conditional probability.
Pr B A( ) Pr A B∩( )Pr A( )
-------------------------=
0.80.9-------=
89---=
21WORKEDExample

C h a p t e r 1 0 I n t r o d u c t o r y p r o b a b i l i t y 453
If Pr(A) = 0.3, Pr(B) = 0.5 and Pr(A ∪ B) = 0.6 calculate:a Pr(A ∩ B) b Pr(B | A).THINK WRITEa Use the Addition Law for probabilities
to find Pr(A ∩ B).a Pr(A ∪ B) = Pr(A) + Pr(B) − Pr(A ∩ B)
0.6 = 0.3 + 0.5 − Pr(A ∩ B)so Pr(A ∩ B) = 0.2
b Use the formula for conditional probability to find Pr(B | A).
b Pr(B | A) =
=
=
Pr A B∩( )Pr A( )
-------------------------
0.20.3-------
23---
22WORKEDExample
Of a group of 50 Year 11 students, 32 study Art and 30 study Graphics. Each student studies at least one of these subjects.a How many students study both?b Illustrate the information as a Venn diagram.c What is the probability that a randomly selected student studies Art only?d Find the probability that a student selected at random from the group studies
Graphics, given that the student studies Art. THINK WRITEa Define relevant events and a
pronumeral to represent the number who study both.
a Let A = students who study ArtG = students who study Graphicsx = number who study both
Find the number who study both subjects using set theory.
n(A ∪ G) = n(A) + n(G) − n(A ∩ G)50 = 32 + 30 − x50 = 62 − x
x = 12b Show all information on a Venn
diagram.b
c The Venn diagram reveals that 20 of the 50 students study Art only. Calculate the probability.
c Pr(Art only) =
=
d Use the conditional probability formula to find the probability that a student studies Graphics, given that the student studies Art.
d Pr(G | A) =
=
=
=
1
2
εArt Graphics
20 12 18
2050------
25---
Pr G ∩ A( )Pr A( )
---------------------------
1250------
3250----------
1232------
38---
23WORKEDExample

454 M a t h e m a t i c a l M e t h o d U n i t s 1 a n d 2
Seated in a Ford Falcon are 4 males and 2 females. Seated in a Holden Commodore are 2 males and 1 female. One of the cars is randomly stopped by the police and one person from the vehicle is randomly ‘selected’.
Draw a tree diagram to illustrate the situation and calculate the probability that:
a the person selected by the police is female
b if a female is selected by the police, she was sitting in the Ford.
THINK WRITE
a Calculate the probabilities.
a Pr(Ford) =
Pr(male from Ford) =
=
Pr(female from Ford) =
=
Draw the tree diagram.
Use the tree diagram to work out the probability that the person is female.Consider all ways a female may be ‘selected’.
Pr(female) = Pr(Ford and female or Holden and female)= Pr(Ford and female) + Pr(Holden and female)
= × + ×
=
b Use the tree diagram and the formula for conditional probability.
b Pr(person is from the Ford | she is female)
=
=
=
112---
46---
23---
26---
13---
2
male Ford, male
female Ford, female
male Holden, male
female Holden, female
Holden
Ford
Car Person
1–2
1–2
2–3
1–3
2–3
1–3
3
12--- 1
3--- 1
2--- 1
3---
13---
Pr(Ford and female)Pr(female)
------------------------------------------------
12--- 1
3---×
13---
----------
12---
24WORKEDExample
Pr(Holden) =
Pr(male from Holden) =
Pr(female from Holden) =
12---
23---
13---

C h a p t e r 1 0 I n t r o d u c t o r y p r o b a b i l i t y 455
Conditional probability
1 If Pr(A) = 0.8, Pr(B) = 0.5 and Pr(A ∩ B) = 0.4 find:
2 If Pr(A) = 0.65, Pr(B) = 0.75 and Pr(A ∩ B) = 0.45 find:
3 If Pr(A ∩ B) = 0.4 and Pr(A) = 0.5 find Pr(B | A).
4 If Pr(A ∩ B) = 0.25 and Pr(B) = 0.6 find Pr(A | B).
5 If Pr(B | A) = 0.32 and Pr(A) = 0.45 find Pr(A ∩ B).
6 If Pr(A | B) = 0.21 and Pr(B) = 0.8 what is Pr(A ∩ B)?
7 Calculate Pr(A) if Pr(B | A) = 0.75 and Pr(A ∩ B) = 0.5.
8 Calculate Pr(B) if Pr(A | B) = 0.96 and Pr(A ∩ B) = 0.8.
9 If Pr(A) = 0.7, Pr(B) = 0.5 and Pr(A ∪ B) = 0.9 calculate:
10If Pr(B | A) = 0.8 and Pr(A ∩ B) = 0.6 then Pr(A) is:
11If Pr(A) = 0.9 and 2 × Pr(A ∩ B) = Pr(A) then Pr(B | A) is:
12 Show that if Pr(A ∩ B) = Pr(A) × Pr(B) then Pr(B | A) = Pr(B).
13 If Pr(A) = 0.23, Pr(B) = 0.27 and Pr(A ∪ B) = 0.3 find:
14 If Pr(A) = 0.45, Pr(B) = 0.52 and Pr(A ∪ B) = 0.67 find:a Pr(A ∩ B)b Pr(B | A)c Represent the information as a Venn diagram.
15 A box contains marbles numbered 1, 2, 3, . . . , 50. One marble is randomly taken outof the box. What is the probability that it is:a a multiple of 3, given that it is less than 21?b between 11 to 39 inclusive, given that it is greater than 20?
a Pr(B | A) b Pr(A | B).
a Pr(B | A) b Pr(A | B).
a Pr(A ∩ B) b Pr(B | A).
A B C D E
A B C D E
a Pr(A ∩ B) b Pr(A | B).
remember1. For two events A and B, the conditional probability of event B, given that
event A occurs, is Pr(B | A) = , Pr(A) ≠ 0 where A is the reduced
event space.2. Venn diagrams, tree diagrams and Karnaugh Maps are useful aids in
conditional probability problems.
Pr A B∩( )Pr A( )
-------------------------
remember
10FWORKEDExample
21 SkillSH
EET 10.1
WORKEDExample
22mmultiple choiceultiple choice
45--- 3
5--- 1
4--- 3
4--- 2
3---
mmultiple choiceultiple choice
12--- 5
9--- 2
5--- 1
9--- 4
9---

456 M a t h e m a t i c a l M e t h o d U n i t s 1 a n d 2
16A group of 80 females consists of 54 dancers and 35 singers. Each member of thegroup is either a dancer or a singer or both. The probability that a randomly selectedmember of the group is a singer given that she is a dancer is:
17 A group of 60 adventurerscomprises 30 mountainclimbers and 45 scuba divers.If each adventurer does atleast one of these activities:a How many adventurers are
both climbers and divers?b Illustrate the information
on a Venn diagram.c What is the probability
that a randomly selectedgroup member is a scubadiver only?
d Find the probability thatan adventurer randomlyselected from the group is a scuba diver, given that the adventurer is a mountainclimber.
18 Of 200 families surveyed, 85% have a TV and 70% possess a CD player. Assumingeach family has at least one of these items, what is the probability that one familyrandomly selected has a TV given that they also own a CD player?
19 During the Christmas holidays 42 students from a group of 85 VCE students foundvacation employment while 73 students went away on holidays. Assuming that everystudent had at least a job or went on a holiday, what is the probability that a randomlyselected student worked throughout the holidays (that is, did not go away on holi-days), given that he/she had a job?
20 The probability that a machine in a chocolate factory does not coat a SNAP chocolatebar adequately, therefore producing a defective product, is 0.08. The probability that itdoes not coat a BUZZ chocolate bar adequately is 0.11. On any day the machine coats250 SNAP bars and 500 BUZZ bars. A chocolate bar is chosen at random from theproduction line. Draw a tree diagram to illustrate the situation and find the probabilitythat a chocolate bar chosen at random is:a a BUZZ chocolate barb a SNAP chocolate bar and it is defectivec defective, given that a SNAP bar is chosen.
21 The staff at Happy Secondary College is made up of 43 females and 29 males. Also,22% of the females are under 40 years old while 19% of the males are under 40. If astaff member is selected at random what is the probability that:a a male is selected?b a male 40 years or over is selected?c a female under the age of 40 is selected?d it is a female given that the person selected is under 40 years of age?
22 Two letters are randomly picked from the word INFINITESSIMAL. If a letter can beused more than once, calculate the probability that both letters selected are vowelsgiven that the first letter is a vowel.
A 0.17 B 0.44 C 0.68 D 0.11 E 0.78
mmultiple choiceultiple choice
WORKEDExample
23
WORKEDExample
24

C h a p t e r 1 0 I n t r o d u c t o r y p r o b a b i l i t y 457
Independent eventsTwo events A and B are independent if each event has no effect on the likelihood of theother.
Consider two independent events A and B, where event B follows event A. If theprobability of event B is unaffected by event A, then we can say ‘the probability of B,given A has happened, is the same as the probability of B (whether or not A hashappened)’ or, using symbols:
Pr(B | A) = Pr(B) [1]
But using the conditional probability formula.
Rearranging the above equation we have:Pr(A ∩ B) = Pr(A) Pr(B | A) [2]
Note: Equation [2] has wide application in probability. It may be extended andinterpreted as: ‘When calculating the probability of a chain of events, you may simplymultiply by the probability of the next event, as long as the effect of previous events istaken into account’.
Substituting [1] into [2] we have:Pr(A ∩ B) = Pr(A) Pr(B)
1. Pr (A ∩ B) means the probability of events A and B occurring.2. If Pr(A ∩ B) = Pr(A) × Pr(B) then the events A and B are independent.
Recall that 1 of the 12 outcomes possible when a coin and a die are simultaneouslytossed is a Head for the coin and a 5 on the die. The number 5 obtained with the diedoes not come about because the coin comes up a Head, and getting a Head with thecoin is not a result of the number 5 appearing uppermost on the die.
We can verify the expression given for independent events by looking further at theexample of the coin and die.
What is the probability of getting a Tail and a number from 3 to 4 inclusive?The event space is ε = {H1, H2, H3, H4, H5, H6, T1, T2, T3, T4, T5, T6}, with n(ε) = 12.Let A be the event ‘getting a Tail’ and B be the event ‘getting a number from 3 to 4
inclusive’.
Then A ∩ B = {T3, T4}, n(ε) = 12, so Pr(A ∩ B) = = = .
Now Pr(A) = and Pr(B) = = so Pr(A) × Pr(B) = × = .
So Pr(A ∩ B) = Pr(A) × Pr(B); thus the two events are independent.
Pr B A( ) Pr B A∩( )Pr A( )
------------------------- Pr A B∩( )Pr A( )
-------------------------= =
n A B∩( )n ε( )
----------------------- 212------ 1
6---
12--- 2
6--- 1
3--- 1
2--- 1
3--- 1
6---
Given that events A and B are independent, find the value of x if Pr(A) = 0.55, Pr(B) = 0.6 and Pr(A ∩ B) = x.
THINK WRITE
Write the formula for independent events.
Pr(A ∩ B) = Pr(A) × Pr(B)
Substitute the given information. x = 0.55 × 0.6Simplify. x = 0.33
1
23
25WORKEDExample

458 M a t h e m a t i c a l M e t h o d U n i t s 1 a n d 2
Show that if Pr(A) = 0.5, Pr(B) = 0.8 and Pr(A ∪ B) = 0.9 then A and B are independent.
THINK WRITEUse the Addition Law for probabilities to find Pr(A ∩ B).
Pr(A ∪ B) = Pr(A) + Pr(B) − Pr(A ∩ B)0.9 = 0.5 + 0.8 − Pr(A ∩ B)
Pr(A ∩ B) = 0.4Calculate Pr(A) × Pr(B). Pr(A) × Pr(B) = 0.5 × 0.8
= 0.4Since Pr(A ∩ B) = Pr(A) × Pr(B), A and B are independent events.
1
2
26WORKEDExample
Two spinners each labelled with the numbers 1, 2, 3 are spun.A is the event ‘an odd number with the first spinner’.B is the event ‘an even number with the second spinner’.C is the event ‘an odd number from each spinner’.a Calculate Pr(A), Pr(B) and Pr(C).b Decide which of the pairs of events AB, AC, BC is independent.
THINK WRITE
a List ε, A, B and C. a ε = {11, 12, 13, 21, 22, 23, 31, 32, 33}A = {11, 12, 13, 31, 32, 33}, B = {12, 22, 32},C = {11, 33}
Calculate Pr(A), Pr(B) and Pr(C). Pr(A) = = , Pr(B) = = , Pr(C) =
b Check to see if Pr(A ∩ B) = Pr(A) × Pr(B), Pr(A ∩ C) = Pr(A) × Pr(C), Pr(B ∩ C) = Pr(B) × Pr(C).
b A ∩ B = {12, 32}, Pr(A ∩ B) =
Pr(A) × Pr(B) = ×
=
Pr (A ∩ B) = Pr(A) × Pr(B), so A and B are independent.
A ∩ C = {11, 33}, Pr(A ∩ C) =
Pr(A) × Pr(C) = ×
=
Pr(A ∩ C) ≠ Pr(A) × Pr(C), so A and C are not independent.B ∩ C = φ, Pr(B ∩ C) = 0
Pr(B) × Pr(C) = ×
=
Pr(B ∩ C) ≠ Pr(B) × Pr(C), so B and C are not independent.
Spinner 2Spinner 1
1 2
3
1 2
3
1
269--- 2
3--- 3
9--- 1
3--- 2
9---
29---
23--- 1
3---
29---
29---
23--- 2
9---
427------
23--- 1
3---
29---
27WORKEDExample

C h a p t e r 1 0 I n t r o d u c t o r y p r o b a b i l i t y 459When the probabilities of all possible outcomes are not equally likely then the prob-
ability of each outcome is placed on the corresponding branch of the tree diagram.When each branch is representing an outcome from independent events, you can followthe branches and multiply the probabilities together.
A moneybox contains three $1 coins and two $2 coins. The moneybox is shaken; one coin falls out and is put back in the box. This is repeated twice more. If each coin has an equal probability of falling out:a Represent this information on a tree diagram.b Calculate the probability of getting three $1 coins.c Calculate the probability of getting at least two $2 coins.
THINK WRITE
a There are three $1 coins and five coins altogether. The probability of a $1 coin falling out is = 0.6.
a
There are two $2 coins and five coins altogether. The probability of a $2 coin falling out is = 0.4.
Place the probability of each outcome on the corresponding branch of the tree diagram.
b Multiply the probabilities obtained from the tree diagram corresponding to three $1 coins.
b Pr(three $1 coins) = 0.6 × 0.6 × 0.6= 0.216
c Outcomes corresponding to ‘at least two $2 coins’ are: ($2, $2, $1) or ($2, $1, $2) or ($1, $2, $2) or ($2, $2, $2).
c
Calculate and add the probabilities. Pr(at least two $2 coins) = Pr($2, $2, $1 or $2, $1, $2 or $2, $2, $2)= (0.4 × 0.4 × 0.6) + (0.4 × 0.6 × 0.4)
+ (0.4 × 0.4 × 0.4)= 0.096 + 0.096 + 0.064= 0.256
1
35---
2
25---
3$1
$2
$1
$2
$2
$1
$1 $1, $1, $1$2 $1, $1, $2
$1 $1, $2, $1$2 $1, $2, $2
$1 $2, $1, $1$2 $2, $1, $2
$1 $2, $2, $1$2 $2, $2, $2
0.6
0.4
0.6
0.40.6
0.4
0.6
0.40.6
0.4
0.6
0.4
0.6
0.4
1
2
28WORKEDExample

460 M a t h e m a t i c a l M e t h o d U n i t s 1 a n d 2
Christos estimates his chances of passing Maths, Science and English as 0.75, 0.6 and 0.5 respectively.a Represent this information on a tree diagram.b Assuming the events are independent, calculate the probability that:
i he passes all three subjects ii he passes at least Maths and English.
THINK WRITE
a Name the three events. a Let M, S, E be the events ‘passing Maths’, ‘passing Science’ and ‘passing English’ respectively.
Calculate Pr(M′), Pr(S′) and Pr(E′). Pr(M) = 0.75 Pr(M ′) = 0.25Pr(S) = 0.6 Pr(S ′) = 0.4Pr(E) = 0.5 Pr(E ′) = 0.5
Use the information to draw the tree diagram.
b i Multiply the probabilities corresponding to passes in all 3 subjects.
b i Pr(MSE) = Pr(M) × Pr(S) × Pr(E)= 0.75 × 0.6 × 0.5= 0.225
ii We require that Christos pass both Maths and English and either pass or fail Science.
ii Pr(MSE or MS′E)= Pr(MSE) + Pr(MS′E)
These events are independent, so we may multiply the individual probabilities.
= Pr(M) × Pr(S) × Pr(E) + Pr(M)× Pr(S′) × Pr(E)
= 0.75 × 0.6 × 0.5 + 0.75 × 0.4 × 0.5
Simplify. = 0.375
1
2
3
S
S'
S
S'
M'
M
E MSEE' MSE'
E MS'EE' MS'E'
E M'SEE' M'SE'
E M'S'EE' M'S'E'
Maths Science English
0.75
0.25
0.5
0.50.5
0.5
0.5
0.50.5
0.5
0.4
0.6
0.6
0.4
1
2
3
29WORKEDExample
remember1. If Pr(A ∩ B) = Pr(A) × Pr(B) then events A and B are independent.2. Pr(A ∩ B) means ‘the probability of events A and B.’3. ‘and’ = ∩4. ‘or’ = ∪
remember
C h a p t e r 1 0 I n t r o d u c t o r y p r o b a b i l i t y 461
Independent events
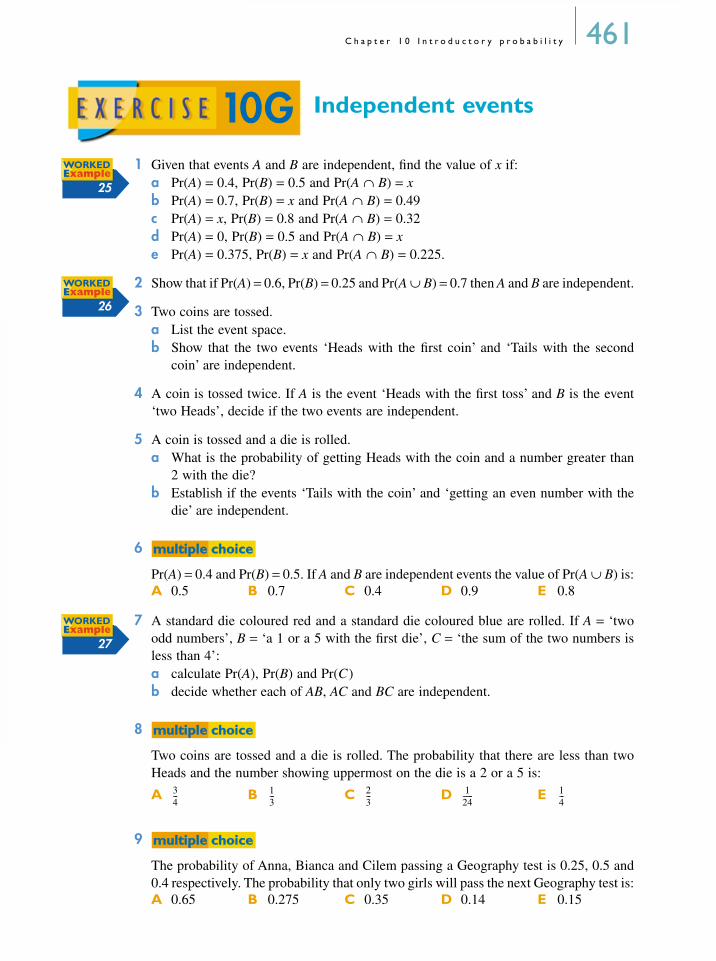
1 Given that events A and B are independent, find the value of x if:a Pr(A) = 0.4, Pr(B) = 0.5 and Pr(A ∩ B) = xb Pr(A) = 0.7, Pr(B) = x and Pr(A ∩ B) = 0.49c Pr(A) = x, Pr(B) = 0.8 and Pr(A ∩ B) = 0.32d Pr(A) = 0, Pr(B) = 0.5 and Pr(A ∩ B) = xe Pr(A) = 0.375, Pr(B) = x and Pr(A ∩ B) = 0.225.
2 Show that if Pr(A) = 0.6, Pr(B) = 0.25 and Pr(A ∪ B) = 0.7 then A and B are independent.
3 Two coins are tossed.a List the event space.b Show that the two events ‘Heads with the first coin’ and ‘Tails with the second
coin’ are independent.
4 A coin is tossed twice. If A is the event ‘Heads with the first toss’ and B is the event‘two Heads’, decide if the two events are independent.
5 A coin is tossed and a die is rolled.a What is the probability of getting Heads with the coin and a number greater than
2 with the die?b Establish if the events ‘Tails with the coin’ and ‘getting an even number with the
die’ are independent.
6
Pr(A) = 0.4 and Pr(B) = 0.5. If A and B are independent events the value of Pr(A ∪ B) is:
7 A standard die coloured red and a standard die coloured blue are rolled. If A = ‘twoodd numbers’, B = ‘a 1 or a 5 with the first die’, C = ‘the sum of the two numbers isless than 4’:a calculate Pr(A), Pr(B) and Pr(C)b decide whether each of AB, AC and BC are independent.
8
Two coins are tossed and a die is rolled. The probability that there are less than twoHeads and the number showing uppermost on the die is a 2 or a 5 is:
9
The probability of Anna, Bianca and Cilem passing a Geography test is 0.25, 0.5 and0.4 respectively. The probability that only two girls will pass the next Geography test is:
A 0.5 B 0.7 C 0.4 D 0.9 E 0.8
A B C D E
A 0.65 B 0.275 C 0.35 D 0.14 E 0.15
10GWORKEDExample
25
WORKEDExample
26
mmultiple choiceultiple choice
WORKEDExample
27
mmultiple choiceultiple choice
34--- 1
3--- 2
3--- 1
24------ 1
4---
mmultiple choiceultiple choice

462 M a t h e m a t i c a l M e t h o d U n i t s 1 a n d 2
10
A die is biased so that the probability of rolling a 1, 2, 3, 4, 5 and 6 is 0.25, 0.2, 0.1,0.1, 0.15 and 0.2 respectively. If the die is rolled twice, the probability that the sum ofthe two numbers rolled is greater than 9 is:
11 A box contains 6 red marbles and 4 blue marbles. One marble is randomly drawn, itscolour noted and the marble put back in the box. This procedure is done two more times.Represent the information as a tree diagram and calculate the probability of getting:a three red marblesb two red marbles and one blue marble in any orderc three red marbles or three blue marbles.
12 One card is randomly drawn from a standard deck of 52 cards, replaced and a secondcard randomly chosen. Determine the probability that:a both cards are aces.b both cards are spadesc the two cards are different colours.
13 A die is biased so that the probability of obtaining the numbers 1, 2, 3, 4, 5, 6 is 0.1,0.3, 0.1, 0.2, 0.2, 0.1 respectively. If the die is rolled twice, find the probability ofrolling:a two 6sb an odd number followed by an even numberc two numbers which sum to 4d two numbers whose sum is greater than 10.
14 A Krisp-O cereal box contains an action card of a famous sports player selected from10 cricket stars, 25 football identities and 15 tennis celebrities.a What is the probability that a randomly selected box of Krisp-O contains a card of
a cricket player?b What is the probability of finding cards of football players in each of two boxes
randomly selected from the supermarket shelf?c What is the probability that three randomly selected packs of Krisp-O will provide
cards of different sports?
15 Three types of seedling (daisy, rose and orchid) have a probability of surviving anyone week as 0.9, 0.85 and 0.8 respectively.a Represent this information on a tree diagram.b Assuming the seedlings’ chance of survival are independent, calculate the prob-
ability that:i after one week all three seedlings will have survivedii more than one seedling will survive to the end of the first week.
16 Ibrahim estimates the probability of rain on Monday and Tuesday as 0.7 and 0.4respectively. Assuming that the events ‘rain on Monday’ and ‘rain on Tuesday’ areindependent:a represent this information on a tree diagramb calculate the probability of rain on both daysc calculate the probability of no rain on at least one of the two days.
A 0.2255 B 0.4355 C 0.5650 D 0.1625 E 0.1255
mmultiple choiceultiple choice
WORKEDExample
28
WORKEDExample
29

C h a p t e r 1 0 I n t r o d u c t o r y p r o b a b i l i t y 46317 A school junior swim team has five Year 7 students and seven Year 8 students. A merit
certificate is to be awarded to one student from Year 7 and to one student from Year 8. a If each student has an equal chance of selection, state the probability of a particular
student from Year 7 and a particular student from Year 8 receiving the award.b If a special achievement certificate is also to be given to one of the students, what
is the probability that a particular student wins two awards assuming that each stu-dent has the same chance of being selected?
18 To open a combination lockinvolves using the correctsequence of three digitsselected from 0, 1, 2, 3, 4, 5, 6,7, 8, 9, where a digit may beused more than once. If eachdigit is randomly selected:a Calculate the probability of
success after one try.b Calculate the probability of
success after one try giventhat the three digits areknown to be odd.
c Calculate the probability ofsuccess after one try giventhat the first and third digitsare known to be the same.
19 A leather bag contains 4 black beads, 3 red beads and 3 white beads. Inside a plasticbag are 5 black beads, 2 red beads and 3 white beads. Another nylon bag contains 6black beads, 1 red bead and 3 white beads.
One bead is randomly withdrawn from each bag. What is the probability of getting:a three black beads?b a red bead from the leather bag but not a red bead from the plastic bag?c at least two white beads?
20 One letter is randomly selected from each of the words HOORAY FOR MATHS. Findthe probability of getting:a three vowelsb at least two consonantsc at least one vowel which is not the letter O.
21 At Greengate Secondary College the probability of a VCE student proceeding to uni-versity studies is 50%, the probability of enrolling in TAFE courses is 20% and thereis a 30% probability of finding employment immediately after completion of the VCE.For a group of four randomly selected VCE students, what is the probability that:a all of them will undertake university studies?b all will seek employment or all will undertake TAFE courses?
Enrichment work on sampling without replacement is available on the MathsQuest CD-ROM.
extensioneextensionxtension — Sampling without replacement

464 M a t h e m a t i c a l M e t h o d U n i t s 1 a n d 2
SimulationSimulation methods are used to model events when direct investigations may not bepossible or practical because of factors such as insufficient time, possible danger or theexpense involved. The aim of such methods is to obtain results comparable to the out-comes which would have been observed if the event had been examined directly. Forexample, the possible effects of air resistance on the structure and stability of a newlydesigned aeroplane may be investigated by performing wind-tunnel experiments usinga scale model of the aircraft. On a larger scale, the economic implications arising frominterest rate changes may be investigated using mathematical models that will take intoaccount relevant variables such as unemployment and the cost of living. Altering thevalue and type of variable will provide a range of predicted outcomes.
Many basic simulation techniques involve the generation of random numbers.Methods used include coins, dice, cards, spinners, random number tables, calculatorsand computers. The graphing calculator can be especially useful.
Using a graphics calculator to generate random numbersThe following command line entered on the home screen ofa TI–83 graphics calculator will generate a random numberbetween 1 and 6 (therefore simulating a die).Press , select and . Press .
Pressing several more times generates furtherrandom numbers as shown in the diagram. If you want anexact number of values between 1 and 6, you can type (1, 6, 5), which will simulate anumber between 1 and 6, 5 times.
To generate a random number between 1 and 10, press , select and and type 1, 10. Press .
MATH PRB 5:randInt1 , 6 ) ENTER
ENTER
MATH PRB5:randInt ENTER
Pina estimates her chance of passing an English test as , and must take 5 tests during the year.a Explain how a graphics calculator may be used to simulate the 5 tests.b Carry out 5 simulations to obtain an estimate of Pina’s performance of the tests.
THINK WRITE
a Define the event as shown. a Let P be the event ‘passing the test’.
State the relevant probabilities. Pr(P) = and Pr(P′) =
Decide which numbers (to be generated on a graphics calculator) will represent the event space and which will represent favourable outcomes.
Let the numbers 1, 2, 3 represent the event space, 1 and 2 represent passing the test and 3 represent failing the test.
23---
1
223--- 1
3---
3
30WORKEDExample

C h a p t e r 1 0 I n t r o d u c t o r y p r o b a b i l i t y 465
THINK WRITE/DISPLAY
b Generate 5 random numbers from 1 to 3 inclusive using a graphics calculator by selecting and entering .
b
Three of the 5 outcomes (2, 1, 1) represent passing the test.
The simulation predicts Pina will pass 3 of the 5 tests.The results can be summarised as follows.
1
5:randInt(1, 3, 5)
2
TrialRandom number
Test outcome
1 3 fail
2 1 pass
3 2 pass
4 3 fail
5 1 pass
The probability of a Jonathan apple tree producing fruit in any one season is and the probability of a Granny Smith apple tree bearing fruit in a season is .a Assuming the two events are independent, calculate the probability that during a
particular season:i both trees will produce fruitii both trees will bear no fruitiii only one of the trees will bear fruit.
b Devise a suitable simulation model consisting of 10 trials for each tree to obtainestimates for the probabilities obtained in a.
THINK WRITEa Define the events as shown. a Let J = Jonathan bears fruit
G = Granny Smith bears fruitState the given probabilities. Pr(J) = , Pr(G) =
i Find Pr(Jonathan and Granny Smith bear fruit). Recall ‘and’ means ∩. Since the events are independent, Pr(J ∩ G) = Pr(J) × Pr(G).
i Pr(J ∩ G) = ×
=
56---
34---
1
2 56--- 3
4---
56--- 3
4---
58---
31WORKEDExample
Continued over page

466 M a t h e m a t i c a l M e t h o d U n i t s 1 a n d 2
Compare the calculated and simulated probabilities in worked example 31. Repeat thesimulation to obtain a new set of results. How do they compare?
THINK WRITE
ii Find Pr(both trees bear no fruit).Note:Pr(J′) = 1 − Pr(J) = 1 − = and
Pr(G′) = 1 − Pr(G) = 1 − =
ii Pr(J′ ∩ G′) = ×
=
iii Consider all situations in which only one of the trees bears fruit and add the probabilities(recall ‘or’ means + ).
iii Pr(one tree bears fruit)= Pr(J ∩ G′) + Pr(J′ ∩ G)
= × + ×
=
b Decide on a method of simulation and decide which numbers will represent the event space and which will represent favourable outcomes. There are 6 possible outcomes when a die is rolled: 1, 2, 3, 4, 5, 6.There are 4 possible outcomes when two coins are tossed: HH, TT, HT, TH.
b Let getting a 1, 2, 3, 4 or 5 when a die is rolled represent the Jonathan bearing fruit.Let the outcomes HH, TT and HT when two coins are tossed represent the Granny Smith bearing fruit.
Roll a die 10 times and record the results. Possible results are shown in the table.Alternatively, use a graphics calculator to generate 10 random numbers between 1 and 6 by entering at .
Toss two coins 10 times and record the results. Possible results are shown in the table.Alternatively, use a graphics calculator to generate 10 random numbers between 1 and 4 by selecting and entering .
i Trials 2, 3, 4, 6, 9 and 10 (6 trials) correspond to both trees bearing fruit.
i Estimated probability that both trees
bear fruit = .
ii Trial 5 corresponds only to both trees bearing no fruit.
ii Estimated probability that both trees
bear no fruit = .
iii Trials 1, 7 and 8 correspond to only one tree bearing fruit.
iii Estimated probability that only one tree
bears fruit = .
56--- 1
6---
34--- 1
4---
16--- 1
4---
124------
56--- 1
4--- 1
6--- 3
4---
13---
1
2
(1,6,10) 5:randInt
� = Fruit × = No fruit
Trial Die Coin Jonathan Granny Smith123456789
10
3412653611
THHTTTHHTHHTTHHHHTHH
��������
�������
3
5:randInt(1,4,10)
610------
110------
310------

C h a p t e r 1 0 I n t r o d u c t o r y p r o b a b i l i t y 467
Simulation
1 A student estimates the probability of stopping at a particular set of traffic lights whenbeing driven to school in the morning is .a Explain how a graphics calculator can be used to simulate 5 trips to school.b Carry out 5 simulations to obtain an estimate for the probability of stopping at the
intersection.
2 The table below shows the number of bullseyes scored by 40 dart players after 5 throws each.
a Explain how a die or a graphics calculator can be used to obtain the range ofnumbers given in the table.
b What proportion of players scored at least 3 bullseyes?c Using a die (or by some other means) conduct 20 trials and obtain a second value
for b.d Analysis of the results of a particular tournament (at which each player threw three
darts) gives the probability of scoring more than 2 bullseyes to be twice theprobability of scoring less than 3 bullseyes.
i Explain how a die or a graphics calculator can be used to simulate this situation.ii Perform 40 trials and compare your results to the given probabilities.
3 A student generated 30 three-digit random numbers using a calculator. The results aregiven in the table below.
a Explain how you can obtain 30 random 2-digit numbers from the table to simulatethe ages of 30 people aged from 10 years to 100 years.
b Using the method you suggested for a, obtain an estimate of the proportion of thegroup that is younger than 50 years of age.
1 4 0 3 4 2 1 5 4 2
3 0 4 5 2 1 4 3 2 1
0 2 1 4 3 5 3 2 4 4
0 2 1 0 3 5 4 2 3 1
200 123 399 165 100 355 778 400 150 100
387 001 793 215 030 288 345 009 970 993
546 720 549 139 248 405 369 217 935 782
remember1. Simulation techniques are used to model events.2. Outcomes of the event space are randomly obtained but based on certain
probabilities.3. Coins, dice, random number tables and calculators can provide random
numbers that can be associated with outcomes of the event space.4. Performing more trials or repeating the simulation will provide better estimates
of the probability.
remember
10HWORKEDExample
3015---
Mathcad
Randomnumbers
EXCEL Spreadsheet
Randomnumbers
GC program
Randomnumbers

468 M a t h e m a t i c a l M e t h o d U n i t s 1 a n d 2
4 A car may be said to be safe if both ofits airbags will operate properly in theevent of a collision. Suppose that theprobability of the driver’s airbag failingis and the probability of the front pas-senger’s airbag not working is . Useone die and two coins to simulate thesituation of the airbags working/notworking.a Assuming the operation of the air-
bags to be independent, find theprobability that during a collision:
i both airbags operate properlyii neither airbag operates properlyiii only one airbag operates properly.
b Using a die and two coins, devise asimulation model consisting of 20trials to obtain an estimate for theprobabilities obtained in a.
5 A die and a coin are each tossed 20 times with the following results.
H is Heads, T is Tails.
a Explain how the events of tossing a coin and rolling a die can be used to simulatethe situation of forming a particular dancing couple consisting of a man randomlychosen from a group of 4 men and a woman randomly selected from a group of 3women.
b Perform 20 simulations to obtain an estimate of the probability of a particular manand a particular woman dancing together.
6 Each packet of Krisp potato chips contains 1 of 5 different fridge magnets. Use 20trials for a simulation analysis to determine how many packets of Krisp need to bepurchased in order to obtain all 5 magnets.
7 To start a petrol driven lawnmower, a Superspark spark plug must produce 3 consecu-tive sparks to ignite the fuel. The spark plug is designed to produce 5 sparks persecond, but the probability of a misfire (that is, no spark is produced during a 0.2second interval) is 25%.a For 20 trials simulate the behaviour of the Superspark spark plug by showing how
many fires and misfires are needed per cycle for the engine to start.b A spark plug is ‘reliable’ if the number of firings in a cycle is at least twice as many
as the number of misfires in the same cycle. From your data determine the proportionof cycles which are reliable.
c Because of consumer complaints of too many misfires, the Superspark spark plugwas improved so that there is now only a 10% probability of a misfire. Unfortu-nately, however, the engine will still require two consecutive sparks to start. Repeatthe simulation analysis as for a and b and discuss whether or not the consumer isbetter off with the new ‘improved’ Superspark spark plug.
Die 1 3 2 4 6 5 4 3 2 3 1 6 4 6 2 1 4 2 2 1
Coin H H T H T T T H H T H T H T H T H T H H
WORKEDExample
31
14---
13---

C h a p t e r 1 0 I n t r o d u c t o r y p r o b a b i l i t y 469
Sets and Venn diagrams• { } A set is a collection of objects (or elements).• x ∈ A denotes that element x belongs to set A.• x ∉ A denotes that element x does not belong to set A.• A finite set can be listed; an infinite set cannot be listed.• A null set (denoted φ) contains no elements.• A unit set contains one element.• n(A) The cardinal number of a set is the number of elements it contains.• ε The universal set is a set containing all elements being considered.• A′ The complement of set A is all the elements of the universal set not contained in
set A.• A = B Two sets are equal if they contain the same elements.• A ↔ B Two sets are equivalent if they have the same cardinal number.• A ∩ B The intersection of two sets is the set of elements common to both sets.• A ∩ B = φ Two sets are disjoint sets if they have no elements in common.• A ∪ B The union of two sets A, B is the set that contains all elements belonging to
A or B or to both A and B.• n(A ∪ B) = n(A) + n(B) − n(A ∩ B)• A ⊂ B Set A is a subset of set B if all the elements of set A are contained in set B.• A ⊃ B Set A contains set B if set A contains all the elements of set B.• Properties of sets can be represented as Venn diagrams.
Using sets to solve practical problems• Use overlapping regions (for example, circles) to represent sets within a universal
set (for example, a rectangle).• Label each set.• Fill in any given information.• Calculate required missing quantities.
Estimated probability and expected number of outcomes
• Estimated probability =
• Expected number of favourable outcomes= estimated probability (long-run proportion) × number of trials
Calculating probabilities• Pr(favourable outcome) =
• For event E, Pr(E) =
• Pr(E) + Pr(E ′) = 1• Pr(E ′) = 1 − Pr(E)• If event E is impossible, Pr(E) = 0.• If event E is certain to occur, Pr(E) = 1.• 0 ≤ Pr(E) ≤ 1• Pr(ε) = 1 and Pr(φ) = 0
summary
number of favourable outcomes observedtotal number of trials
---------------------------------------------------------------------------------------------------
number of favourable outcomestotal number of possible outcomes----------------------------------------------------------------------------------
n E( )n ε( )------------

470 M a t h e m a t i c a l M e t h o d s U n i t s 1 a n d 2
Tree and lattice diagrams• Outcomes can be illustrated by a tree diagram. The order of events determines the
structure of the ‘tree’.• A lattice diagram can be used to show the possible outcomes when two events
occur. It is particularly useful when dealing with outcomes from rolling a die.
The Addition Law of probabilities• For events A, B, Pr (A ∪ B) = Pr(A) + Pr(B) − Pr(A ∩ B)• ‘or’ = ∪, ‘and’ = ∩• Two events are mutually exclusive if they cannot occur at the same time.• If A ∩ B = φ then A, B are mutually exclusive and Pr(A ∩ B) = 0.
Karnaugh Maps and probability tables• Karnaugh Maps and probability tables summarise all
combinations of two events (for example, A and B) and their complements (A′ and B′).
• Use known values, subtotals and the fact that the sum of the probabilities in the outer row and column is equal to 1 to fill in any missing values.
Conditional probability• For two events A and B, the conditional probability of event B given event A occurs
is Pr(B | A) = , Pr(A) ≠ 0 and A is the reduced event space.
• Venn diagrams, tree diagrams and Karnaugh Maps are useful aids in conditional probability problems.
Independent events• If Pr(A ∩ B) = Pr(A) × Pr(B) then events A and B are independent.• Pr(A ∩ B) means the probability of events A and B.• ‘and’ = ∩• ‘or’ = ∪
Simulation• Simulation techniques are used to model events.• Outcomes of the event space are randomly obtained but based on certain
probabilities.• Coins, dice, random number tables and calculators can provide random numbers
that can be associated with outcomes of the event space.• Performing more trials or repeating the simulation will provide better estimates of
the probability.
AA'
B'B
1
Pr A B∩( )Pr A( )
-------------------------

C h a p t e r 1 0 I n t r o d u c t o r y p r o b a b i l i t y 471
Multiple choice
1 Twelve nuts are taken from a jar containing macadamias and cashews. If 3 macadamias are obtained, the estimated probability of obtaining a cashew is:
2 From a normal pack of 52 playing cards one card is randomly drawn and replaced. If this is done 208 times, the number of red or picture cards expected to turn up is:
3 A cubic die with faces numbered 2, 3, 4, 5, 6 and 6 is rolled.The probability of rolling an even number is:
4 The probability of rolling an odd number or a multiple of 2 using the die in question 3 is:
5 Bag A contains 3 red and 4 blue marbles and Bag B contains 3 yellow and 2 green marbles as shown at right.
A marble is drawn from Bag A, then one is taken from Bag B.
Which diagram below best illustrates this situation?
A B
C
A B C D E
A 150 B 130 C 120 D 160 E 128
A B C D E
A 1 B C D E
CHAPTERreview
10A112------ 1
4--- 1
3--- 3
4--- 3
1---
10A
10B13--- 2
3--- 1
6--- 5
6--- 1
2---
10B13--- 1
4--- 3
4--- 2
3---
Bag A Bag B
10C
Yellow RY
Green RG
Yellow BY
Green BGBlue
RedRed YR
Blue YB
Red GR
Blue GBGreen
Yellow
Blue RB
Green RG
Blue YB
Green YGYellow
Red

472 M a t h e m a t i c a l M e t h o d s U n i t s 1 a n d 2
D E
6 If Pr(A) = 0.6, Pr(B) = 0.7 and Pr(A ∪ B) = 0.8 then Pr(A ∩ B) is:
7 Consider this Karnaugh Map where C is ‘people who like comedy movies’ and A is ‘people who like adventure movies’.The number of people who like only adventure movies is:
8 Which of the following alternatives gives the correct values of a and b in the probability table at right?
9 If Pr(B | A) = 0.45 and Pr(A ∩ B) = 0.35 then Pr(A) is:
10 A fair coin is tossed twice. If A = Tails on first toss, B = Heads on second toss and C = both tosses are Heads, which of the following is true?A Pr(A) = B Pr(B) = Pr(C)C A and B are independent.D A and C are independent.E B and C are independent.
11 An archer has a probability of approximately of hitting the bullseye from a particular distance. The following spinner is used to simulate 10 rounds of 4 shots at such a target, and the results are as follows, where B = blue (bullseye) and R = red (non-bullseye).B, R, R, R B, R, B, R R, B, R, R R, B, R, R R, B, B, RR, R, B, B R, B, R, R R, R, R, R R, B, B, R B, R, B, BBased on this simulation, the probability of getting 2 bullseyes in a round of 4 shots is:
A 0.1 B 0.5 C 0.9 D 0.2 E 0.6
A 26 B 30 C 18 D 20 E 23
A a = 0.2, b = 0.3 B a = 0.3, b = 0.2C a = 0.3, b = 0.6 D a = 0.6, b = 0.3E a = 0.7, b = 0.4
A B C D E
A B C D E
Green
Red
Blue
Yellow
Green
Red
Blue
Yellow
Green RG
Red RRBlue RBYellow RY
Green BG
Red BRBlue BBYellow BY
Green YG
Red YRBlue YBYellow YY
Green GG
Red GRBlue GBYellow GY
10D
A A′C 19
C′ 25
26 50
10E
B B′A 0.4 0.7
A′ a b
0.4
10E
10F 79--- 3
8--- 4
9--- 5
8--- 8
9---
10G14---
10H38---
14--- 3
8--- 2
5--- 5
8--- 3
4---

C h a p t e r 1 0 I n t r o d u c t o r y p r o b a b i l i t y 473
Short answer1 A random sampling of 80 ceramic tiles produced at a ceramics factory reveals 8 scratched,
3 chipped and 4 broken. Estimate the probability that a tile produced at the factory will be:a scratchedb chipped or brokenc damaged in some way.
2 A game show host spins the wheel shown at right.What is the probability that the wheel ends on:a the jackpot ($1000 prize)?b a prize greater than $50?
3 A letter is chosen at random from each of the words GO BLUES. Represent all possible outcomes on a tree diagram and find the probability that:a G and B are chosenb S is chosenc G or S is chosen.
4 A standard die is thrown and the spinner (see diagram) is spun.a Show all possible outcomes on a lattice diagram.b Find the probability of getting a number greater than 4 on the die and an
odd number on the spinner.
5 A set of 20 uniformly sized cards numbered 1 to 20 is shuffled. What is the probability of drawing a number less than 8 or an even number from this set?
6 A class of 30 students was asked if there was a pet dog at home, and if the students were responsible for pooper scooping before the backyard lawn was mown. Fourteen students had a dog but only 6 did the pooper scooping.a Draw a Karnaugh Map showing this information.b Complete a probability table.c State the probability that a randomly selected student has a dog but avoids pooper
scooping.
7 If Pr(A) = 0.3 and Pr(B | A) = 0.4, find Pr(A ∩ B).
8 Two identical, equally accessible cookie jars sit on a kitchen bench. Jar 1 contains 6 chocolate and 9 plain biscuits, and Jar 2 contains 12 chocolate and 8 plain biscuits. One biscuit is selected randomly from one of the jars. If a chocolate biscuit is selected, what is the probability that it came from Jar 1?
10A
10B
CH
UC
K- A
- D U C K ' S
WH
EE
L
$1000Jackpot $60
Lose
$100
$100B
oobyPrize
$40$500$30
$50
$200
Lose
it
all
$10
10C
23
1 10C
10D
10E
10F10F

474 M a t h e m a t i c a l M e t h o d s U n i t s 1 a n d 2
9 Of 50 people surveyed, 35 played tennis and 26 played netball. Everyone surveyed played at least one of these sports.a How many people played both netball and tennis?b If one person is selected at random what is the probability that:
i he/she plays tennis only?ii he/she plays netball?iii he/she plays tennis given that he/she also plays netball?
10 One student is selected at random from each of Years 7, 8 and 9. If there are 148 girls and 114 boys at Year 7, 126 girls and 97 boys at Year 8 and 115 girls and 122 boys at Year 9, find the probability that all students chosen are boys. Give your answer to 3 decimal places.
11 The probability that the newspaper is delivered to Geoff’s house before 8.00 am is , and the probability that he arrives at work to find a free parking space in his company’s car park is . Assuming these events are independent:
a Use a graphics calculator to conduct a simulation of 28 days duration.b Find the probability, based on the simulation, that on one day Geoff misses out on a
company car park space and his paper arrives late.c Calculate the theoretical probability of the combination of events described in part b.
AnalysisConsider 3 fair coins being tossed.If A = Heads with the first coin, B = Tails with the second coin and C = Tails with the third coin:a List the event space (for example, use HTH for ‘Head then Tail then Head’).b Find: i Pr(A) ii Pr(B) iii Pr(C) iv Pr(A ∩ B)
v Pr(A ∩ C) vi Pr(B ∩ C) vii Pr(A ∩ B ∩ C) viii Pr(A) × Pr(B) × Pr(C)c Propose how you might define independence for 3 events.
10F
10G
10H57---
910------
testtest
CHAPTERyyourselfourself
testyyourselfourself
10