investigation on heat transfer evaluation for a more
TRANSCRIPT

HAL Id: hal-00692340https://hal.archives-ouvertes.fr/hal-00692340
Submitted on 30 Apr 2012
HAL is a multi-disciplinary open accessarchive for the deposit and dissemination of sci-entific research documents, whether they are pub-lished or not. The documents may come fromteaching and research institutions in France orabroad, or from public or private research centers.
L’archive ouverte pluridisciplinaire HAL, estdestinée au dépôt et à la diffusion de documentsscientifiques de niveau recherche, publiés ou non,émanant des établissements d’enseignement et derecherche français ou étrangers, des laboratoirespublics ou privés.
Investigation on heat transfer evaluation for a moreefficient two-zone combustion model in the case of
natural gas SI enginesMohand Said Lounici, Khaled Loubar, Mourad Balistrou, Mohand Tazerout
To cite this version:Mohand Said Lounici, Khaled Loubar, Mourad Balistrou, Mohand Tazerout. Investigationon heat transfer evaluation for a more efficient two-zone combustion model in the case ofnatural gas SI engines. Applied Thermal Engineering, Elsevier, 2010, 31 (2-3), pp.319.�10.1016/j.applthermaleng.2010.09.012�. �hal-00692340�

Accepted Manuscript
Title: Investigation on heat transfer evaluation for a more efficient two-zonecombustion model in the case of natural gas SI engines
Authors: Mohand Said Lounici, Khaled Loubar, Mourad Balistrou, Mohand Tazerout
PII: S1359-4311(10)00399-6
DOI: 10.1016/j.applthermaleng.2010.09.012
Reference: ATE 3239
To appear in: Applied Thermal Engineering
Received Date: 20 February 2010
Revised Date: 2 September 2010
Accepted Date: 15 September 2010
Please cite this article as: M.S. Lounici, K. Loubar, M. Balistrou, M. Tazerout. Investigation on heattransfer evaluation for a more efficient two-zone combustion model in the case of natural gas SI engines,Applied Thermal Engineering (2010), doi: 10.1016/j.applthermaleng.2010.09.012
This is a PDF file of an unedited manuscript that has been accepted for publication. As a service toour customers we are providing this early version of the manuscript. The manuscript will undergocopyediting, typesetting, and review of the resulting proof before it is published in its final form. Pleasenote that during the production process errors may be discovered which could affect the content, and alllegal disclaimers that apply to the journal pertain.

1
Investigation on heat transfer evaluation for a more efficient two-zone
combustion model in the case of natural gas SI engines
Mohand Said LOUNICI*, , Khaled LOUBAR, Mourad BALISTROU, Mohand TAZEROUT. Laboratoire des Systèmes Energétiques et Environnement, Emn, 44307 Nantes Cedex 3, France. Laboratoire de Dynamique des Moteurs et Vibroacoustique, Umbb, Boumerdes, 35000, Algeria.
* Tel: 0033251858282, Fax : 0033251858299, e-mail: [email protected], __________________________________________________________________________ Abstract Two-zone model is one of the most interesting engine simulation tools, especially for SI
engines. However, the pertinence of the simulation depends on the accuracy of the heat
transfer model. In fact, an important part of the fuel energy is transformed to heat loss from
the chamber walls. Also, knock appearance is closely related to heat exchange. However, in
the previous studies using two-zone models, many choices are made for heat transfer
evaluation and no choice influence study has been carried out, in the literature. The current
study aims to investigate the effect of the choice of both the heat transfer correlation and
burned zone heat transfer area calculation method and provide an optimized choice for a more
efficient two-zone thermodynamic model, in the case of natural gas SI engines. For this
purpose, a computer simulation is developed. Experimental measurements are carried out for
comparison and validation. The effect of correlation choice has been first studied. The most
known correlations have been tested and compared. Our experimental pressure results,
supported for more general and reliable conclusions, by a literature survey of many other
studies, based on measured heat transfer rates for several SI engines, are used for correlation
selection. It is found that Hohenberg’s correlation is the best choice. However, the influence
of the burned zone heat transfer area calculation method is negligible.
Keywords: Heat transfer; Two-zone model; Natural gas; SI engines. ___________________________________________________________________

2
1. Introduction
Natural gas is one of the most interesting and promising available fuels for internal
combustion engines. It has been recently used as an alternative to conventional fuels in order
to satisfy some environmental and economical concerns. Moreover, governments have been
motivated to expand in natural gas infrastructures in order to be feasible to passenger vehicles
as well as stationary engines [1]. However, to be more attractive and feasible, many aspects
have to be improved for best performance and emissions.
On the other hand, optimization of engine design requires extensive engine testing. Therefore,
engine modeling codes are generally preferred for evaluating initial designs. Computer
models of engine processes are valuable tools for analysis and optimization of engine
performance and allow exploration of many engine design alternatives in an inexpensive way.
Internal combustion engine modeling has been a continuing effort over the years and many
models have been developed to predict engine performance parameters.
Zero Dimensional (Zero-D) models are the most commonly preferred analytical tools for
internal combustion engine development [2]. They are one of the simplest and fastest methods
to model engine combustion processes. Engine designers may find that experimentally based
Zero-D codes are more useful for design and development applications. If an experimental
model is developed based on an engine’s experimental data, this model can be used for new
engines with similar design in a predictive manner to provide some qualitative trends.
Furthermore, two-zone model can represent a very interesting simulation tool especially for
SI engines, due to the combustion type in this case. In fact, the flame front separates the
chamber into a burned hot zone and a much cooler unburned zone.

3
On the other hand, heat transfer is particularly important in the combustion chamber energy
balance. The gases temperatures can reach about 2800 K and heat flux induced can reach
several tens megawatts per square meter for some engines [3]. Heat transfers occupy a capital
place in the combustion chamber heat release analysis, since they account for approximately
30 to 40 % of the energies in consideration [3]. For a small–scale 125 cm3 two strokes SI
engine, Franco [4] found that approximately 50% of the fuel energy is converted to heat loss.
Therefore, heat transfer evaluation has a significant effect in the model accuracy.
However, in the previous studies, using two-zone model for natural gas SI engines, many
choices are made for heat transfer evaluation. For instance, Ibrahim and co-workers [1,5] used
Woschni correlation, Caillol and co-workers [6] used Hohenberg correlation and Soylu and
co-workers [2,7], used Annand’s. Also for heat exchange area estimation for the burned and
unburned gases, several methods have been used. However, no justification for the choice has
been given in the literature. Thus, this study aims to investigate the effect of the choice of
both the heat transfer correlation and area calculation and provide an optimized choice for a
more convenient two-zone combustion model in the case of natural gas SI engines. For this
purpose, a computer simulation is developed, and experimental measurements are carried out
for comparison and validation.
2. Numerical model description
2.1 Model assumptions
The following assumptions and approximations are considered in the present work:

4
1. The contents of the cylinder are fully mixed and spatially homogeneous in terms of
composition and properties during intake, compression, expansion, and exhaust
processes.
2. For the combustion process, two zones (each is spatially homogeneous) are used. The
two zones are the burned and the unburned zones. The two zones are always separated
by an infinitesimally thin flame.
3. Until the start of combustion, the model is a single zone and undergoes no pre-flame
reactions.
4. All gases are considered to be ideal gases during the engine thermodynamic cycle.
Thermal properties are determined by assuming ideal gas behavior for air-natural gas
mixtures. Temperature variation is taken into account by using NASA polynomial
expressions for each gas [3].
5. The cylinder pressure is assumed to be the same for the burned and unburned zones.
6. The heat transfer between the two zones is neglected.
7. The cylinder walls temperature is assumed to be uniform and constant (400 K) [1,8].
The temperature’s variations of inner cylinder surface during the thermodynamic cycle
are weak compared to the temperature’s variations of the combustion gases [9]. In
fact, the temperature of the wall can be considered as constant according to the results
of Rakapoulos et al. [10].
8. The intake and exhaust manifolds are assumed to be infinite plenums containing gases
at constant temperature and pressure.
9. All crevice effects are ignored, and the blow-by is assumed to be zero.

5
10. The engine is in steady state such that the thermodynamic state at the beginning of
each thermodynamic cycle (two crankshaft revolutions) is the same as the end state of
the cycle.
Fig. 1. Schematic representation of the two-zone combustion modeling
2.2 Model equations The main equations governing the two-zone model are the energy conservation equation
applied to an open system (burned and unburned zones), the equation of ideal gases, the
conservation of the mass, the evolution of volumes and different sub-models allowing the
simulation of the thermodynamic cycle (sub-models of combustion, heat transfer, mass
transfer during the open phases of the combustion chamber and formation of pollutant)
[1, 11,12].
The total mass is assumed to be constant, since valve leakage and blow-by are neglected.
bu mmm += (1)
Burned Gas
Unburned Gas
Heat flux
Work
Heat flux
Q Q
Q
Q Q
Q
W

6
The volume of the two zones is equal to the total cylinder volume, which is a function of the
cylinder geometry and crank angle.
bu VVV += (2)
In each zone, assuming ideal gases and the same pressure, the equation of state gives.
uuuu TRmVP ⋅⋅=⋅ (3)
bbbb TRmVP ⋅⋅=⋅ (4)
The energy equations were written for each zone as follows.
θθθθ d
dmh
d
dQ
d
dVP
d
umd uu
i
uiuuu ⋅−+⋅−= ∑)(
(5)
θθθθ d
dmh
d
dQ
d
dVP
d
umd uu
i
bibbb ⋅++⋅−= ∑)(
(6)
Where ∑i
is the summation of the heat transfer rates through the different engine’s parts
surfaces in contact with the cylinder gases.
Combustion sub-model
The Wiebe function is often used to determine the burning rate. For SI engines, a simple
function with four parameters allows to describe the different configurations of
application [12].
−⋅−−=
+1m
b
0wb
w
aexp1xθ∆θθ
(7)

7
where θ is the crank angle, θ0 is the crank angle at the start of combustion, ∆θb is the total
combustion duration (from xb = 0 to xb ≈ 1), and aw and mw are adjustable parameters which
fix the shape of the curve.
Heat transfer sub-model (a review)
Heat transfers inside internal combustion engines are convective and radiative nature.
However, for SI engines, the radiative transfers are negligible since they account for only 3 to
4% of the total heat transfer [8]. This cannot be applicable to diesel engines where the
radiative transfers can represent up to 10 % of the heat exchanges due to soot formation
during combustion [8].
During combustion, the burned gas temperature increases significantly with maximum which
can reach about 2800 K. This induces gases expansion and thus an increase in their
movement. It is during this period that heat transfers are the most important. Heat flux
induced can reach several tens megawatts per square meter for some engines [3].
These heat transfers between gases and the chamber walls are non-uniform and unsteady,
hence generally complex to evaluate. Many approaches can be used, depending on the kind of
results required.
However, it is frequent to simplify the formulation, and use the Newton relation (8). It is the
approach adopted in zero-dimensional models.
)TT(ShQ wgwgw −⋅⋅=& (8)
where Tg is the gases temperature, Tw the wall temperature and hg the gas-wall heat
transfer coefficient . Like Tg, hg is supposed to be uniform in all the parts of the chamber with
same gas (burned or unburned).

8
Accordingly, the main parameter to determine, in order to evaluate the parietal losses during
an engine cycle, is the heat transfer coefficient hg.
A wealth of literature has been published over the years regarding the gas-to-wall heat
transfer process in SI and CI engines and a number of correlations have been proposed for
calculating the instantaneous heat transfer coefficient [13-20].
These correlations provide a heat transfer coefficient representing a spatially-averaged value
for the cylinder. Therefore, they are commonly referred to as global heat transfer models [13].
The most known ones were inventoried by Trapy [19], Borman and Nishiwaki [20], Guibert
[3] and Ollivier [8].
Those correlations can be classified into two categories, according to the assumption retained
for the heat transfer origin. However, we will detail only the ones which will be examined.
Natural convection assumption
The first correlations established for the heat transfer evaluation in engines, adopted the
assumption of natural convection. The heat transfer coefficient, is then, written, in a
dimensionless form, according to the relation:
nPr)Gr(CsteNu ⋅⋅= (9)
The first model dates back to 1923 and was established by Nüsselt. It consists of an empirical
correlation established by tests carried out in spherical bomb. This model was followed and
adjusted by Brilling , and Eichelberg; by using the experimental test results carried out on
internal combustion engines [3].
These models had the advantage of describing, for the first time, the influence of engine
parameters such as gas temperature, pressure and engine speed. But this approach has quickly

9
reached its limits. Woschni [16] explains, furthermore, why these formulas are finally only
very approximate. This approach was thus discussed until being abandoned in favor of the use
of dimensional analysis considering forced convection.
However, Eichelberg’s correlation, even though categorized in this family [8] still gives good
estimation for heat transfer calculation.
• Eichelberg’s Correlation (1939) [14]
2/1g
3/1mp
3g )T.P()V(1067.7h ⋅⋅= − (10)
Forced convection assumption
Because of the inadequacy of the natural convection assumption, correlations based on this
assumption apply with difficulty to other engines. Thus, some experimenters (Annand,
Woschni, Hohenberg, …) adopted the forced convection assumption [8]. This one is more
realistic because the fluid movements in the chamber are the consequence of external
mechanical actions.
These studies have generally relied on dimensional analysis for turbulent flow that correlates
the Nusselt, Reynolds, and Prandtl numbers. Using experiments in engines and applying the
assumption of quasi-steady conditions has led to empirical correlations for both SI and CI
engine heat transfer.
The general formulation of the Nusselt number, considering some assumptions, is then
written:
nm PrReaNu ⋅⋅= (11)

10
Substituting Nu and Re with physical properties, the global heat transfer coefficient depends
on characteristic length, transport properties, pressure, temperature, and characteristic
velocity. A scaling factor is used for tuning of the coefficient to match specific engine
geometry. A value for the exponent m has been proposed by several authors, for example, m =
0.5 for Elser and Oguri, 0.7 for Annand and Sitkei, 0.75 for Taylor and Toong, and 0.8 for
Woschni and Hohenberg. Except for the Woschni’s correlation, most of these correlations use
a time-averaged gas velocity proportional to the mean piston speed. However, Woschni
separated the gas velocity into two parts: the unfired gas velocity that is proportional to the
mean piston speed, and the time-dependent, combustion induced gas velocity that is a
function of the difference between the motoring and firing pressures.
The Woschni’s and Hohenberg’s correlations are the most known of this category.
• Woschni’s Correlation (1965-68) [16]
⋅
−⋅
⋅⋅
⋅+⋅⋅⋅⋅= −− 53.0
8.0
11
121
8.02.00 )()( TPP
VP
TVCVCPBCh mot
dmpg (12)
P is the instantaneous pressure, in bar. C0 = 110-130. C1 and C2 are given in table 1 Table 1: C1 and C2 Coefficients for Woschni’s Correlation
Phase C1 [-] C2 [m/s.K]
Intake-Exhaust 6.18 0
Compression 2.28 0
Combustion-Expansion 2.28 3.24 10-3

11
• Hohenberg’s Correlation (1979) [18]
Hohenberg [18] noted that the Woschni correlation underestimates the heat transfer
coefficient during compression and over-estimates it during combustion. This leads to an
over-estimate of the average heat flux during a cycle. Moreover, he underlines its difficulty of
use. This leads him to propose the following correlation
8.0mp2
4.08.006.0u1g )VC(TPCCh +⋅⋅⋅= −− (13)
P is the instantaneous pressure, in bar. The numerical values C1=130 and C2=1.4, appearing in
equation (13), are constants established on base of six representative engines.
• Sitkei’s Correlation [17]
This correlation belongs to the same family as Woschni and Hohenberg correlations. This
correlation is also established on base of Diesel engine experiments. It is expressed according
to the equation (14):
3.02.0
3.07.0mp4
g)V4(T
A)VP()b1(1036.2h
⋅⋅
⋅+⋅×= − (14)
With b = 0 - 0.35
Specific correlations for SI engines
The correlations given previously are typically established on base of diesel engines
experiments. Consequently, they are theoretically not suitable to model the in-cylinder heat
12
transfer process for SI engines, because their combustion principles and operating ranges are
very different. However, many studies used those correlations for SI engines. For instance,
Oguri [21] used Eichelberg’s model to predict the heat transfer rate of a 1400 cm3 SI engine,
yielding predicted results that agreed with the experimental results for the expansion stroke,
but not for the compression stroke. Shayler [22] calculated heat transfer using Woschni’s,
Annand’s, and Eichelberg’s experimental models. It was found that Eichelberg’s model could
produce prediction results closest to the experimental data.
Correlations were established especially for this type of engine, but they are fewer. Trapy’s
Correlation [19] is one belonging to this category. Unlike those defined previously, this
correlation does not have a universal character and the constant coefficients appearing in it,
differ from an engine to another.
Finally, Annand’s correlation has been established for both SI and CI engines, the constant b
differs depending on the type of engine.
• Annand’s Correlation [15]
)(
)(Re
447.0
wg
wggg TT
TTb
B
kah
−−
⋅+⋅⋅= (15)
With a = 0.35-0.8 and b = 4.3*10-9 W/m2.K-4 for SI engines.
Note that when the expression of the previous correlations is different depending on the
engine cycle phase, the appropriate formula is specified. Otherwise, the expression is unique

13
2.3 Model Integration
The preceding equations produce a system of first order differential equations of the form:
M (t, y) . y ′ = F (t, y)
The numerical integration of this system, during the combustion process, with crank angle as
the independent variable, is obtained by using a Runge-Kutta type method, to determine the
following variables mu(θ) , mb (θ) ,Vu(θ) , Vb (θ) , P(θ) ,Tu(θ) and Tb (θ).
A Matlab program is developed to simulate the engine operation. The program allows the use
of a variable increment to allow an acceptable accuracy with a minimized calculation time.
For the initial values, at inlet valve opening, the thermodynamic cycle simulation starts with
assumed guesses of the values of pressure and temperature of the contents within the cylinder.
Those values are used in order to estimate the initial value for the mass of the content within
the cylinder, via the ideal gases equation applied to the burned gas mass. At each crank angle,
the flow rate of inlet fresh gases and exhaust gases are calculated. Hence, the mixture within
the cylinder is well defined for each angle. After two crankshaft revolutions, the calculated
values of pressure and temperature are compared to the initial guesses. If the calculated values
are not within an acceptable tolerance to the initial guesses, the simulation is repeated using
the final calculated values as initial guesses [1,2,5]. Moreover, experimental data are used for
model validation.
3. Experimental setup description
3.1. Description of facilities
For comparison and validation, experimental data are used. The experimental setup consists
of a single cylinder Lister Peter direct injection Diesel engine, adapted for gas carburetion
(Fig. 2). The combustion chamber is a bowl-in-piston type (Fig. 3).

14
Fig. 2. Lister-Petter Bench engine The engine specifications and bowl dimensions are provided in Table 2. The engine is
naturally aspired. Tests were conducted at a constant speed (1500 rpm).
Table 2: Engine Specifications
Constructor LISTER-PETER
Engine type Four strokes Spark
ignition Number of cylinders Single cylinder
Cooling Air cooled Bore x stroke 95.5 x 88.7 mm
Volumetric capacity 635 cm3 Dead volume 53 cm3
Compression ratio 12.98 : 1 Connecting road length 165.3 mm
IVO 44° c.a. before TDC IVC 71° c.a after BDC EVO 86° c.a. before BDC EVC 58° c.a after TDC
Inlet valve diameter 45.4 mm Inlet valve max lift 10 mm
Exhaust valve diameter 37.8 mm Exhaust valve max lift 10 mm
Bowl diameter 45 mm Bowl depth 15 mm
Bowl eccentricity 6.25 mm

15
Fig. 3. Illustration of the geometrical configuration of the piston (a)
and the cylinder head (b). 3.2. Experimental data acquisition system Two acquisition modes are used (Fig. 4):
Fig. 4. Experimental measures acquisition system synoptic
• Slow acquisition (0.5 Hz): The data concerned by this type of acquisition are the air
and fuel flow rates.
(a) (b)
16
Natural gas flow rate is measured using a thermal mass flowmeter (Instrutec F112AC-HB-
55V). This type of flowmeter allows 1% precision measure. Flow rate measure takes into
consideration the gas composition. Like for the burned gas flow, the air intake is in
pulsated mode. The existence of this mode requires the use of a buffer volume in order to
deaden the flow pulsations. Consequently, the use of an orifice flowmeter becomes
possible to measure the air flow. This one is made of a diaphragm of 70 mm diameter
installed at the buffer volume inlet.
The equivalent air fuel ratio is calculated in two ways: either from the gas to air ratio, or
from the exhaust gas analysis.
• Quick acquisition (90 kHz): This type of acquisition is used for the intake and in
cylinder pressures. It is also used for the crank angle measures.
The in-cylinder pressure is measured using a piezoelectric sensor AVL QH32D installed
on the cylinder head. The range of this sensor is 0-200 bar. The crank angle determination
is realized with an angular encoder (AVL 364C), installed on the crankshaft. This encoder
type allows 0.1 ° CA resolution. This acquisition management is ensured by Indiwin
software of AVL. The intake pressure is measured using a piezoresistive sensor 0-2.5 bar,
installed in the intake port.
The capacitive TDC-Sensor (AVL 428) is used to determine TDC dynamically in a
motored engine. The TDC position is determined with crank angle accuracy less than
0.1° CA [23].

17
4. Study purposes and strategy
In the previous studies, using two-zone models, many choices are made for heat transfer
evaluation and no choice influence study has been carried out, in the literature. The current
study aims to investigate the effect of the choice of both the heat transfer correlation and
burned zone heat transfer area calculation method and provide an optimized choice for a more
efficient two-zone thermodynamic model, in the case of natural gas SI engines.
Firstly, in order to investigate the importance of the heat transfer correlation choice, the
influence of the correlation selection on the calculated performances is studied. After that, the
influence of the correlation accuracy in the pertinence of a two-zone model, by selection of
realistic Wiebe function parameters is highlighted. Lastly, in order to provide an optimized
correlation choice for SI engines, our experimental results are used to explore for an
optimized choice of the heat transfer correlation. The results showed a same tendency for all
the cases investigated despite the limited experimental setup. The engine used for comparison
is just one at a single rotation speed. Therefore, in order to get more general and reliable
conclusions, a literature survey of many other studies [18,22,24], which were based on
measured heat transfer rates for different SI engines, is conducted. Their results are in
concordance with our experimental results. Hence, conclusions based on our experimental
results and on a literature investigation are deduced.
Finally, the influence of the heat transfer area calculation method is investigated. Two,
practical methods are examined.

18
5. Results and discussion
5.1 Heat transfer correlation choice
a. Influence of the heat transfer correlation choice on calculated performances
In order to show the effect of the heat transfer correlation on the calculated engine's
performances, two cases are exhibited (Fig. 5 a, b).
To highlight this influence, the main parameter used, is the cylinder pressure. This choice is
not fortuitous. It is justified by two reasons. First, it is one of the main outputs of a two- zone
model, which is the calculation tool under consideration. Also, it is the calculation base for
several other engine performances. A mean pressure cycle was obtained by averaging
100 cycles acquired in sequence [25].
Moreover, a good prediction of the cylinder pressure during combustion can be used to detect
the risk of the knock phenomenon. The in cylinder temperature can also be used for this
purpose. Knock is an abnormal combustion in the cylinder of spark ignition (SI) engines. It is
the result of autoignition of one part of the end gas because of the rise in temperature and
pressure due to propagation of the primary flame front [26]. This phenomenon is very
undesirable because it results in lower engine efficiency, an increase of some emissions and
even leads to destruction of the engine under heavy knock operation.
Thus, It appears clearly (Fig. 5, 6, 7), the influence of the heat transfer correlation choice in
the resulting engine cycle performances. To explain this influence, the heat transfer
coefficient and the burned gas zone heat flux have been traced (Fig. 8, 9). The details are
given while discussing each correlation alone, hereafter.

19
Also, if the engine is subject to high mechanical and thermal loads, it can lead to its damage.
Prediction of such risks is of a great importance. Predicted maximum pressure and maximum
temperature can be used for this objective. However, the cases exhibited (Fig. 6, 7) show
visibly the influence of the correlation choice on the predicted Maximum pressure and
maximum temperature. In fact, the difference in the maximum pressure exceeds 5 bars, and is
around 100 °C for the maximum temperature.
Even though, it’s well known that 2 zone models cannot pretend for big prediction accuracy,
but they can be a good first investigation tool, if well constructed. However, if the above
mentioned differences are added to the inaccuracies produced by the model approximations,
this will diminish considerably the model value.
b. Influence of the correlation accuracy on the two-zone model pertinence
Two-zone model is one of the experimentally based simulation tools. Generally, for SI
engines, Wiebe function (Eq. 7) is used for heat release evaluation. In this function, aw and mw
are adjustable parameters which fix the shape of the curve [12]. The parameter aw interprets
the burned fuel mass fraction compared to the introduced fuel mass. Considered 99.9% of the
fuel introduced as burned, gives a value of 6.908 for aw. The variation of the form factor mw,
involves a dissymmetry of the distribution, therefore of the heat release. A low value involves
very violent combustion beginning. The increase in m generates late combustions and a shift
of the combustion peak [11].
Model calibration implies choice of those parameters. The calibration is as more efficient as
those parameters are realistic. The use of the calibrated model for new engines, in a predictive
manner, to provide some qualitative trends, is then more efficient. However, those parameters
are more realistic when the calibration is carried while using a more accurate heat transfer

20
model. Hence, the two-zone model pertinence depends on the heat transfer correlation
convenience.
c- Heat transfer correlation choice optimization
Correlation choice for an optimized two-zone model must take into consideration the results
accuracy, but also its practical convenience and calculation time.
Our experimental pressure results are used to explore for an optimized choice of the heat
transfer correlation.
Actually, the cylinder pressure prediction depends on the heat transfer and the heat release
rates estimations, for of course, same engine design and operating conditions. However, for a
given heat release rate, the cylinder pressure depends only on the heat transfer correlation
choice.
For the investigated cases, in order to see the influence of the heat transfer correlation choice,
the Wiebe function parameters are taken the same for all examined correlations. Moreover, to
use realistic parameters, physical considerations and several previous studies [1,3,8] for
similar cases are used for their selection. Also, they are the suitable values for the majority of
the correlations. Naturally, a check and validation is carried out on the engine. The values
used for the investigated cases are: aw = 2.1, mw = 6.9
Several operating conditions have been explored. The results showed a same tendency for all
the cases studied even though with limited experimental setup. Two cases are exhibited
(Fig. 5 a, b).
However, in order to provide more reliable and general conclusions, results of many other
studies [18,22,24] in the literature, which were based on measured heat transfer rates for
different SI engines are investigated. They are in concordance with our experimental results.
They are given while discussing each correlation separately, hereafter.

21
• Woschni: Like noted by Hohenberg [18], this correlation underestimates the heat
transfer coefficient during compression and over-estimates it during combustion.
However, the effect on the cycle performance is negligible.
This correlation separates the referenced gas velocity into two parts: the unfired gas
velocity that is proportional to the mean piston speed; and the time-dependent,
combustion induced gas velocity that is a function of the difference between the
motoring and firing pressures. Its need to motoring pressure makes it difficult to use. It
also needs more calculation time comparing to other correlations.
• Hohenberg: It gives the closest results to our experimental data. Besides, like
mentioned before, Hohenberg [18] proposed this correlation, as an improvement, to
mitigate some lacks noted on the Woschni correlation. Also, the deficiency of the
Eichelberg correlation during compression is no more found with the results of this
correlation (Fig. 8 a, b). Moreover, it is easy to use, and the calculation time is
minimized. Almost no tuning has to be performed. It is our best choice.
• Eichelberg: Except for compression stroke (Fig. 8), as mentioned in reference [24],
this correlation results are acceptable. Moreover, Shayler [22] calculated heat transfer
using Woschni’s, Annand’s, and Eichelberg’s experimental models for SI engines. It
was found that Eichelberg’s model could produce prediction results closest to the
experimental data.
Like Hohenberg’s correlation, it’s easy to use, and the calculation time is minimized.
Almost no tuning has to be performed. So, it’s a second choice
• Annand: This correlation, comparing to others, includes radiation term. However, this
term doesn’t have a big influence in SI engines.

22
On the other hand, tuning coefficient has a big effect on the heat transfer coefficient
and the corresponding engine cycle performance. In fact, if the (a) parameter is set to
0.8, the heat transfer coefficient is overestimated (Fig. 8) and hence the engine cycle
performance is underestimated (Fig. 5, 6, 7). This makes it not very interesting to use
in thermodynamic models.
• Sitkei: The heat transfer coefficient is underestimated (Fig. 8) and the engine cycle
performance is consequently overestimated (Fig. 5, 6, 7). The accuracy in this case is
not acceptable.
The following table summarizes the previous comparing elements. It is an interesting tool. It
can be used as a guide for correlation choice, basing on several criteria, for SI engines.
Table 3: Correlations comparison
Accuracy Use Calculation
time Tuning
Hohenberg
Good Easy Good No tuning
Eichelberg
Acceptable Easy Good No tuning
Woschni
Acceptable Difficult More Need
Annand
Depends on tuning
Easy Good Big
influence
Sitkei
Not acceptable
Easy Good Need

23
200 250 300 350 400 4500
1
2
3
4
5
6x 10
6
Crank angle ( °V)
Pre
ssur
e (P
a)
360 370 380 390
5
5.2
5.4
5.6
5.8
x 106
Experience
Woschni
Hohenberg
Annand08
Annand035
Eichelberg
Sitkei
(a)
200 250 300 350 400 4500
0.5
1
1.5
2
2.5
3
3.5
4
4.5x 10
6
Crank angle (°V)
Pre
ssur
e (
Pa)
365 370 375 380 385 390 3953.4
3.6
3.8
4
4.2
x 106
Experience
Woschni
Hohenberg
Annand 08
Annand 035
Sitkei
Eichelberg
(b)
Fig. 5. Pressure comparison for different correlations within two cases: (a) Ø=1,α=9° c.a, Full load (b) Ø=1,α=9° c.a, Partial load
Maximum Pressure variation according to Correlation
50
51
52
53
54
55
56
57
58
59
60
1
Pm
ax (
bar
)
ExperienceHohenbergWoschniSitkeiAnnand035Annand08Eichelberg
Maximum Pressure variation according to Correlation
37
38
39
40
41
42
43
44
1
Pm
ax (
bar
)
ExperienceHohenbergWoschniSitkeiAnnand035Annand08Eichelberg
(a) (b)
Fig. 6. Maximum Pressure comparison for different correlations within two cases: (a) Ø=1,α=9° c.a, Full load (b) Ø=1,α=9° c.a, Partial load

24
Maximum Temperature variation according to Correlation
2220
2240
2260
2280
2300
2320
2340
2360
2380
1
Tmax
(K)
HohenbergWoschniSitkeiAnnand035Annand08Eichelberg
Maximum Temperature variation according to Correlation
2180
2200
2220
2240
2260
2280
2300
2320
2340
2360
1
Tmax
(K)
HohenbergWoschniSitkeiAnnand035Annand08Eichelberg
(a) (b)
Fig. 7. Maximum temperature comparison for different correlations within two cases: (a) Ø=1,α=9° c.a, Full load (b) Ø=1,α=9° c.a, Partial load
250 300 350 400 4500
500
1000
1500
2000
2500
3000
Crank angle (°V)
h (W
/m2.
K)
WoshniHohenbergAnnand 08
Annand 035
EichelbergSitkei
250 300 350 400 4500
500
1000
1500
2000
2500
Crank angle (°V)
h (
W/m
2.K
)
WoschniHohenberg
Annand 08
Annand 035
SitkeiEichelberg
(a) (b)
Fig. 8. Average heat transfer coefficient comparison for different correlations within two cases: (a) Ø=1,α=9° c.a, Full load (b) Ø=1,α=9° c.a, Partial load
355 360 365 370 375 380 385 3900
0.5
1
1.5
2
2.5
3
3.5
4
4.5
5x 10
6
Crank angle (°V)
qbg
(W/m
2)
WoschniHohenberg
Annand08
Annand035
EichelbergSitkei
360 365 370 375 380 385 3900
0.5
1
1.5
2
2.5
3
3.5
4x 10
6
Crank angle (°V)
qbg
(W/m
2)
WoschniHohenberg
Annand 08
Annand 035
SitkeiEichelberg
(a) (b)
Fig. 9. Burned gas zone heat flux density comparison for different correlations within two cases: (a) Ø=1,α=9° c.a, Full load (b) Ø=1,α=9° c.a, Partial load

25
5.2 Heat transfer area calculation method influence
Two calculation methods used in previous studies have been compared
• First method
The heat transfer rates for both zones were determined as if each of the zones filled the entire
cylinder.
Then, the heat transfer rates were multiplied by the fraction of the cylinder volume that is
occupied by the zone. This method of volume weighting was used by Shapiro and Van
Gerpen [27] and by Soylu [2].
AVV
VA
bu
bb ⋅
+= (16) A
VV
VA
bu
uu ⋅
+= (17)
• Second method
The combustion chamber wall area in contact with the burned gases is assumed to be
proportional to the square root of the burned mass fraction to account for the greater volume
filled by burned gases against the unburned volume as suggested by Ferguson [28]. This
method is also used by Ibrahim and Bari [1].
AxA 2/1bb ⋅= (18) AxA bu ⋅−= )1( 2/1 (19)

26
In order to compare the results of area estimation methods, different engine operating
conditions have been considered. Two cases are exhibited (Fig. 10, 11). The heat transfer
correlation used is Hohenberg’s. The difference of heat flux is negligible (Fig. 11). Almost no
effect of the estimation method on the engine cycle performance is distinguishable (Fig. 10)
200 250 300 350 400 4500
1
2
3
4
5
6x 10
6
Crank angle (°V)
Pre
ssur
e (
Pa
)
340 360 380 400 420
4
4.5
5
5.5
x 106
Method 1
Method 2
250 300 350 400 4500
1
2
3
4
5
6x 10
6
Crank angle ( °V)
Pre
ssur
e (
Pa
)340 360 380 400
3.5
4
4.5
5
5.5x 10
6 Method 1
Method 2
(a) (b)
Fig. 10. Pressure comparison for different heat transfer area calculation methods within two cases: (a) Ø=1, α=9° c.a, Full load (b) Ø=0.85, α=17° c.a, Partial load
355 360 365 370 375 380 385 3900
0.5
1
1.5
2
2.5
3
3.5x 10
4
Crank angle (°V)
Hea
t flu
x (W
)
Burned Gas(Method 1)
Unburned Gas(Method1)Unburned Gas (Method 2)
Burned Gas(Method 2)
350 355 360 365 370 375 380 385 390
0
0.5
1
1.5
2
2.5
3
3.5x 10
4
Crank angle (°V)
Hea
t flu
x (
W )
Burned Gas(Method 1)
Unburned Gas(Method 1)Unburned Gas(Method 2)
Burned Gas (Method 2)
(a) (b)
Fig. 11. Heat flux comparison for different heat transfer area calculation methods within two cases:
(a) Ø=1,α=9° c.a, Full load (b) Ø=0.85,α=17° c.a, Partial load

27
6. Conclusion In previous works using two-zone model for natural gas SI engines, many heat transfer
correlations and heat transfer area estimation methods have been used and no choice
justification has been given.
In order to provide an optimized tool for future studies, using thermodynamic modeling for SI
natural gas engines, the two aspects have been investigated in the present work. First, the
effect of heat transfer correlation choice has been studied. The most known correlations have
been tested and compared considering different aspects. Our experimental pressure results,
supported for more general and reliable conclusions, by a literature survey of many other
studies, based on measured heat transfer rates for several SI engines, are used for correlation
selection. It is found that Hohenberg’s correlation is the best choice. It gives the more
accurate results. It is easy to use, and the calculation time is minimized. Almost no tuning has
to be performed. Even though not like the first one, Eichelberg’s correlation is also an
acceptable choice.
For the heat transfer area calculation, two estimation methods, used in previous studies, have
been tested. Even though the volume weighting method seems to be more logical, it is found
that the influence of the method is negligible.
Notation A Instantaneous surface area exposed to heat transfer, [m2] B Cylinder bore or diameter, [m] Gr Grasshof number, [-]
h Enthalpy, [J.kg-1] hg Gas-wall heat transfer coefficient, [W/m2 K] kg Thermal conductivity of the gas, [W/m K] m Mass of the gas, [kg] N Engine rotational speed, [rpm] Nu Nusselt number, [-]
28
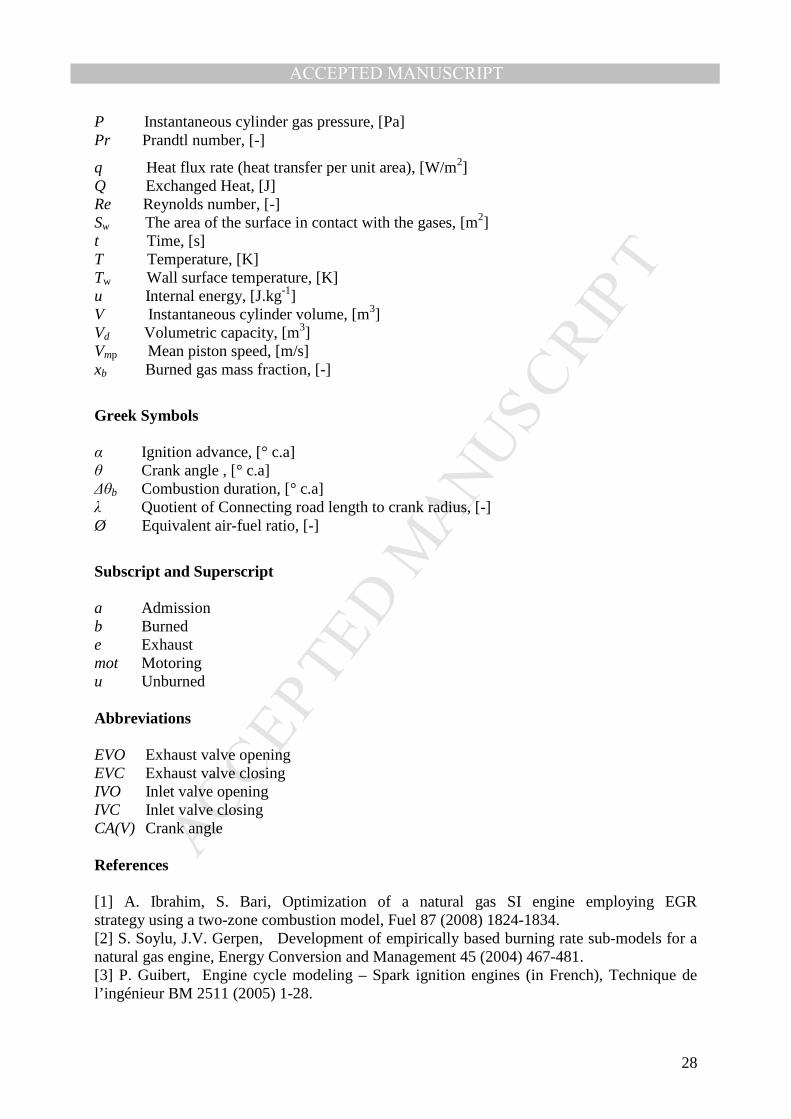
P Instantaneous cylinder gas pressure, [Pa] Pr Prandtl number, [-]
q Heat flux rate (heat transfer per unit area), [W/m2] Q Exchanged Heat, [J] Re Reynolds number, [-] Sw The area of the surface in contact with the gases, [m2] t Time, [s] T Temperature, [K] Tw Wall surface temperature, [K] u Internal energy, [J.kg-1] V Instantaneous cylinder volume, [m3] Vd Volumetric capacity, [m3] Vmp Mean piston speed, [m/s] xb Burned gas mass fraction, [-]
Greek Symbols α Ignition advance, [° c.a] θ Crank angle , [° c.a] ∆θb Combustion duration, [° c.a] λ Quotient of Connecting road length to crank radius, [-] Ø Equivalent air-fuel ratio, [-]
Subscript and Superscript a Admission b Burned e Exhaust mot Motoring u Unburned Abbreviations EVO Exhaust valve opening EVC Exhaust valve closing IVO Inlet valve opening IVC Inlet valve closing CA(V) Crank angle References [1] A. Ibrahim, S. Bari, Optimization of a natural gas SI engine employing EGR strategy using a two-zone combustion model, Fuel 87 (2008) 1824-1834. [2] S. Soylu, J.V. Gerpen, Development of empirically based burning rate sub-models for a natural gas engine, Energy Conversion and Management 45 (2004) 467-481. [3] P. Guibert, Engine cycle modeling – Spark ignition engines (in French), Technique de l’ingénieur BM 2511 (2005) 1-28.

29
[4] A. Franco, L. Martorano, Evaluations on the heat transfer in the small two-stroke engines, SAE Paper No. 980762, 1998. [5] A. Ibrahim, S. Bari, A comparison between EGR and lean-burn strategies employed in a natural gas SI engine using a two-zone combustion model, Energy Conversion and Management 50 (2009) 3129–3139. [6] C. Caillol, G. Berardi, G. Brecq, M. Ramspacher, P. Meunier, A simulation tool for evaluating gas composition effects on engine performance, International Gas Research Conference 2004, 1–19. [7] S. Soylu, Examination of combustion characteristics and phasing strategies of natural gas HCCI engine. Energy Conversion and Management 46 (2005) 101–119. [8] E. Ollivier, Contribution to the characterization of heat transfer in spark ignition engines (in French). Application to knock detection, PhD thesis ENSTIM de Nantes, 2006. [9] D. Descieux, M. Feidt, One zone thermodynamic model simulation of an ignition compression engine. Applied Thermal Engineering 27 (2007) 1457–1466. [10] C.D. Rakopoulos, D.C. Rakopoulos, G.C. Mavropoulos, E.G. Giakoumis, Experimental and theoretical study of the short-term response temperature transients in the cylinder walls of a Diesel engine at various operating conditions. Appl. Thermal Eng. 24 (2004) 679–702. [11] P. Guibert, Engine cycle modeling – Zero-dimensional approach (in French), Technique de l’Ingénieur BM 2510 (2005) 1–16. [12] J. Heywood, Internal combustion engine fundamentals, McGraw-Hill, New York, 1988. [13] J. Chang, O. Guralp, Z. Filipi, D. Assanis, T. Kuo, P. Najt, New Heat Transfer Correlation for an HCCI Engine Derived from Measurements of Instantaneous Surface Heat Flux, SAE Paper No. 2004-01-2996, 2004. [14] G. Eichelberg, Some New Investigations on Old Combustion Engine Problems, Engineering 148 (1939) 446–463. [15] W.J.D. Annand, Heat Transfer in the Cylinder of Reciprocating Internal Combustion Engines. Proc. Instn Mech. Engrs. 177 (1963) 973–990. [16] G. Woschni, A Universally Applicable Equation for the instantaneous Heat Transfer Coefficient in the Internal Combustion Engine, SAE Paper No. 670931, 1967. [17] G. Sitkei, G.V. Ramanaiah, Rational Approach for Calculation of Heat Transfer in Diesel Engines. SAE Paper No. 720027, 1972. [18] G.F. Hohenberg, Advanced Approaches for Heat Transfer Calculations. SAE Paper No. 790825, 1979. [19] J.D. Trapy, Heat transfer in internal combustion engines – Measurement and modeling (in French), Revue Générale de Thermique 233 (1981) 385–390. [20] G. Borman, K. Nishiwaki, Internal combustion engine heat transfer, Progress in Energy and Combustion Science 13 (1987) 1–46. [21] T. Oguri, On the coefficient of heat transfer between gases and cylinder walls of the spark-ignition engine, Bull. JSME 11(1960) 363–369. [22] P.J. Shayler, S.A. May, T. Ma, The determination of heat transfer from the combustion chambers of SI engines. SAE Paper No. 931131, 1993. [23] X. Wang, K. Deng, F. He, Z. Zhou, A thermodynamics model for the compression and expansion process during the engine’s motoring and a new method for the determination of TDC with simulation technique, Applied Thermal Engineering 27 (2007) 2003–2010. [24] Y.Y.Wu, B. Chen, F. Hsieh, Heat transfer model for small-scale air-cooled spark-ignition four-stroke engines. International Journal of Heat and Mass Transfer 49 (2006) 3895–3905. [25] A.K. Sen, G. Litak, B.F. Yao, G.X. Li, Analysis of pressure fluctuations in a natural gas engine under lean burn conditions, Applied thermal Engineering 30 (2010) 776–779.

30
[26] E. Ollivier, J. Bellettre, M. Tazerout, G.C. Roy, Detection of knock occurrence in a gas SI engine from a heat transfer analysis, Energy Conversion and Management 47 (2006) 879–893. [27] H.N. Shapiro, J.H.Van Gerpen, Two zone combustion models for second law analysis of internal combustion engines, SAE Paper No. 890823, 1989. [28] C.R. Ferguson, Internal combustion engines, Wiley & Sons, 1986.