investment performance report - pwcgov.org · this investment performance report was reviewed and...
TRANSCRIPT

Prince William County, Virginia
INVESTMENT PERFORMANCE REPORT
THIRD QUARTER -- FISCAL YEAR 2015
Quarter ended March 31, 2015
This Investment Performance Report was reviewed and accepted by the Prince William County Investment Oversight Committee on
May 27, 2015


TABLE OF CONTENTS
Section Description Page I. EXECUTIVE SUMMARY 2 II. TOTAL INVESTMENT PORTFOLIO STRUCTURE 5 III. EXCEPTIONS TO INVESTMENT POLICY 5 IV. INVESTMENT PERFORMANCE 5 A. Earnings Yield and Total Return on Investment 5 B. General Portfolio Composition 6 C. Comparison of Market Value to Amortized Cost 7 D. Average Invested Balances 7 E. Performance Benchmarks 8 F. Investment Income 10 G. Comparative Total Return 10 V. NATIONAL ECONOMIC AND INTEREST RATE OUTLOOK 12 VI. INVESTMENT STRATEGY 12 ATTACHMENTS: A. General Portfolio Holdings as of March 31, 2015
B. Portfolio Composition by Asset Type as of March 31, 2015
C. Investment Statistics
D. FOMC Statement: Side-by-Side
E. Glossary of Financial Terms

I. EXECUTIVE SUMMARY This is the FY 2015 third quarter report of the County's investment management program. Prince William County's Principles of Sound Financial Management and the Investment Policy, adopted by the Board of County Supervisors, requires that the County's investment program meet four criteria, shown here in order of their importance:
Legality "Investment instruments shall, at a minimum, be limited to security, issuers and
maturities in compliance with the Code of Virginia (1950) as amended." Safety "The next objective is the preservation of capital and the protection of investment
principal. The County will employ mechanisms to control risks and diversify its investments regarding specific security types or individual financial institutions."
Liquidity "The investment portfolio will remain sufficiently liquid to enable the County to meet
operating requirements which might be reasonably anticipated." Yield "The County will maximize yield on the portfolio but will avoid unreasonable
investment risk to preserve the purchasing power of the portfolio."
Background The target Federal Funds rate trend is a significant driver for the average yield of Prince William County’s portfolio. In December of 2008, the Federal Open Market Committee (FOMC) reduced the target Federal Funds rate to a range of between 0.00% and 0.25%. The FOMC has maintained that record low target rate and announced its intention to continue this accommodative monetary policy well into calendar year 2015. While the Fed Funds rate is a major factor in determining the portfolio’s yield, the timing of securities purchases, cash flow requirements, the general interest rate environment at the time of purchasing securities, and the securities’ duration also play a part in affecting the overall portfolio yield.
The County’s General Portfolio carries an asset mix that is held over a period of time
based on yields that were available at the time of the purchases. The portfolio’s total return and yield changes to reflect swings in the market price of securities and to reflect the replacement, at current market prices and yields, of securities that are sold or mature.
Prince William County’s investment strategy addresses the requirements of legality, safety, and liquidity by investing in a diversified portfolio with specific security types, financial institutions, and sufficient liquidity to meet anticipated operating requirements. In addition, the County seeks to match its cash flow needs to the overall maturity structure of the portfolio in order to maximize yield.
The portfolio management process has been challenging over the last several years due to unprecedented occurrences in the debt and equity markets. In spite of those hurdles, the County has maintained its attention to safety and liquidity as well as produced market returns as demonstrated by the benchmark comparisons.
2

Current Situation
The first quarter of 2015, has been described as both confounding for investors and a roller coaster ride for the bond market. The 10-year U.S. Treasury yield fell sharply in January on soft economic data followed by an almost identical rise in February on news that the fed funds rate might increase in June. However rates dropped again in March when the FOMC projections implied a delayed and relatively slow rise in the fed funds rate. The minutes from the March 18, 2015, FOMC meeting reaffirmed their commitment to maintaining the target fed fund range between 0 and ¼ percent. The timing of increases in interest rates continues to be anchored by the objectives of maximum employment and inflation below 2%.
II. TOTAL INVESTMENT PORTFOLIO STRUCTURE The County's total investment portfolio is divided into two components: (a) the General Portfolio; and (b) the Restricted Portfolio. The "General Portfolio" is all funds except restricted capital project funds, the “Restricted Portfolio”, contains bond proceeds, escrows and self-insurance funds. All general fund interest income is earned from securities in the General Portfolio. The term "Total Investment Portfolio" refers to the sum of these two components.
III. EXCEPTIONS TO INVESTMENT POLICY
In accordance with Section 60-17 of the Investment Policy, specific exceptions to the policy investment guidelines are to be included as part of this report. There were no exceptions to the Investment Policy during the reporting period.
IV. INVESTMENT PERFORMANCE
The performance data provided in this report is in accordance with the County’s
Investment Policy Reporting guidelines. A. Earnings Yield and Total Return on Investment – Investment performance is
presented on both a total return basis, which includes the impact of adjusting investments to market value, and on an earnings yield basis. Total return is made up of two primary components. The first is the earnings/yield income component that is the result of coupon interest rates, principal value invested and the time period of the investments being measured. That component of the total return is fairly stable and moves slowly as new investments are added to the portfolio or investments are removed from the portfolio as securities mature. The second component of total return is determined by the change in market value of the securities at the end of the period being measured. This portion of the total return can be volatile given changes in the economic environment, Federal Reserve Board (FRB) rate policies, and significant geo-political events; but does not affect the cash flow of investments.
3

CDs5% Money Mkt
6%
NOW/Cash12%
LGIP (Pools)7%
CD - 40% Money Mkt. - 60% NOW/Cash - 100% LGIP (Pools) - 25%
Agency/Gvt. - 100% Corporates - 20% Munis - 100%
Agency/Gvt. 54%
Munis 3%Corporates
13%
The comparison of earnings yields on investments is depicted below. FY 2015/Q3 FY 2014/Q3 BP Change General Portfolio ....................................... 1.27% 1.88% -61 Restricted Portfolio ................................... 0.30% 0.45% -2 Total Investment Portfolio…………..…...1.16% 1.72% -51 The comparison of total return yields on investments is depicted below 1 :
FY 2015/Q3 FY 2014/Q3 BP Change General Portfolio ...................................... -1.1413.62% 4.89% -127 Restricted Portfolio .................................. 0.56 % 0.44% 11 Total Investment Portfolio..... .................. 3.27% 4.43% -116
Both the General Portfolio and Restricted Portfolio continued to have positive total returns as the yield curve flattened. Yields in the 5-10 year Treasuries fell another 30 basis points during the quarter. Since January of 2014, the 10-year Treasury had fallen approximately 100 basis points (2.99% Jan. 2014 to 1.92% March 2015) and hit a near-term low on January 30, 2015, of 1.64%.
B. General Portfolio Composition (at market value) as of March 31, 2015 – The County will diversify use of investment instruments to avoid incurring unreasonable risks inherent in over-investing in specific instruments, individual financial institutions or maturities while adhering to asset type limits.
1 The accounting for investments at “Market Value” on a total return basis was put in place by Government Accounting Standards Board
(GASB) Statement number 31.
4

During the third quarter of FY 2015, the County purchased $34.6 million in fixed income and money market securities with an average yield to maturity of 1.20% and maintained an average combined balance of $298.5 million in cash and cash equivalents. During the same period, securities called, sold, or matured totaled $67.2 million with an average return of 1.57%. Securities sold in the marketplace totaled $31.2 million with an average annualized yield to sale of 1.86%. Average days to maturity in the General Portfolio at March 31, 2015, were 1,235 days (3.4 years). The average days to maturity on a callable life basis were 248 days. The portfolio duration at quarter end was 3.2 years.
C. Comparison of Market Value to Amortized Cost – The amortized cost of the General Portfolio on March 31, 2015, was $927.3 million. The market value of $924.7 million is less than the amortized cost by $2.6 million or 0.3%. This difference represents market value adjustments across all asset classes.
D. Average Invested Balances – Increases in portfolio size typically come from additions to fund balance/year-end savings as well as a portion of annual revenue growth. The average invested balance of the General Portfolio, during the third quarter of FY 2015, increased, by approximately $6.8 million, to $974.2 million. On a year to date basis portfolio growth is less than 1%. The average invested balance of the Total Portfolio increased approximately $21.1 million to $1,100.6 million in the third quarter of FY 2015 compared to the prior year average balance as a result of the sale of Virginia Public School Authority Financing Bonds PWC Series 2014 (October 2014).
General Portfolio FY2015/Q3 FY2014/Q3 Change FY2015/YTD FY2014/YTD Change
Low $943.9 $932.1 $11.8 $851.4 $865.4 ($14.0)
High $1,017.6 $1,008.6 $9.0 $1,061.7 $1,050.7 $11.0
Average $974.2 $967.4 $6.8 $950.0 $945.8 $4.2
Total Portfolio FY2015/Q3 FY2014/Q3 Change FY2015/YTD FY2014/YTD Change
Low $1,064.5 $1,037.2 $27.3 $964.2 $997.3 ($33.1)
High $1,150.5 $1,128.5 $22.0 $1,206.0 $1,169.6 $36.4
Average $1,100.6 $1,079.5 $21.1 $1,068.0 $1,064.9 $3.1
Book Value in Millions of Dollars
5

E. Performance Benchmarks (QTR) The County money market funds, at 0.31%, continue to outperform the Virginia Local Government Investment Pool (LGIP) due to the County’s ability to utilize bank CDs and NOW accounts that often carry higher yields.
Money Market Fund Accounts vs VA LGIP
For the quarter ended March 31, 2015, the Bloomberg 1-3 Year Treasury Index, on an earnings yield basis, narrowly outperformed the County’s Non MM investments by a spread of 5 basis points.
Earnings Yield Non MM vs. Bloomberg 1-3 Year Index
6

The County’s Non-MM total return for the first quarter was 291 basis points above the Bloomberg benchmark. This was achieved as 5-10 year US Treasuries ended the quarter 20 to 30 basis points lower.
Total Return Non MM vs. Bloomberg 1-3 Year Index
The earnings yield on the General Portfolio for the quarter of 1.27% was below the Bloomberg benchmark by 46 basis points.
Earnings Yield General Portfolio vs. All Benchmarks
7

($ in 000s) FY2015/YTD FY2014/YTD
General Portfolio 18.65$ 9.67$ Restricted Portfolio 0.29 0.45 Total Portfolio 18.94$ 10.12$
Investment Income/Total Return
General Portfolio FYTDFY2015/YTD FY2014/YTD BP Change
Prince William CountyTotal Return Earnings 2.62% 1.36% 126
Earnings Yield 1.22% 1.41% -19
Bloomberg 1-3 Yr. Govt. IndexTotal Return Earnings 1.04% 0.73% 31
Earnings Yield 1.68% 1.58% 10
Virginia LGIP 0.11% 0.10% 1
90 Day T-Bills 0.03% 0.05% -2
1 Year T-Bills 0.16% 0.12% 4
2 Year T-Notes 0.55% 0.36% 19
F. Investment Income – The year-to-date total return of investment income on the Total Portfolio was $18.94 million for FY 2015 compared to $10.12 million for FY 2014. This is a direct result of the movement in interest rates.
On an earnings yield basis, the General Portfolio produced $3.1 million for the quarter and gains on sales totaled $189 thousand. The investment income forecast for FY 2015 was revised downward during the third quarter to $5.91 million. The General Fund portion of the fiscal year-to-date (FYTD) earnings revenue is $4.5 million which represents 76.25% of the investment income forecast.
G. Comparative Total Return (YTD) – For FY 2015, Prince William County's total return
on investments for the General Portfolio was 2.62%. This represents an increase of 126 basis points from the prior year. The table below provides a comparison of the returns of various government securities and funds for the fiscal year-to-date.
8

V. NATIONAL ECONOMIC AND INTEREST RATE OUTLOOK
CL The national economic and interest rate outlook will be presented by Carl Moerbe who serves as a Managing Director in Fixed Income Research for RAYMOND JAMES®. His primary responsibilities include product analysis for institutional fixed income investors with an emphasis on U.S. Agency debt, investment strategies, and portfolio analytics. Carl is experienced in working with institutional accounts regarding evaluation of investment products and interest rate risk management. He also works closely with clients to identify relative value opportunities and implement portfolio solutions to meet their management needs. He is a graduate of the University of Texas at Austin with a Bachelor of Business Administration degree in Finance and a concentration in Risk Management and Insurance. Carl holds the Chartered Financial Analyst (CFA) designation. The presentation handouts will be available at the meeting.
VI. INVESTMENT STRATEGY
The County's current investment strategy properly addresses the requirements of legality, safety and liquidity by investing in a diversified portfolio with respect to specific security types, financial institutions and sufficient liquidity to meet reasonably anticipated operating requirements. The County seeks to match its cash flow needs to the maturity structure of the portfolio in order to maximize yield. The current investment strategy attempts to:
(1) Avoid the premature sale of investments to meet day-to-day operating requirements;
(2) Avoid holding large sums of cash that earn lower-than-average money market rates in favor of investing in longer-term securities when interest rates are higher;
(3) Maintain higher balances in short-term investments when longer-term interest rates are not favorable; and
(4) Further diversify short-term investment options in order to reduce the dependence on money market funds.
The County’s portfolio currently contains no direct investments in asset-backed commercial
paper, or mortgage backed securities. Treasury Management continues to seek out value in the market where it can be found, not an easy task given current interest rates and future interest rate projections. Efforts continue to diversify money market fund concentrations into alternative short-term investment vehicles without impacting returns.
9

Open InvestmentsPrince William County
Effective Interest - Callable LifeReceipts in Period
12/31/2014CUSIP Invest
NumberSecurity
DescriptionPurchase
DateCallDate
YieldMatur
OriginalUnit Cost
OriginalPrinc/Cost
EndingPar Val/Shares
12-31-14Amor Val/Cost
1 3133EAVL9 12-0280 FFCB 1.74 06/25/19 06/25/12 06/25/13 1.7491 0.999400 3,997,600.00 4,000,000.00 4,000,000.00313379U98 12-0282 FHLB 1.25 06/28/22 06/28/12 09/28/12 3.9771 0.997500 4,987,500.00 3,125,000.00 3,125,000.003134G3YP9 13-0005 FHLMC 2.00 07/26/21 07/26/12 07/26/13 2.0305 0.997500 6,633,375.00 6,650,000.00 6,650,000.00313379PA1 13-0007 FHLB 2.55 06/14/22 07/11/12 06/14/13 2.4561 1.008220 5,041,100.00 5,000,000.00 5,000,000.003133EASA7 13-0009 FFCB 2.59 06/06/22 07/12/12 06/06/13 2.4839 1.009250 5,046,250.00 5,000,000.00 5,000,000.003134G3ZJ2 13-0010 FHLMC 2.00 07/30/21 07/30/12 07/30/13 2.0000 1.000000 2,000,000.00 2,000,000.00 2,000,000.003136G0TM3 13-0012 FNMA 2.00 10/26/21 07/26/12 07/26/13 2.0061 0.999500 3,998,000.00 4,000,000.00 4,000,000.003133805L7 13-0021 FHLB 2.25 08/08/22 08/08/12 11/08/12 2.2500 1.000000 3,000,000.00 3,000,000.00 3,000,000.00313380B30 13-0034 FHLB 2.20 08/15/22 08/15/12 11/15/12 2.2112 0.999000 5,994,000.00 6,000,000.00 6,000,000.003136G0TM3 13-0035 FNMA 2.00 10/26/21 07/26/12 07/26/13 2.0025 0.999800 7,518,496.00 7,520,000.00 7,520,000.003136G0TG6 13-0042 FNMA 2.00 07/26/22 07/26/12 07/26/13 2.0327 0.997050 5,982,300.00 6,000,000.00 6,000,000.003133807C5 13-0043 FHLB 2.20 02/15/22 08/15/12 11/15/12 2.2023 0.999800 4,999,000.00 5,000,000.00 5,000,000.003134G3B41 13-0053 FHLMC 1.00 02/22/18 08/22/12 08/22/14 1.0047 0.999750 6,498,375.00 6,500,000.00 6,500,000.00313380CB1 13-0054 FHLB 2.20 08/09/22 08/09/12 11/09/12 2.2112 0.999000 4,995,000.00 5,000,000.00 5,000,000.003133807C5 13-0056 FHLB 2.20 02/15/22 08/15/12 11/15/12 2.2176 0.998500 4,992,500.00 5,000,000.00 5,000,000.00313380CB1 13-0057 FHLB 2.20 08/09/22 08/09/12 11/09/12 2.2056 0.999500 2,998,500.00 3,000,000.00 3,000,000.00313380D87 13-0058 FHLB 2.25 08/08/22 08/08/12 11/08/12 2.2635 0.998800 4,994,000.00 5,000,000.00 5,000,000.003136G0WA5 13-0059 FNMA 2.00 08/23/22 08/23/12 08/23/13 2.0677 0.993910 3,975,640.00 4,000,000.00 4,000,000.00313380CB1 13-0062 FHLB 2.20 08/09/22 08/09/12 11/09/12 2.2336 0.997000 4,267,160.00 4,280,000.00 4,280,000.00880591EN8 13-0064 TVA 1.875 08/15/22 08/10/12 Open 2.0414 0.985000 985,000.00 1,000,000.00 988,312.433136G0XM8 13-0066 FNMA 2.30 08/26/22 08/27/12 02/26/13 2.3113 0.999000 3,996,000.00 4,000,000.00 4,000,000.003133EAL30 13-0067 FFCB 2.19 11/15/21 08/16/12 11/15/12 2.1935 0.999720 4,998,600.00 5,000,000.00 5,000,000.003136G0YX3 13-0069 FNMA 2.50 09/13/22 09/13/12 03/13/13 2.5000 1.000000 5,000,000.00 5,000,000.00 5,000,000.003136G0D65 13-0077 FNMA 2.00 09/27/22 09/27/12 09/27/13 2.1166 0.989500 2,968,500.00 3,000,000.00 3,000,000.00313380NV5 13-0079 FHLB 2.30 09/27/22 09/27/12 12/27/12 2.3113 0.999000 4,995,000.00 4,687,500.00 4,687,500.00313380MS3 13-0087 FHLB 1.375 09/26/22 09/26/12 12/26/12 2.6982 0.998000 1,387,220.00 1,390,000.00 1,390,000.003136G0J28 13-0088 FNMA 0.50 09/27/17 09/27/12 09/27/13 1.0967 1.000000 3,000,000.00 3,000,000.00 3,000,000.00313380Z26 13-0112 FHLB 0.625 10/24/16 11/13/12 01/24/13 0.6301 0.999800 3,999,200.00 4,000,000.00 4,000,000.003133EC3M4 13-0116 FFCB 0.60 11/21/16 11/21/12 11/21/13 0.6127 0.999500 4,997,500.00 5,000,000.00 5,000,000.003136G06Z9 13-0118 FNMA 0.65 12/13/16 12/13/12 12/13/13 0.6627 0.999500 4,997,500.00 5,000,000.00 5,000,000.003136G07A3 13-0119 FNMA 0.70 12/13/17 12/13/12 12/13/13 0.7000 1.000000 5,000,000.00 5,000,000.00 5,000,000.003136G03F6 13-0120 FNMA 2.25 10/15/22 11/16/12 11/15/13 2.1937 1.005000 4,522,500.00 4,500,000.00 4,500,000.003133EC3Y8 13-0121 FFCB 1.59 05/21/20 11/21/12 02/21/13 1.5900 1.000000 5,500,000.00 5,500,000.00 5,500,000.00313381C60 13-0124 FHLB 2.08 06/07/22 12/07/12 03/07/13 2.1068 0.997700 2,993,100.00 3,000,000.00 3,000,000.003133EC3F9 13-0125 FFCB 0.55 08/26/16 11/28/12 02/26/13 0.5635 0.999500 4,997,500.00 5,000,000.00 5,000,000.00313380Z26 13-0127 FHLB 0.625 10/24/16 11/28/12 01/24/13 0.6575 0.998750 4,993,750.00 5,000,000.00 5,000,000.003135G0PP2 13-0128 FNMA 1.00 09/20/17 12/03/12 09/20/13 0.9358 1.003000 5,015,000.00 5,000,000.00 5,000,000.00313381GY5 13-0129 FHLB 1.50 12/27/22 12/27/12 03/27/13 2.8766 0.999750 4,998,750.00 5,000,000.00 5,000,000.003136G15P0 13-0130 FNMA 1.50 12/24/20 12/24/12 12/24/14 1.5067 0.999500 4,997,500.00 5,000,000.00 5,000,000.00313381HW8 13-0133 FHLB 2.19 12/19/22 12/19/12 03/19/13 2.1987 0.999220 4,996,100.00 5,000,000.00 5,000,000.003136G16D6 13-0135 FNMA 1.35 06/26/20 12/26/12 06/26/15 1.3641 0.999000 4,995,000.00 5,000,000.00 4,999,014.263136G15D7 13-0137 FNMA 0.75 12/27/19 12/27/12 12/27/13 2.2801 0.998250 4,991,250.00 5,000,000.00 5,000,000.00
Attachment A
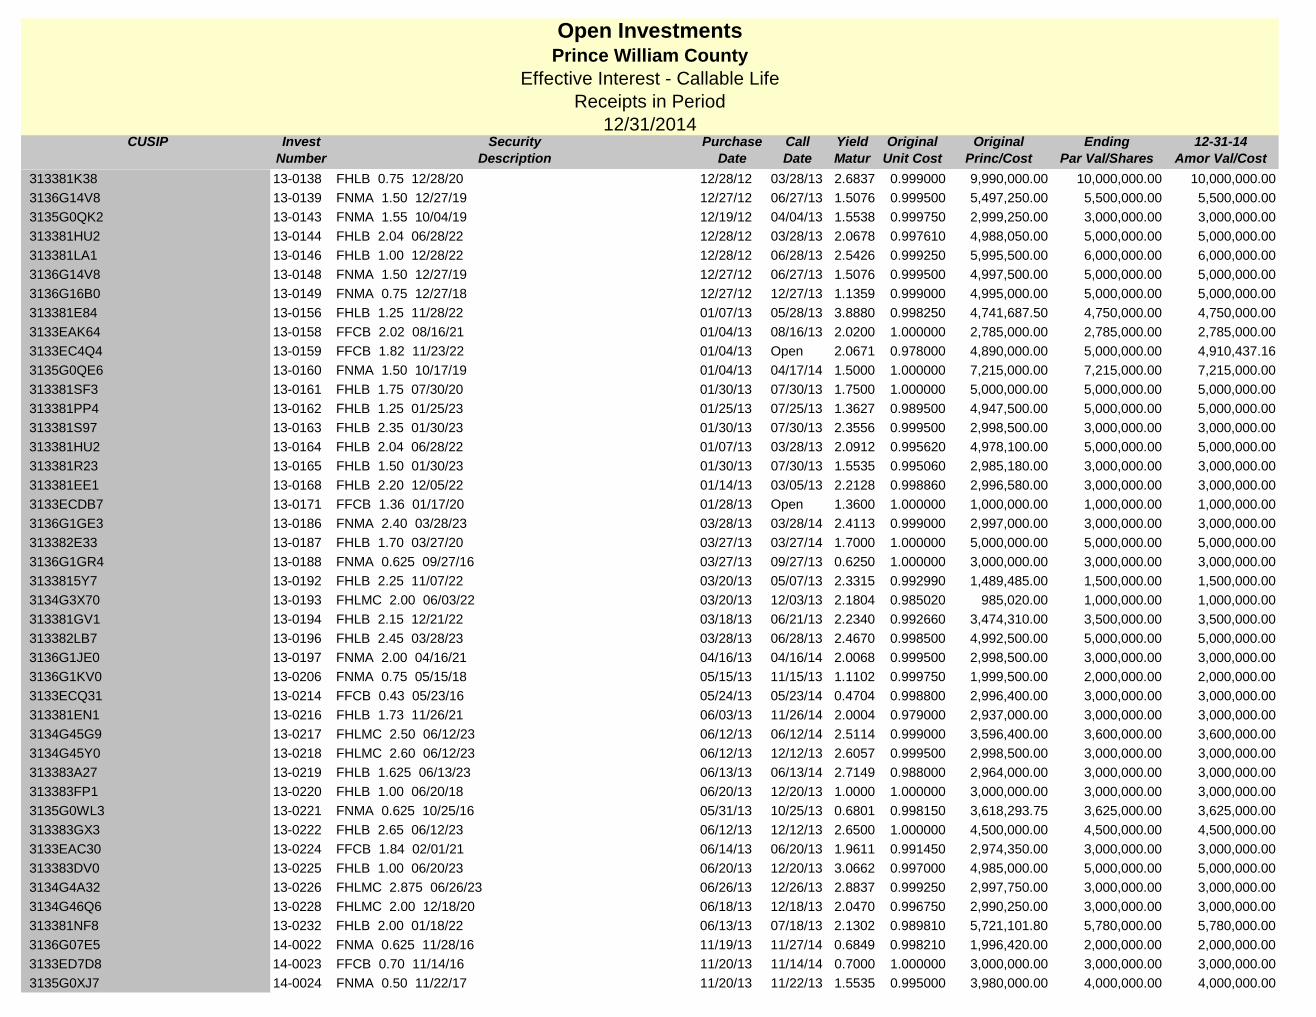
Open InvestmentsPrince William County
Effective Interest - Callable LifeReceipts in Period
12/31/2014CUSIP Invest
NumberSecurity
DescriptionPurchase
DateCallDate
YieldMatur
OriginalUnit Cost
OriginalPrinc/Cost
EndingPar Val/Shares
12-31-14Amor Val/Cost
313381K38 13-0138 FHLB 0.75 12/28/20 12/28/12 03/28/13 2.6837 0.999000 9,990,000.00 10,000,000.00 10,000,000.003136G14V8 13-0139 FNMA 1.50 12/27/19 12/27/12 06/27/13 1.5076 0.999500 5,497,250.00 5,500,000.00 5,500,000.003135G0QK2 13-0143 FNMA 1.55 10/04/19 12/19/12 04/04/13 1.5538 0.999750 2,999,250.00 3,000,000.00 3,000,000.00313381HU2 13-0144 FHLB 2.04 06/28/22 12/28/12 03/28/13 2.0678 0.997610 4,988,050.00 5,000,000.00 5,000,000.00313381LA1 13-0146 FHLB 1.00 12/28/22 12/28/12 06/28/13 2.5426 0.999250 5,995,500.00 6,000,000.00 6,000,000.003136G14V8 13-0148 FNMA 1.50 12/27/19 12/27/12 06/27/13 1.5076 0.999500 4,997,500.00 5,000,000.00 5,000,000.003136G16B0 13-0149 FNMA 0.75 12/27/18 12/27/12 12/27/13 1.1359 0.999000 4,995,000.00 5,000,000.00 5,000,000.00313381E84 13-0156 FHLB 1.25 11/28/22 01/07/13 05/28/13 3.8880 0.998250 4,741,687.50 4,750,000.00 4,750,000.003133EAK64 13-0158 FFCB 2.02 08/16/21 01/04/13 08/16/13 2.0200 1.000000 2,785,000.00 2,785,000.00 2,785,000.003133EC4Q4 13-0159 FFCB 1.82 11/23/22 01/04/13 Open 2.0671 0.978000 4,890,000.00 5,000,000.00 4,910,437.163135G0QE6 13-0160 FNMA 1.50 10/17/19 01/04/13 04/17/14 1.5000 1.000000 7,215,000.00 7,215,000.00 7,215,000.00313381SF3 13-0161 FHLB 1.75 07/30/20 01/30/13 07/30/13 1.7500 1.000000 5,000,000.00 5,000,000.00 5,000,000.00313381PP4 13-0162 FHLB 1.25 01/25/23 01/25/13 07/25/13 1.3627 0.989500 4,947,500.00 5,000,000.00 5,000,000.00313381S97 13-0163 FHLB 2.35 01/30/23 01/30/13 07/30/13 2.3556 0.999500 2,998,500.00 3,000,000.00 3,000,000.00313381HU2 13-0164 FHLB 2.04 06/28/22 01/07/13 03/28/13 2.0912 0.995620 4,978,100.00 5,000,000.00 5,000,000.00313381R23 13-0165 FHLB 1.50 01/30/23 01/30/13 07/30/13 1.5535 0.995060 2,985,180.00 3,000,000.00 3,000,000.00313381EE1 13-0168 FHLB 2.20 12/05/22 01/14/13 03/05/13 2.2128 0.998860 2,996,580.00 3,000,000.00 3,000,000.003133ECDB7 13-0171 FFCB 1.36 01/17/20 01/28/13 Open 1.3600 1.000000 1,000,000.00 1,000,000.00 1,000,000.003136G1GE3 13-0186 FNMA 2.40 03/28/23 03/28/13 03/28/14 2.4113 0.999000 2,997,000.00 3,000,000.00 3,000,000.00313382E33 13-0187 FHLB 1.70 03/27/20 03/27/13 03/27/14 1.7000 1.000000 5,000,000.00 5,000,000.00 5,000,000.003136G1GR4 13-0188 FNMA 0.625 09/27/16 03/27/13 09/27/13 0.6250 1.000000 3,000,000.00 3,000,000.00 3,000,000.003133815Y7 13-0192 FHLB 2.25 11/07/22 03/20/13 05/07/13 2.3315 0.992990 1,489,485.00 1,500,000.00 1,500,000.003134G3X70 13-0193 FHLMC 2.00 06/03/22 03/20/13 12/03/13 2.1804 0.985020 985,020.00 1,000,000.00 1,000,000.00313381GV1 13-0194 FHLB 2.15 12/21/22 03/18/13 06/21/13 2.2340 0.992660 3,474,310.00 3,500,000.00 3,500,000.00313382LB7 13-0196 FHLB 2.45 03/28/23 03/28/13 06/28/13 2.4670 0.998500 4,992,500.00 5,000,000.00 5,000,000.003136G1JE0 13-0197 FNMA 2.00 04/16/21 04/16/13 04/16/14 2.0068 0.999500 2,998,500.00 3,000,000.00 3,000,000.003136G1KV0 13-0206 FNMA 0.75 05/15/18 05/15/13 11/15/13 1.1102 0.999750 1,999,500.00 2,000,000.00 2,000,000.003133ECQ31 13-0214 FFCB 0.43 05/23/16 05/24/13 05/23/14 0.4704 0.998800 2,996,400.00 3,000,000.00 3,000,000.00313381EN1 13-0216 FHLB 1.73 11/26/21 06/03/13 11/26/14 2.0004 0.979000 2,937,000.00 3,000,000.00 3,000,000.003134G45G9 13-0217 FHLMC 2.50 06/12/23 06/12/13 06/12/14 2.5114 0.999000 3,596,400.00 3,600,000.00 3,600,000.003134G45Y0 13-0218 FHLMC 2.60 06/12/23 06/12/13 12/12/13 2.6057 0.999500 2,998,500.00 3,000,000.00 3,000,000.00313383A27 13-0219 FHLB 1.625 06/13/23 06/13/13 06/13/14 2.7149 0.988000 2,964,000.00 3,000,000.00 3,000,000.00313383FP1 13-0220 FHLB 1.00 06/20/18 06/20/13 12/20/13 1.0000 1.000000 3,000,000.00 3,000,000.00 3,000,000.003135G0WL3 13-0221 FNMA 0.625 10/25/16 05/31/13 10/25/13 0.6801 0.998150 3,618,293.75 3,625,000.00 3,625,000.00313383GX3 13-0222 FHLB 2.65 06/12/23 06/12/13 12/12/13 2.6500 1.000000 4,500,000.00 4,500,000.00 4,500,000.003133EAC30 13-0224 FFCB 1.84 02/01/21 06/14/13 06/20/13 1.9611 0.991450 2,974,350.00 3,000,000.00 3,000,000.00313383DV0 13-0225 FHLB 1.00 06/20/23 06/20/13 12/20/13 3.0662 0.997000 4,985,000.00 5,000,000.00 5,000,000.003134G4A32 13-0226 FHLMC 2.875 06/26/23 06/26/13 12/26/13 2.8837 0.999250 2,997,750.00 3,000,000.00 3,000,000.003134G46Q6 13-0228 FHLMC 2.00 12/18/20 06/18/13 12/18/13 2.0470 0.996750 2,990,250.00 3,000,000.00 3,000,000.00313381NF8 13-0232 FHLB 2.00 01/18/22 06/13/13 07/18/13 2.1302 0.989810 5,721,101.80 5,780,000.00 5,780,000.003136G07E5 14-0022 FNMA 0.625 11/28/16 11/19/13 11/27/14 0.6849 0.998210 1,996,420.00 2,000,000.00 2,000,000.003133ED7D8 14-0023 FFCB 0.70 11/14/16 11/20/13 11/14/14 0.7000 1.000000 3,000,000.00 3,000,000.00 3,000,000.003135G0XJ7 14-0024 FNMA 0.50 11/22/17 11/20/13 11/22/13 1.5535 0.995000 3,980,000.00 4,000,000.00 4,000,000.00

Open InvestmentsPrince William County
Effective Interest - Callable LifeReceipts in Period
12/31/2014CUSIP Invest
NumberSecurity
DescriptionPurchase
DateCallDate
YieldMatur
OriginalUnit Cost
OriginalPrinc/Cost
EndingPar Val/Shares
12-31-14Amor Val/Cost
3134G4MB1 14-0025 FHLMC 1.50 12/18/18 12/18/13 09/18/15 1.5000 1.000000 3,000,000.00 3,000,000.00 3,000,000.003134G4MD7 14-0026 FHLMC 1.00 06/19/17 12/19/13 03/19/14 1.0000 1.000000 4,000,000.00 4,000,000.00 4,000,000.003134G4M88 14-0027 FHLMC 1.375 12/18/18 12/18/13 06/18/15 1.3750 1.000000 3,000,000.00 3,000,000.00 3,000,000.003135G0XA6 14-0030 FNMA 1.03 05/21/18 11/25/13 05/21/14 1.4456 0.982000 4,222,600.00 4,300,000.00 4,300,000.003135G0XJ7 14-0031 FNMA 0.50 11/22/17 11/25/13 11/22/13 1.5946 0.994000 3,976,000.00 4,000,000.00 3,982,552.633136G1KD0 14-0032 FNMA 1.00 04/30/18 12/04/13 04/30/14 1.3272 0.986040 3,944,160.00 4,000,000.00 4,000,000.003134G4M96 14-0033 FHLMC 2.00 12/13/23 12/13/13 03/13/14 2.0825 0.992590 4,962,950.00 5,000,000.00 5,000,000.003134G46E3 14-0036 FHLMC 2.625 06/13/23 12/24/13 03/13/14 3.5000 0.929980 4,449,954.30 4,785,000.00 4,785,000.003133EA4F2 14-0038 FFCB 0.64 01/11/17 12/26/13 01/11/13 0.8301 0.994300 4,971,500.00 5,000,000.00 4,980,922.523130A0HH6 14-0041 FHLB 1.00 06/27/17 01/02/14 03/27/14 1.1100 0.996250 3,985,000.00 4,000,000.00 4,000,000.00313381H40 14-0043 FHLB 1.50 12/28/22 01/07/14 03/28/14 3.7572 0.911800 1,727,861.00 1,895,000.00 1,895,000.003134G32K5 14-0044 FHLMC 2.05 12/19/23 01/08/14 03/19/14 3.5429 0.875000 1,750,000.00 2,000,000.00 2,000,000.003136G1LL1 14-0045 FNMA 1.00 05/15/19 01/10/14 02/15/14 2.0836 0.968280 4,841,400.00 5,000,000.00 5,000,000.00313382P80 14-0052 FHLB 1.00 04/15/20 01/29/14 04/15/14 2.6039 0.987470 2,962,410.00 3,000,000.00 3,000,000.00313382F40 14-0054 FHLB 2.375 03/28/23 02/03/14 03/28/14 3.1000 0.942590 3,299,065.00 3,500,000.00 3,500,000.003136G0F30 14-0055 FNMA 2.15 09/27/22 02/03/14 03/27/14 3.0006 0.935600 1,403,400.00 1,500,000.00 1,500,000.003130A0EC0 14-0056 FHLB 0.625 06/27/17 01/21/14 03/27/14 1.6125 0.998300 4,991,500.00 5,000,000.00 5,000,000.003136G13L1 14-0059 FNMA 2.00 12/20/22 02/20/14 03/20/14 3.0674 0.917500 715,650.00 780,000.00 780,000.003133EDHK1 14-0060 FFCB 0.63 09/20/16 03/24/14 06/20/14 0.6803 0.998760 2,996,280.00 3,000,000.00 3,000,000.003133EDHK1 14-0063 FFCB 0.63 09/20/16 04/07/14 06/20/14 0.6609 0.999250 2,997,750.00 3,000,000.00 3,000,000.003135G0RT2 14-0071 FNMA 0.875 12/20/17 06/27/14 Open 1.1011 0.992300 4,713,425.00 4,750,000.00 4,718,711.423134G3Y79 14-0072 FHLMC 1.00 11/28/17 06/27/14 08/28/14 1.1195 0.996000 1,494,000.00 1,500,000.00 1,500,000.003134G44H8 15-0001 FHLMC 1.75 05/21/21 07/01/14 05/21/15 2.3829 0.960000 960,000.00 1,000,000.00 982,294.87313381HB4 15-0002 FHLB 2.13 12/13/22 07/01/14 07/03/14 2.7504 0.953500 953,500.00 1,000,000.00 1,000,000.003130A2JE7 15-0005 FHLB 1.25 07/23/19 07/23/14 01/23/15 1.3018 0.997500 4,987,500.00 5,000,000.00 4,998,472.223135G0QK2 15-0008 FNMA 1.55 10/04/19 07/23/14 04/04/13 1.8441 0.985480 2,956,440.00 3,000,000.00 2,959,988.033134G5AJ4 15-0010 FHLMC 0.92 03/30/17 08/04/14 09/30/14 0.9200 1.000000 3,000,000.00 3,000,000.00 3,000,000.003136G22Z9 15-0011 FNMA 1.50 08/15/18 08/15/14 08/15/16 1.5065 0.999750 2,999,250.00 3,000,000.00 2,999,390.073135G0ZL0 15-0013 FNMA 1.00 09/27/17 08/28/14 Open 1.0430 0.998700 6,990,900.00 7,000,000.00 6,991,885.413134G5NA9 15-0018 FHLMC 1.125 11/10/17 11/10/14 02/10/15 1.1250 1.000000 3,000,000.00 3,000,000.00 3,000,000.003133EDYT3 15-0021 FFCB 1.10 10/23/17 10/23/14 01/23/15 1.1000 1.000000 11,385,000.00 11,385,000.00 11,385,000.003134G5NH4 15-0027 FHLMC 1.20 11/24/17 11/24/14 02/24/15 1.2000 1.000000 3,000,000.00 3,000,000.00 3,000,000.003134G5MY8 15-0028 FHLMC 1.05 11/21/17 11/21/14 05/21/15 1.0585 0.999750 2,999,250.00 3,000,000.00 2,999,416.673134G5R23 15-0029 FHLMC 1.25 12/05/17 12/05/14 03/05/15 1.2500 1.000000 3,000,000.00 3,000,000.00 3,000,000.003135G0TC7 15-0030 FNMA 1.63 01/10/20 11/20/14 01/10/15 1.9001 0.986830 2,960,490.00 3,000,000.00 2,992,888.203134G5NG6 15-0033 FHLMC 1.75 11/26/19 11/26/14 02/26/15 2.0385 1.000000 3,000,000.00 3,000,000.00 3,000,000.003133EEEL0 15-0037 FFCB 2.73 09/09/22 12/09/14 03/09/15 2.7489 0.998710 4,993,550.00 5,000,000.00 4,995,126.673130A3ND2 15-0038 FHLB 1.325 06/29/18 12/29/14 06/29/15 1.3250 1.000000 2,000,000.00 2,000,000.00 2,000,000.003130A3Q98 15-0039 FHLB 1.25 12/29/17 12/29/14 12/29/15 1.2500 1.000000 2,000,000.00 2,000,000.00 2,000,000.003133EEEH9 15-0040 FFCB 2.05 06/09/20 12/09/14 03/09/15 2.0813 0.998380 3,993,520.00 4,000,000.00 3,995,104.003134G5SP1 15-0042 FHLMC 1.25 12/26/17 12/26/14 03/26/15 1.3011 0.998500 2,995,500.00 3,000,000.00 2,995,750.003133EDQM7 15-0043 FFCB 1.00 07/17/17 12/09/14 Open 0.9976 1.000060 4,000,240.00 4,000,000.00 4,000,239.053134G5SG1 15-0044 FHLMC 0.50 12/19/17 12/19/14 03/19/15 1.5522 0.999350 3,997,400.00 4,000,000.00 3,997,746.67

Open InvestmentsPrince William County
Effective Interest - Callable LifeReceipts in Period
12/31/2014CUSIP Invest
NumberSecurity
DescriptionPurchase
DateCallDate
YieldMatur
OriginalUnit Cost
OriginalPrinc/Cost
EndingPar Val/Shares
12-31-14Amor Val/Cost
3136G1B99 14-0037 FNMA 0.60 01/30/18 12/24/13 01/30/14 1.5941 0.997100 3,988,400.00 4,000,000.00 4,000,000.003134G5C78 15-0006 FHLMC 1.10 10/30/17 07/30/14 01/30/15 1.1237 0.999250 2,997,750.00 3,000,000.00 2,999,637.503133EC3B8 13-0115 FFCB 0.52 05/19/16 11/19/12 02/19/13 0.5402 0.999300 4,996,500.00 5,000,000.00 5,000,000.003133827E7 13-0198 FHLB 2.13 02/06/23 03/21/13 Open 2.1423 0.998900 4,704,819.00 4,710,000.00 4,705,715.113134G45T1 13-0223 FHLMC 2.00 12/10/21 06/13/13 06/10/14 2.0879 0.993190 2,979,570.00 3,000,000.00 3,000,000.003130A36V1 15-0016 FHLB 1.30 10/16/17 10/16/14 01/16/15 1.3000 1.000000 3,000,000.00 3,000,000.00 3,000,000.00Agency Note Total 1.8063 0.995274 530,680,128.35 531,012,500.00 530,746,104.89SUNTRUST DDA GP AR-0166 Cash 06/01/97 Open 0.5000 0.000000 0.00 32,020,821.20 32,020,821.20TD Bank AR-0279 Cash 02/21/07 Open 0.2900 1.000000 20,000,000.00 24,125,548.09 24,125,548.09United Bank AR-0304 Cash 10/01/08 Open 0.0000 1.000000 322,580.32 0.00 0.00BB&T Investor Deposit Acct- GP AR-0307 Cash 05/08/09 Open 0.1500 1.000000 25,000,000.00 0.00 0.00John Marshall Bank MMKT AR-0339 Cash 08/30/13 Open 0.6500 1.000000 1,000,000.00 35,157,706.03 35,157,706.03Cardinal Bank MMKT AR-0345 Cash 10/31/14 Open 1.0000 1.000000 10,000,000.00 10,017,000.50 10,017,000.50Cash Total 0.5514 1.000000 56,322,580.32 101,321,075.82 101,321,075.82J6262014B 14-0068 John Marshall Bank CD 0.75 06/26/15 06/26/14 Open 0.7529 1.000000 5,037,768.79 5,037,768.79 5,037,768.79J06262014 14-0069 John Marshall Bank CDARS 0.60 06/25/15 06/26/14 Open 0.6018 1.000000 5,000,000.00 5,000,000.00 5,000,000.00U06262014 14-0070 United Bank CDARS 0.50 06/25/15 06/26/14 Open 0.5013 1.000000 5,000,000.00 5,000,000.00 5,000,000.00U11202014 15-0031 United Bank CDARS 0.40 05/21/15 11/20/14 Open 0.4004 1.000000 12,500,000.00 12,500,000.00 12,500,000.00A01162014 14-0046 Access Nat'l Bank CD 0.50 01/16/15 01/16/14 Open 0.5013 1.000000 5,024,932.05 5,024,932.05 5,024,932.05A12292014 15-0048 Access Nat'l Bank CD 0.50 12/29/15 12/29/14 Open 0.5013 1.000000 10,050,549.85 10,050,549.85 10,050,549.85Certificate of Deposit Total 0.5132 1.000000 42,613,250.69 42,613,250.69 42,613,250.699612E0CV7 14-0001 WestPac Banking Corp 1.375 10/05/17 07/22/13 Open 1.2912 0.988250 3,953,000.00 4,000,000.00 3,969,122.276325C0CH2 14-0009 National Australia Bank Float 1.25 09/20/17 08/14/13 Open 0.7852 1.002800 5,014,000.00 5,000,000.00 5,009,364.7859217GAY5 13-0157 Met Life Global Fnd I 1.50 01/10/18 01/10/13 Open 1.4501 1.002400 5,012,000.00 5,000,000.00 5,007,363.1164952WBF9 14-0050 New York Life GL 1.65 05/15/17 01/28/14 Open 1.1502 1.016120 2,032,240.00 2,000,000.00 2,023,323.7178010UDR5 14-0051 Royal Bank of Canada 0.8386 01/30/19 01/30/14 Open 0.9107 0.997800 2,494,500.00 2,500,000.00 2,495,493.33822582BA9 14-0053 Shell International Finance 2.00 11/15/18 02/05/14 Open 1.6242 1.017200 3,438,136.00 3,380,000.00 3,427,482.482027A0GL7 13-0181 Commonwealth Bank Australia 1.65 10/30/17 02/25/13 Open 0.6709 1.005000 2,010,000.00 2,000,000.00 2,006,134.9188579YAE1 14-0057 3M Company 1.00 06/26/17 02/10/14 Open 0.9297 1.002330 3,006,990.00 3,000,000.00 3,005,170.6898385XAH9 13-0185 XTO Energy Inc. 5.65 04/01/16 03/01/13 Open 0.5502 1.155700 4,622,800.00 4,000,000.00 4,253,732.872027A0HA0 14-0066 Commonwealth Bank of Australia 0.9273 04/15/19 04/15/14 Open 0.9533 1.000000 13,000,000.00 13,000,000.00 13,000,000.009612E0CV7 13-0191 WestPac Banking Corp 1.375 10/05/17 03/15/13 Open 0.4893 1.010000 6,060,000.00 6,000,000.00 6,036,742.552027A0GF0 12-0242 Commonwealth Bank Australia 2.125 05/24/17 05/24/12 Open 1.4202 1.000000 5,000,000.00 5,000,000.00 5,000,000.0005253JAA9 15-0003 ANZ Bank NY 1.875 10/06/17 07/02/14 Open 1.2399 1.020230 4,591,035.00 4,500,000.00 4,577,407.9120271RAC4 15-0004 Commonwealth Bank of Australia 1.90 09/18/17 07/02/14 Open 1.2399 1.020710 4,797,337.00 4,700,000.00 4,782,533.7978010UWC7 15-0007 Royal Bank of Canada 1.50 07/18/19 07/18/14 Open 1.5521 0.997500 2,992,500.00 3,000,000.00 2,993,155.616325C0CH2 13-0201 National Australia Bank Float 1.25 09/20/17 04/05/13 Open 0.7568 1.005700 6,597,392.00 6,560,000.00 6,583,031.2178010UWM5 15-0015 Royal Bank of Canada 1.50 09/30/19 09/30/14 Open 1.5104 0.999500 4,997,500.00 5,000,000.00 4,997,621.9278010U4A2 15-0019 Royal Bank of Canada 1.40 10/13/17 11/04/14 Open 1.2001 1.005760 6,778,822.40 6,740,000.00 6,776,767.5378010U4A2 15-0020 Royal Bank of Canada 1.40 10/13/17 10/17/14 Open 1.1712 1.006700 4,026,800.00 4,000,000.00 4,024,983.68037833AG5 13-0209 Apple Inc 0.5231 05/03/18 05/06/13 Open 0.3175 1.006000 3,018,000.00 3,000,000.00 3,012,079.9089114QAH1 13-0210 Toronto-Dominion Bank 0.8256 04/30/18 05/07/13 Open 0.5372 1.008610 2,017,220.00 2,000,000.00 2,011,576.7964952WBF9 12-0255 New York Life GL 1.65 05/15/17 06/04/12 Open 1.5446 1.005000 2,291,400.00 2,280,000.00 2,285,577.19

Open InvestmentsPrince William County
Effective Interest - Callable LifeReceipts in Period
12/31/2014CUSIP Invest
NumberSecurity
DescriptionPurchase
DateCallDate
YieldMatur
OriginalUnit Cost
OriginalPrinc/Cost
EndingPar Val/Shares
12-31-14Amor Val/Cost
89236TBH7 15-0032 Toyota Motor Credit Corp 1.125 05/16/17 11/25/14 Open 1.0700 1.001339 3,004,017.42 3,000,000.00 3,003,857.19369604BC6 15-0036 General Electric Company 5.25 12/06/17 12/08/14 Open 1.3701 1.113450 2,783,625.00 2,500,000.00 2,777,676.71369604BC6 15-0041 General Electric Company 5.25 12/06/17 12/10/14 Open 1.4744 1.110000 4,440,000.00 4,000,000.00 4,431,570.389612E0CT2 13-0060 WestPac Banking Corp 2.50 08/24/17 08/24/12 Open 1.0557 1.000000 4,000,000.00 4,000,000.00 4,000,000.00Corporate Bond Total 1.0796 1.016515 111,979,314.82 110,160,000.00 111,491,770.50928109YC5 13-0080 VA St BABS 3.05 06/01/20 09/17/12 Open 1.6501 1.100890 1,651,335.00 1,500,000.00 1,608,375.6992812Q3S4 13-0096 VA HSG DEV TAXABLE - D 2.818 10/01/22 10/30/12 04/01/22 2.8180 1.000000 3,510,000.00 3,510,000.00 3,510,000.0092812Q3R6 13-0097 VA HSG DEV TAXABLE - D 2.568 10/01/21 10/30/12 Open 2.5680 1.000000 2,115,000.00 2,115,000.00 2,115,000.00849254SG3 13-0031 Spotsylvania County VA 2.70 06/01/21 07/26/12 Open 2.7000 1.000000 60,000.00 60,000.00 60,000.00849254SD0 13-0028 Spotsylvania County VA 2.15 06/01/18 07/26/12 Open 1.9004 1.013760 60,825.60 60,000.00 60,493.04849254SE8 13-0029 Spotsylvania County VA 2.375 06/01/19 07/26/12 Open 2.1004 1.017440 61,046.40 60,000.00 60,691.4092812QW60 13-0229 VA HSG DEV AUTH TAXABLE E 4.504 03/01/23 06/17/13 Open 3.4185 1.088970 1,088,970.00 1,000,000.00 1,076,772.6192812Q3Q8 13-0098 VA HSG DEV AUTH TAXABLE D 2.318 10/01/20 10/30/12 Open 2.3180 1.000000 2,215,000.00 2,215,000.00 2,215,000.00928075GK0 13-0081 VA St Prt Auth Prt Fnd Rev 2.545 07/01/22 09/26/12 Open 2.5450 1.000000 510,000.00 510,000.00 510,000.00770077X42 12-0199 Roanoke Ref B 1.732 10/01/18 03/14/12 Open 1.7320 1.000000 455,000.00 455,000.00 455,000.00928075GF1 13-0083 VA St Prt Auth Prt Fnd Rev 1.567 07/01/18 09/26/12 Open 1.5670 1.000000 1,310,000.00 1,310,000.00 1,310,000.00928075GG9 13-0084 Va St Prt Auth Prt Fnd Rev 1.817 07/01/19 09/26/12 Open 1.8170 1.000000 1,000,000.00 1,000,000.00 1,000,000.00928075GH7 13-0085 VA St Prt Auth Prt Fnd Rev 2.145 07/01/20 09/26/12 Open 2.1450 1.000000 500,000.00 500,000.00 500,000.0092812Q2T3 13-0048 VA HSG DEV AUTH TAXABLE 1.60 08/01/18 08/21/12 Open 1.6000 1.000000 1,780,000.00 1,780,000.00 1,780,000.00928075GJ3 13-0086 VA St Prt Auth Prt Fnd Rev 2.345 07/01/21 09/26/12 Open 2.3450 1.000000 1,000,000.00 1,000,000.00 1,000,000.0092812Q2U0 13-0049 VA HSG DEV AUTH TAXABLE 1.85 08/01/19 08/21/12 Open 1.8500 1.000000 1,815,000.00 1,815,000.00 1,815,000.0092812Q2V8 13-0050 VA HSG DEV AUTH TAXABLE 2.10 08/01/20 08/21/12 Open 2.1000 1.000000 1,855,000.00 1,855,000.00 1,855,000.0092812QTY3 13-0199 VA HSG DEV AUTH 5.60 11/01/18 04/02/13 11/01/16 2.5525 1.157550 590,350.50 510,000.00 551,531.63928075FN5 12-0197 VA St Prt Auth 2.146 07/01/18 02/27/12 Open 1.8733 1.016240 345,521.60 340,000.00 343,126.9592812Q2F3 13-0041 VA HSG DEV AUTH 2.375 08/01/22 08/21/12 Open 2.3750 1.000000 265,000.00 265,000.00 265,000.0092812Q2W6 13-0051 VA HSG DEV AUTH TAXABLE 2.30 08/01/21 08/21/12 Open 2.3000 1.000000 1,900,000.00 1,900,000.00 1,900,000.0092812QXJ1 13-0092 VA HSG AUTH 5.17 08/01/15 08/01/12 02/01/15 1.2717 1.114390 6,686,340.00 6,000,000.00 6,023,005.24849254SH1 13-0032 Spotsylvania County VA 3.00 06/01/22 07/26/12 Open 3.0000 1.000000 60,000.00 60,000.00 60,000.00849254PR2 13-0078 Spotsylvania Co VA BABS 5.30 07/15/21 09/17/12 07/15/19 2.3812 1.231120 1,514,277.60 1,230,000.00 1,422,630.6292812VBR6 15-0023 VA HGS DEV AUTHORITY TAXABLE C 0.76 11/01/16 11/20/14 Open 0.7600 1.000000 1,000,000.00 1,000,000.00 1,000,000.0092812VBS4 15-0024 VA HSG DEV AUTHORITY TAXABLE C 1.327 11/01/17 11/20/14 Open 1.3270 1.000000 500,000.00 500,000.00 500,000.0092812VBY1 15-0025 VA HSG DEV AUTHORITY TAXABLE C 3.196 11/01/23 11/20/14 Open 3.1960 1.000000 500,000.00 500,000.00 500,000.0092812VBZ8 15-0026 VA HSG DEV AUTHORITY TAXABLE C 3.296 11/01/24 11/20/14 Open 3.2960 1.000000 500,000.00 500,000.00 500,000.00652233GS0 13-0093 Newport News Amt Ref Series D 2.00 09/01/19 09/27/12 Open 1.7903 1.013610 522,009.15 515,000.00 519,813.4992812Q2X4 13-0052 VA HSG DEV AUTH TAXABLE 2.50 08/01/22 08/21/12 Open 2.5000 1.000000 1,950,000.00 1,950,000.00 1,950,000.00928075FR6 12-0174 VA St Prt Auth 2.92 07/01/21 02/06/12 Open 2.4005 1.043500 2,087,000.00 2,000,000.00 2,062,185.94849254SF5 13-0030 Spotsylvania County VA 2.50 06/01/20 07/26/12 Open 2.4006 1.007090 60,425.40 60,000.00 60,301.36613741AJ6 13-0169 Montgomery County VA EDA Rev 3.80 06/01/19 01/24/13 Open 1.9003 1.113160 556,580.00 500,000.00 540,054.48409558X99 12-0259 Hampton VA BAB 4.673 01/15/22 06/08/12 Open 2.6001 1.175130 740,331.90 630,000.00 713,507.21652233GR2 13-0094 Newport News Amt Ref Series D 2.00 09/01/18 09/27/12 Open 1.4503 1.031120 515,560.00 500,000.00 509,778.99928172YA7 12-0066 VA St Pub Bldg Auth B 3.00 08/01/21 10/19/11 Open 3.0308 0.997440 379,027.20 380,000.00 379,307.16927781TG9 13-0022 VA College Bld BABS 4.50 02/01/20 07/19/12 Open 1.9676 1.176500 588,250.00 500,000.00 560,963.1892812QW29 13-0023 VA HSG AUTH 3.166 03/01/19 07/19/12 03/01/17 1.9287 1.076500 430,600.00 400,000.00 414,614.06

Open InvestmentsPrince William County
Effective Interest - Callable LifeReceipts in Period
12/31/2014CUSIP Invest
NumberSecurity
DescriptionPurchase
DateCallDate
YieldMatur
OriginalUnit Cost
OriginalPrinc/Cost
EndingPar Val/Shares
12-31-14Amor Val/Cost
849254SB4 13-0026 Spotsylvania County VA 1.75 06/01/16 07/26/12 Open 1.6006 1.005560 60,333.60 60,000.00 60,125.04973126MT9 13-0151 Winchester VA Pub Improv 5.00 11/01/16 12/27/12 11/01/15 2.1157 1.105930 22,118.60 20,000.00 20,628.02765433GX9 13-0152 Richmond VA Pub Utly Rev 4.00 01/15/16 12/27/12 Open 1.0502 1.088310 27,207.75 25,000.00 25,759.91849254SC2 13-0027 Spotsylvania County VA 2.00 06/01/17 07/26/12 Open 1.7504 1.011560 60,693.60 60,000.00 60,352.81Municipal Bond Total 2.0868 1.041283 42,848,803.90 41,150,000.00 41,874,018.83JP MORGAN GOVT GP AR-0204 Mutual Fund - Money Market 08/17/00 Open 0.0100 1.000000 1,000,000.00 12,385.66 12,385.66FEDERATED GOVT GP AR-0153 Mutual Fund - Money Market 06/30/97 Open 0.0100 1.000000 6,086,902.77 3,324.00 3,324.00PFM Govt General Pool AR-0316 Mutual Fund - Money Market 05/27/10 Open 0.0500 1.000000 2,000,000.00 509,995.69 509,995.69WELLS FARGO General Pool AR-0208 Mutual Fund - Money Market 05/01/02 Open 0.0100 1.000000 6,007,268.98 1,060,652.47 1,060,652.47PFM Prime General Pool AR-0186 Mutual Fund - Money Market 11/03/98 Open 0.0700 1.000000 10,000,000.00 100,788,562.73 100,788,562.73Mutual Fund - Money Market Total 0.0693 1.000000 25,094,171.75 102,374,920.55 102,374,920.55LGIP General Pool AR-0084 State Pool 08/25/93 Open 0.1000 0.000000 0.00 121,012,205.35 121,012,205.35State Pool Total 0.1000 0.000000 0.00 121,012,205.35 121,012,205.3531359MEL3 13-0122 FNMA 0.00 06/01/17 11/20/12 Open 0.7502 0.966650 2,899,950.00 3,000,000.00 2,946,244.20Zero Coupon Total 0.7502 0.966650 2,899,950.00 3,000,000.00 2,946,244.20100 - POOLED INVESTMENTS Total 1.2046 1.001107 812,438,199.83 1,052,643,952.41 1,054,379,590.83

Portfolio CompositionMarch 31, 2015
Security Type ------ Amortized Cost Basis------ ------Mkt. Value Basis------ ----------Difference----------U.S. Gov't & Agency Securities
Agency Securities $504,046,591 54.35% $501,397,577 54.22% ($2,649,014) -0.53%Repurchase, NOW & Cash 114,728,161 12.37% 114,728,161 12.41% $0 0.00%Treasury Notes & TIPS 0 0.00% 0 0.00% 0 0.00%
Subtotal $618,774,752 66.73% $616,125,738 66.63% ($2,649,014) -0.43%
Corporate and Municipal SecuritiesVirginia Municipal Bonds $32,838,133 3.54% $32,935,820 3.55% $97,687 0.30%Corporate Bonds 117,412,747 12.66% 117,335,759 12.69% (76,987) -0.07%Subtotal $150,250,880 16.20% $150,271,579 16.25% $20,700 0.01%
Certificates of Deposit & BAsCDs $42,638,438 4.60% $42,638,438 4.61% $0 0.00%Negotiable CDs 0 0.00% 0 0.00% 0 0.00%Subtotal $42,638,438 4.60% $42,638,438 4.61% $0 0.00%
Commercial PaperCommercial Paper $0 0.00% $0 0.00% $0 0.00%Subtotal $0 0.00% $0 0.00% $0 0.00%
Money Market FundsOther $15,710 0.00% $15,710 0.00% $0 0.00%Wells Fargo Sweep 2,314,390 0.25% 2,314,390 0.25% 0 0.00%PFM Funds 52,313,147 5.64% 52,313,147 5.66% 0 0.00%Virginia LGIP 61,032,051 6.58% 61,032,051 6.60% 0 0.00%Subtotal $115,675,298 12.47% $115,675,298 12.51% $0 0.00%
TOTAL GENERAL PORTFOLIO $927,339,368 100.00% $924,711,053 100.00% ($2,628,315) -0.28%
R E S T R I C T E D P O R T F O L I O
Security Type ------ Amortized Cost Basis------ ------Mkt. Value Basis------ ----------Difference----------U.S. Gov't & Agency Securities
Agency Notes $23,967,395 19.93% $23,962,265 19.92% ($5,130) -0.02%Treasury Notes 0 0.00% 0 0.00% $0 0.00%
Subtotal $23,967,395 19.93% 23,962,265 19.92% ($5,130) -0.02%
Corporate SecuritiesVirginia Municipal Bonds $318,980 0.03% $316,450 0.03% ($2,529) -0.79%Corporate Bonds $2,072,634 1.72% $2,072,920 1.72% $286 0.01%Commercial Paper 0 0.00% 0 0.00% $0 0.00%
Subtotal $2,391,614 1.99% $2,389,370 1.99% ($2,244) -0.09%
Certificatesof DepositCDs 1,004,999 0.84% 1,004,999 0.84% $0 0.00%
Subtotal 1,004,999 0.84% 1,004,999 0.84% $0 0.00%
Money Market Funds & CashAll Money Market Funds & Cash $92,909,132 77.25% $92,909,132 77.25% $0 0.00%
Subtotal $92,909,132 77.25% $92,909,132 77.25% $0 0.00%
TOTAL RESTRICTED PORTFOLIO $120,273,140 100.00% $120,265,767 100.00% ($7,373) -0.01%
T O T A L P O R T F O L I O
------ Amortized Cost Basis------ ---Mkt. Value Basis--- ------Difference------
TOTAL PORTFOLIO $1,047,612,508 $1,044,976,820 ($2,635,688) -0.25%
G E N E R A L P O R T F O L I O
Attachment B

Investment StatisticsFY 2012 through FY 2015
Pro-RatedQ1 Q2 Q3 Q4 YTD Change
Statistics Amount Change Amount Change Amount Change Amount Amount Amount Amount Amount Amount
Earnings (millions) - Total Portfolio $20.0 $5.6 ($6.5) ($26.5) $20.0 $26.5 $2.9 $2.9 $3.1 $8.9 ($6.1)
Earnings (millions) - General Portfolio $19.4 $5.3 ($6.6) ($26.0) $19.3 $25.9 $2.8 $2.8 $3.1 $8.7 ($5.8)
Earnings (millions) - General Fund $10.9 $3.2 ($3.5) ($14.4) $10.6 $14.1 $1.5 $1.5 $1.7 $4.6 ($3.3)
General Fund Participation as a Percentof Total Portfolio Earnings 54.9% 0.1% 56.6% 1.7% 50.9% -5.7% 51.2% 51.7% 54.1% 52.4% 1.5%
General Fund Participation as a Percentof General Portfolio Earnings 56.0% -0.6% 58.2% 2.2% 54.7% -3.5% 52.5% 53.5% 54.7% 53.6% -1.1%
Total Portfolio Average Composition (millions) Government Securities $381.7 ($125.8) $383.3 $1.6 $545.2 $161.9 $543.5 $542.6 $544.9 $543.7 ($1.5)Corporate Bonds $99.6 $37.3 $131.9 $32.3 $129.4 ($2.5) $116.9 $107.6 $116.9 $113.8 ($15.6)Commercial Paper $11.7 $11.7 $21.8 $10.1 $3.7 ($18.1) $0.0 $0.0 $0.0 $0.0 ($3.7)Negotiable Certif icates of Deposit $4.2 $4.2 $3.2 ($1.0) $0.0 ($3.2) $0.0 $0.0 $0.0 $0.0 $0.0Certif icates of Deposit $47.4 $6.5 $46.6 ($0.7) $22.2 ($24.4) $31.1 $36.7 $43.7 $37.2 $15.0Money Market $310.4 ($47.9) $277.7 ($32.7) $209.1 ($68.6) $190.3 $261.0 $247.9 $233.1 $24.0Cash/Repurchase Agreements $78.4 ($10.2) $60.0 ($18.4) $73.1 $13.1 $85.3 $103.2 $107.2 $98.6 $25.5Municipal Obligations $47.4 $12.5 $81.0 $33.5 $57.1 ($23.9) $43.4 $42.8 $40.0 $42.1 ($15.0)
Average Cash Invested - Total Portfolio $980.7 ($111.8) $1,019.4 $38.6 $1,039.8 $20.4 $1,010.5 $1,094.0 $1,100.6 $1,068.4 $28.6
Total Portfolio Range (millions)High $1,106.6 ($12.0) $1,165.2 $46.6 $1,169.6 $4.4 $1,058.3 $1,207.1 $1,150.5 $1,138.6 ($31.0)Low $883.0 ($15.7) $888.6 $5.6 $937.6 $49.0 $964.3 $1,000.5 $1,064.5 $1,009.8 $72.2
Comparative Investment YieldsPWC Total Return (General Portfolio) 2.19% 0.6% -0.70% -2.89% 2.08% 2.78% 0.87% 3.31% 3.62% 2.60% 0.52%PWC Earnings Yield (General Portfolio) 1.72% -0.6% 1.55% -0.18% 1.38% -0.17% 1.20% 1.18% 1.27% 1.22% -0.16%VA LGIP FY13 (prior years IMMF index) 0.03% 0.0% 0.16% 0.13% 0.10% -0.06% 0.10% 0.10% 0.12% 0.11% 0.01%Bloomberg 1-3yr Gvt. Index 1.62% 0.7% 1.51% -0.11% 1.59% 0.08% 1.64% 1.67% 1.73% 1.68% 0.09%U.S. Treasury Bills (90-Day) 0.05% -0.1% 0.08% 0.03% 0.04% -0.04% 0.03% 0.02% 0.03% 0.03% -0.01%U.S. Treasury Notes (2 Year) 0.28% -0.2% 0.26% -0.02% 0.37% 0.11% 0.52% 0.54% 0.61% 0.55% 0.18%
Fiscal Year2012
Fiscal Year2014
Fiscal Year2013
Fiscal Year 2015
Attachment C

Attachment D

Attachment E
Glossary Commonly Used Acronyms
ABA American Bankers Association APY Annual Percentage Yield BP Basis Point CUSIP Committee on Uniform Securities Identification Procedures DK Don’t Know DTC Depository Trust Company DVP Delivery vs. Payment FDIC Federal Deposit Insurance Company FFCB Federal Farm Credit Bank FHLB Federal Home Loan Bank FHLMC Federal Home Loan Mortgage Corporation or ‘Freddie Mac’ FINRA Financial Industry Regulatory Authority FNMA Federal National Mortgage Association or ‘Fannie Mae’ FOMC Federal Open Market Committee or ‘The Fed’ MM Money Market NRSROs Nationally Recognized Statistical Rating Organizations QE Quantitative Easing QPD Qualified Public Depository REPOS Repurchase Agreements SEC Securities and Exchange Commission SIFMA Securities Industry and Financial Markets Association TIPS Treasury Inflation Protection Securities YTC Yield to Call YTM Yield to Maturity YTW Yield to Worst Definitions ABA Transit Number - A unique number assigned by the ABA that identifies a specific federal or state chartered bank or savings institution (also referred to as ABA routing number). Accrued Interest - The amount of interest that accumulates on a fixed-income security from one interest payment to the next.

Agency Bonds – The informal name that refers to securities issued by agencies of the United States Government and U.S. Government Sponsored Enterprises. Annual Percentage Yield – The effective annual rate of return taking into account the effect of compounding interest. Ask - The lowest price at which a seller is willing to sell his or her securities. Asset Allocation – The diversification of assets across different asset classes, such as stocks, bonds and cash, to meet goals given risk tolerance, tax status and time horizon. Asset Class – The categorization of an asset. Examples of representative asset classes include equities, bonds, money markets and cash.
Basis Point - A unit that is equal to 1/100th of 1% and is used to denote the change in a financial instrument. One basis point on a $1,000,000 bond is equal to $100. Benchmark – A standard index used for measuring the performance of an investment. The goal of most money managers and investors is to outperform their respective benchmark. Bid – The price a broker is willing to pay for a security. Bond - A debt instrument issued by corporations and governments in which the issuer promises to pay to the bondholder principal and interest according to the terms and conditions of the bond. Book Entry - Most bonds are issued in book entry form, which means that there is no physical bond certificate. Bond ownership is evidenced by a trade confirmation issued by the broker/dealer, and by the monthly statements that the brokerage firm provides. Bullet - A bond that is not able to be redeemed prior to maturity is said to be non-callable. A slang term for a non-callable bond is a “bullet”. A bullet usually carries a lower interest rate since the investor is protected against the possibility of the bond being called when interest rates fall. Call Date - The date after which a bond issuer can redeem a callable bond. The list of dates on which a specified bond can be called is a call schedule. Call Protection – A period of time during which a bond issuer cannot call, or buy back, a bond. For example, if the first call on a bond is in 3 years from now, a buyer will have 3 years of call protection, and they are assured that they can own the bond for at least 3 years. Call Risk – Risk to a bond holder that a bond may be redeemed before scheduled maturity. The main risk of having a bond called before maturity is that the investor will be unable to replace the bond’s yield with another similar quality bond paying the same yield.

Callable Bond - A callable bond can be redeemed by the issuer before it matures if that provision is included in the terms of the bond agreement. Bonds are typically called when interest rates fall, since issuers can save money by paying off existing debt and offering new bonds at lower rates. Certificate of Deposit – A deposit of funds, in a bank or savings and loan association, for a specified term that earns interest at a specified rate or rate formula. Commercial Paper – Commercial paper consists of unsecured, short-term promissory notes issued by companies or commercial bank holdings. CP maturities are generally limited to a maximum of 270 days. Corporate Bond - The debt of corporations. The bonds are fully taxable, and issued in maturities ranging from less than one year up to 30 years.
Covered Bonds - A corporate bond with one important enhancement: Recourse to a pool of assets that secures or "covers" the bond if the originator (usually a financial institution) becomes insolvent. This enhancement typically (although not always) results in the bonds being assigned AAA credit ratings.
For the investor, one major advantage to a covered bond is that the debt and the underlying asset pool remain on the issuer's financials, and issuers must ensure that the pool consistently backs the covered bond. In the event of default, the investor has recourse to both the pool and the issuer. Another advantage is that the interest is paid from an identifiable source of projected cash flow versus out of other financing operations.
Coupon – Interest rate on a debt security the issuer promises to pay to the holder until maturity.
Credit Ratings - A financial indicator to potential investors used to assess the credit worthiness of a bond issuer. NRSROs are agencies that study the financial strength of bond issuers, and assign credit ratings. The three major NRSROs are Moody’s Investors Service, Inc., Standard & Poor’s Inc. and Fitch Ratings.
Current Yield - The rate of return an investor will get, without taking into account the value of the premium or discount of the purchase price. It is calculated by dividing the coupon by the price. The current yield is not a good indication of your return on investment. Yield to maturity and yield to call take into account the value of the discount or premium paid for the bond, and as such they offer a much better indication of the value of the bond. CUSIP - A CUSIP number identifies a company or issuer and the type of security. Dated Date - The date a bond is issued and starts to accrue interest. Default Risk - The event in which companies will be unable to make the required payments on their debt obligations. Default risk is a component in virtually all forms of credit extensions. To mitigate the impact of default risk, lenders often charge rates of return that correspond to the debtor’s level of default risk. Delivery vs. Payment – The simultaneous exchange of securities and cash. The safest method of settling either the purchase or sale of a security. Discount – The amount by which the price for a security is less than its par. Diversification – The investment of funds in several different asset classes and a variety of securities within each class to help reduce the impact of volatility in a portfolio and assist in managing risk.

DK – “don’t know”. A security is said to be ‘DK’d” when it is delivered to the purchaser or more typically the purchaser’s correspondent but is rejected because the purchaser either doesn’t know or doesn’t agree with one or more of the aspects of the trade. Duration – A measure of the average timing of cash flows from an asset or a liability or from an asset portfolio or a liability portfolio. Essentially, duration is a more accurate measure of maturity because it reflects the timing of cash flows from period interest and/or principal payments in addition to the cash flows represented by the funds transferred at maturity. Duration is computed by summing the present values of all of the future cash flows after multiplying each by the time until receipt, and then dividing that product by the sum of the present value of the future cash flows without weighting them for the time of receipt. Extraordinary Redemption - Some municipal bonds are issued with an extraordinary redemption provision which gives the issuer the right to call the bonds under certain circumstances. The circumstances could range from natural disasters to cancelled projects to almost anything else. General Obligation Bonds - Municipal bond backed by the full faith and credit of a municipality. A GO bond is repaid with general revenue and borrowings. Government Obligations - Bonds, notes and other evidences of indebtedness of the: U.S. Government or agency thereof, Commonwealth of Virginia, and Virginia political subdivisions. The principal and interest of which are unconditionally guaranteed. Such securities will include, but not be limited to: U.S. Treasury Bills, Notes and Bonds, State and Local Government Securities (SLGS), Government National Mortgage Association (GNMA), Small Business Administration (SBA), Federal Housing Administration (FHA), Farmers Home Administration (FHMA), General Services Administration (GSA) and Export-Import Bank. Government Sponsored Enterprises (GSEs) – U.S. Government sponsored corporations which carry the implicit backing of the U.S. Government, but are not direct obligations of the U.S. Government. For this reason, these securities will offer a yield premium over Treasuries. Examples of GSEs include: Federal National Mortgage Association (FNMA), Federal Farm Credit Bank (FFCB), Federal Home Loan Bank or its District Banks (FHLB) and Federal Home Loan Mortgage Corporation (FHLMC). High Yield Bonds – A bond that has a rating of BB or lower and that pays a higher yield to compensate for its greater risk. Also known as non-investment grade, speculative-grade, or junk bonds Interest Rate – Rate of interest charged for the use of money, usually expressed at an annual rate. Interest Payment Dates - Most bonds pay interest semi-annually (twice per year). The interest payment dates are usually the same month and day as the maturity date of the bond, and the six month anniversary. Investment Grade – A rating that indicates that a municipal or corporate bond has a relatively low risk of default. Bonds that are rated at or above ‘Baa’ by Moody’s or ‘BBB’ by S&P are said to be investment grade bonds Issuer – A legal entity that develops, registers and sells securities for the purpose of financing its operations. The issuer is a company in the case of a corporate bond, or a state, city, or county in the case of a municipal bond. The U.S. government is the issuer of Treasury bonds. Laddered Bond Portfolio - A portfolio in which asset classes and investment maturities are staggered, in order to receive regular income and to smooth-out the effect of interest rate fluctuations. This also enables the investor to diversify in terms of default risk and reinvestment risk.

Liquidity – The ability to rapidly buy or sell an asset without substantially affecting the asset's price. Liquidity Risk - The ability to easily convert securities to cash and is determined by how active the secondary market is for a particular security. Market Risk – The possibility for an investor to experience losses due to factors that affect the overall performance of the financial markets. Market risk, also called “systemic risk”, cannot be eliminated through diversification, though it can be hedged against. Mark to Market – When an investment is marked to the market, its value is adjusted to reflect the current market price. Maturity Date - The date at which a debt instrument is due and payable. Municipal Bonds - Bonds that are issued by state, county, or city governments to finance general governmental activities or special projects. They are generally exempt from federal tax, and are generally state tax-free for residents of the state in which they are issued.
Par Value - The face value, or named value, of a stock or bond. With bonds, par value, is the amount you pay to purchase at issue and the amount you receive when the bond is redeemed at maturity. Par is also the basis on which the interest you earn on a bond is figured. Premium - Amount by which a bond sells above its face (par) value. Principal - Basic amount invested, exclusive of earnings Realized Gain - The amount by which the sale price of an asset exceeds its purchase price. Rebalancing - The systematic practice of restoring your portfolio to its intended asset allocation Repurchase Agreement – A form of secured, short-term borrowing in which a security is sold with a simultaneous agreement to buy it back from the purchaser at a future date. Rates paid on repos are short-term money market interest rates and are completely unrelated to the coupon rate paid on the instrument being purchased. Revenue Bonds - The interest and principal payments for municipal bonds are typically either guaranteed by the issuer or by the revenue from a specific project. If they are guaranteed by a specific project, the bondholder is relying on revenue from the project to pay principal and interest, and the bonds are known as revenue bonds. Reverse Repurchase Agreement - The mirror image of a REPO. In a reverse REPO, an investor (governmental entity) owns securities, such as a Treasury note, U.S. government agency bond or other security, that a bank or dealer purchases under an agreement and sells back to an investor on a specified date, at an agreed-upon interest rate. Secondary Market - A market where investors purchase securities or assets from other investors, rather than from issuing companies themselves.

Settlement Date - Date by which an executed order must be settled, either by a buyer paying for the securities with cash or by a seller delivering the securities and receiving the proceeds of the sale for them. Spread - The difference between the yield of the bond and the yield of a Treasury bond with a comparable maturity. Since the Treasury yield is considered risk-free, the spread reflects the risk premium of the bond. Step-Up Bond - A bond that pays an initial coupon rate for the first period, and then a higher coupon rate for the following periods. Taxable Equivalent Yield - Pretax yield that a taxable bond would have to pay to equal the tax-free yield of a municipal bond in an investor's tax bracket. Trade Date - Day on which a security trade actually takes place. Treasury Bills - Securities issued by the U.S. Government in 3 month, 6 month and 1 year maturities, and they are sold at a discount to par. The bonds do not pay period interest, and the return an investor receives is based on the amount that the purchase price is discounted from par. Treasury Bonds and Notes - Securities issued by the U.S. Government in maturities of two, five, ten and 30 years. They all pay interest semi-annually. The issues that mature in ten years or less are called notes, and the 30 year issue is called a bond. The 30 year US Treasury bond is also know as the ‘long bond’ Treasury Inflation Protection Securities – Bonds issued by the U.S. Treasury that hedge the purchaser against the impact of inflation by semi-annually increasing the par value of the issue by the amount of inflation. These securities represent a real, inflation-adjusted yield. Because of this the coupon on TIPS is significantly lower than a non-TIP security. Treasury STRIPS - The bonds are prestripped, which means that the issue is separated into the principal and a series of individual interest payments, and each of those parts is offered separately as a zero-coupon security. Treasury STRIPS are a direct obligation of the U.S. Treasury. Variable/Floating- Rate Securities - Variable- or floating-rate debt may include corporate, municipal, or asset-backed securities and also senior bank loans. They can be linked to nearly any type of benchmark and pay interest based on a wide range of formulas. The most basic type pays a coupon equal to some widely followed interest rate, such as the one- or three-month LIBOR (London Interbank Offered Rate), plus a fixed spread above that rate. Yield to Call - The calculated yield based on price paid, coupon rate and amount of time until first call date. The yield is based on the security being called and not maturing and will fluctuate with market price. Yield Curve - A curve that shows the relationship between the yields on short-term and long-term bonds of the same investment quality. Yield to Maturity - The calculated return on investment that an investor will get if they hold the bond to maturity. It takes into account the present value of all future cash flows, as well as any premium or discount to par that the investor pays. Yield to Worst - The return if the worst possible bond repayment takes place, or the lowest potential yield that can be received on a bond without the issuer actually defaulting