israel citrus annual israeli citrus sector - usda gain publications/citrus annual... · imports of...
TRANSCRIPT

THIS REPORT CONTAINS ASSESSMENTS OF COMMODITY AND TRADE ISSUES MADE BY
USDA STAFF AND NOT NECESSARILY STATEMENTS OF OFFICIAL U.S. GOVERNMENT
POLICY
Date:
Approved By:
Prepared By:
Report Highlights:
Post forecasts Israel’s MY 2012/2013 citrus production at roughly 600 thousand metric tons, up 3
percent compared to MY 2011/2012. The increase is driven by an upswing in production of
mandarins (or tangerines) and oranges. Post forecasts an increase of 5 percent in Israeli citrus
exports in MY 2012/2013. Deliveries to processing plants will remain largely unchanged. Exports
to the United States, Canada, Japan, and South Korea are trending upwards, but remain a small
percentage of total exports. Mandarins (47 percent) and grapefruit (44 percent) make up the bulk
of Israel’s citrus exports. The Or (or Orri) mandarin variety alone accounts for 26 percent of total
citrus exports.
Gilad Shachar and Mariano J. Beillard
Jonathan P. Gressel
Agricultural Minister Counselor
U.S. Embassy, Cairo
Israeli Citrus Sector
Citrus Annual
Israel
12/26/2012
Required Report - public distribution

Executive Summary:
Israel is a medium-sized producer and exporter of citrus fruit. Post forecasts that Israel’s citrus
production in MY 2012/2013 will reach 601 thousand metric tons (TMT), up 3 percent compared to
the MY 2011/2012 season. We expect that Israel will export roughly 187 TMT, or 31 percent of its
harvest. We are anticipating that Israel will likely process once some 234 TMT, or 39 percent of
the crop. The balance of 179 TMT will be consumed locally as fresh citrus fruit.
A very good harvest in MY 2011/2012, allowed Israel’s citrus production to reach 586 TMT, a 29
percent increase compared to the previous season. About a third of the production or some 178
TMT (31 percent) were allocated to exports. While 232 TMT (39 percent) was processed; the
balance of 176 TMT was consumed domestically as fresh citrus fruit. Strong competition in Israel’s
traditional European markets is forcing exporters to look further afield to developing markets in the United States, Canada, Japan, South Korea, and Australia.

Commodities:
Production:
Post forecasts that MY 2012/2013 total production should reach about 601 TMT, a 3 percent
increase compared to MY 2011/2012. Israeli citrus production in MY 2011/2012 reached 586 TMT,
representing a 29 percent increase compared to the previous marketing year.
A very good harvest in MY 2011/2012 allowed oranges and mandarins to recover
MY 2010/2011’s lost ground. Production yields are now more in line with the multi-year average.
In addition, an increase number of mandarin (mainly the Or varietal) trees have now entered the
fruit-bearing stage.
Table 1: Citrus Production by Varieties, thousand metric tons
MY Oranges
Mandarins
(easy
peelers)
Lemons/Limes Grapefruit Other
Citrus1
Total
Production
2007/08 125 145 35 242 13 560
2008/09 155 139 29 232 12 567
2009/10 148 150 48 235 14 595
2010/11 100 125 30 190 10 455
2011/12 116 166 53 245 6 586
2012/13* 130 175 56 235 5 601 Source: The Plants Production and Marketing Board, Citrus Division, Israel.
*Forecast: Based on information collected.
(1) Other Citrus includes red and white pomelos, kumquat, limquat, ethrog (citron).
The Israeli citrus sector is striving to improve the efficiency of its operations and fruit quality.
Growers are seeking lower seed content, longer shelf life, better looking fruit, and an extended
marketing season. To reach these goals, growers are introducing new technologies and varieties
to boost production yields while minimizing the impact on resources and the environment.
Ecologically-oriented agricultural norms are increasingly taking root in the citrus industry.
Producers are aiming to grow “greener,” more environmentally friendly fruit using minimal or no
chemical fertilizers. The citrus industry is adhering to the European market’s quality management
requirements; especially EUREP GAP 2000, ISO Standards, and crop management protocols.
To cut back on the use of chemical pesticides, 65 percent of Israeli citrus groves use Integrated
Pest Management (IPM) programs. In lieu of chemical pesticides, IPM programs utilize natural
control agents such as parasitic wasps, sterilized Mediterranean fruit flies (Ceratitis capitata) or
medfly, and predatory insects.
Orange Juice
Lemons, Fresh
Oranges, Fresh
Tangerines/Mandarins, Fresh
Grapefruit, Fresh

Oranges – Post forecasts that orange production in MY 2012/2013 will reach 130 TMT, an increase
of roughly 12 percent. We expect production levels of about 50 TMT of Shamuti, 28 TMT of
Valencias, and some 35 TMT of navel oranges. Better growing conditions in
MY 2011/2012 mitigated pest infestations, allowing orange production to reach 116 TMT, up by 16
TMT or 16 percent compared to the previous marketing year. Shamuti and navel oranges remain
Israel’s two main commercial orange varieties despite declining cultivation in recent years.
Tangerines/ Mandarins (Easy Peelers) – Post forecasts total mandarin production in MY 2012/2013
at 175 TMT, and potentially reaching 200 TMT by 2015. We expect production levels of 65 TMT for
Ors, 27 TMT for Novas, 19 TMT for Michals, 16 TMT for Minneolas, and about 8.4 to 8.5 TMT for
Murcotts and Oras. Israeli citrus growers have been expanding the number of mandarin
plantations since 2009. This expansion in coming years will further spur easy peeler production.
Israel’s leading easy peeler is the Or varietal. Although yields were very high in MY 2011/2012,
the mandarin harvest suffered overall from small fruit size.
Grapefruit – The star ruby sunrise varietal is the main citrus fruit variety exported by Israel. Post
forecasts that in MY 2012/2013, Israel will produce 235 TMT of grapefruit, a 4 percent down
compared to the previous year. The decrease is mainly as a result of white grapefruit uprooting in
recent years. We expect that out of this total production, red fruit will account for 140 TMT.
White grapefruit and sweeties follow with 65 and 30 TMT respectively.
Lemons and Limes – MY 2012/2013’s lemon and lime production at 56 TMT, nearly 6 percent
increase compared to the previous year. Lemons and limes are mostly consumed locally.
Other Citrus – Competition from China-origin pomelo in foreign import markets is forcing Israeli
citrus growers to scale back on white and red pomelo production for export. Post forecasts Israeli
pomelo production to reach 4 TMT in MY 2012/2013. Kumquat and limquat production should
reach 1 TMT in MY 2012/2013.
Table 2: Citrus Type Share of Total Production, Percentage
MY Oranges
Mandarins
(easy
peelers)
Lemons/Limes Grapefruit Other
Citrus1
Total
Production
2007/08 22.3 25.9 6.3 43.2 2.3 100
2008/09 27.3 24.5 5.1 40.9 2.2 100
2009/10 24.9 25.2 8.1 39.0 2.8 100
2010/11 22.0 27.5 6.6 41.7 2.2 100
2011/12 19.8 28.6 9.0 41.9 0.7 100
2012/13* 21.6 29.1 9.3 39.1 0.8 100 Source: The Plants Production and Marketing Board, Citrus Division, Israel. *Forecast: Post estimates. (1) Other Citrus includes red and white pomelos, kumquat, limquat, ethrog (citron).
Table 3: Citrus Utilization, Destination, metric tons
Period Total Exports Delivery to Processors Local Fresh Market
MY Quantity % Quantity % Quantity % Total Percent
2007/08 172,059 30.7 212,097 37.9 175,844 31.4 100
2008/09 173,576 30.6 223,310 39.4 170,277 30.0 100
2009/10 179,238 30.0 182,203 30.6 234,531 39.4 100
2010/11 154,996 34.1 139,906 30.7 160,000 35.2 100
2011/12 177,974 30.4 231,602 39.5 176,424 30.1 100
2012/13 187,000 31.2 234,000 39.0 179,000 29.6 100 Source: The Plants Production and Marketing Board, Citrus Division, Israel.
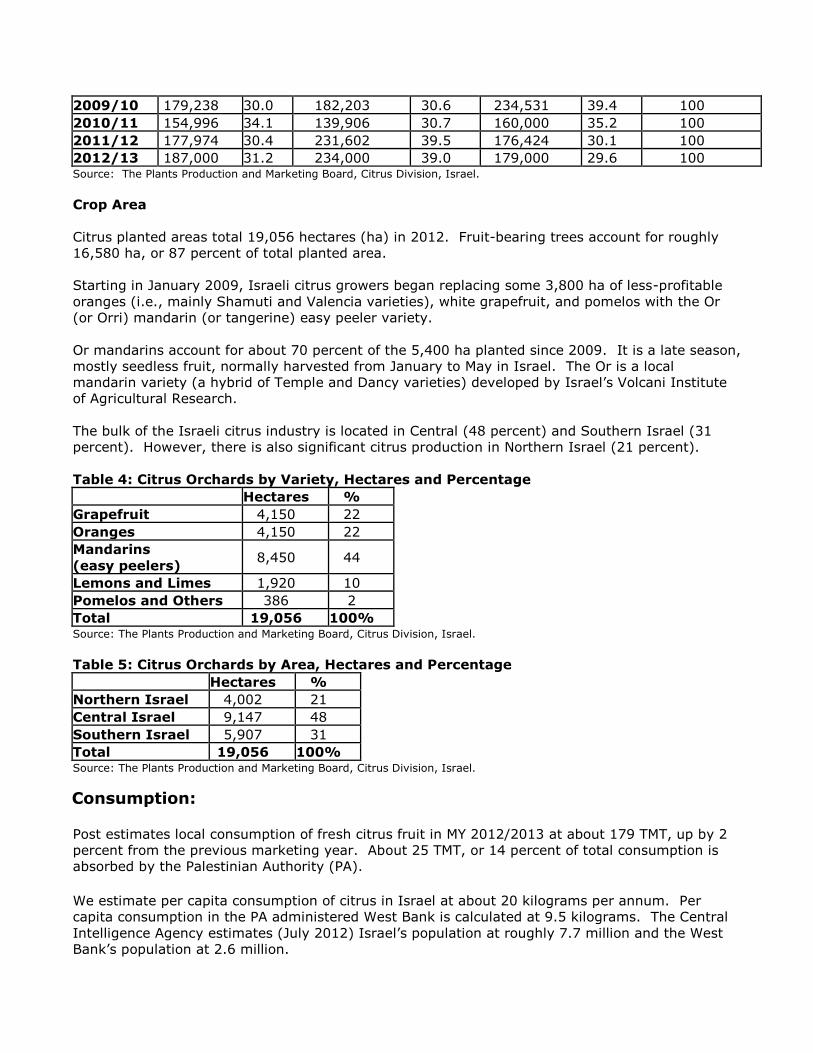
Crop Area
Citrus planted areas total 19,056 hectares (ha) in 2012. Fruit-bearing trees account for roughly
16,580 ha, or 87 percent of total planted area.
Starting in January 2009, Israeli citrus growers began replacing some 3,800 ha of less-profitable
oranges (i.e., mainly Shamuti and Valencia varieties), white grapefruit, and pomelos with the Or
(or Orri) mandarin (or tangerine) easy peeler variety.
Or mandarins account for about 70 percent of the 5,400 ha planted since 2009. It is a late season,
mostly seedless fruit, normally harvested from January to May in Israel. The Or is a local
mandarin variety (a hybrid of Temple and Dancy varieties) developed by Israel’s Volcani Institute
of Agricultural Research.
The bulk of the Israeli citrus industry is located in Central (48 percent) and Southern Israel (31
percent). However, there is also significant citrus production in Northern Israel (21 percent).
Table 4: Citrus Orchards by Variety, Hectares and Percentage
Hectares %
Grapefruit 4,150 22
Oranges 4,150 22
Mandarins
(easy peelers) 8,450 44
Lemons and Limes 1,920 10
Pomelos and Others 386 2
Total 19,056 100% Source: The Plants Production and Marketing Board, Citrus Division, Israel.
Table 5: Citrus Orchards by Area, Hectares and Percentage
Hectares %
Northern Israel 4,002 21
Central Israel 9,147 48
Southern Israel 5,907 31
Total 19,056 100% Source: The Plants Production and Marketing Board, Citrus Division, Israel.
Consumption:
Post estimates local consumption of fresh citrus fruit in MY 2012/2013 at about 179 TMT, up by 2
percent from the previous marketing year. About 25 TMT, or 14 percent of total consumption is
absorbed by the Palestinian Authority (PA).
We estimate per capita consumption of citrus in Israel at about 20 kilograms per annum. Per
capita consumption in the PA administered West Bank is calculated at 9.5 kilograms. The Central
Intelligence Agency estimates (July 2012) Israel’s population at roughly 7.7 million and the West
Bank’s population at 2.6 million.

The Israeli Citrus Processing Industry
Two groups control Israel’s citrus processing industry. There are only three citrus processing
plants in Israel.
Citrus producers’ deliveries to processing plants in MY 2011/2012 registered a total of nearly 232
TMT, a 66 percent increase compared to the previous marketing year. About two-thirds of citrus
deliveries were grapefruit.
Table 6: Delivery to the Processing Plants, metric tons
2008/09 2009/10 2010/11 2011/12
Tons % Tons % Tons % Tons %
Oranges 53,500 24 45,772 25 18 38,092 16
Grapefruit 141,674 63 107,076 59 63 153,008 66
Mandarins 25,408 11 26,840 15 23,037 16 37,723 16
Lemons 2,728 1 2,515 1 2,368 2 2,631 1
Total 223,310 100 182,203 100 139,906 100 231,454 100 Source: The Plants Production and Marketing Board, Citrus Division, Israel.
Post finds that citrus processing prices commanded a premium in MY 2011/2012 despite higher
supply volumes. Prices paid on average where:
Red grapefruit - $120/tons
White grapefruit - $180/ton
Oranges - $170/ton
Mandarins - $80/ton
With the ongoing decline in orange production in Israel, processing plants are turning to overseas
sources (mainly Brazil) for oranges for processing.
Frozen Concentrated Orange Juice
Israeli processors produce concentrates, juice, bases, puree, and slices. About 70 percent of these
products are exported to the European Union (EU), the rest is consumed domestically. Annual per
capita consumption of juices and nectars is roughly 4-5 liters. This amount is increasing due to the
decrease in consumption of carbonated soft drinks.
With local orange production contracting in recent years, FCOJ imports have increased significantly.
In calendar year 2011, orange juice imports reached $48 million, up 138 percent compared to the
previous year. Roughly 30,000 metric tons of FCOJ were imported in 2011. The combination of
pest infestation, along with inclement weather in 2010 adversely affected Israel’s orange crop,
driving up FCOJ imports in 2011.
Better growing conditions in MY 2011/2012 and MY 2012/2013 are leading to orange production
increases that will limit the need of imports for processing in 2013. Post estimates that in 2013
imports of orange juice will fall to about 24,500 metric tons, dropping by 1,500 metric tons or 6
percent compared to the previous calendar year.
Trade:
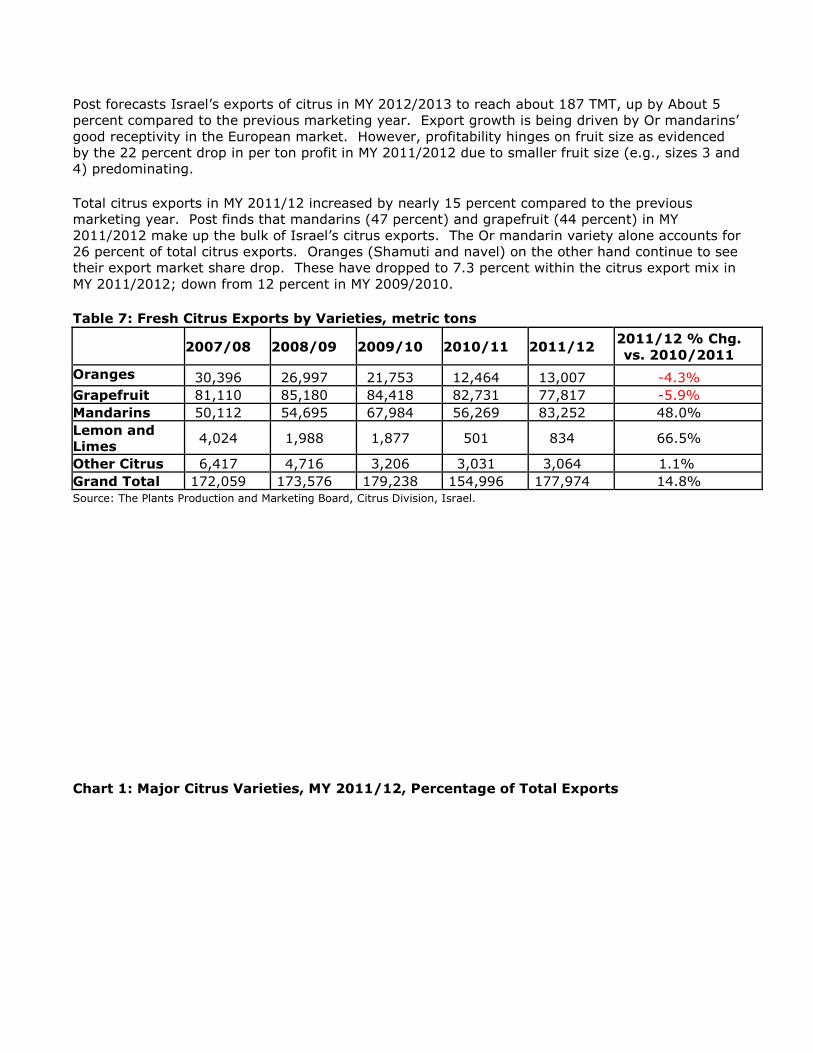
Post forecasts Israel’s exports of citrus in MY 2012/2013 to reach about 187 TMT, up by About 5
percent compared to the previous marketing year. Export growth is being driven by Or mandarins’
good receptivity in the European market. However, profitability hinges on fruit size as evidenced
by the 22 percent drop in per ton profit in MY 2011/2012 due to smaller fruit size (e.g., sizes 3 and
4) predominating.
Total citrus exports in MY 2011/12 increased by nearly 15 percent compared to the previous
marketing year. Post finds that mandarins (47 percent) and grapefruit (44 percent) in MY
2011/2012 make up the bulk of Israel’s citrus exports. The Or mandarin variety alone accounts for
26 percent of total citrus exports. Oranges (Shamuti and navel) on the other hand continue to see
their export market share drop. These have dropped to 7.3 percent within the citrus export mix in
MY 2011/2012; down from 12 percent in MY 2009/2010.
Table 7: Fresh Citrus Exports by Varieties, metric tons
2007/08 2008/09 2009/10 2010/11 2011/12 2011/12 % Chg.
vs. 2010/2011
Oranges 30,396 26,997 21,753 12,464 13,007 -4.3%
Grapefruit 81,110 85,180 84,418 82,731 77,817 -5.9%
Mandarins 50,112 54,695 67,984 56,269 83,252 48.0%
Lemon and
Limes 4,024 1,988 1,877 501 834 66.5%
Other Citrus 6,417 4,716 3,206 3,031 3,064 1.1%
Grand Total 172,059 173,576 179,238 154,996 177,974 14.8% Source: The Plants Production and Marketing Board, Citrus Division, Israel.
Chart 1: Major Citrus Varieties, MY 2011/12, Percentage of Total Exports
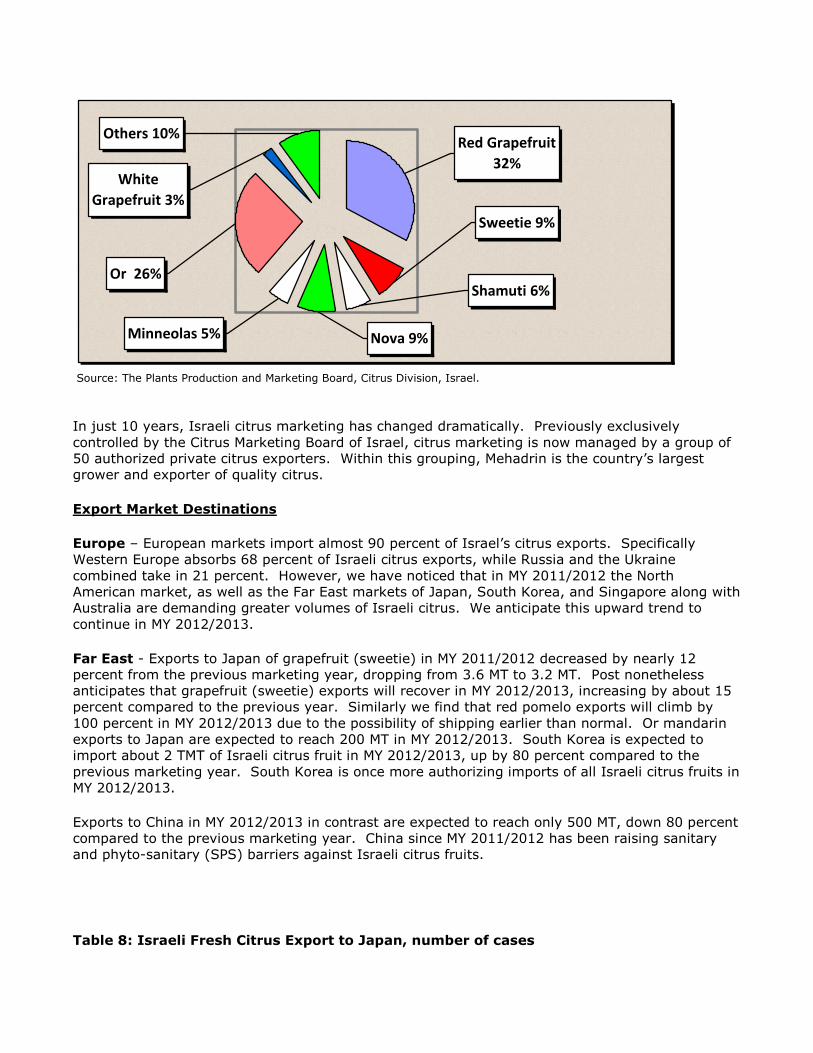
Red Grapefruit
32%
Sweetie 9%
Shamuti 6%
Nova 9%Minneolas 5%
Or 26%
White
Grapefruit 3%
Others 10%
Source: The Plants Production and Marketing Board, Citrus Division, Israel.
In just 10 years, Israeli citrus marketing has changed dramatically. Previously exclusively
controlled by the Citrus Marketing Board of Israel, citrus marketing is now managed by a group of
50 authorized private citrus exporters. Within this grouping, Mehadrin is the country’s largest
grower and exporter of quality citrus.
Export Market Destinations
Europe – European markets import almost 90 percent of Israel’s citrus exports. Specifically
Western Europe absorbs 68 percent of Israeli citrus exports, while Russia and the Ukraine
combined take in 21 percent. However, we have noticed that in MY 2011/2012 the North
American market, as well as the Far East markets of Japan, South Korea, and Singapore along with
Australia are demanding greater volumes of Israeli citrus. We anticipate this upward trend to
continue in MY 2012/2013.
Far East - Exports to Japan of grapefruit (sweetie) in MY 2011/2012 decreased by nearly 12
percent from the previous marketing year, dropping from 3.6 MT to 3.2 MT. Post nonetheless
anticipates that grapefruit (sweetie) exports will recover in MY 2012/2013, increasing by about 15
percent compared to the previous year. Similarly we find that red pomelo exports will climb by
100 percent in MY 2012/2013 due to the possibility of shipping earlier than normal. Or mandarin
exports to Japan are expected to reach 200 MT in MY 2012/2013. South Korea is expected to
import about 2 TMT of Israeli citrus fruit in MY 2012/2013, up by 80 percent compared to the
previous marketing year. South Korea is once more authorizing imports of all Israeli citrus fruits in
MY 2012/2013.
Exports to China in MY 2012/2013 in contrast are expected to reach only 500 MT, down 80 percent
compared to the previous marketing year. China since MY 2011/2012 has been raising sanitary
and phyto-sanitary (SPS) barriers against Israeli citrus fruits.
Table 8: Israeli Fresh Citrus Export to Japan, number of cases

2009/10 2010/11 2011/12
Sweetie 269,160 249,000 220,112
Red Pomelo 4,064 5,208 1,092
White Grapefruit 8,840 11,552 0 Source: The Plants Production and Marketing Board, Citrus Division, Israel.
Table 9: Citrus Exports, Far East plus Australia, metric tons, MY 2011/2012
Japan 3,194
China 2,543
South Korea 1,132
Singapore 414
Australia 966
Total 8,249
Percent of Total Exports 8,249/ 177,974=4.6% Source: The Plants Production and Marketing Board, Citrus Division, Israel.
U.S. and Canada – Post anticipates that exports of Israeli citrus to the North American market in
MY 2012/2013 will reach 11,000 tons, up 50 percent compared to the previous marketing year.
Mandarins will remain the primary export. Previously in MY 2011/2012, citrus exports to North
America had gone up by 180 percent compared to MY 2010/2011. Israeli exporters are actively
targeting the North American market.
Table 10: Citrus Exports, North America, metric tons
2009/10 2010/11 2011/12 2011/12 % Chg. vs. 2010/2011
United States 2,024 1,352 2,578 91%
Canada 967 1,366 4,953 263%
Total 2,991 2,718 7,531 177% Source: The Plants Production and Marketing Board, Citrus Division, Israel.
Oranges – Post anticipates exports of oranges to reach 13.5 TMT in MY 2012/2013, an increase of
4 percent compared to the previous marketing year. We find that higher than normal supplies of
oranges will allow Israeli exporters to offer these at more competitive prices in MY 2012/2013.
Israel’s Shamuti orange exports in MY 2011/2012 were down due to increasing competition from
rival orange exporting countries.
Table 11: Oranges Varieties Exports, metric tons
2008/09 2009/10 2010/11 2011/12 2011/12 % Chg. vs. 2010/2011
Navels 1,843 1,895 663 482 -27%
Shamuti 17,449 17,302 8,696 10,733 23%
Valencia 7,705 2,461 3,051 1,717 -44%
Total 26,997 21,658 12,410 12,932 4% Source: The Plants Production and Marketing Board, Citrus Division, Israel.
Tangerines/Mandarins (Easy Peelers) – Post forecasts total mandarin exports in MY
2012/2013 to reach about 93 TMT, a 12 percent increase compared to the previous marketing
year. Ramped up local production is stepping up to meet growing foreign import demand. Already
in MY 2011/2012 Or mandarins reached a record high of 46 TMT, up 50 percent compared to the
previous marketing year.

We anticipate that in MY 2012/2013 the Or mandarin variety will by itself reach 50 TMT, up 8
percent compared to the previous marketing year. Sources indicate that Or mandarin exports will
likely reach 92 TMT in MY 2014/2015, up by 190 percent when compared to MY 2010/2011. The
bulk of Or mandarins exports occur between January and March.
Table 12: Mandarins (easy-peelers) Varieties Exports, metric tons
2008/09 2009/10 2010/11 2011/12
2011/12 % Chg. vs.
2010/2011
Minneola 6,901 11,667 6,964 9,077 30%
Nova 17,829 18,628 11,684 16,267 39%
Or 17,956 25,973 30,986 46,388 49%
Others 12,009 11,716 6,438 11,520 49%
Total 54,695 67,984 56,072 83,252 48% Source: The Plants Production and Marketing Board, Citrus Division, Israel.
Grapefruit – Post forecasts Israeli grapefruit production in MY 2012/2013 at roughly 70 TMT, 10
percent down from the previous marketing year. Israel’s grapefruit production in MY 2012/2013
started strong, but is now evidencing signs of a gradual slowdown. Growing competition from
Spain and Turkey, based on proximity and lower shipping costs, routinely undercut Israeli export
prices.
Israel’s competitive advantage is based on an earlier start to the harvest season. This allows
Israel to fill the production gap between the end of the South African season and availability of
fruit from Florida (United States), Spain, and Turkey. Israeli grapefruit exporters actively target
consumers in Italy, France, Germany, the Ukraine, and Russia.
Exports of red grapefruit in MY 2011/2012 increased by 5 percent compared to the previous
marketing year. Post estimates that red grapefruit makes up 75 percent of total exports. Exports
of white grapefruit reached 6.6 TMT in MY 2010/2011, declining by 38 percent compared to the
previous marketing year. The drop is attributable to decreased Japanese demand for the sweetie
grapefruit variety.
Table 13: Grapefruit Varieties Exports, metric tons
2008/09 2009/10 2010/11 2011/12
2011/12 % Chg. vs.
2010/2011
White
Grapefruit
11,480 10,764 6,627 4,520 -32%
Red Grapefruit 60,338 61,215 64,025 58,135 -9%
Sweetie 13,362 12,439 12,051 15,162 26%
Total 85,180 84,418 82,703 77,817 -6% Source: The Plants Production and Marketing Board, Citrus Division, Israel.
Other Citrus – Israel’s exports of white pomelos in MY 2011/2012 at 1.3 TMT were up 19 percent
compared to the previous marketing year. However, its exports of red pomelos at 1.1 TMT were
down about 17 percent. Post estimates that due to China’s strong presence in the market, Israeli
citrus growers will further scale back pomelo production. We anticipate a drop of about 20 percent
in the next few years given pomelo’s declining commercial profitability.
Table 14: Grapefruit Varieties Exports, metric tons
2009/10 2010/11 2011/12
2011/12 % Chg. vs.
2010/2011

Red Pomelo 1,315 1,340 1,118 -17%
White Pomelo 944 1,084 1,291 19%
Limquat and
Kumquat
539 398 439 10%
Lemons 1,877 501 834 66%
Lime 408 209 216 3%
Total 5,083 3,532 3,898 10% Source: The Plants Production and Marketing Board, Citrus Division, Israel.
Policy:
Post is unaware of any significant policy issues impacting local production. Israel’s exports are
also largely free of adverse policy considerations.
Exports of U.S. citrus to Israel are not currently permissible. A Pest Risk Assessment (PRA) has not
been conducted for U.S. citrus. Until a PRA is performed, U.S. citrus is not allowed to enter
Israel. Indications are that even should Israel’s Plant and Protection Service conduct a PRA for U.S.
citrus, high shipping costs will hinder U.S. citrus exports to Israel.
Table 15: Tariff-rate Quotas, U.S. Fresh Citrus, Orange and Grapefruit Juices, U.S.-Israel
Agreement on Trade in Agricultural Products
Description Total Quota (metric tons) Duty
Oranges* 1,689 0%
Lemons* 506 0%
Grapefruit* 1,689 0%
Other Citrus
(non-easy peelers)* 1,689 0%
Frozen Orange Juice
(packages over 100 kg) 4,154 0%
Frozen Grapefruit Juice
(packages over 100 kg) 1,016 0%
* Requires a Pest Risk Assessment (PRA). Without a PRA the product cannot enter Israel.
** Within the quota it is duty-free. Kilograms = kg.
The U.S.-Israel Agreement on Trade in Agricultural Products (ATAP) grants U.S.-origin frozen
orange juice (FCOJ) exporters a duty free tariff-rate quota (TRQ) of 4,154 metric ton, as well as a
1,016 metric ton frozen grapefruit juice TRQ.
Marketing:
In Israel fruit and vegetable consumption exceeds daily recommended amounts. Israelis, much like
their European counterparts, are moving away from traditional citrus fruits such as oranges and
grapefruit and switching to easier peeling, more compact sweeter mandarins. Industry sources
confirm that this trend is widely expected to continue at the least through the medium-term.
Surveys highlight that for consumers, citrus’ freshness and its flavor along with appearance and
juiciness are its greatest appeal. Consumers also welcome seedless citrus varieties’ practicalities.
Production, Supply and Demand Data Statistics:

Oranges, Fresh Israel 2010/2011 2011/2012 2012/2013
Market Year Begin: Oct 2010 Market Year Begin: Oct 2011 Market Year Begin: Oct 2012 USDA Official New Post USDA Official New Post USDA Official New Post
Area Planted 4,350 4,300 4,400 4,200 4,150
Area Harvested 3,900 3,900 3,950 3,870 3,950
Bearing Trees 0 0 0 0 0
Non-Bearing Trees 0 0 0 0 0
Total No. Of Trees 0 0 0 0 0
Production 100 100 131 116 130
Imports 0 0 0 0 0
Total Supply 100 100 131 116 130
Exports 13 12 12 13 15
Fresh Dom. Consumption 62 63 71 65 67
For Processing 25 25 48 38 48
Total Distribution 100 100 131 116 130
HECTARES, 1000 TREES, 1000 MT
Tangerines/Mandarins, Fresh Israel 2010/2011 2011/2012 2012/2013
Market Year Begin: Oct 2010 Market Year Begin: Oct 2011 Market Year Begin: Oct 2012 USDA Official New Post USDA Official New Post USDA Official New Post
Area Planted 6,100 7,700 6,500 8,450 8,700
Area Harvested 4,600 5,600 4,800 6,050 6,388
Bearing Trees 0 0 0 0 0
Non-Bearing Trees 0 0 0 0 0
Total No. Of Trees 0 0 0 0 0
Production 125 125 169 166 175
Imports 0 0 0 0 0
Total Supply 125 125 169 166 175
Exports 54 56 72 83 90
Fresh Dom. Consumption 49 46 50 45 47
For Processing 22 23 47 38 38
Total Distribution 125 125 169 166 175
HECTARES, 1000 TREES, 1000 MT
Grapefruit, Fresh Israel 2010/2011 2011/2012 2012/2013
Market Year Begin: Oct 2010 Market Year Begin: Oct 2011 Market Year Begin: Oct 2012 USDA Official New Post USDA Official New Post USDA Official New Post
Area Planted 4,700 4,300 4,660 4,200 4,150
Area Harvested 4,180 3,900 4,140 3,950 4,000
Bearing Trees 0 0 0 0 0
Non-Bearing Trees 0 0 0 0 0
Total No. Of Trees 0 0 0 0 0
Production 190 190 205 245 235
Imports 0 0 0 0 0

Total Supply 190 190 205 245 235
Exports 83 83 85 78 76
Fresh Dom. Consumption 19 19 21 14 14
For Processing 88 88 99 153 145
Total Distribution 190 190 205 245 235
HECTARES, 1000 TREES, 1000 MT
Lemons/Limes, Fresh Israel 2010/2011 2011/2012 2012/2013
Market Year Begin: Oct 2010 Market Year Begin: Oct 2011 Market Year Begin: Oct 2012 USDA Official New Post USDA Official New Post USDA Official New Post
Area Planted 1,830 1,880 1,845 1,920 1,920
Area Harvested 1,570 1,750 1,580 1,850 1,860
Bearing Trees 0 0 0 0 0
Non-Bearing Trees 0 0 0 0 0
Total No. Of Trees 0 0 0 0 0
Production 30 30 61 53 56
Imports 0 0 0 0 0
Total Supply 30 30 61 53 56
Exports 1 1 3 1 2
Fresh Dom. Consumption 27 27 55 49 51
For Processing 2 2 3 3 3
Total Distribution 30 30 61 53 56
HECTARES, 1000 TREES, 1000 MT
Orange Juice Israel 2010/2011 2011/2012 2012/2013
Market Year Begin: Oct 2010 Market Year Begin: Oct 2011 Market Year Begin: Oct 2012 USDA Official New Post USDA Official New Post USDA Official New Post
Deliv. To Processors 25,000 25,000 46,000 38,000 48,000
Beginning Stocks 500 500 800 800 500
Production 2,300 2,300 4,200 3,500 4,430
Imports 30,000 30,000 26,400 26,000 24,500
Total Supply 32,800 32,800 31,400 30,300 29,430
Exports 16,100 16,100 15,600 14,000 13,830
Domestic Consumption 15,900 15,900 15,400 15,800 15,500
Ending Stocks 800 800 400 500 100
Total Distribution 32,800 32,800 31,400 30,300 29,430
MT