j. zoo/., lond. - coweeta ltercoweeta.uga.edu/publications/941.pdf · j. zoo/., lond. (1987) 212,...
TRANSCRIPT
J. Zoo/., Lond. (1987) 212, 151-176
Microhabitat use in a stream fish assemblage
G. D. GROSSMAN AND M A R Y C. FREEMAN
School of Forest Resources, University of Georgia, Athens, GA 30602, USA
(Accepted 13 August 1986)
(With 7 figures in the text)
We examined microhabitat use among fishes in a 37-m section of Coweeta Creek, NorthCarolina. Numerical abundances of species changed substantially during the 17-month studyperiod. Microhabitat availability, however, did not change markedly during our investigation.Seasonal principal component analyses of microhabitat availability and fish microhabitat usedata extracted two main patterns of non-random microhabitat use. Clinostomus fimduloides,Notropis coccogenis and Semotilus atromaculatus were significantly over-represented in deepareas with low to intermediate velocities and depositional substrata. Camposloma o/igo/epis,Cottus bairdi, Etheostoma blennioides, Rhinichthys cataractae and Salmo gairdneri all occurredin intermediate to deep microhabitats with moderate to high velocities and erosional substrata.Five of seven species exhibited seasonal variation in microhabitat utilization, whereas six speciesdisplayed size-related variation in use. Size-related variation was probably ontogenetic. Weattributed most seasonal changes in microhabitat use to variations in microhabitat availability.
We used canonical analysis of discriminants to identify factors maximizing interspecificdifferences in microhabitat use. This analysis indicated that species could be assigned to eithera benthic or a water column guild. Species within a guild generally could not be differentiatedstatistically, whereas members of different guilds were readily separable. These patterns persistedthroughout the study, despite changes in numerical abundances of assemblage members. Therewas no evidence of either exploitation or interference competition for microhabitat, conse-quently it is unlikely that spatial resources were limiting during our study.
ContentsPage
Introduction 152Methods 152
The study site 152Microhabitat measurements 152Microhabitat use 153
Results 154Seasonal variation in numerical abundances 154Seasonal variation in microhabitat availability 154Microhabitat use 155Interspecific comparisons of microhabitat use 164Seasonal and annual variation in microhabitat use 164Size-related variation in microhabitat use 168Interspecific differences in microhabitat use 169
Discussion 170Intra- and interspecific patterns in microhabitat use 170Geographical patterns in microhabitat use 171Effects of predators 171Microhabitat use in other stream fish assemblages 172
Summary 173References 174
1510022-5460/87/005151 +26 S03-00 © 1987 The Zoological Society of London

152 G. D. G R O S S M A N AND M. C. F R E E M A N
Introduction
Streams are common aquatic habitats throughout the temperate zones. Hence, these systemsare of interest from both basic and applied scientific perspectives. At present, however, consider-able disagreement exists over the major processes affecting assemblage organization in streamfishes (Grossman et al. 1982, 1985; Herbold, 1984; Rahel, Lyons & Cochran, 1984; Yant, Karr& Angermeier, 1984). Some investigators maintain that coexistence among stream fishes can beattributed to partitioning of resources such as food or space (Zaret & Rand, 1971; Gorman &Karr, 1978; Page & Schemske, 1978; Herbold, 1984). In particular, it has been suggested thatspatial resource partitioning is very important for coexistence of stream fishes (Sheldon, 1968;Mendelson, 1975; Gorman & Karr, 1978; Baker & Ross, 1981; Paine, Dodson & Power, 1982;Wynes & Wissing, 1982; Herbold, 1984). Other investigators, however, maintain that resourcepartitioning may not be of general importance to stream fishes, due to the frequency of naturaldisturbances such as floods (for a complete presentation of this argument see Grossman et al.1982, 1985). Our purpose herein is to determine, through a study of microhabitat use, whetherspatial resource partitioning exists in a southern Appalachian stream fish assemblage. Microhab-itat use was examined because, if spatial resource partitioning (sensu Grossman, 1982) is presentwithin an assemblage, then differential microhabitat use must occur. Consequently, we addressedthe following questions during our 17-month study: (1) does microhabitat availability exhibitseasonal or annual variation?; (2) do assemblage members display differential microhabitat use?;(3) does intraspecific microhabitat use vary on a seasonal, annual, or size-related (i.e. ontogenetic)basis?; (4) if differential use is present, is it indicative of resource partitioning and is it affectedby variations in assemblage structure?
Methods
The study siteMicrohabitat observations were made in Coweeta Creek at the US Forest Service Coweeta Hydrologic
Laboratory, Otto, North Carolina. This creek is a relatively undisturbed, fourth-order stream (sensuStrahler, 1957), representative of lotic systems occurring in mixed hardwood-conifer forests in the BlueRidge Province of the Appalachian mountains. The study site consisted of a 37-m section of the creek andincluded 3 pools, 2 runs (areas with measurable current but no surface disruption) and 4 riffles (shallowareas with high velocities, marked surface disruption and rubble-gravel substrata). During the course ofthe study, maximum and minimum stream widths ranged from 9-1 m to 11-9m and 3-1 m to 4-2 m,respectively. The study site also was of sufficient size to encompass the home ranges of the dominant species(Hill & Grossman, 1987). Streamside vegetation was abundant and consisted primarily of rhododendron(Rhododendron maximum), dogwood (Cornusflorida) and mountain laurel (Kalmia latifolia).
Microhabitat measurements
Fish observations were made during daylight hours by snorkelling in an upstream direction. Althoughthis assumed that the majority of important interactions occurred during daylight hours, nocturnal obser-vations indicated that substantial increases in interspecific interactions did not occur after sunset (J. Hill,School of Forest Resources, University of Georgia, pers. comm.). In addition, Fahy (1954) concluded thatone assemblage member (Etheostoma blennioides) did not exhibit diel distributional differences in a NewYork stream, although recent observations have questioned this finding (L. Greenberg, Institute of Lim-nology, University of Lund, pers. comm.). Finally, 5 of the 9 assemblage members were cyprinids. Membersof this family typically are quiescent during nocturnal periods (Helfman, 1978).
MICROHABITAT USE IN S T R E A M FISHES 153
After an undisturbed fish was located, its position was noted and the following 13 measurements made:average current velocity, focal point velocity, water column depth, distance from substratum, distancefrom shelter, identity of all species within 20 cm of the specimen (i.e. nearest neighbour), and the percentagecomposition of 7 substratum categories (bedrock, boulder, rubble, gravel, sand, silt, debris) in a 400 cm2
quadrat directly below the fish. Substratum classes were determined by maximum particle diameters(boulder— > 30cm, rubble— < 30cm and > 2-5 cm, gravel— <2-5 and > 0-2 cm, sand— < 0-2 cm,and silt—material capable of suspension in the water column). A second individual stationed downstreamrecorded data obtained by the diver. Velocity measurements were made to the nearest cm/sec using anelectronic velocity meter. For depths less than 75 cm, average velocity measurements were made at 0-6 thedistance from the surface to the substratum (Bovee & Milhous, 1978). For depths greater than 75 cm, weconsidered average velocity to be the mean of measurements taken at 0-2 x and 0-8 x water column depth.All linear measurements (to the nearest cm) were made using a meter stick. Shelter was defined as anyobject capable of concealing at least 50% of the fish's body. Substratum composition was estimated visually.We also used the following scale to make visual abundance estimates of all species in the study site:0 = none observed; 1 = 1-5 individuals; 2 = 6-10 individuals; 3 = 11-20 individuals; and 4 = more than20 individuals observed.
The presence of a slow-moving observer did not appear to affect fish behaviour and specimens frequentlyfed directly underneath or within 20 cm of observers. Reproductive behaviour of both Salmo gairdneri(introduced within the last 70 years) and Clinostomus funduloides was also observed within 50 cm of divers.Disturbed fishes were readily identifiable because they exhibited characteristic escape responses. To avoidbehavioural disturbance of schooling species, measurements were made on a maximum of 4 individualsfrom the same school. We attempted to minimize disturbance of the study site by generally making fishmeasurements at 2-day intervals.
To quantify inter-observer variability, we conducted preliminary observations, during which independentestimates made by observers on identical specimens were compared. Differences among divers usually wereless than 5%, indicating minimal inter-observer bias.
Microhabitat availability was determined by measuring water column depth, average current velocity,and substratum composition in randomly selected 400 cm2 quadrats in the study site. In general, fishobservations were made during a 2-week period, followed by measurement of microhabitat availability,and an additional 2 weeks of fish data were then collected. Dates of data collection for each samplingperiod were as follows: summer 1983—11 July to 10 August; autumn 1983—26 October to 9 November;spring 1984—22 March to 24 April; summer 1984—5 July to 18 August; autumn 1984—26 September to1 November. During these periods, stream height was monitored to ensure that availability measurementswere representative of the entire period.
During summer 1983, microhabitat availability measurements were made every 0-5 m across transectsplaced 1-0 m apart along the banks (# quadrats = 472). The number of quadrats examined in subsequentseasons ranged from 30-42 and was determined by calculating the number of quadrats necessary to detectan 8% change in the variable that had the highest coefficient of variation, and a mean percentage compositionrate of at least 10% in the microhabitat availability measurements for the previous season (see Zar, 1974).
Microhabitat useTo test for the presence of non-random microhabitat use, a separate principle component analysis
(henceforth PCA) was conducted on the availability data for each season. The data were transformed byeither In (linear measurements) or arcsine (percentages) to stabilize variances, and reduce heteroscedasticityand kurtosis. Components that had eigenvalues > 1 and were significantly different from all smallercomponents were retained, using Bartlett's sphericity test (Pimentel, 1979). The remaining componentsthat were not ecologically interpretable also were discarded (Pimentel, 1979).
PCA was used in order to extract independent components that could be interpreted as axes describingpatterns of microhabitat variation within the stream. The relative abundances of microhabitats on a given
154 G. D. GROSSMAN AND M. C. F R E E M A N
axis were estimated by plotting the frequency distribution of component scores for the random quadratsamples. We then tested for non-random use by superimposing the fish microhabitat data on the axesextracted from the availability data, as follows. Individual fish were scored for each component by multiply-ing the vector of component score coefficients by the microhabitat use data for each specimen. Componentswere then divided into score classes and frequency distributions calculated for both availability and usedata. Using the availability data for expected frequencies, a x2 goodness of fit test was used to determinewhether significant differences existed between microhabitat availability and use data for each species. Ifspecies randomly occupied microhabitats, then distributions for availability and use data should not besignificantly different. If a significant result was obtained, we conducted a partitioned x2 analysis (Zar,1974) to determine which classes contributed to statistical significance (where the data were tested repeat-edly, alphas were set using the Dunn-Sidak procedure to ensure that experiment-wise error rates were 0-05or less, Ury, 1976). Criteria for expected values were set using the technique of Roscoe & Byars (1971). Iffewer than 5 observations were obtained for a species, it was not included in the analysis.
The habitat availability data consisted of a subset of the types of data collected for microhabitat use,because certain measurements require the presence of a specimen (e.g. distance from substratum, distancefrom shelter, and focal point velocity). Hence, the results of the microhabitat use analysis best reflectdifferences between the vertical section of the water column (including substratum) occupied by the fish,and the 'average' section of the water column present in the study site. Consequently, our ability to detectmicrohabitat preferences was decreased.
To quantify interspecific differences in microhabitat use, we first subjected all data to a Kruskal-Wallis (henceforth K-W) test (distribution free ANOVA) to identify variables that differed among species.Variables that did not show a significant species effect were deleted from further analyses. A canonicalanalysis of discriminants (henceforth CAD) was then conducted on variables that did show a significantspecies effect, to identify multivariate axes that maximized among-group separation. We retained canonicalaxes that had variance ratios greater than one. The variance ratio represents the sum of squares attributableto the among-group effect divided by the sum of squares of the within-group effect (SAS Institute, 1982).This ratio is a useful criterion for axis selection because axes with variance ratios less than one do notcontribute significantly to among-group discrimination. To identify interspecific differences in canonicalspace, we performed a K-W test on the canonical scores of each species for all axes. If the K-W test wassignificant, Tukey-Kramer rank multiple comparison tests were then used to elucidate pair-wise interspecificdifferences. Seasonal differences in habitat availability and intraspecific microhabitat use, as well as size-related differences in intraspecific microhabitat use, were examined using the same procedure except thatthe treatment effect in the initial K-W test was season or size rather than species. Because size and age arestrongly correlated in fishes, size-related differences probably can be viewed as ontogenetic.
Results
Seasonal variation in numerical abundances
Six of nine species always were present in the study site. Fluctuations in abundance wereobserved for most species (Table I) and there was a general increase in abundance duringautumn 1984. These abundance variations generally corresponded with variations in bimonthlyelectroshocking population estimates made during 1984 in a site located approximately 50mupstream (Grossman et al., unpubl. data). Such correspondence indicates that visual estimateswere sufficiently precise to detect variations in population size exhibited by assemblage members.
Seasonal variation in microhabitat availability
Univariate analyses indicated that average current velocity (K-W value = 27-67, P < 0-0001),water column depth (K-W value = 10-02, P < 0-05), and percentage substratum silt (K-W value
MICROHABITAT USE IN STREAM FISHES
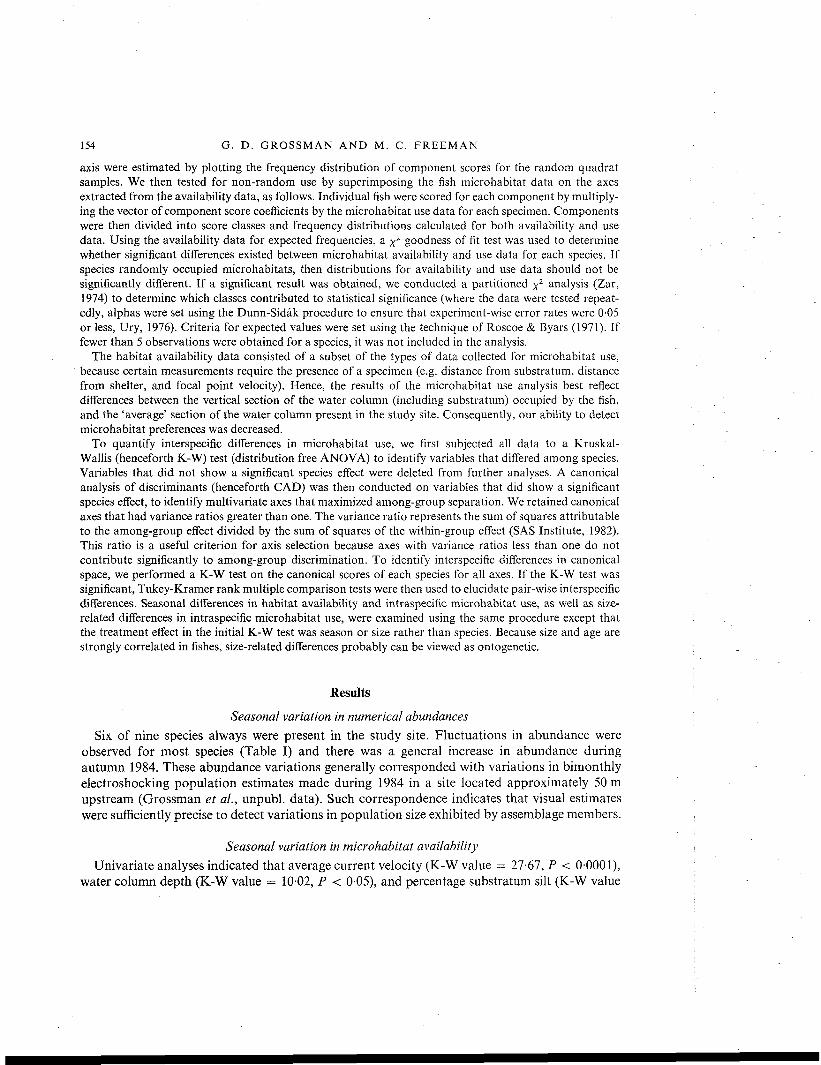
TABLE IAbundance estimates (x+1 S.D.)for Coweeta Creek assemblage members. Abundance classes are as follows:0 = 0 individuals observed; 1 = 1-5 individuals; 2 = 6-10 individuals; 3 = 11-20 individuals; 4 = more
than 20 individuals observed
155
Campostoma oligolepisClinostomus funduloidesCottus bairdiEtheostoma blennioidesHypentelium nigricansNotropis coccogenisRhinichthys cataraclaeSalmo gairdneriSemotilus atromaculatus
Summer1983
0-0 + 0-03-0+1-42-1+0-90-5 + 0-60-0 + 0-00-5 + 0-61-8 + 0-80-5 + 0-61-0 + 0-0
Autumn1983
0-7 + 0-53-1+0-22-3+0-80-3+0-50-3 + 0-50-6 + 0-50-5 + 0-60-7 + 0-50-5 + 0-6
Spring1984
1-0 + 0-53-8 + 0-31-9 + 0-60-1+0-30-0 + 0-00-5 + 0-50-6 + 0-50-9 + 0-30-0 + 0-0
Summer1984
0-0 + 0-02-6 + 1-13-0 + 0-00-8 + 0-50-2 + 0-50-4 + 0-52-0 + 0-71-0 + 0-00-4 + 0-5
Autumn1984
2-1 + 1-34-0 + 0-03-0 + 0-61-0 + 0-00-5 + 0-61-6 + 0-81-1+0-41-1+0-40-6 + 0-5
Number of daysabundance estimateswere madeNumber of daysmicrohabitatmeasurementswere made
6-7*
* Varied by species
= 14-00, P < 0-01) differed significantly among seasons. Tukey-Kramer tests showed that:(1) average velocities were higher during spring 1984 than during any other season; (2) the substra-tum contained less silt in spring 1984 than during summer 1983, summer 1984, or autumn 1984;and (3) depth was greater in spring 1984 than during summer 1984. Despite these differences,none of the axes extracted by the CAD had variance ratios greater than one. Consequently, alldiscussion of seasonal changes in microhabitat availability are based on univariate analyses.
Microhabitat useSummer 1983
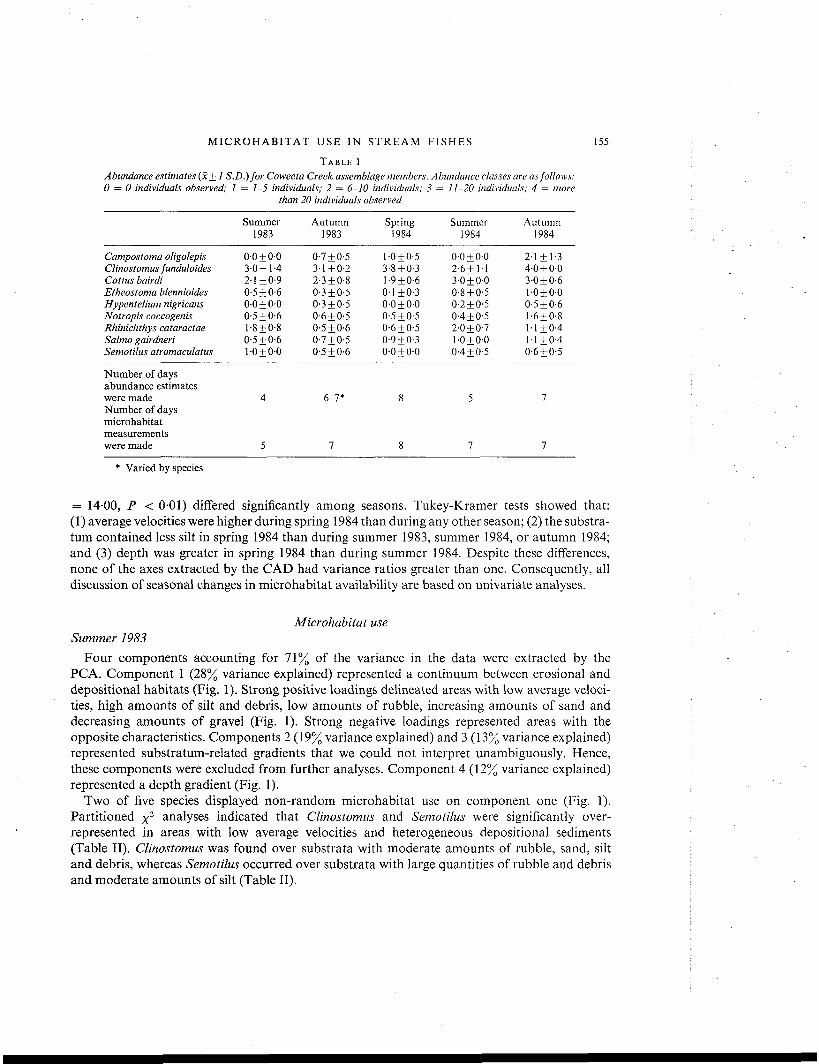
Four components accounting for 71% of the variance in the data were extracted by thePCA. Component 1 (28% variance explained) represented a continuum between erosional anddepositional habitats (Fig. 1). Strong positive loadings delineated areas with low average veloci-ties, high amounts of silt and debris, low amounts of rubble, increasing amounts of sand anddecreasing amounts of gravel (Fig. 1). Strong negative loadings represented areas with theopposite characteristics. Components 2 (19% variance explained) and 3(13% variance explained)represented substratum-related gradients that we could not interpret unambiguously. Hence,these components were excluded from further analyses. Component 4(12% variance explained)represented a depth gradient (Fig. 1).
Two of five species displayed non-random microhabitat use on component one (Fig. 1).Partitioned x2 analyses indicated that Clinostomus and Semotilus were significantly over-represented in areas with low average velocities and heterogeneous depositional sediments(Table II). Clinostomus was found over substrata with moderate amounts of rubble, sand, siltand debris, whereas Semotilus occurred over substrata with large quantities of rubble and debrisand moderate amounts of silt (Table II).

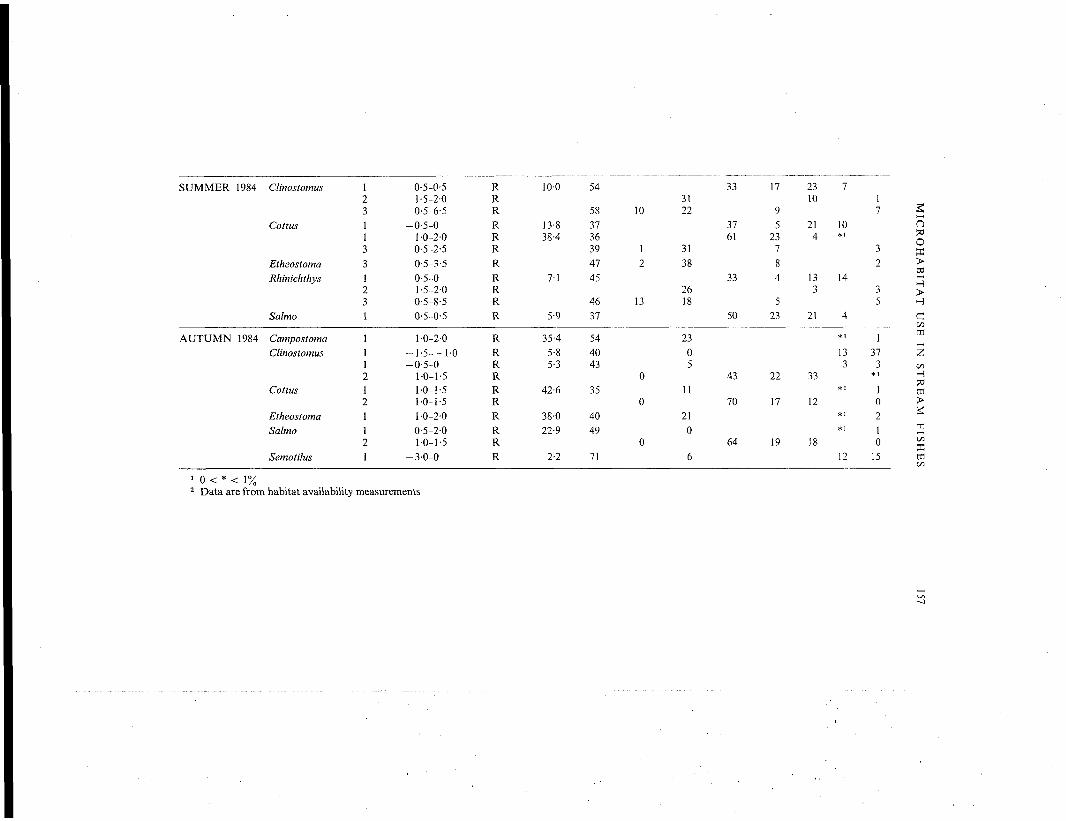
TABLE IIComponent categories in which habitat selection occurred. Presented are microhabitat data from categories which were either over- or under-represented in the
partitioned x2 analysis
Over- (R)or
under-score represented
Season
SUMMER 1983
AUTUMN 1983
SPRING 1984
Species
Clinostomus
RhinichlhysSemotilus
CampostomaClinostomus
Cottus
Campostoma
Clinostomus
Cottus
Notropis
Salmo
Component
14414
41242
14124241244
category
1-0-1-51-5-3-51-0-3-51-0-3-00-5-3-5
0-5-2-50-5-1-00-5-1-01-5-2-50-0-5
-0-5-01-0-2-0
-1-5-02-5-3-51-0-1-50-5-1-01-0-1-5
-1-0-0-1-5 — 0-5
0-5-2-01-0-2-0
(U)
RRRRR
RU2
RRR
RRRRRU2
RRRRR
Averagevelocity(cm/s)
7-0
3-3
31-8
17-7
15-926-9
61-7
11-37-6
Depth(cm)
5555
73
3052
46
727766
78
5874
7679
%Bedrock
0
503
0
0
0
00
°/ %Boulder Rubble
18
31
5248
42 21774 61
60
2893 1
23 54
670 67
°/ %Gravel Sand
*i 17
0 3
102
3
52
10
3
33
51
/<>Silt
19
13
110
2
2
3
5
°/Debris
11
50
13
3
2
2
3
O
D
OJ8O00
^̂
zDg
O•nmmS>z
SUMMER 1984 Clinostomus
Coitus
EtheostomaRhinichthys
Salmo
AUTUMN 1984 CampostomaClinostomus
Cottus
EtheostomaSalmo
Semotilus
12311331231
1112121121
-0-5-0-51-5-2-00-5-6-5
-0-5-01-0-2-00-5-2-50-5-3-5
-0-5-01-5-2-00-5-8-5
-0-5-0-5
1-0-2-0-1-5--1-0-0-5-0
1-0-1-51-0-1-51-0-1-51-0-2-00-5-2-01-0-1-5
-3-0-0
RRRRRRRRRRR
RRRRRRRRRR
10-0
13-838-4
7-1
5-9
35-45-85-3
42-6
38-022-9
2-2
54
58 10373639 147 245
46 1337
544043
035
04049
071
3122
3138
2618
2305
11
210
6
33
3761
33
50
43
70
64
17
95
23784
523
22
17
19
2310
214
133
21
33
12
18
7
10*!
14
4
*i133
*i
*i*i
12
17
32
35
1373
*i10210
15
gO9<>offi>to*_3>HC00rfl
ZonH73rn>£•nonXmon
1 0 < * < 1%2 Data are from habitat availability measurements
158 G. D. GROSSMAN AND M. C. F R E E M A N
Summer 1983
120 -
I 80 -CDncrCD 40 -LLI
Av. velocity (-0-77)% Rubble (-0-62)% Gravel (-0-47)
*
Habitat, n=427
tu% Silt (0-84)% Debris (0-62)% Sand (0-48)
^
Clinostomus, n=3612 -i
4 -
ocCD3crCD
—
•DM
TI
/ =30-81d.f.=7
~n n
4 -i
Semotilus, n=7
/ = 10-59"d.f.=2
-2 -1 0 1 2Component 1
120 -
80 -
40 -
crCD
0
Habitat, n=427
Depth (0-68)
Clinostomus, n=3612 -•
8 -
4 -
4 -
2 -
0/ =52-22***
d.f.=8
i—i 1 I 1
Rhinichthys,n='\~\
fm
il
/ = 10-99*d.f.=4
I I I
-7KT1
—
i
Semotilus, n=74 _
2 -/ =14-66***'
d.r.=2
7X?. KNN
NN
X
- 4 - 3 - 2 - 1 0 1 2 3Component 4
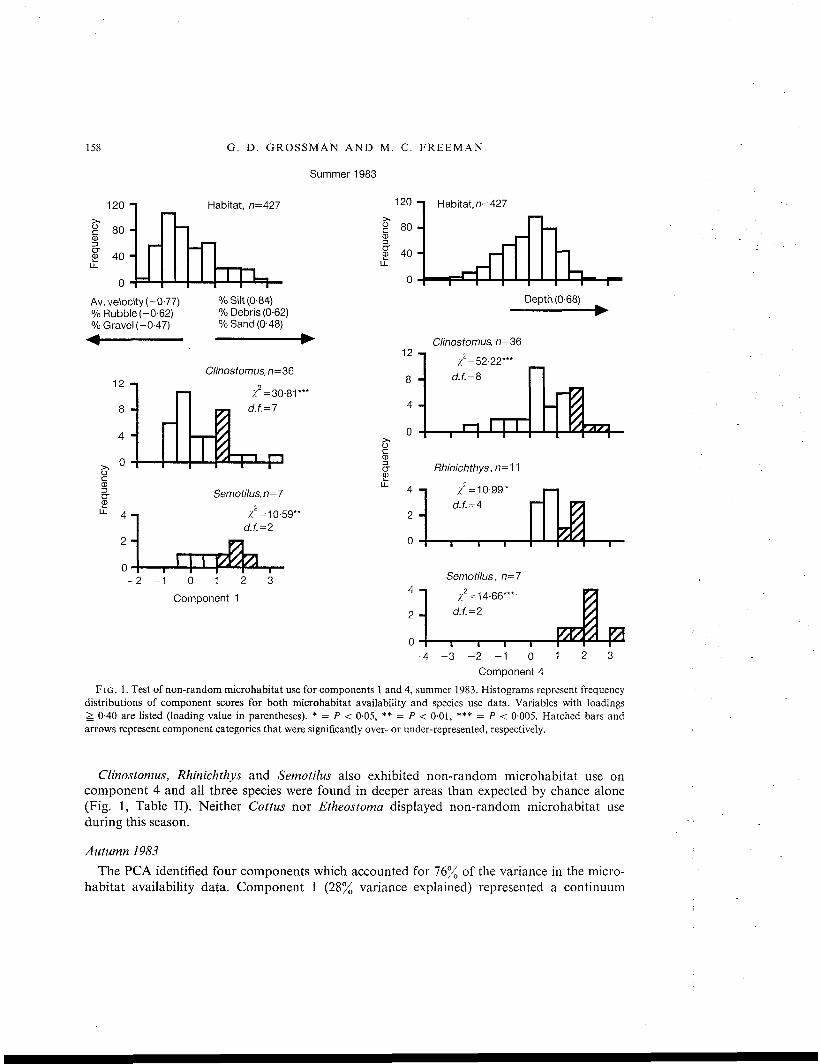
FIG. 1. Test of non-random microhabitat use for components 1 and 4, summer 1983. Histograms represent frequencydistributions of component scores for both microhabitat availability and species use data. Variables with loadings& 0-40 are listed (loading value in parentheses). * = P < 0-05, ** = / > < 0-01, *** = / > < 0-005. Hatched bars andarrows represent component categories that were significantly over- or under-represented, respectively.
Clinostomus, Rhinichthys and Semotilus also exhibited non-random microhabitat use oncomponent 4 and all three species were found in deeper areas than expected by chance alone(Fig. 1, Table II). Neither Cottus nor Etheostoma displayed non-random microhabitat useduring this season.
Autumn 1983
The PCA identified four components which accounted for 76% of the variance in the micro-habitat availability data. Component 1 (28% variance explained) represented a continuum
MICROHABITAT USE IN STREAM FISHES 159
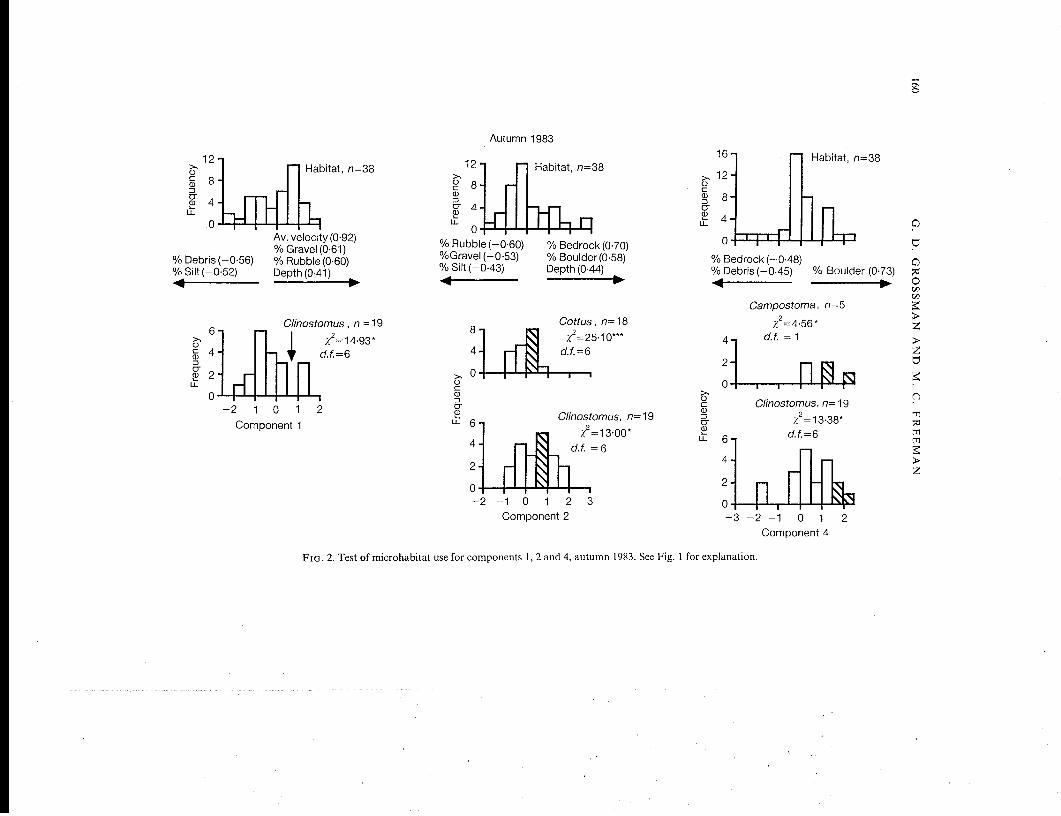
between erosional and depositional areas. Strong positive loadings on this component typifiedmicrohabitats with high average velocities, gravel and rubble substratas, and increasing depth(Fig. 2). Low velocity microhabitats with substrata dominated by debris and silt, and decreasingdepth, possessed strong negative loadings on component 1 (Fig. 2). Component 2 (22% varianceexplained) appeared to represent an environmental gradient similar to component 1 with theaddition of bedrock and boulders as important substratum categories and the deletion of averagevelocity (Fig. 4). Component 3 (15% variance explained) was not ecologically interpretable andcomponent 4 (11% variance explained) contrasted areas with predominantly boulder substratawith little bedrock or debris (strong positive loadings) and microhabitats with bedrock-debrissubstrata (strong negative loadings, Fig. 5).
Campostoma, Clinostomus and Cottus all exhibited non-random microhabitat use duringautumn 1983 (Fig. 2). Clinostomus was the only species that displayed selective use on component 1and was significantly under-represented in riffles (i.e. shallower areas with high average velocitiesand rubble-gravel substrata, Fig. 2, Table II). Non-random use on component 2 was detectedfor both Clinostomus and Cottus (Fig. 2). Both species occupied areas of moderate depth withpredominantly erosional substrata (Table II). Finally, Campostoma and Clinostomus were signifi-cantly over-represented over boulder substrata (Fig. 2, Table II).
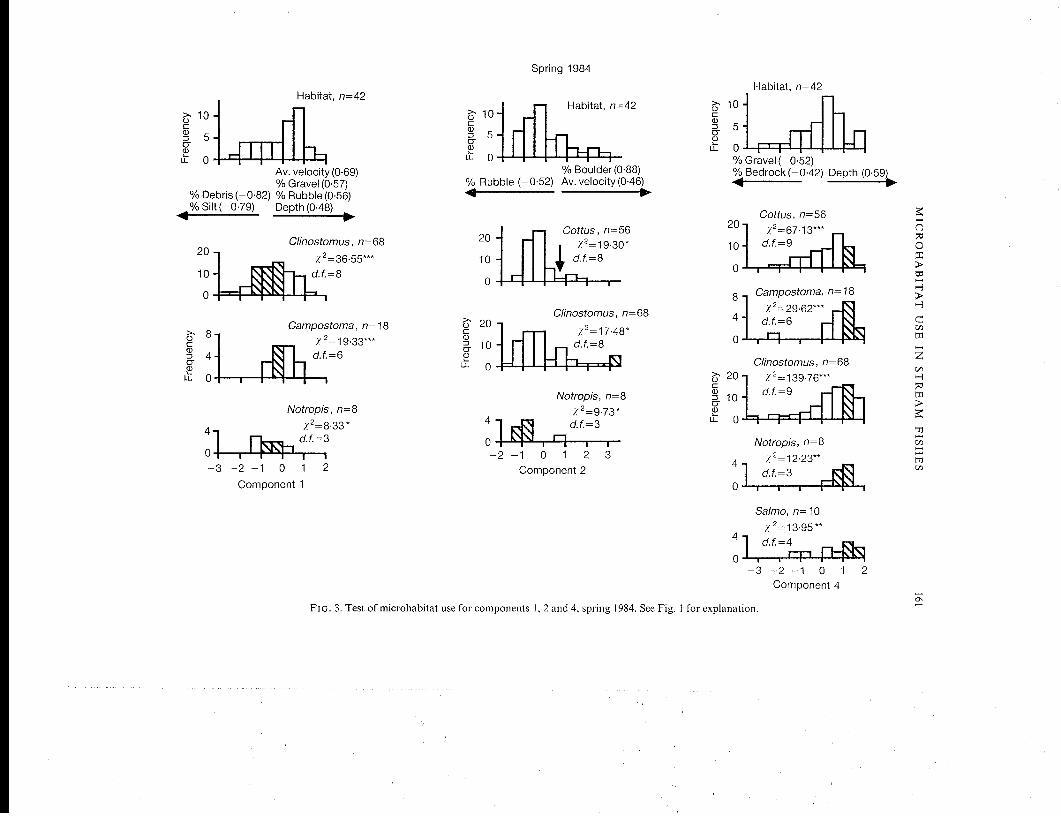
Spring 1984
Four components accounting for 75% of the variance in the habitat availability data wereextracted by the PCA. Component 1 (32% variance explained) was extremely similar to com-ponent 1 of the previous two seasons (Figs 1-3). Component 2 (17% variance explained) con-trasted microhabitats with boulder substrata and increasing average velocities (strong positiveloadings) with low velocity, rubble substratum areas (strong negative loadings, Fig. 3). Com-ponent 3 (13% variance explained) was an uninterpretable substratum component, and com-ponent 4 (13% variance explained) represented a gradient between deep areas with little bedrockor gravel (strong positive loadings) and shallow areas with gravel-bedrock substrata (strongnegative loadings, Fig. 3).
Non-random use was observed for three of six species on components 1 and 2, and five of sixspecies on component 4 (Fig. 3). Campostoma, Clinostomus and Notropis all occurredin deeper microhabitats with moderate average velocities and rubble-gravel substrata (Fig. 3,Table II).
Scores for Clinostomus and Notropis on component 2 displayed opposing patterns (Fig. 3).Clinostomus was over-represented in areas with high average velocities and boulder substrata,whereas Notropis occupied microhabitats with lower average velocities and rubble substrata (Fig.3, Table II). Cottus also exhibited non-random use on component 2 and was under-representedin areas with high average velocities (Fig. 3, Table II).
Campostoma, Clinostomus, Cottus, Notropis and Salmo all displayed non-random use oncomponent 4 (Fig. 3) and occupied deeper areas with little bedrock or gravel (Fig. 3, Table II).We were unable to detect non-random microhabitat use for Rhinichthys during spring 1984.
Summer 1984
Three principal components accounted for 69% of the variance in the microhabitat availabilitydata. As with previous seasons, component 1 (34% variance explained) represented a gradientbetween areas with high average velocities and erosional substrata and low velocity depositional
Autumn 1983
12 noc o .CD °ucrCD 4 -LL
o -I
r™-T
ik-1Av. ve%Gr
% Debris (-0-56) % Ru% Silt (-0-52) Depth•̂
Habitat, n=38 12~>,O p _c °CD3
_t] it -T
SSf %Rub0ble(-0.6
bSS) Sire531(0-41) /obllt(-U-4oi)
.̂ ^
1 b "Habitat, n=38
>< 12 •
— iT
3))
Clinostomus . n = 1 96n
S1
§ 4"| 2-u_
rfll1 1— 2 — 1 0
1
|1"
Component '
/= 14-93*d.f.=6 4"
"1 >- °-1 , 1
rli
1 ^0 ^""̂ <D
t 6-
•
2-
0- rf-|
—
I
ocCD g"n o"1 CD ,H n it 4~1 ' 1 ' 1
% Bedrock (0-70) °% Boulder (0-58) % BeDepth (0-44) ^ % De
-r-p-T
Habtat, n=38
noII .
I I I I Udrock(-0-48) obris(-0-45) % Boulder (0-73) 73K^ l̂ *\w 4 w w
1/3Campostoma, n=5 2
Coffos,n=18 /2=4-56* ^/2=25-10*** 4_
d.f. = 6 nS-, *1
R
10 1
1 10-
d.f. = 1 ;>zQ
^c Clinostomus, n=19 ' JQ)
Clinostomus, n=19 3 -/2— n.'w' ^* /. — I O oo TJ/ = 13-00* £ _ d.f. = 6 w
u- (3 -i fnd.f. =6
I 2-
2 3 o - n ri i
z:
Component 2 - 3 - 2 - 1 0 1 2Component 4
FIG. 2. Test of microhabitat use for components 1, 2 and 4, autumn 1983. See Fig. 1 for explanation.
81cCD=1crCD
c5 -
0
Habitat, n=42
Av. velocity (0-69)% Gravel (0-57)
% Debris(-0-82) % Rubble(0-56)% Silt (-0-79) Depth (0-48)
Ciinostomus, n=Q8Z2=36-55***
d.f.=8
Campostoma, n=18"=19-33***
:u
Notropis, n=8/2=8-33*
d.f>3
-3 -2-1 0 1Component 1
(D3crCD5 -
0
Spring 1984
r-1 Habitat, n=42
% Boulder (0-88)% Rubble (-0-52) Av. velocity (0-46)
20 -
10 -
0
Cottus, n=5Q72=19-30*i.f. = 8
10 -
0
Ciinostomus, n=Q8/2=17-48*
Notropis, n=8
d.f.=3o i Kf , n .-2-1 0 1 2
Component 2
Habitat, n=42
cCD3crCD5 -
0% Gravel (-0-52)% Bedrock (-0-42) Depth (0-59^
20 -i
10-
0
Cottus, n=56/2 = 67-13***
d.f>9
Campostoma, n=18/.2=2S
d.f.=6
S1 20 n
| ioH0
Ciinostomus, n=68/2 = 139-76***
d.f.=9
Notropis, 1=8
1 d.f.=3
Salmo, n=10/2= 13-95**
"1 d.f.=4
-3 -2-1 0 1Component 4
Soo
03H
Cc/ica
enHW
STlenmen
FIG. 3. Test of microhabitat use for components 1, 2 and 4, spring 1984. See Fig. 1 for explanation.
162 G. D. G R O S S M A N AND M. C. F R E E M A N
Summer 1984
15-i>,o§ 10-
1 5-Ul 5
Habitat, n=30
n F-r-r-nJ
— > 10-,OCCD c _ZJ O "cr
Habitat, n=30
-n-n
Av. velocity (0-84) % Boulder (0-73)% Rubble (0-78) J>/o Debris (-0-62) % Sand (0-52) ^
^% Sand (-0-70) Depth (0-43) ^
Cottus,n=4310-,
10-
5 -
A1—1 r/
/2=50-05"*
L"" o" r l̂*vi7] >•
cr_lg Clinostomus,n=48 "-
10 -
5 -
& o-l
_0rir's
M
? 1U-1X =60-46***
o r4!"T— | 3 0 1
Clinostomus, n=482
__ / =37-54m d.f.=8
" \\V^
Rhinichthys, n=3472=24-55***
~| d.f.=8
- Tffi
0 1 2 3§ Component 2
£ Rhinichthys, n=34
5 -m -1 72=54-73***
d.f. = 7
Salmo. n=1510 -i
5 -
0 -
/2=24-02***ry^ d.f. = 6
r-i Ir^Xl— i1 1 f I 1- 2 - 1 0 1 2
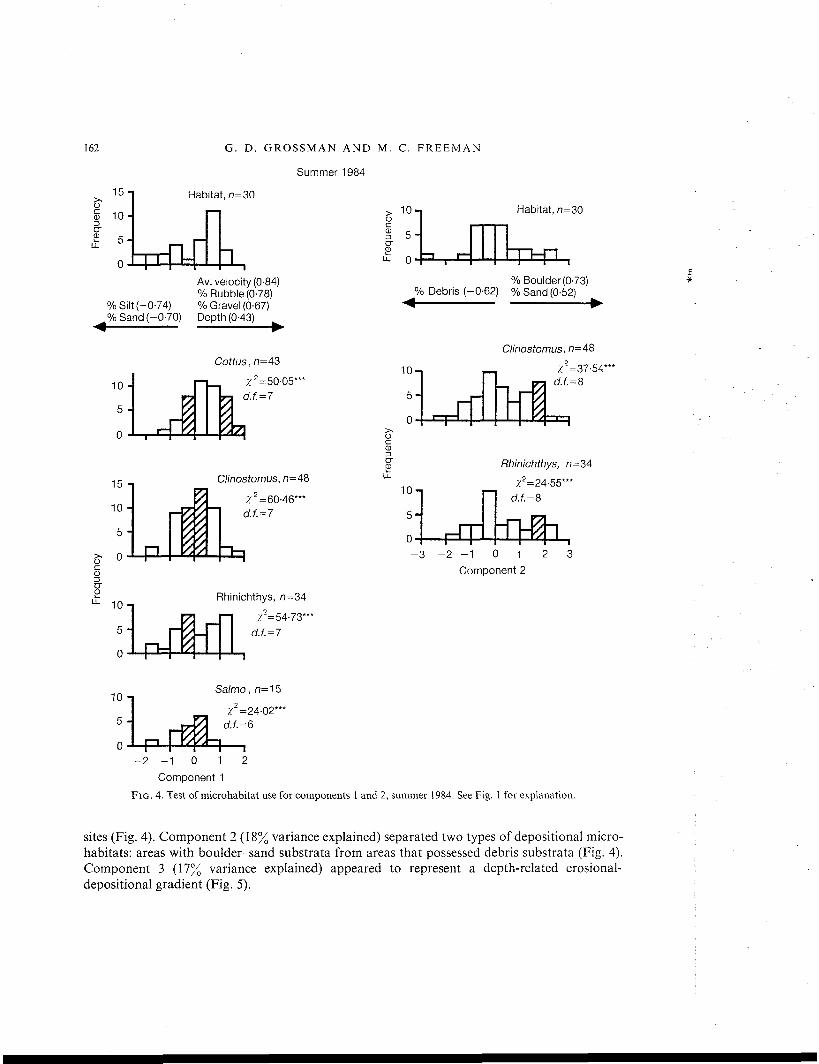
Component 1FIG. 4. Test of microhabitat use for components 1 and 2, summer 1984. See Fig. 1 for explanation.
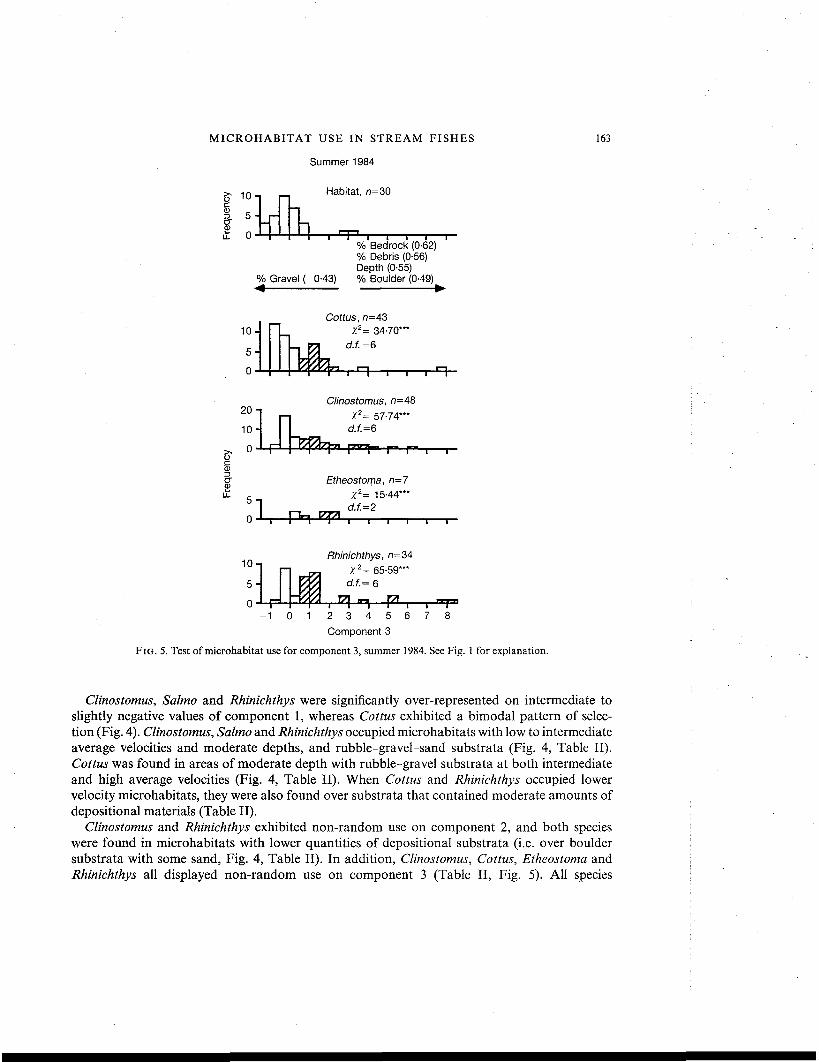
sites (Fig. 4). Component 2 (18% variance explained) separated two types of depositional micro-habitats: areas with boulder-sand substrata from areas that possessed debris substrata (Fig. 4).Component 3 (17% variance explained) appeared to represent a depth-related erosional-depositional gradient (Fig. 5).
MICROHABITAT USE IN STREAM FISHES
Summer 1984
Habitat, n=30
% Bedrock (0-62)% Debris (0-56)Depth (0-55)% Boulder (0-49)
163
% Gravel (-0-43)
g01f
Cottus, n=43X2= 34-70*"
d.f. =6
Clinostomus, n=48Z2= 57-74*"
Etheostoma, n=7x*= 15-44"*
-P=H
6 71 2 3 4 5Component 3
FIG. 5. Test of microhabitat use for component 3, summer 1984. See Fig. 1 for explanation.
Clinostomus, Salmo and Rhinichthys were significantly over-represented on intermediate toslightly negative values of component 1, whereas Cottus exhibited a bimodal pattern of selec-tion (Fig. 4). Clinostomus, Salmo and Rhinichthys occupied microhabitats with low to intermediateaverage velocities and moderate depths, and rubble-gravel-sand substrata (Fig. 4, Table II).Cottus was found in areas of moderate depth with rubble-gravel substrata at both intermediateand high average velocities (Fig. 4, Table II). When Cottus and Rhinichthys occupied lowervelocity microhabitats, they were also found over substrata that contained moderate amounts ofdepositional materials (Table II).
Clinostomus and Rhinichthys exhibited non-random use on component 2, and both specieswere found in microhabitats with lower quantities of depositional substrata (i.e. over bouldersubstrata with some sand, Fig. 4, Table II). In addition, Clinostomus, Cottus, Etheostoma andRhinichthys all displayed non-random use on component 3 (Table II, Fig. 5). All species
164 G. D. GROSSMAN AND M. C. FREEMAN
were significantly over-represented on positive values of this component (Fig. 5, Table II).Microhabitats selected were similar for all four species, and possessed moderate depths, andsubstrata dominated by boulders with bedrock, debris and gravel present (Fig. 5, Table II). Non-random microhabitat use was not detected for Semotilus during this season.
Autumn 1984
Although the PCA produced four components explaining 75% of the variance in the data, thelast two components (28% of total variance) were not ecologically interpretable.
Component 1 (27% variance explained) again represented a continuum between high velocityerosional areas (strong positive loadings) and low velocity depositional habitats (Fig. 6). Com-ponent 2 (20% variance explained) was substratum-related and represented a gradient of depo-sitional microhabitats (Fig. 6). This component was similar to component 2 of autumn 1983 andcomponent 3 of summer 1984. Strong positive loadings on component 2 delineated areas withsubstrata dominated by rubble, gravel and sand, whereas microhabitats with strong negativeloadings possessed debris-bedrock substrata (Fig. 6).
Six of nine species exhibited non-random use on component 1. Campostoma, Cottus, Etheo-stoma and Salmo occurred in intermediate to deep areas with high average velocities and, withthe exception of Salmo, some boulders (Fig. 6, Table II). In contrast, Clinostomus and Semotiluswere found in areas with low average velocities and depositional substrata (Fig. 6, Table II).
Clinostomus, Cottus and Salmo were also significantly over-represented on component 2 (Fig.6) and occupied microhabitats with rubble-gravel-sand substrata (Table II). Hypentelium, Notro-pis and Rhinichthys did not exhibit non-random microhabitat use during autumn 1984.
Interspecific comparisons of microhabitat use
Two main patterns of microhabitat use were observed among species. Clinostomus, Notropisand Semotilus all occupied deep areas with low to intermediate average velocities and depositionalsubstrata (Figs 1-6, Table II). Conversely, Campostoma, Cottus, Etheostoma, Rhinichthys andSalmo, all tended to occur in intermediate to deep habitats with moderate to high velocities anderosional substrata (Table II). These species were not classifiable as either riffle or pool dwellers,suggesting that microhabitat variation and use were continuous rather than discrete phenomenain this stream.
Many species did not exhibit non-random use during all seasons (Table II). The implicationsof this result are unclear; however, in some cases it may have been due to low sample sizes (e.g.Etheostoma, Hypentelium, Notropis and Semotilus). The low abundances of these species made itvery difficult to obtain large samples, and, as a consequence, our results must be viewed astentative (however, see Interspecific differences in microhabitat use). The lack of detectable differ-ential use during some seasons was probably also related to our inability to include certainmeasurements (e.g. distance from substratum and focal point velocity) in the microhabitatanalysis.
Seasonal and annual variation in microhabitat use
Our data were sufficient to examine seasonal and annual variation in microhabitat use in sevenof nine species. Campostoma, Clinostomus, Cottus and Notropis displayed significant seasonal orannual variation only in univariate analyses (Table III). The majority of this variation was

Frequency
o en o
.]1
Frequency
a cocr^;
0.0961CO
COTD ;..g SflL
C£T
CD00-N
0 0
T3OCD O3
CO
roo
Frequency
0 0 0 0 0 0
o aa> •t'
Frequency

166 G. D. GROSSMAN AND M. C. F R E E M A N
TABLE IIISeasonal changes in intraspecific microhabitat utilization. Data are the number of individualsobserved during periods used for comparisons, number of variables with significant Kruskal-Wallis
tests, and variance ratio values from CAD on the seasonal data
Species
Season Kruskal-WallisSummer Autumn Spring Summer Autumn tests Variance
1983 1983 1984 1984 1984 (# significant) ratio
CampostomaClinostomusCoitusEtheostomaNotropisRhinichthysSalmo
3633
5
11
51918
186856
86
10
4843
7
3415
37554617261520
I 1
83
53
023
07
no test2
0-660-15
no test0-41
no lest3-37
1 If data were present for only two seasons, a Wilcoxon sum of ranks test was used forhypothesis testing
2 See methods3 Significant univariate differences among seasons were present for these species; however,
except where noted in the text, these differences could be explained by seasonal variations inmicrohabitat availability
attributable to seasonal changes in microhabitat availability (i.e. observed differences were iden-tical to those occurring in the study site, see Seasonal variation in microhabitat availability). Thefollowing differences, however, appeared to represent real seasonal changes in microhabitat use:(1) Cottus occurred farther from shelter in autumn 1984 than during summer 1984; and (2)Clinostomus were found closer to the substratum in spring and autumn 1984 than during summerand autumn 1983, or summer 1984. Clinostomus also exhibited seasonal variation in the percent-age of gravel, sand and debris in the substratum, however, these differences were not readilyinterpretable.
Seasonal differences in microhabitat use were also exhibited by Salmo. Microhabitats occupiedby Salmo during spring 1984 were deeper and possessed higher average velocities and less sandand silt than those occupied in summer or autumn of 1984 (Table IV). These dissimilarities canalso be attributed to changes in microhabitat availability. Salmo, however, also exhibited a realdifference in use, because it occurred in deeper and faster microhabitats with less sand and silt inautumn 1984 than during summer 1984 (Table IV).
TABLE IVSeasonal differences in microhabitat utilization for Salmo, Kruskal- Wallis tests were conducted on canonical axisscores for each season and Tukey-Kramer tests used to identify interseasonal differences. Only variable loadingS: 0-40 are presented for the CAD. Seasonal abbreviations are as follows: summer 1983—S83; autumn 1983—A83;
spring 1984—Sp84; summer 1984—S84; autumn 1984—A84
Species
Salmo
Axis Variables
1*** Depth (0-71), average velocity (0-61)Sand (-0-45), silt (—0-44)
Kruskal-Wallis Tukey-Kramertest tests
30-71*** Sp84 > A84 > S84
*** P < 0-005
MICROHABITAT USE IN STREAM FISHES 167
Univariate and multivariate analyses generally yielded similar results. The discrepancies notedwere probably due to a lack of covariation among variables. Hence, analyses were based onunivariate data when multivariate results were nonsignificant.
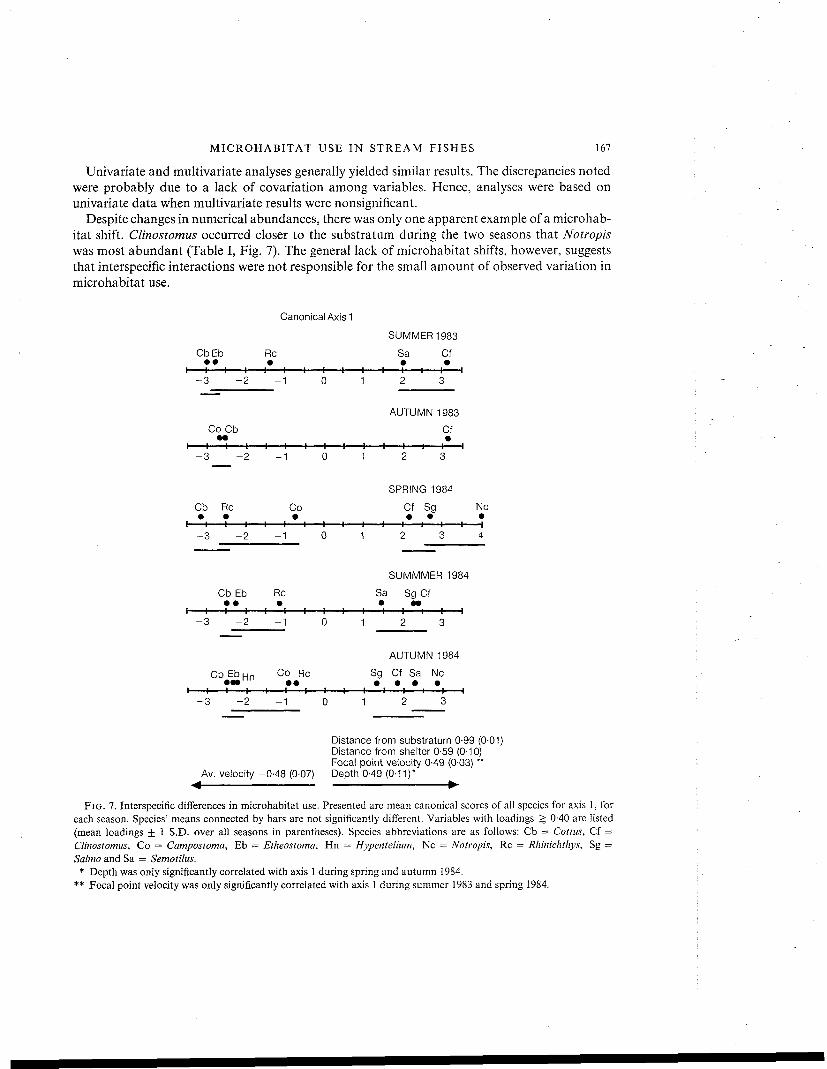
Despite changes in numerical abundances, there was only one apparent example of a microhab-itat shift. Clinostomus occurred closer to the substratum during the two seasons that Notropiswas most abundant (Table I, Fig. 7). The general lack of microhabitat shifts, however, suggeststhat interspecific interactions were not responsible for the small amount of observed variation inmicrohabitat use.
Canonical Axis 1SUMMER 1983
Cb Eb Re
-3 - 2 - 1 0 1
Co Cb
-3 - 2 - 1 0 1
Sa
2
AUTUMN
2
Cf
3
1983Cf
3
SPRING 1984Cb Re Co
-3 - 2 - 1 0 1
Cf Sg
2
Nc
3 4
Cb Eb
-3H H
-2
Re
-1H 1-
SUMMMER 1984Sa Sg Cf-H -*- -+- -I
AUTUMN 1984Cb I•
-3 -2
Co• i
-1
Re•
0
Sg
1
Cf Sa
2
Nc
3
Av. velocity -0-48 (0-07)
Distance from substratum 0-99 (0-01)Distance from shelter 0-59 (0-10)Focal point velocity 0-49 (0-03) "Depth 0-49 (0-11)*
FIG. 7. Interspecific differences in microhabitat use. Presented are mean canonical scores of all species for axis 1, foreach season. Species' means connected by bars are not significantly different. Variables with loadings S 0-40 are listed(mean loadings + 1 S.D. over all seasons in parentheses). Species abbreviations are as follows: Cb = Cottus, Cf =Clinostomus, Co = Campostoma, Eb = Etheostoma, Hn = Hypentelhim, Nc = Notropis, Re = Rhinichthys, Sg =Salmo and Sa = Semotilus.
* Depth was only significantly correlated with axis 1 during spring and autumn 1984.** Focal point velocity was only significantly correlated with axis 1 during summer 1983 and spring 1984.
168 G. D. GROSSMAN AND M. C. F R E E M A N
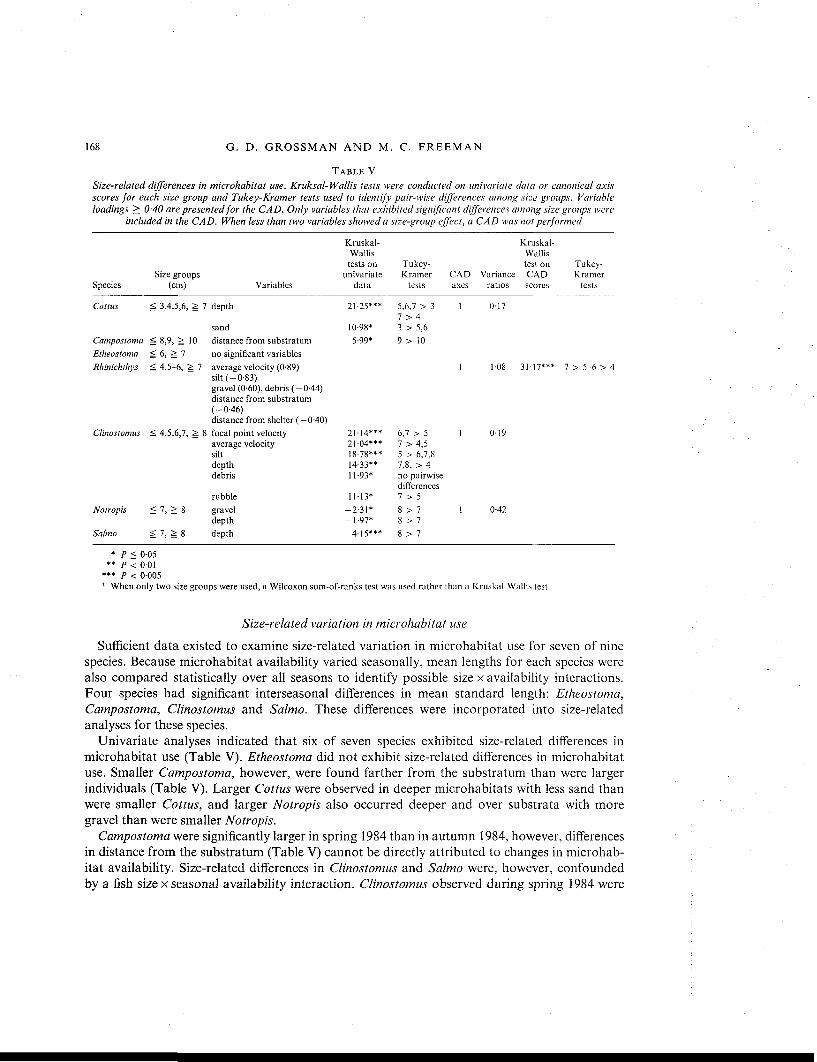
TABLE VSize-related differences in microhabitat use. Kruksal- Wallis tests were conducted on univariate data or canonical axisscores for each size group and Tukey-Kramer tests used to identify pair-wise differences among size groups. Variableloadings § 0-40 are presented for the CAD. Only variables that exhibited significant differences among size groups were
included in the CAD. When less than two variables showed a size-group effect, a CAD was not performed
Species
Coitus
CampostomaEtheoslomaRhinichthys
Size groups(cm)
£ 3,4,5,6, g 7
g 8,9, S 10S 6, S 7g 4,5-6, & 7
depth
sand
Variables
distance from substratum
Kruskal-Wallistests on
univariatedata
21-25***
10-98*5-99*
Tukey-Kramer
tests
5,6,7 > 37 > 43 > 5,69 > 10
CADaxes
1
Kruskal-Wallistest on Tukey-
Variance CAD Kramerratios scores tests
0-17
no significant variablesaverage velocity (0-89) 1 1-08 31-n*** 7 > 5-6 > 4silt (-0-83)gravel (0-60), debris (-0-44)distance from substratum(-0-46)distance from shelter ( — 0-40)
Clinostomus g 4,5,6,7, & i
Nolropis g 7, S 8
Salmo g 7, a 8
! focal point velocityaverage velocitysiltdepthdebris
rubblegraveldepthdepth
21-14***21-04***18-78***14-33**11-93*
11-13*-2-31*-1-97*
4.15***
6,7 > 5 17 > 4,55 > 6,7,87,8, > 4no pairwisedifferences7 > 58 > 7 18 > 78 > 7
0-19
0-42
* P g 0-05** P < 0-01
*** P < 0-0051 When only two size groups were used, a Wilcoxon sum-of-ranks test was used rather than a Kruskal-Wallis test
Size-related variation in microhabitat use
Sufficient data existed to examine size-related variation in microhabitat use for seven of ninespecies. Because microhabitat availability varied seasonally, mean lengths for each species werealso compared statistically over all seasons to identify possible size x availability interactions.Four species had significant interseasonal differences in mean standard length: Etheostoma,Campostoma, Clinostomus and Salmo. These differences were incorporated into size-relatedanalyses for these species.
Univariate analyses indicated that six of seven species exhibited size-related differences inmicrohabitat use (Table V). Etheostoma did not exhibit size-related differences in microhabitatuse. Smaller Campostoma, however, were found farther from the substratum than were largerindividuals (Table V). Larger Cottus were observed in deeper microhabitats with less sand thanwere smaller Cottus, and larger Notropis also occurred deeper and over substrata with moregravel than were smaller Notropis.
Campostoma were significantly larger in spring 1984 than in autumn 1984, however, differencesin distance from the substratum (Table V) cannot be directly attributed to changes in microhab-itat availability. Size-related differences in Clinostomus and Salmo were, however, confoundedby a fish size x seasonal availability interaction. Clinostomus observed during spring 1984 were
MICROHABITAT USE IN S T R E A M FISHES 169
significantly larger than those observed during autumn 1983. An identical relationship existedfor Salmo during spring and autumn 1984 (larger) versus summer 1984. Because microhabitatavailability changed during spring 1984 (i.e. the habitat was deeper with higher average velocitiesand less silt), the majority of size-related differences detected in these two species may have beendue to changes in microhabitat availability (see Table V). Clinostomus 1 cm in length did occurover substrata with more rubble than did 5 cm Clinostomus, however, the ecological significanceof this difference is unknown.
Rhinichthys was the only species that possessed a CAD with a variance ratio greater than one.Larger Rhinichthys were observed in habitats with higher average velocities, less silt and debris,and more gravel, than were smaller Rhinichthys (Table V). Larger individuals were also foundcloser to both substratum and shelter than were smaller specimens.
Size-related differences in microhabitat use generally were continuous and lacked transitionalphases (Table V). Thus, intraspecific microhabitat differentiation within these species was acontinuous rather than a discrete process.
Interspecific differences in microhabitat use
The CAD of seasonal interspecific microhabitat data yielded a common first axis for all fiveseasons (Fig. 7). In addition, this was the only axis with a variance ratio > 1. The presence of asimilar first axis for all five seasons indicates that interspecific differences in microhabitat usewere stable both seasonally and annually (Fig. 7), even though species' abundances variedsubstantially during the study (Table I). The locations of species along this axis established thepresence of two microhabitat guilds (sensu Root, 1967): (1) a benthic guild composed of Campo-stoma, Cottus, Etheostoma, Hypentelium and Rhinichthys', and (2) a water column guild composedof Clinostomus, Notropis, Salmo and Semotilus (Fig. 7). In general, species within a guild werenot statistically distinguishable, whereas members of different guilds were easily separable(Fig- 7).
Members of the benthic guild typically occurred on the bottom, close to or underneath shelter,in areas with high average velocities. There was a tendency, on a seasonal basis, for benthicspecies to occupy shallower water (spring and autumn 1984) and lower focal point velocities(summer 1983, spring 1984). Two members of this guild (i.e. Campostoma and Rhinichthys)occasionally occurred in the water column. This made them more readily distinguishable fromother benthic species (Fig. 7). The selection of water-column microhabitats was also size related,because larger Campostoma occurred higher in the water column than smaller individuals (TableV). The opposite pattern was observed in Rhinichthys', smaller individuals were found higher inthe water column than were larger Rhinichthys (Table V). In addition, Campostoma only waspresent seasonally (Table I) and probably occupied water column positions while migrating toand from the study site.
Members of the water-column guild were found far from the substratum and shelter, and atlow average velocities. During spring and autumn 1984, they occurred in deeper areas and hadhigher focal point velocities during summer 1983 and spring 1984.
It is possible that our inability to separate guild members statistically was due to the smallsample sizes obtained for some species (e.g. Etheostoma, Hypentelium, Notropis and Semotilus).If interspecific differences in microhabitat selection were being obscured by large variancestypically present in small samples, then there should be an inverse relationship between samplesize and sample variance of canonical scores (assuming that variances are distributed
170 G. D. GROSSMAN AND M. C. F R E E M A N
similarly for all species). To test for this possibility, we used a nonparametric correlation statistic(Spearman's r) to establish the relationship between sample size and sample variance for eachseason. The correlation analysis demonstrated that our inability to separate guild members wasnot due to small samples with large variances because sample variance was not correlated withsample size for any season [the autumn 1983 sample was not testable due to insufficient samplesize (n = 3); however, rs for autumn 1983 was 1-0, indicating a positive relationship betweenvariance and sample size].
In conclusion, the observed patterns of interspecific microhabitat use document the presenceof microhabitat guilds, with guild members generally displaying little differentiation in microhab-itat use (e.g. Campostoma and Rhinichthys, Etheostoma and Cottus, and Clinostomus, Salmo andSemotilus) (Fig. 7). The stability of these patterns, despite the observed variations in interspecificabundances, suggests that species were selecting microhabitats based on phylogenetic constraintsor convergent responses to common selective pressures rather than contemporary interspecificinteractions. The microhabitat shift exhibited by Clinostomus when Notropis was abundant,however, suggests that a competitive relationship may exist between these two species.
Discussion
Intra- and interspecific patterns in microhabitat use
Cause's principle states that species with similar resource use patterns should not be able tocoexist if resources are limited. Thus, many investigators have suggested that differential resourceuse is a result of competitive interactions. It then follows that species exhibiting very similarresource use patterns are either competing or the resource in question is not limiting. Ourresults indicate that Coweeta Creek fishes did not randomly occupy microhabitats, but exhibitedstatistically distinct patterns of microhabitat use. In addition, assemblage members could beassigned to either a water column or benthic microhabitat guild. Members of the same guildwere generally not distinguishable, whereas members of different guilds were readily separable.During the period examined, seasonal and annual variability in both intra- or interspecificmicrohabitat use were low, even though numerical abundances fluctuated substantially duringthe study. Several species, however, did exhibit subtle seasonal or size-related differences inmicrohabitat use. These data can be used to compare the mechanisms potentially responsiblefor the observed resource use patterns.
First, if competition existed for space, then it should have been manifested through either anexploitative or an interference mechanism. Exploitation competition requires that two speciesutilize a common resource with a concomitant decrease in fitness for at least one of the species.This frequently causes a niche shift in the inferior competitor or, in extremis, competitive ex-clusion. Our results demonstrate, however, that members of the same guild typically did notselect different microhabitats, nor did they exhibit niche shifts. Because these patterns weregenerally stable, despite the observed variations in numerical abundances, it is unlikely thatexploitation competition for space was present during the study period, with the exception of theinteraction between Clinostomus and Notropis. Although members of different guilds obviouslypossess differential capacities for microhabitat use, it is improbable that these differences areattributable to active competition. Instead, it is more likely that these dissimilarities are due tophylogenetic differences among species (Grossman, 1982, 1986).
It is also unlikely that interference competition for space was present in this assemblage.
MICROHABITAT USE IN STREAM FISHES 171
Interference competition requires a mechanism by which competitors are excluded from thepreferred micro habitat. Our data represent more than 100 hours of underwater observation, yetwe rarely observed interspecific agonistic interactions. Because members of the water columnguild displayed tendencies towards aggregation (Grossman & Freeman, unpubl. data), one wouldexpect frequent interspecific interactions if interference competition were occurring. Conse-quently, it also appears unlikely that interference competition for space was present during thestudy period. If space were not limiting, then the high microhabitat overlap exhibited by guildmembers was probably a result of convergent adaptation to a common selective pressure (i.e.maintaining position in a flowing medium), coupled with phylogenetic constraints on adaptiveresponses. For example, it is much more likely that members of the benthic guild occupy benthicmicrohabitats due to their phylogenetic histories, rather than to avoid competition with watercolumn species.
Geographical patterns in microhabitat use
Several authors have examined habitat use of species present in Coweeta Creek, but in othergeographical locations. Where comparisons are possible, our results generally support theirfindings. For example, both Gee & Northcote (1963) and Gibbons & Gee (1972) noted anontogenetic shift in R. cataractae towards areas with faster currents. We observed a similar result(Table V) in Coweeta Creek. Moshenko & Gee (1973) found that S. atromaculatus preferreddeeper areas in a Canadian prairie river, a result similar to ours. Winn (1958) and Fahy (1954)also described E. blennioides as occupying high velocity riffles with rubble substrata and ourfindings also confirm their results. These similarities suggest that microhabitat use is a fairlycanalized trait. Further study will be required to test this hypothesis.
Effects of'predators
Predators have been shown to affect the distribution of some stream fishes (Endler, 1978;Power & Matthews, 1983; Power, 1984). Fraser and his co-workers (Fraser & Cerri, 1982; Fraser& Emmons, 1984) have demonstrated that the presence of Semotilus atromaculatus affectedhabitat selection in Rhinichthys atratulus, although this effect was influenced by the availabilityof shelter and time of day. Semotilus almost always were present in our study site, although theirabundance was low (i.e. never more than four observed at one time in the 37-m study site).According to Fraser & Cerri (1982), most Semotilus were large enough to consume fish (i.e.> 100 mm TL); however, the gut contents of four Semotilus (x± 1 S.D. standard length = 92 +12mm) collected from Coweeta Creek did not contain any fish remains. In addition, we havenever observed avoidance of Semotilus by other fishes. Structural refuges were abundant in thestudy site, and the lack of noticeable avoidance may have been due to this factor, as noted byFraser & Emmons (1984). We also made observations during daylight and Fraser & Emmons(1984) only observed R. atratulus avoiding Semotilus at night. None the less, given the abundanceof shelter and the low densities of Semotilus, it is unlikely that Semotilus was a major factorinfluencing microhabitat use in this assemblage.
Cottus spp. are also known to be fish predators (Downhower & Brown, 1979; Finger, 1982,and references therein). We have examined the digestive tracts of 80 Cottus (size range 20-80mm, SL), collected between December 1983 and July 1984, and did not observe any evidence offish predation (S. Floyd, D. Stouder and G. Grossman, unpubl. data). Hence, it is unlikely thatpredation by Cottus strongly affected microhabitat use among Coweeta Creek fishes.

172 G. D. GROSSMAN AND M. C. F R E E M A N
We rarely observed non-piscine predators in the study site. Large salamanders (Desmognathusspp.) were also observed infrequently. In contrast, they were very abundant in other streams inthe Coweeta drainage where fishes were not present. One Northern water snake (Nerodia sipidon)was captured during the study; however, its gut contained only insect remains. Raccoons (Pro-cyan lotor) were seen on several occasions, yet we never observed evidence of raccoon predationon fishes. Conversely, the remains of crayfish eaten by raccoons were found repeatedly. Finally,only a single piscivorous bird (belted kingfisher, Megaceryle alcyon) was observed during thethree years that we have studied the Coweeta Creek ecosystem. Consequently, it is unlikely thatpredators had a strong effect on microhabitat use in this assemblage.
Microhabitat use in other stream fish assemblages
Studies of microhabitat use in North American stream fishes are not uncommon. In general,most investigators have relied on correlations between fish densities and habitat measurementsto quantify microhabitat use (Lewis, 1969; Moyle & Nichols, 1973; Stevenson, Schnell & Black,1974; Echelle & Schnell, 1976; Matthews & Hill, 1980; Felley & Hill, 1983). These techniquespossess several shortcomings, the most serious being an inability to quantify the microhabitatoccupied by individual fish. The use of underwater observational techniques minimizes theseshortcomings and this method is being used with increased frequency (Everest & Chapman,1972; Griffith, 1972; Fausch & White, 1981; Baltz, Moyle & Knight, 1982; Cunjak & Green,1983; Rimmer, Paim & Saunders, 1983; Moyle & Senanayake, 1984; Baltz & Moyle, 1984; Moyle& Vondracek, 1985).
Previous studies of microhabitat use in stream fishes have shown that high interspecific overlapis common (Mendelson, 1975; Baker & Ross, 1981; Moyle & Senanayake, 1984; Moyle &Vondracek, 1985). Despite these results, many investigators have concluded that spatial resourcepartitioning is an important factor facilitating coexistence. Few of these studies, however, exam-ined microhabitat use on a seasonal or multi-year basis; hence, the persistence of even the smallinterspecific differences noted is unknown.
None the less, spatial segregation does promote coexistence in other fish assemblages (Everest& Chapman, 1972; Cadwallader, 1975; Werner & Hall, 1976, 1977, 1979; Ebersole, 1985),although in the majority of cases microhabitat segregation was linked to trophic resources.Werner & Hall (1979) provide excellent documentation of this phenomenon in three species ofcentrarchid fishes inhabiting artificial ponds. When prey availability decreased in the preferredlittoral habitat, both Bluegill (Lepomis macrochirus) and Pumpkinseed (Lepomis gibbosus) shiftedto other habitats in which they exploited unique prey resources (i.e. Bluegill shifted to limneticareas and consumed plankton, whereas Pumpkinseed shifted to benthic habitats where theyconsumed hard-bodied benthic prey, Werner & Hall, 1979). Although a shift in microhabitat useoccurred, this shift was caused by a decrease in food availability, not by a decrease in spatialavailability. Thus, a microhabitat shift enabled the species to coexist, not because competitorswere partitioning spatial resources, but because food limitation existed and each microhabitatpossessed a unique food resource utilizable by only one species. Additional studies of spatialcompetition in fishes show a similar lack of independence between spatial and trophic resources(Chapman, 1966; Hixon, 1980; Ebersole, 1985).
Given these findings, it is difficult to conceive of space as an independent resource dimensionfor fishes and perhaps for other motile organisms. These species are not dependent upon spatialresources in the same manner that plants or sessile animals are. True space limitation might exist
MICROHABITAT USE IN STREAM FISHES 173
in fish assemblages if refuges from predation or reproductive sites were limiting, yet this rarelyhas been demonstrated for assemblages. McKaye (1977) observed interspecific competition forreproductive sites in a tropical lacustrine fish assemblage; however, the effects of this competitionon assemblage structure were not documented. In addition, due to the lack of relationshipbetween population size and recruitment in many fishes (Gushing, 1981), we question whetherinterspecific competition for spawning sites strongly affects fish assemblage dynamics.
The existence of interspecific competition for refuges has been shown for two pairs of streamfishes (Fausch & White, 1981; Baltz et al., 1982). Most studies that have documented strongpredator effects on fish assemblage structure, however, have dealt with introduced predators(Zaret & Paine 1973; Li & Moyle, 1981). The introduction of a top predator frequently resultedin the extinction of many native species; however, it is unknown whether extirpation was causedby interspecific competition for refuge sites or by predation itself. In addition, there is a paucity ofdata on the effects of interspecific competition for refuge sites within co-evolved fish assemblages.Consequently, we cannot evaluate the importance of this mechanism to assemblage organizationsin fishes. It would appear, however, that when competition for space has a strong effect on fishassemblage organization, it probably is a result of food limitation rather than spatial limitation.
Summary
Many North American streams are highly variable systems frequently subjected to floods anddroughts. Some evidence suggests that coexistence in these systems may be influenced more byunpredictable environmental disturbances than by competitive interactions (Grossman et al.,1982, and citations therein). Other authors have disagreed with this conclusion and have sug-gested that spatial and trophic resource partitioning are the primary mechanisms facilitatingcoexistence in stream systems (Gorman & Karr, 1978; Baker & Ross, 1981; Herbold, 1984; Yantet al., 1984). Our data demonstrate that, within guilds, species displayed extremely similarpatterns of non-random microhabitat use and generally were not statistically distinguishable.This pattern was persistent among seasons and between years (with the exception of Clinostomusand Notropis), despite substantial variations in population densities. In addition, there was littleevidence of strong interspecific interference competition for microhabitat. Hence, our data sug-gest that microhabitat competition was not an important factor influencing coexistence amongmost Coweeta Creek fishes, and they fit the predictions of Grossman et al. (1982) regardingresource use in streams subject to unpredictable disturbances. Competition for food, however,may still be present, and we are currently examining this possibility in an attempt to delineatethe mechanisms responsible for coexistence within this stream fish assemblage.
We would like to thank the staff of Coweeta Hydrologic Laboratory for access and aid during the courseof this study. Many individuals helped in the field and with data analysis: in particular J. Barrett, S. Dress,D. Facey, M. Flood, T. Goethe, H. Greening, J. Hightower, J. Hill, M. Kennedy and D. Stouder. Thisinvestigation could not have been undertaken without the support and understanding of B. Mullen andB. Freeman. Financial support was provided by Mclntire-Stennis Project $ GEOO-0035-MS to the seniorauthor and by the School of Forest Resources and Agricultural Experiment Station of the University ofGeorgia. The comments and criticisms of D. Baltz, J. Barrett, M. Collins, T. Coon, D. Facey, M. Flood,B. Freeman, J. Glasser, B. Goldowitz, B. Harvey, J. Hill, H. Li, E. Macpherson, P. Moyle, R. Pulliam,D. Stouder and T. Welsh greatly improved the paper, which was typed by B. Fancher.

174 G. D. GROSSMAN AND M. C. F R E E M A N
R E F E R E N C E SBaker, J. A. & Ross, S. T. (1981). Spatial and temporal resource utilization by southeastern cyprinids. Copeia 1981:
178-189.Baltz, D. M. & Moyle, P. B. (1984). Segregation by species and size classes of rainbow trout, Salmo gairdneri, and
Sacramento sucker, Catostomus occidentalis, in three California streams. Envir. Biol. Fishes 10: 101-110.Baltz, D. M., Moyle, P. B. & Knight, N. J. (1982). Competitive interactions between benthic stream fishes, riffle sculpin
(Coitusgulosus) and speckled dace (Rhinichlhys oscuhis). Can. J. Fish. Aqual. Sci. 39: 1502-1511.Bovee, K. D. & Milhous, R. T. (1978). Hydraulic simulation in instream flow studies: theory and technique. Instream
Flow Paper No. 5, U.S. Fish & Wildlife Service/Office of Biological Services—78/33.Cadwallader, P. L. (1975). A laboratory study of interactive segregation between two New Zealand stream-dwelling
fish. J. Anim. Ecol. 44: 865-875.Chapman, D. (1966). Food and space as regulators of salmonid populations in streams. Am. Nat. 100: 345-357.Cunjak, R. A. & Green, J. M. (1983). Habitat utilization by brook char (Salvelinus fonlinalis) and rainbow trout (Salmo
gairdneri) in Newfoundland streams. Can. J. Zoo/. 61: 1214-1219.Gushing, D. H. (1981). Fisheries biology. Madison, Wisconsin, USA: University of Wisconsin.Downhower, J. F. & Brown, L. (1979). Seasonal changes in the social structure of a mottled sculpin (Cottus bairdi)
population. Anim. Behav. 27: 451-458.Ebersole, J. P. (1985). Niche separation by two damselfish species by aggression and differential microhabitat utilization.
Ecology 66: 14-20.Echelle, A. A. & Schnell, G. D. (1976). Factor analysis of species associations among fishes of the Kiamichi River,
Oklahoma. Trans. Am. Fish. Soc. 105: 17-31.Endler, J. (1978). A predator's view of animal colour patterns. Evol. Biol. 11:319-364.Everest, F. H. & Chapman, D. W. (1972). Habitat selection and spatial interaction by juvenile chinook salmon and
steel-head trout in two Idaho streams. J. Fish. Res. Bd Can. 29: 91-100.Fahy, W. E. (1954). The life history of the Northern greenside darter, Etheostoma blennioides blennioides Rafinesque.
/. Elisha Mitchell sci. Soc. 70: 139-205.Fausch, K. D. & White, J. R. (1981). Competition between brook trout (Salvelinus fontinalis) and brown trout (Salmo
trutta) for positions in a Michigan stream. Can. J. Fish, aquat. Sci. 38: 1220-1227.Felley, J. D. & Hill, L. G. (1983). Multivariate assessment of environmental preferences of cyprinid fishes of the Illinois
River, Oklahoma. Am. Midi. Nat. 109: 209-221.Finger, T. R. (1982). Interactive segregation among three species of sculpins (Cottus). Copeia 1982: 680-694.Eraser, D. F. & Cerri, R. D. (1982). Experimental evaluation of predator-prey relationships in a patchy environment:
consequences for habitat use patterns in minnows. Ecology 63: 307-313.Fraser, D. F. & Emmons, E. E. (1984). Behavioral response of blacknose dace (Rhinichlhys atralulus) to varying densities
of predatory creek chub (Semotilus atromaculatus). Can. J. Fish, aquat. Sci. 41: 364-370.Gee, J. H. & Northcote, T. G. (1963). Comparative ecology of two sympatric species of dace (Rhinichlhys) in the Fraser
River system, British Columbia. J. Fish. Res. Bd Can. 20: 105-118.Gibbons, J. R. H. & Gee, J. H. (1972). Ecological segregation between longnose and blacknose dace (genus Rhinichthys)
in the Mink River, Manitoba. /. Fish. Res. Bd Can. 29: 1245-1252.Gorman, D. T. & Karr, J. R. (1978). Habitat structure and stream fish communities. Ecology 59: 507-515.Griffith, J. S., Jr (1972). Comparative behavior and habitat utilization of brook trout, Salvelinus fonlinalis, and cutthroat
trout, Salmo clarki, in small streams in northern Idaho. J. Fish. Res. Bd Can. 29: 265-273.Grossman, G. D. (1982). Community regulation and patterns of resource partitioning. In Proceedings of the Pacific
technical workshop on fish food habit studies No. 3: 166-176. Cailliet, G. & Simenstad, C. (Eds). Seattle, Washing-ton: Washington Sea Grant.
Grossman, G. D. (1986). Food resource partitioning in a rocky intertidal fish assemblage. J. Zoo/., Land. (B) 1:317-355.
Grossman, G. D., Freeman, M. C., Moyle, P. B. & Whitaker, J. O., Jr (1985). Stochasticity and assemblage organizationin an Indiana stream fish assemblage. Am. Nat. 126: 275-285.
Grossman, G. D., Moyle, P. B. & Whitaker, J. O., Jr (1982). Stochasticity in structural and functional characteristics ofan Indiana stream fish assemblage: a test of community theory. Am. Nat. 120: 423-454.
Helfman, G. S. (1978). Patterns of community structure in fishes: summary and overview. Envir. Biol. Fishes 3:129-148.
Herbold, B. (1984). Structure of an Indiana stream fish association: choosing an appropriate model. Am. Nat. 124:561-572.
MICROHABITAT USE IN S T R E A M F I S H E S 175
Hill, J. & Grossman, G. D. (1987). Home range estimates for three North American stream fishes. Copeia 1987 (Inpress).
Hixon, M. A. (1980). Competitive interactions between California reef fishes of the genus Emhiotoca. Ecology 61:918-931.
Lewis, S. L. (1969). Physical factors influencing fish populations in pools of a trout stream. Trans. Am. Fish. Soc. 98:14-19.
Li, H. W. & Moyle, P. B. (1981). Ecological analysis of species introductions into aquatic systems. Trans. Am. Fish. Soc.110: 772-782.
McKaye, K. R. (1977). Competition for breeding sites between the cichlid fishes of Lake Jiloa, Nicaragua. Ecology 58:291-302.
Matthews, W. J. & Hill, L. G. (1980). Habitat partitioning in the fish community of a southwestern river. SWest. Nat.25:51-66.
Mendelson, J. (1975). Feeding relationships among species of Notropis (Pisces: Cyprinidae) in a Wisconsin stream. Ecol.Monogr. 5: 199-230.
Moshenko, R. W. & Gee, J. H. (1973). Diet, time and place of spawning and environments occupied by creek chub(Semotilus atromaculatus) in the Mink River, Manitoba. /. Fish. Res. Bd Can. 30: 357-362.
Moyle, P. B. & Nichols, R. (1973). Ecology of some native and introduced fishes of the Sierra-Nevada foothills inCentral California. Copeia 1973: 478-490.
Moyle, P. B. & Senanayake, R. (1984). Resource partitioning among the fishes of rainforest streams in Sri Lanka./. Zoo/., Land. 202: 195-223.
Moyle, P. B. & Vondracek, B. (1985). Persistence and structure of the fish assemblage in a small California stream.Ecology 66: 1-13.
Page, L. M. & Schemske, D. W. (1978). The effect of interspecific competition on the distribution and size of darters ofthe subgenus Catonotus (Percidae: Etheosloma). Copeia 1978: 406-411.
Paine, M. D., Dodson, J. J. & Power, G. (1982). Habitat and food resource partitioning among four species of darters(Percidae: Etheostoma) in a southern Ontario stream. Can. J. Zoo/. 60: 1635-1641.
Pimentel, R. A. (1979). Morphometrics: the multivariate analysis of biological data. Dubuque, Iowa, USA: Kendall-Hunt.Power, M. E. (1984). Depth distributions of armored catfish: predator induced resource avoidance? Ecology 65:
523-528.Power, M. E. & Matthews, W. J. (1983). Algae grazing minnows (Campostoma anomalum), piscivorous bass (Micropterus
spp.), and the distribution of attached algae in a small prairie-margin stream. Oecologia 60: 328-332.Rahel, F. J., Lyons, J. D. & Cochran, P. A. (1984). Stochastic or deterministic regulation of assemblage structure? It
may depend on how the assemblage is defined. Am. Nat. 124: 583-589.Rimmer, D. M., Paim, U. & Saunders, R. L. (1983). Autumnal habitat shift of juvenile Atlantic salmon (Salmo salar) in
a small river. Can. J. Fish, aquat. Sci. 40: 671-680.Root, R. B. (1967). The niche exploitation pattern of the blue-grey gnatcatcher. Ecol. Monogr. 43: 95-124.Roscoe, J. T. & Byars, J. A. (1971). Sample size restraints commonly imposed on the use of the chi-square statistic.
J. Am. Stat. Assoc. 66: 755-759.SAS Institute (1982). SAS user's guide: statistics. Gary, North Carolina, U.S.A.Sheldon, A. L. (1968). Species diversity and longitudinal succession in stream fishes. Ecology 49: 193-197.Stevenson, M. M., Schnell, G. D. & Black, R. (1974). Factor analysis offish distribution patterns in western and central
Oklahoma. Syst. Zoo/. 23: 202-218.Strahler, A. N. (1957). Quantitative analysis of watershed geomorphology. Trans. Am. Geophys. Un. 36: 913-920.Ury, H. K. (1976). A comparison of four procedures for multiple comparisons among means (pairwise contrasts) for
arbitrary sample sizes. Technometrics 18: 89-97.Werner, E. E. & Hall, D. J. (1976). Niche shifts in sunfishes: experimental evidence and significance. Science, Wash. 191:
404-406.Werner, E. E. & Hall, D. J. (1977). Competition and habitat shift in two sunfishes (Centrarchidae). Ecology 58:
869-876.Werner, E. E. & Hall, D. J. (1979). Foraging efficiency and habitat switching in competing sunfishes. Ecology 60:
256-264.Winn, H. E. (1958). Comparative reproductive behavior and ecology of fourteen species of darters (Pisces-Percidae).
Ecol. Monogr. 28: 155-191.Wynes, D. L. & Wissing, T. E. (1982). Resource sharing among darters in an Ohio stream. Am. Midi. Nat. 107:
294-304.
176 G. D. GROSSMAN AND M. C. F R E E M A N
Yant, P. R., Karr, J. R. & Angermeier, P. (1984). Stochasticity in stream fish communities: an alternative interpretation.Am. Nat. 124: 573-582.
Zar, J. H. (1974). Biostatistical analysis. New York: Prentice Hall.Zaret, T. M. & Paine, R. T. (1973). Species introduction in a tropical lake. Science, Wash. 182: 421-437.Zaret, T. M. & Rand, A. S. (1971). Competition in tropical stream fishes: support for the competitive exclusion principle.
Ecology 52: 336-342.