january 8, 2013 | nepool markets committee
DESCRIPTION
January 8, 2013 | NEPOOL markets committee. Jonathan Lowell. Principal analyst | market development. Changes to the April 30 th Design to Comply with November 8, 2012 FERC Order. Regulation Market (Order 755) Compliance. Background. - PowerPoint PPT PresentationTRANSCRIPT

JANUARY 8, 2013 | NEPOOL MARKETS COMMITTEE
Jonathan LowellPRINCIPAL ANALYST | MARKET DEVELOPMENT
Changes to the April 30th Design to Comply with November 8, 2012 FERC Order
Regulation Market (Order 755) Compliance
Background
• FERC Order 755 requires regulation market design changes to provide– Two Part Bidding – capacity (MW) and service (mileage)– Energy opportunity costs included in market clearing– Uniform clearing prices and two-part payment
• Unfortunately, this is not possible without sacrificing economic efficiency (least cost) and/or incentive compatibility (optimal bidding strategy is to offer true costs)
• The ISO filed a design that provided economically efficient outcomes and incentive compatibility– The ISO proposed to publish “approximate clearing prices” to enhance
market transparency
2

FERC Decision
• On 11/8/12 FERC issued an order rejecting the ISO’s proposed tariff revisions:
– Did not provide uniform clearing prices– Did not provide a two-part payment– Did not meet the burden of proof to demonstrate that a deviation from Order No. 755’s
requirements was warranted
• ISO must submit a new compliance filing by February 6th
• The rejection did not address economic efficiency or incentive compatibility issues, but rather was narrowly drawn, based on the specific language of the original order.
3

ISO Compliance Proposal Objectives
• Meet FERC requirements for uniform clearing prices
• To the extent possible:– Minimize potential loss of economic efficiency– Preserve incentive compatibility– Avoid bid skewing– Avoid potential incentives to not follow AGC dispatch– Minimize the need for uplift or make-whole payments
• Make no changes not directly related to the incorporation of clearing prices
4

Compliance Design in a Nutshell
• Select least cost resources to meet capacity and mileage requirements (unchanged)– Offered capacity and mileage prices (unchanged)– Estimated mileage (unchanged)– Estimated energy opportunity cost (unchanged)
• Calculate incremental cost savings provided by the resource (unchanged)– For convenience, let us describe the efficient bundled payment for each
resource as the “Vickrey Payment”, defined as: Vickrey Payment = Estimated As-Bid Cost + Incremental Cost Savings
• Determine uniform mileage price (new!)– Maximum of the mileage offers of all selected resources
• Determine uniform capacity price (new!)– Highest of the capacity prices each selected resource would require in
order for its compensation to equal its Vickrey Payment
5

Compliance Design in a Nutshell
6
Select least cost resources to meet capacity and mileage requirements• Offered capacity and mileage prices • Estimated mileage • Estimated energy opportunity cost
Calculate incremental cost savings provided by the resource•For convenience, let us use the term “Vickrey Payment” as follows: Vickrey Payment = Est. As-Bid Cost + Incremental Cost Savings
Determine uniform mileage price•Maximum of the mileage offers of all selected resources
Determine uniform capacity price•Highest of the capacity prices each selected resource would require in order for its compensation to equal its Vickrey Payment
UNCHANGED
fr
om t
he A
pril
30
Fili
ng
NEW
fo
r th
e F
eb.
6 C
ompl
ianc
e F
iling
Compliance Design Advantages
• Simple modification to April 30th design
• High confidence the design meets Order 755 requirements, as reinforced in the November 8th order– Uniform prices used for settlement
• Largely preserves economic efficiency by selecting least cost resources and compensating those resources at prices based on true value to the system
• Minimizes the need for uplift payments
• Preserves the “no risk to participation” feature of the April 30th design– Important for reliability: encourages participation
7

Compliance Design – Other Details
• Offer Price caps and floors (New!)– Limits potential for bid skewing
• Make-whole payment to ensure compensation for selected resources covers as-bid cost of actual performance and actual energy opportunity cost
• Prices >= 0
• Publication of market results will include the actual prices– No calculation or publication of proxy prices
8

Next Steps
• Present final language to MC in late-January
• PC review at February 1st meeting
• File with FERC on February 6th
9

APPENDIX

Price Calculation Example – Part 1
11
MW
Miles
Total Cost Total Cost Increm As-Bid Vic Pmt =When When Cost Cost If Bid Cost
Name MW Miles $/MW $/Mile MW Miles Bid Cost Vic Pmt Excluded Inlcuded Savings Cleared + ICS
A 17 136 13 0.5 0 0 0 756 797 -41 289 248B 42 252 13 0.4 0 0 0 756 1154 -398 647 248C 27 243 15 1.6 0 0 0 756 1301 -545 794 248D 18 234 6 0.6 18 234 248 289 797 756 41 248 289E 31 217 7 1.3 0 0 0 756 1007 -251 499 248F 12 108 7 1.4 0 0 0 756 938 -182 235 53G 31 217 6 0.9 0 0 0 756 889 -133 381 248H 33 429 14 1.2 0 0 0 756 1484 -728 977 248I 51 408 8 0.8 0 0 0 756 1218 -462 734 272J 31 248 7 1.8 0 0 0 756 1171 -415 663 248K 54 594 5 0.4 54 594 508 970 1218 756 462 508 970L 43 516 9 1.4 0 0 0 756 1491 -735 1109 375M 10 50 12 1.5 0 0 0 756 938 -182 195 13N 51 408 9 1.1 0 0 0 756 1391 -635 908 272O 24 312 12 1.7 0 0 0 756 1326 -570 818 248
72 828 756 1259Note: Estimate Opportunity Cost included in
capacity offer price
Selected Resources
Requirements70
700
Price Calculation Example – Part 2
12
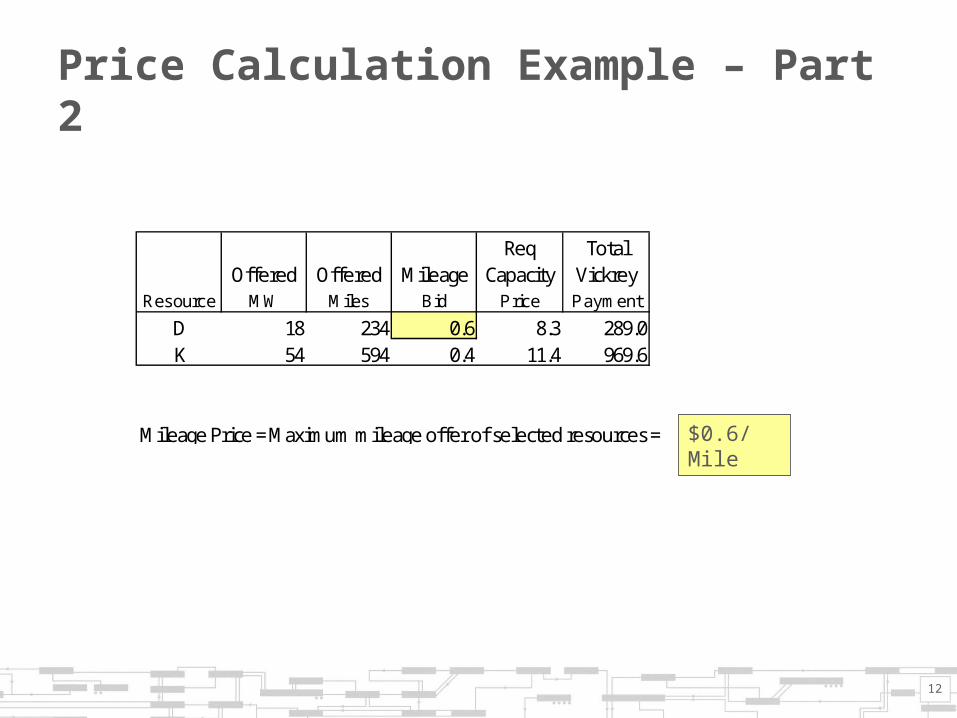
Req TotalOffered Offered Mileage Capacity Vickrey
Resource MW Miles Bid Price Payment
D 18 234 0.6 8.3 289.0K 54 594 0.4 11.4 969.6
Mileage Price = Maximum mileage offer of selected resources = $0.6/Mile

Price Calculation Example – Part 3
13
Given a mileage price of $0.6/mile, the capacity price required for resource D to receive expected compensation equal to its Vickrey Payment of $289 is:
18 MW x Capacity Price + 234 miles x $0.6/mile = $289
Therefore, Resource D Capacity Price = $8.3/MW
Similarly, Resource K Capacity Price = $11.4/MW
Uniform Capacity Price = Max[$8.3/MW, $11.4/MW] =$11.4/MW
Resource
DK
Prices
344.8969.6
Compensationat Uniform

Price Calculation Example – Part 4
• Compensation at the uniform prices ($0.6/mile, $11.4/MW) is represented by the upward-sloping plane
• As-bid compensation generally exceeds the uniform price compensation for non-selected resources (shown by the ◊ icons)
• For selected resources, price-based compensation will always be greater than or equal to the resource’s:
– efficient bundled payment (the blue X icons)
– as-bid cost of capacity, expected mileage and expected opportunity cost ((the magenta ◊ icons)
14

Design Options Considered But Not Pursued
• “Best Fit” pricing over a range of requirements
• “Best Fit” pricing for those resources selected as least cost
• Several compliance options were considered that did not meet threshold criteria– Select based on capacity price, dispatch based on mileage price– Highest selected prices– Include opportunity cost in current pricing design
15