kerala study by gandhigram
DESCRIPTION
NREGS in IndiaTRANSCRIPT

i
A Study on the Performance of NREGS in Kerala
Sponsored by
MINISTRY OF RURAL DEVELOPMENT GOVT. OF INDIA
NEW DELHI
Funded by
UNITED NATIONS DEVELOPMENT PROGRAMME (UNDP) NEW DELHI
DEPARTMENT OF EXTENSION EDUCATION
GANDHIGRAM RURAL INSTITUTE
(Member, Professional Institutional Network of NREGA)
GANDHIGRAM - 624 302
DINDIGUL DISTIRCT
TAMILNADU

ii
Acknowledgement
We sincerely express our deep sense of gratitude to Dr.Rita Sharma IAS,
Secretary and Ms.Amita Sharma IAS, Joint Secretary in the Ministry of Rural
Development, Government of India for providing us a wonderful opportunity of
associating ourselves in a very significant and an unprecedented scheme in the
annals of rural development in the country. A series of meetings arranged and
addressed by them on the various issues related to NREGS has helped us to have a
firm grip over the subject. We are thankful to Ms. Neelakshi Mann, Consultant,
Department of Rural development for her support in conducting the study.
We express our deep sense of gratitude to UNDP for their funding support in
undertaking the study.
We are thankful to Shri. S.M. Vijayanand IAS, Principal Secretary,
Department of Local Self Governance, Government of Kerala, for extending
necessary inputs and support in carrying out the study. His suggestions, especially at
the initial stage of study, on the methodology and in selecting sample districts and
blocks were of immense help to us. We are also indebted to Shri. T.K.Jose IAS,
Secretary, Department of Local Self Governance, Govt.of Kerala, for extending
necessary support in the initial stages of the study.
We acknowledge our sincere thanks to Shri. V.N. Jithendran IAS, Mission
Director, NREGA, who has been constantly helping us throughout the study. His
critical comments on tools for data collection have helped us in fine-tuning the tools.
We extend our special thanks and appreciation to Shri.B.S.Thirumeni, Joint
Development Commissioner, NREGA, Government of Kerala for his co-operation
and support in undertaking the study.
We thank all the DPAU Coordinators- Shri. Unnikrishnan Nair of Palakakd
district, Shri. C.V.Joy of Wayanad district, Shri. K.Rajendran of Idukki district and
Shri. K.Janardhanan Pillai of Palakkad district for their continuous support in
gathering all the required data regarding NREGS and for facilitating the field work.

iii
There are many officials at various administrative capacities who facilitated
and helped us in organizing and conducting the field work. We wholehearted
acknowledge and appreciate the help rendered by them. The officials are -
Shri.P.Vinod Kumar, Executive Director of Maithri and his staff and volunteers, Smt.
Santhakumari, Chairperson, Chittoor block standing committee, Shri. P.V.
Radhakrishanan, BPO- Attapady Block, Shri D.Dhanapalan- Block Plan Coordinator,
Shri. K.Kesavan, BPO- Chittoor Block, Shri. C.P.Ananthan, Joint BDO- Chittoor
block, Shri. Venugopal, Joint BDO- Veliyanadu Block, Shri. R. Ubendrachenai, BDO-
Chambakkulam Block, Shri. Besi, Joint BDO- Mananthavady Block, Shri. Basheer-
Asst. Project Officer, Alappuzha, Shri. Hari, BDO, Adimali block, Shri. Viswan, Joint
BDO Adimali, Shri. C.J.John, Joint BDO Devikulam block and Shri. P.S.Arun, Assitt.
Engineer, Wayand District.
We record our hearty thanks to Block Panchayat Presidents, Gram
Panchayat Presidents, Vice-Presidents, Ward Members, members of Vigilance
Committee and Social Audit Committee of Palakakd, Wayanad, Idukki and
Alappuzha Districts, whose field support during the study were of great help in the
successful completion of the study
We place it on record our sincere thanks to all the respondents and
participants of the focus group discussion for spending their valuable time with us in
providing required data and information.
We express our heartfelt thanks to our Vice Chancellor, Dr. SM. Ramasamy,
who is a source of energy and inspiration to us.
We are thankful to the authorities of the Gandhigram Rural Institute for their
support and help in processing the project related papers in time.
We thank Dr. R. Ramesh, Research Fellow for going through the draft version
of the manuscript. We thank Shri.B.Baskar Assistant Professor and Ms.Kaveri
Assistant Professor for extending their service in data compilation and tabulation.
We thank Shri.R.Saravanan for his meticulous work in formatting the report.
Members of Study Team

iv
The Team
Dr.N.Narayanasamy : Coordinator
Dr.M.P.Boraian : Coordinator
Dr.S.Manivel : Associate
Shri.M.P.Saji : Associate
Dr.P.Sebastian : Field Team Leader
Shri.R.Dhavamani : Field Team Leader
Ms.Annu Lalan : Field Team Leader
Ms.G.Geethanjali : Field Team Leader
Shri.P.Maruthai Pandian : Computer Operator

v
Contents
List of Tables
List of Figures
List of Boxes
Abbreviations
Executive Summary
Chapters Particulars Page
1. National Rural Employment Guarantee Scheme
An overview
1
2. Design of the Study 17
3. Profile of Kerala and the Districts Chosen for the Study 26
4. Socio-economic Profile of Sample Households 40
5. Performance of NREGS in Kerala 61
6. Summary of Findings and Inferences 124
7. Recommendations 141
Reference 144
Annexure
i) Household Interview Schedule 146
ii) Check list 156

vi
List of Tables
Chapter 1 Tables Page
1.1 : NREGA - National Overview 5
1.2 : Person days employed per household 12
1.3 : Share of women in NREGS employment 13
1.4 : Share of wages in total expenditure 13
Chapter 3
3.1 : District Profile 27
3.2 : District wise population profile (as per 2001 census) 28
3.3 : Education specific WPR per persons of age 15 years and above
32
3.4 : Employment in Kerala – An overview 33
Chapter 4
4.1 : Age of the Sample Population 41
4.2 : Literacy Status of the Sample Population 43
4.3 : Number of Disabled among sample population 43
4.4 : Housing details of the Sample Households 44
4.5 : Source of Drinking Water for the sample households 46
4.6 : Main Occupation of the Sample Population 47
4.7 Subsidiary Occupation of the Sample Population 48
4.8 : Livestock Owned by Sample Households 49
4.9 : Household Assets of the Sample Respondents 50
4.10 : Annual Expenditure (in percentage) 51
4.11 : Purpose of Borrowing of the sample population 54
4.12 : Extent of Loan Borrowed by the Sample Households 55
4.13 : Amount Repaid 55
4.14 : Interest Rate 56
4.15 : Migration of Sample Household 57
4.16 : Number of Persons Migrated from the Household 57
4.17 : Reasons for migration 57
4.18 : Place of Migration 58
4.19 : Social Participation as a Member in
CBOs and CSIs
59
Chapter 5
5.1 : Performance of NREGS at State level and
selected sample Districts of Kerala
63
5.2 : Awareness about NREGS: Sources 65
5.3 : Awareness on Main Provisions of NREGS 66
5.4 : Year of Registration 68

vii
5.5 : Time lag between the Application and Issue of Job Card 69
5.6 : Selection of Works 72
5.7 : Items of Works Undertaken 73
5.8 : Receipt of “Dated Receipt” 76
5.9 : Time lag between the Application and Provision of Employment
77
5.10 : Community-wise average number of days employed 80
5.11 : Participation in Works 82
5.12 : Distance between residence and place of work 83
5.13 : Working hours 85
5.14 : Facilities available at the work site 86
5.15 : Adequacy of the worksite facilities 86
5.16 : Facilities required at the worksite 87
5.17 : Who provided tools for the work in the worksite 88
5.18 : Problems faced at the worksite 89
5.19 : Wages earned under the scheme 91
5.20 : Maximum wage earned under the scheme 91
5.21 : Mode of payment of wage 92
5.22 : Time lag between date of completion of work and receipt of wages
93
5.23 : Difference between wages under NREGS and the prevailing wages for other than NREGS work
94
5.24 : Impact of NREGS on the family income 95
5.25 : Impact of NREGS on the expenditure 96
5.26 : Spending pattern of the wages earned under NREGS 97
5.27 : Impact of the NEREGS on the Saving (Per annum) 99
5.28 : Impact of NREGS on livestock 100
5.29 : Impact of the NREGS on women empowerment 101
5.30 : Migration to other areas in search of job
before the introduction of the NREGS
102
5.31 : The level and intensity of migration after the introduction of NREGS
103
5.32 : Benefits of NREGS to HH 104
5.33 : Benefits of the NREGS for the Panchayat 106
5.34 : Changes that the Scheme has brought in the Panchayat 108
5.35 : Change in the relationship among the
Households after the introduction of NREGS
109
5.36 : Participation in Grama Sabha Meeting 114
5.37 : Matters Discussed on NREGS in Grama Sabha 115
5.38 : Performance of NREGS as perceived by the beneficiaries (District wise Scoring)
118

viii
List of Figures
No. Particulars Page
3.1 : Age-wise Distribution of Population in Kerala 29
3.2 : Sectoral contribution to state economy 30
4.1 : Population and Gender 40
4.2 : Caste Composition of the Sample Households 42
4.3 : Details on Housing Type of Sample households 44
4.4 : Electricity Connection in Sample Households 45
4.5 : Households with Latrine Facilities 46
4.6 : Annual Income of the Sample Households 51
4.7 : SHG Membership of Women from Sample Households 54
4.8 : Sources of borrowing of the sample households 58
5.1. : Employment sought under NREGS 75
5.2 : Average Number of days of employed 79
5.3 : Number of Respondents employed for 100 days per annum 81
5.4 : Mode of Transport 84

ix
List of Boxes
No. Particulars Page
1.1 : NREGS vis-a-vis. earlier employment Programmes 15
5.1 : Priority of Works 72
5.2 : The multiplier effects of NREGA 95
5.3 : Age Has Not Withered Away the Spirit to Work 98
5.4 : NREGS enabled to come out of the vicious cycle of poverty:
The case of two sisters
98
5.5 : NREGA assures stable income: The case of Subadra 105
5.6 : Regenerating agriculture through NREGA 107
5.7 : A pond in a private land for a common purpose 107
5.8 : Prevention of men – animal conflict 108
5.9 : NREGA vs SGRY 112
6.1 : NREGA enhanced the credibility of the poor 135
6.2 : NREGA Lends a Helping Hand to the Victim of Agrarian Crisis 136
6.3 : “I need not go with empty stomach with the introduction of
NREGA”
136
6.4 : Water-body retained 137
6.5 : NREGS Empowered Socially Marginalized Woman 137
6.6 : NREGA facilitated socialization 138

x
List of Abbreviations
AAP : Anthyodaya Anna Poorna
ADS : Area Development Society
APL : Above Poverty Line
BDO : Block Development Officer
BPL : Below Poverty Line
BPO : Block Programme Officer
CBOs : Community Based Organizations
CDS : Community Development Society
CSIs : Civil Society Institutions
DPAU : District Poverty Alleviation Unit
DRDA : District Rural Development Agencies
FGD : Focus Group Discussion
GDP : Gross Domestic Product
GNP : Gross National Product
GP : Gram Panchayat
GS : Gram Sabha
HH : Household
IAY : Indira Awas Yojana
IMR : Infant Mortality Rate
KILA : Kerala Institute of Local Administration
MMR : Maternal Mortality Rate
NGO : Non Governmental Organization
NREGA : National Rural Employment Guarantee Act
NREGS : National Rural Employment Guarantee Scheme
NREP : National Rural Employment Programme
PRI : Panchayati Raj Institutions
PWP : Public Works Programme
RD : Rural Development
SC : Scheduled Caste
SGRY : Sampoorna Grameen Rozgar Yojana
SHGs : Self Help Groups
SIRD : State Institute of Rural Development
ST : Scheduled Tribe

xi
Executive Summary
National Rural Employment Guarantee Scheme was launched in
February 2006 in two districts viz., Palakkad and Wayanad, and subsequently
grounded in the remaining 12 districts of Kerala. The scheme has been
steadily and surely taking roots in the soil of rural Kerala. 23.30 lakh
households have registered under the scheme. 43.4 per cent of them sought
and got employment under the scheme. Women participation is very high with
80 percent of the total beneficiaries under the scheme. The present study is
about the performance of NREGS in Kerala.
The broad objective of the study is to analyze the functioning of
NREGS in Kerala encompassing all its essential aspects. More specifically
the study aims at analyzing the extent to which the scheme has generated
employment, assessing the impact of the scheme on selected variables, and
ascertaining the limitations and constrains faced by the functionaries in
implementing the scheme.
The study employed a combination of methods, viz., survey, focus
group discussion, case study, interview with key
informants and review of secondary sources of
data. Four of the 14 districts in Kerala have been
chosen for the study based on geographical
location, period of implementation (Phase I, II and
III) and concentration of agriculture labour and SC/ST population. Using multi
stage sampling process, two blocks from each district, four panchayats from
each block (except one block where three panchayats are chosen) and 20
respondents from each panchayat were chosen for the study.
Socio-economic profile of the sample households indicate that their
family size is small (4.18); majority of them belong
to productive age group (19.59 %); five percent of
the total population are disabled; 30 per cent
belong to SC/ST households. A high rate of
literacy could be found (92 %). The primary
occupation of the households is agriculture labour followed by NREGS. For a
Sample for the study
Districts : 4 Blocks : 8 Panchayats : 31 Households : 620
Work under NREGS has emerged as primary occupation for 17 percent and as secondary occupation for two-third of the rural households.

xii
vast majority of the households (two- third) NREGS has emerged as a
secondary occupation. One-third of the households have an income of less
than Rs.24,000/-. Possession of assets and livestock is low. Major sources
of borrowings are commercial banks, co-operatives and self help groups.
Money lenders are getting marginalized. Borrowings were resorted to mainly
for productive and consumption purposes. Sample households mainly belong
to poor and moderate households, which indicate that the scheme has
reached the right type of households.
Start-up activities designed and carried out under the scheme have
generated a very high level of awareness about the scheme among the
households. Inspite of initial hiccups in registration due to certain
mis-conception about the scheme, it has reached the deserving households
due to special efforts initiated by the functionaries of the scheme. A vast
majority of the registered households were issued job cards free of cost within
15 days. There were instances of delay in issuing job cards due to non-
availability of staff and delayed production of required documents by the
beneficiaries. Job cards are computerized and are in possession of job
seekers.
Works are identified and prioritized by the Gram Sabha meeting
actively facilitated by the functionaries of
the panchayats and Kudumbasree. There
have been problems in identifying the
works as per the provisions of the Act as
the geography of each district distinctly
differs and as the availability of common natural resources is less in many
panchayats. These problems are, to a certain extent, solved through a
process of convergence with other departments like irrigation, public work,
agriculture, forestry, fisheries, etc.
All the households registered under the scheme did not participate. 50
to 60 per cent of the households participated. Dated receipts were given to
the participants who applied for the job. Around 72 per cent of the job seekers
were offered job within 15 days. Wayanad leads with an average time-lag of
12 days. A few respondents were found to have received unemployment
allowance.
“There is a marked improvement in the participation of the people in Gram Sabha meeting and the people demand such schemes and projects that enhance their well-being”.
- A functionary of the panchayat.

xiii
Works are executed in a methodical and systematic manner. Every
panchayat follows a definite
process. The average number of
days employed has recorded a
steady up-ward trend. The average
number of days employed is high
among the SC/ST households
indicating their active participation in the scheme. Yet another sign of active
participation is the percentage of households
employed for 100 days. It has increased from two
per cent to 14 per cent. Wayanad leads with 30
per cent of the households employed for 100 days.
Majority of the respondents are found to have
participated in works like road connectivity
(56.4%), flood control and protection (35.5%), cleaning of irrigation canals and
channels (26.6%), renovation of traditional water bodies (22.6%) and water
conservation and harvesting (19.4%). Inter-district variations could be
observed, which is due to variations in geographical condition among the
districts.
The worksites are within the radius of 5 km. from the place of residence
of households. 95 per cent of the workers are able to reach the work site by
walk. The time schedule adopted (8 am to 5 pm) was reported as not
conducive to women in general and workers in Alapuzha district in particular.
Basic facilities are made available at the work site;
however, majority of the workers felt that they were
inadequate. They demand more facilities. The
workers have come across certain problems at the
worksite which includes: heavy tools, inability to
work continuously in water-logged areas, inability to adhere to the time
schedule, lack to toilet facility, etc.
Muster rolls are maintained at the work site by the mates, who are
mainly women and are drawn from Kudumbasree. They are well trained in
the tasks expected of them. 98.4 per cent of the respondents are aware of
the minimum wages prescribed. Wages under the scheme are distributed
Average no. of days employed
District 2006-07 2007-08 2008-09
Palakkad 13 36 53
Idukki - 5 29
Wayanad 24 50 60
Alapuzha - - 13
All 9 22 39
“We remained idle without work before NREGS. We are now assured work for 100 days with an assured income of Rs.12,500/- per annum”.
- NREGS women workers
“Everyone now is willing to lend me as my debt servicing capacity has increased due to income through NREGS”.
- NREGS worker
xiv
through banks and post offices. No incident of ‘payment of wages by cash’
was reported. Around two-third of the respondents received the wage within
15 days and rest had to wait due to delay in measurement of work, delay in
providing muster roll and inadequate staff.
Wages for men under NREGA was much lower compared to locally
prevailing wage rates. In Alapuzha district the
local wage rate is double the wage rate under
NREGA. However, NREGA wage rate for
women is high compared to locally prevalent
wage rates. The net difference is Rs.14/-.
The scheme has discernable impacts on income, expenditure pattern,
savings, migration, status of women, social
relationship, livestock population and household
assets. The benefits of the scheme as perceived
by the respondents to the rural households are
guaranteed employment, improved income and
better education to children. Benefits to the
community (population) include better network of
roads, regeneration of water bodies, improved
irrigation facilities and so on.
The social audit system has been grounded and adopted in all the
panchayats. Social audit reports are submitted in Gram panchayat and sent
to authorities concerned for appropriate action. Complaints received are
settled then and there.
Convergence of scheme with various departments such as, irrigation,
agriculture, public works, fisheries and forestry could be observed, which help
in effective identification and execution of various types of works.
The performance of the scheme has been rated as ‘very good’, in
crucial areas like, ‘process of registration’, ‘issue of job cards’, ‘selection of
worksite’, ‘supervision at the worksite’, ‘support of government officials’ and
‘participation of people’. Whereas, certain variables such as, execution of
work, quality of the work executed, facilities at the worksite, mode of
distribution of wages and ‘transparency’ have been rated as ‘good’ which
means that there is need and scope for further improvement in such areas.
Effects of NREGA
• Improved income
• Shift in expenditure pattern
• Improved savings
• Decline in migration
• Better social relationship
• Better education for children
“Going with an empty stomach in order to provide food to my children is a thing of the past. All the members of the family are now assured of food”.
- NREGS woman worker

xv
The overall functioning of the scheme as rated by the respondents and
as reiterated in the focus group discussion is ‘good’. The credit for the
performance goes to Gram Sabha, the Panchayats, Kudumbasree and the
Government functionaries at different levels who played very critical role in
grounding and implementing the scheme.
The suggestions to take the scheme to greater heights and make it
sustainable as recommended by stakeholders at different levels include;
i)100 days of employment per adult member per household instead of per
household; ii) temporary suspension of NREGS works during the peak
agricultural season; iii) permission to take up land improvement in private
lands with the financial participation of land owners; iv) upward revision of
wages taking into account the local situation; iv) flexibility in schedule of
working hours; vi) region based specific plans instead of adapting blue-print
type of guideline; vii) permission to reintervene based on nature of work;
viii) permission to take up work involving material cost; ix) delegation of
responsibilities and power from the block to the panchayat; x) appointment of
skilled personnel wherever required and xi) providing better infrastructure like
improved tools, computers with BSNL internet connectivity, vehicles and
human resources at panchayat level.
* * * * *

Chapter - 1
National Rural Employment Guarantee Scheme
An Overview
Introduction
National Rural Employment Guarantee Scheme (NREGS), the first
ever programme giving legal guarantee to a minimum of 100 days of work in a
financial year, is a Public Works Programme (PWP). PWPs are defined as “all
activities which entail payment of wage (in cash or in kind) by the state, or by
an agent acting on behalf of the state in return for a provision of labour, in
order to: i) enhance employment; and ii) produce an asset (either physical or
social) with the overall objective of promoting social protection for participants”
(Anna Macord 2009). There are, by and large four distinct, although
sometimes overlapping types of PWPs. They are: i) PWPs offering a single
short-term episode of employment which provide a ‘risk coping’ or protective
forms of social protection; ii) large scale government employment programme
which are response to chronic or sustained levels of elevated employment.
Under this type, State acts as an employer of the last resort aiming to raise
aggregate employment on a sustained basis; iii) programme promoting the
labour intensification of government infrastructure spending with primary
objective of constructing assets while increasing aggregate labour usage; and
iv) programmes which enhances employability by promoting work place
experience and skills formation among the unemployed. NREGS belongs to
the second type of PWP.
NREGA and its Features
India had the experience of operating many types of PWPs. NREGS
has evolved into its present shape by building on the past experiences in
designing and executing schemes providing employment. It is an
improvement over its predecessors. The employment envisaged under the
scheme is defined as a constitutional right so that the state offers a

2
guaranteed number of days of employment each year to one unemployed
work-seeker from any rural household seeking employment. It puts the people
with rights to seek employment in a legal framework and approaches
development through the socio and economic empowerment of the poor and
the marginalized.
Described as ‘flagship programme’, ‘first ever scheme that guarantee
wage employment at an unprecedented scale’, ‘mother of all local
development programme’, ‘demand-driven and people-centered programme’,
‘boon to the rural poor’, ‘lifeline to the marginalized and landless’, ‘the largest
employment programme in human history’, the scheme was introduced
through an Act known as ‘National Rural Employment Guarantee Act’ notified
on Sep. 7, 2005.
The Act came into force on Feb. 2006. The salient features of Act are:
i) application by the adult members of the rural households to the local
panchayat seeking registration; ii) issue of job cards by the panchayat within
15 days from the date of application; iii) written application by the job card
holders to the panchayat seeking employment; iv) issue of dated receipt of
written application for employment; v) provision of employment within 15 days
of application for work failing which payment of unemployment allowance; vi)
provision of work within a radius of 5 km from the village (payment of extra
wages of 10 per cent, if the work provided is beyond 5 km); vii) payment of
wages as per the minimum wages act; viii) provision of equal wages for men
and women; ix) disbursement of wages on a weekly basis; x) women should
constitute one-third of the workers; xi) provision of facilities at the work site;
xii) shelf of project as recommended by the Grama panchayat and approved
by zilla parishad; xiii) permissible works are predominantly soil and water
conservation, afforestation and land development; xiv) wage material cost
ratio should be 60 : 40 (no room for machine and contractors); xv) social audit
has to be undertaken by the Grama Sabha; xvi) institution of grievances
redressal mechanism for ensuring responsive implementation process; and
xvii) all accounts are subject to public scrutiny resulting in accountability and
transparency of the scheme.

3
Objectives of NREGS
The primary objective of the Act is augmenting wage employment.
More specifically, the Act aims at: i) providing a right based 100 days
employment in a year to strengthen the subsistence livelihood support,
enhancing the rural households purchasing power and capacity to alleviate
hunger; and ii) directing the colossus amount of wages towards creating
productive and durable assets of irrigation, drought proofing, land and water
conservation, horticulture and connectivity to general prosperous livelihood
support system. The ultimate objective was to benefit the entire community
by providing employment; raising agricultural productivity and increasing
natural resource base, particularly water. The process envisaged to attain the
objectives would result in strengthening the grassroots processes of
democracy and infusing transparency and accountability in governance.
Progress of NREGS
The scheme has been implemented in a phased manner. It was
introduced in 200 most backward districts of the country in Phase I (February
2006). It was implemented in 130 more districts in Phase II during 2007-08.
The scheme was further extended to the remaining 285 rural districts of India
from April 1, 2008 in phase III in order to bring the whole nation under its
safety net. The programme was first launched on 2nd Feb. 2006 from
Anantapuri District of Andhra Pradesh.
The budget outlay on the scheme has steadily gone up over a period of
three years. Started with a budget outlay of Rs.11,300 crores in 2006-07, the
scheme has budget outlay of Rs. 30,000 crores in 2008-09 indicating a three-
fold increase over a period of three years, mainly due to phased extension of
the programme to different districts. Employment opportunities and wage rate
have significantly gone up since the implementation of the scheme. The
employment provided to the rural households has recorded more than two-
fold increase from 2.10 crore households in 2006-07 to 4.51 crore households
in 2008-09. The person days of employment witnessed a sharp increase from
90.5 crore person days in 2006-07 to 216.32 person days in 2008-09. The

4
average wage paid under NREGA has increased from Rs.65 in 2006-07 to
Rs.84 in 2008-09; minimum wages for agricultural labourers have increased
after the implementation of the scheme. For instance, the minimum wages in
Maharastra has increased from Rs.47 to Rs.72; in Uttar Pradesh from Rs.58
to Rs.100; in Bihar from Rs.68 to Rs.81; in West Bengal from Rs.64 to Rs.75;
in Madhya Pradesh from Rs.58 to Rs.85 and in Chattisgarh from Rs.58 to
Rs.72. Further, a major chunk of the expenditure has gone in the form of
wages. The act has mandated that wage material ratio should be 60:40. But
then, the percentage of wages to the total expenditure has been hovering
around two–third of the total expenditure indicating much better flow of funds
in the form of wages to the target beneficiaries than mandated (See Table
1.1).
The works taken up under the scheme are mostly related to water
harvesting and conservation, flood control and protection, micro irrigation
works, provision of irrigation facilities on the land owned by SC / ST
households, renovation of traditional water bodies, land development, drought
proofing and rural connectivity. Total number of works taken up has increased
from 8.35 lakhs in 2006-07 to 27.75 lakhs in 2008-09. Around 50 per cent of
the works are related to water conservation; 20 percent of the works are
related to provision of irrigation facility to individual beneficiaries; and around
15 per cent to land development indicating that a vast chunk of the funds has
been spent on soil and water conservation leading to improved livelihood
security to rural households.
The Act has focused on SC/ST households. Around 55 per cent of total
households are SC/ST households indicating the massive participation of
SC/ST households in the scheme. The Act mandates that a minimum of one-
third of the beneficiaries should be women. The national average shows that
women participation was 41 per cent in 2006-07; it registered steady increase
recording 43 percent in 2007-08; 47.88 percent in 2008-09 and 51.15 percent
in 2009-10 (upto October 2009). The women participation thus has surpassed
the minimum prescribed levels.

5
Table 1.1 NREGA - National Overview
2006-07 200
Districts
2007-08 330
Districts
2008-09 615
Districts
2009-10 (UptoAug.,09) 200 Districts
Employment provided to households
2.10Crore 3.39 Crore 4.49 Crore 3.04 Crore
PERSONDAYS (in Crore)
Total 90.5 143.59 216.01 118.54
SCs 22.95 [25%] 39.36 [27%] 63.39 [29%] 35.50 [30%]
STs 32.98 [36%] 42.07 [29%] 54.78 [25%] 26.21 [22%]
Women 36.79 [41%] 61.15 [43%] 103.41 [48%] 60.62 [51%]
Others 34.56 [38%] 62.16 [43%] 97.84 [45%] 56.73 [48%] Average persondays per household
43 days 42 days 48 days 39 days
FINANCIAL DETAIL
Budget Outlay (in Rs. Core)
11300 12000 30000 39100
Central Release (in Rs. Crore)
8640.85 12610.39 29939.60 15219.14
Total available fund [including OB]: (in Rs. Crore)
12073.55 19305.81 37483.94 26831.21
Expenditure (in Rs. Crore)
8823.35 15856.89 27137.88 14398.64
Average wage per day Rs.65 Rs.75 Rs.84 Rs.88
WORKS DETAIL Total works taken up (in Lakhs)
8.35 17.88 27.2 23.37
Works completed (in Lakhs)
3.87 8.22 12.09 5.28
Water conservation 4.51 [54%] 8.73 [49%] 12.50 [46%] 11.60 [49%]
Provision of irrigation facility to land owned by SC/ST/BPL and IAY beneficiaries
0.81 [10%] 2.63 [15%] 5.56 [20%] 4.34 [19%]
Rural Connectivity 1.80 [21%] 3.08 [17%] 4.91 [18%] 3.98 [17%]
Land Development 0.89 [11%] 2.88 [16%] 3.91 [15%] 3.23 [14%]
Any other activity 0.34 [4%] 0.56 [3%] 0.25 [1%] 0.22 [1%]
Source: www.nrega.nic.in
Merits and Shortcomings of NREGA
NREGA is the first tangible commitment to the poor that they can
expect to earn a living wage without loss of dignity and demand this as a right
(Lalith Mathur, 2007). NREGA has benefited the people especially the
marginalized and the poor on several counts. Evidences from the field and
the analysis of the macro data have brought to light the various merits of the
scheme and its impact on the target beneficiaries. The scheme has certain
drawbacks / shortcomings too. They are not related to the scheme as such
but the way in which it is implemented or executed. We would discuss the

6
benefits of the scheme to the target groups. The benefits listed here are
based on the field reports / studies conducted across the country.
Merits
Minimum wages assured: A very significant benefit of NREGA is that it has
ensured payment of minimum wages irrespective of the sex. The minimum
wage of Rs.100 a day under NREGA had increased the wage level across the
private sector benefiting both the families that could not avail NREGA work
and families that had completed NREGA quota of 100 days work. It provided
the poor with required support in the labour market by not letting them below a
certain level. It has increased the bargaining power of the poor people in the
labour market. The workers of NREGA, earlier, were mostly voiceless and
they could not normally bargain for higher wages. Now, the NREGA wage
has become a bench mark and NREGA workers bargain for wages and are
no longer willing to work for cheaper wages.
Attitudinal change: NREGA has brought a big shift in the attitude of the
people. It has impacted on the social structure of the villages. We have
never seen land owning upper caste groups working in the farms of SC/ST
households. A paradigm shift could be observed with the advent of NREGA.
The land owning class now comes and works in the farms of dalits. People
are reported to have said that they will all work together as a group and not on
a caste basis (P.Sainath 2008). It is a common sight in many of the states
that petty shop owners, stone cutters, people of different caste groups and
land owners of different types (marginal, small and big) participate and work
together under NREGA.
Assured Income: The scheme has improved the lives of the people and has
brought stability and assured income to the families that were until recently
desperately poor (Vidya Subramanian: 2009). A study conducted by the
Institute of Applied Manpower Research covering a sample of 6000
households across 20 states in the country (300 samples per state) has
revealed that the low earning level of a number of beneficiaries declined and
the number of households reporting marginally higher income has increased

7
(K.Balchand: 2009). In certain places especially during the lean season
NREGA had been the only source of income (Sudha Narayan: 2008).
Change in expenditure pattern: The scheme has its impact on the
expenditure pattern of the families also. A shift in the expenditure pattern on
food and non-food items with family spending more on both the counts could
be found; more than half of the households have purchased livestock like
sheep and goat (K.Balachand: 2009).
Migration checked: An important problem in rural areas was “distress
migration” especially when an area was struck by drought, famine, flood or
other natural calamities. Field reports have clearly indicated that the people /
beneficiaries no longer have to move places to places looking for work. The
migration has fallen very sharply (Sudha Narayan: 2008).
Panchayats strengthened: The entire scheme is being implemented by the
panchayat and through the panchayat. Identification of work, implementation
of work, disbursement of wages and social auditing have become the
responsibility of Grama panchayat. This has provided a vast scope for
strengthening Gram sabhas and the panchayats which in turn helps building
participatory democracy.
Women empowered: Participation of women has increased significantly. In
several states participation of women has surpassed men’s participation.
Women perceived that NREGA is giving them a sense of independence and
security. Wages earned under NREGA has helped women in several ways.
It helped them to pay the debt and retrieve the pawned gold; helped them in
taking care of children’s education; enabled them to meet the day-to-day
household expenses and facilitated them to save money (Sudha Narayan
2008).
Entitlements internalized: NREGS facilitates disclosure by means of regular
social audit. Social audit mandated to be done by the Grama Sabha is
intended to identify and plug pilferages and corruption which in turn helps
building awareness and confidence in beneficiaries who learn over the time,

8
to become vigilant and assertive. As a result, the village people had fully
internalized their rights and entitlements (Vidhya Subramanian, 2009).
Social capital created: NREGS has facilitated ‘people coming together’. It is
quite common to see a large number of men and women irrespective of the
caste working together in creating productive assets. This provides a great
deal of opportunities for frequent interaction resulting in mutual trust and
social capital. Nurkse, the economist said that, capital starved over populated
countries could build social capital in a big way by employing the surplus
labour on a variety of projects. The massive effort in building social capital
through NREGA could trigger higher productivity of land and labour,
diversification of agriculture and foster industrial growth. It would mitigate the
sufferings inflicted by chronic drought and flash flood (P.S Appu: 2009).
Corruption checked: The act has a wide range of transparency safeguards
to prevent corruption. For instance, musterrolls are to be kept at the worksite,
displayed at the panchayat office and read out in public at the time of wage
payments. Employment and wage details have to be recorded in the job
cards to enable the workers to check and verify the records for themselves.
Contractors are totally banned. There is evidence of substantial progress
towards a transparent accountable system. Contractors have virtually
disappeared from NREGA. Mass fudging of muster rolls, in certain States, is a
thing of the past (Rajasthan for example). Certain States like Andra Pradesh
have been making rapid strides in this direction through strict record keeping,
institution of social audit and payment of wages through post offices. A
survey conducted in Orissa revealed that 95 per cent of the wages paid
according to the muster roll had actually related the labourers concerned.
This is a major achievement especially in contrast with the situations two
years ago, where a similar study in the same area had uncovered evidences
of massive fraud in National Food for Works Programme (Jean Dreze 2007).
Lacunae and shortcomings
The scheme suffers from certain lacunae and problems. The problems
are inter-related. The problems are not with the scheme but with the way in

9
which it is implemented. Some important problems as reported from the fields
are presented below.
Delay in payment of wages: There has been a prolonged delay in payment
of wages. As per the provisions of the Act, workers must be paid within 15
days. However, wages could not be paid within the stipulated period of time.
The main reason attributed for the delay is the inability of the banks and post
offices to handle mass payment of NREGS wages. There are other reasons
too. They are delay in issuing payment order to the banks and post offices by
the panchayat, delay in work measurement, bottlenecks in flow of funds and
irresponsible record keeping (Jean Dreze 2007). Whatever might be the
reasons, even small delays cause enormous hardships to workers who live on
the margin of subsistence.
Overemphasis on employment: Two major objectives of the programme
are: i) provision of 100 days of unskilled employment in a financial year; and
ii) creation of productive and durable assets that would enhance agricultural
productivity. However, in actual operationalization of the scheme, the first
objective assumes by far the most dominant concern of the law, the second
objective viz, creation of sustainable productive assets, stands in the shadow.
Even during the social audit the prime attention goes to matters related to
registration, issue of job cards, allocation of work, timely wage payment and
worksite facilities rather than the utilization of works completed, increase in
production, multiplier effects of income generation, issue of ownership,
operationalization and maintenance of assets created on the public land. An
alarming fact is that during the last three and half years (till August 2009)
19.49 lakh works have been taken up, out of which, only 2.69 lakh (13.69 per
cent) works are reported to have been completed (Prasad Y.B,:2009).
Shortage of human resources: Yet another critical lacuna in the
implementation of NREGS has been the shortage of dedicated human
resources. Currently, in many of the states, implementation of NREGS has
been assigned to the already overloaded bureaucratic structure. NREGS is
an “additional charge”. As a result, the government officials who are in-
charge of the programme could not totally devote themselves to NREGS.

10
This leads to delays and poor quality output. Attempts to “piggyback” a
radically new people-centered programme on to a moribund bureaucratic
structure of implementation simply do not work (Pramathesh Ambasta: 2009).
Delay in issue of job cards: An important factor of the NREGS is that job
needs to be given to a worker within 15 days of demand for work. The study
by the Institute of Applied Manpower Research indicated that 80 per cent of
the households are yet to get job within 15 days of their demand for work and
worse still they were not given unemployment allowance either.
Failure to convene the meeting of Grama Sabha: Grama Sabha has to
play a very crucial role in implementing NREGS, especially in three important
stages in the process of NREGS viz., i) preparation of shelf of projects;
ii) appraisal of shelf of projects; and iii) conducting of social audit. These
activities are very essential for the effective implementation of NREGS, which
necessarily warrant convening the meeting of the Grama Sabha. There are
instances where Grama Sabha meeting were not convened in certain areas of
the district in certain states (Mahim Pratap Singh: 2009).
Withholding job cards: Possession of job card provides a legal entitlement
and guarantee to seek job from the Panchayat. The job card should be with
the households. All details such as date of application for work, employment
demand, employment provided, description of work, muster roll ID in which
attendance recorded and wages paid, unemployment allowance paid (if any),
etc. are recorded in the job card. Transparency warrants that job cards should
be with the beneficiaries. Evidence from the field shows that the presidents of
the village panchayats withhold the job cards with them. This is likely to result
in non-payment of statutory minimum wages, fudging of muster rolls leading
to large scale corruption in the scheme. This may not be true for all the
panchayats in all the districts. But such a practice even by the presidents of a
few panchayats in few states would set a very bad precedent tarnishing the
very image of the noble scheme.
Failure to hit the 100 guaranteed days: The Act has guaranteed 100 days
of work per year to all the rural households registered under the scheme.

11
However, majority of the households work only for an average of 50 days.
For instance, the average person days employed per household was less
than 50 in 24 out of 34 states (2008-09). This clearly shows that a lot need to
be done to ensure 100 days of work to all the rural households in all the
states.
Consistent concurrent monitoring lacking: Another missing link in the
implementation chain is concurrent monitoring. Information technology has
an indispensable role in providing the necessary information at the right time
in a transparent way. NREGA has developed a good management
information system. But then, it fails to alert on certain vital issues. For
instance, it is not able to raise an alert on delays in wage payments because
data are normally updated post-facto, thus undermining the very basis of
monitoring (Pramathesh Ambasta: 2009).
Inter-state variations: There are inter-state variations in executing the
scheme. Certain states have performed well in terms of certain key
indicators, such as women participation, average days of employment per
person per annum, conduct of social audit; etc. For example, Rajasthan and
Tripura have performed better among all major states in terms of employment
generation per rural household. In both the states employment generation
under NREGA is quite close to upper limit of 100 days per rural household, in
the year 2006-07. This is an unprecedented achievement in the history of
social security in India (Jean Dreze and Christian Oldiges, 2009).
Employment generation per household for the year 2007-08 indicates
that 10 states could generate more than 50 days of employment against the
target of 100 days; 7 states could generate an average 40-50 employment
days per household. Remaining 17 states (50 per cent) could generate only
less than 40 days on an average. The figure for the year 2009-10 shows a
promising trend as 12 out of 34 states have generated more than 40 days
within a period of 7 months (See Table 1.2).

12
Table 1.2: Person days employed per household
Person days
employed States (2008-09)
No. of States
States (2009-10) Till 30
th Oct. 2009
No. of States
<20 Puducherry, Andaman & Nicobar; Chandigarh, Daman & Diu, Goa
5
Kerala, Maharashtra, Andaman & Nicobar, Chandigarh, Dadra & Nagerhaveli, Goa, Daman & Diu
7
20-30 Gujarat, Punjab, West Bengal, Dara & Nagerhaveli, Bihar, Kerala
6
Assam, Gujarat, Punjab, West Bengal, Uttarkhand, Lakshwadeep, Puducherry, Meghalaya, Bihar
9
30-40
Jammu & Kashmir, Karnataka, TamilNadu, Uttarkhand, Orissa, Meghalaya,
6
Haryana, Himachal Pradesh, Jammu & Kashmir, Manipur, Sikkim, Orissa
6
40-50
Andra Pradesh, Arunachal Pradesh, Assam, Haryana, Himachal Pradesh, Maharashtra, Jharkhand
7
Andra Pradesh, Arunachal Pradesh, Karnataka, Madhya Pradesh, Tripura, Uttar Pradesh, Jharkhand, Mizoram, Chattisgarh
9
>50
Madhya Pradesh, Rajasthan, Sikkim, Tripura, Uttar Pradesh, Chattisgarh, Manipur, Mizoram, Nagaland, Lakshwadeep
10
Rajasthan, TamilNadu, Nagaland
3
Total States 34 34
Source: Data Compiled from www.nrega.nic.in
Regarding participation of women, the highest was reported in Tamil
Nadu with 82 per cent followed by Kerala with 73 percent in 2007-08. Women
participation was more than 61 per cent in 5 states in 2008-09 and 2009-10.
It ranged between 30 and 60 per cent in 19 states during 2008-09 and in 21
states during 2009-10. In the remaining states, it was less than mandated 30
per cent (See Table 1.3). It can be concluded that, women participation was
far better than the minimum prescribed norms under the Act in majority of the
states.

13
Table 1.3: Share of women in NREGS employment
Percentage of women
participation States (2008-09)
No. of States
States (2009-10) Upto 30
th Oct. 2010
No. of States
<30
Arunachal Pradesh, Assam, Punjab, Uttar Pradesh, West Bengal, Jharkhand, Lakshwadeep, Daman & Diu, Goa, Jammu and Kashmir
10
Arunachal Pradesh, Assamm, Jammu & Kashmir, Punjab, Uttar Pradesh, Lakshwadeep, Daman & Diu. Goa, West Bengal, Chandigarh
9
30-60
Andhra Pradesh, Bihar, Gujarat, Haryana, Himachal Pradesh, Karnataka, Madhya Pradesh, Maharashtra, Sikkim, Tripura, Chattisgarh, Uttarkhand, Manipur, Meghalaya, Mizoram, Nagaland, Orissa, Andaman & Nicobar, Lakshwadeep
19
Andra Pradesh, Gujarat, Haryana, Himachal Pradesh, Karnataka, Madhya Pradesh, Maharashtra, Sikkim, Trpura, Chattisgarh, Jharkhand, Uttrakhand, Manipur, Mizoram, Nagaland, Orissa, Andaman & Nicobar, Lakshwadeep, Bihar
19
>60 Kerala, Rajasthan, Tamil Nadu, Puducherry, Dadra & Nagerhaveli
5
Kerala, Rajasthan, Tamil Nadu, Puducherry, Dadra & Nagerhaveli, Meghalaya
5
Total 34 Total 34
Source: Data Compiled from www.nrega.nic.in
Table 1.4: Share of Wages in Total Expenditure
Percentage States
(2008-09) No. of States
States (2009-10) Upto 30
th Oct. 2010
No. of States
<60
Sikkim, Jharkhand, Orissa, Andaman & Nicobar, Lakshwadeep, Daman & Diu, Goa.
7
Himachal Pradesh, Madhya Pradesh, Jharkhand, Meghalaya, Andaman & Nicobar, Lakshwadeep, Daman & Diu, Goa.
8
>60 All Other States 27 All Other States 26
Total 34 Total 34
Source: Data Compiled from www.nrega.nic.in
The share of wages in total expenditure was more than 60 per cent in
majority of states in 2008-09 and 2009-10. However, it was less than 60 per
cent in some of the states.

14
It is, thus, clear that the scheme is not performing well in all states.
Perhaps it may be too early to expect better performance in all the states.
The reasons are obvious. First, the scheme has been implemented in three
different phases across the states in the country. Second, states do differ in
terms of development. There are rich states and poorer states. The existing
institutional arrangements especially in poor states like Bihar, Chattisgarh,
Uttar Pradesh and Madya Pradesh are not good enough to implement the
NREGA in an effective manner (Pinaki Chakrabarthy: 2007). Third, the
preparation needed for this revolutionary Act was not in place before it was
launched (Mihir Shah: 2009). Fourth, failure on the part of the state and the
functionaries to generate required awareness about the scheme. Fifth,
entrusting the works related to NREGA to the already overburdened staff at
the block and at the district levels. Sixth, panchayats are the prime movers of
the scheme; but then, they do not have the necessary capacity to manage the
scheme.
NREGS Vis-à-vis Earlier Wage Employment Programmes
The nation has implemented a series of wage employment
programmes for the poor. The earlier programmes cast the state in the role of
a benefactor offering hand-outs to the poor. But NREGA has built notions of
citizenship and entitlements. NREGA represents a paradigm shift from the
earlier, wage employment programmes in several aspects (Vijayanand S.M.
and V.N.Jithendran: 2009). The differences are given in Box 1.1.

15
Box 1.1. NREGS vis-a-vis. earlier employment Programmes
NREGS Earlier Programmes
Concept
o Legal guarantee of right to
employment
o Demand-driven
o Focus on productive sector for
sustainable development through
natural resource management
o Gender sensitive
o Vision based participatory
perspective planning
o Organic central role for PRI’s
o Incidental to scheme; no legal
guarantee
o Supply-driven
o Focus on public works;
predominantly roads
o Male / Machine dominated
o Short-term priority listing
o Marginal agency role for PRI’s
Planning
o Long preparatory phase
o Can be integrated with varied
development works
o Multi-dimensional action plans
covering, time, space, manpower
and resources
o Result-based and outcome
oriented
o Hurried quick-fix plans
o Limited to schematic works
o Two dimensional action plan
covering resources and works.
o Expenditure oriented.
Organization
o Panchayat in central place-
development from within
o People estimates
o Minimum wages
o Equal wages
o Payment through bank or post
offices
o Work without whip - new dynamics
of mutual help and group
discipline.
o Middlemen/ contractors in central
place – outsourcing development
o Engineers estimate
o Market wages
o Differential wages
o Direct cash payments
o Ruthless suppression by
middlemen – contractors
Administration
o Integrated and consistent data
base
a) Unique ID of workers
b) Unique ID of work
c) ID of muster rolls
d) Payment vouchers
e) Bank accounts of individuals
o Close monitoring
o Clear accounting system
a) proactive disclosures
b) vigilance & monitoring
committee
c) social audits
o No such data base
o Routine monitoring
o Ritualized and routine
Source: Vijanand S.M and V.N.Jithendra (2009)

16
Conclusion
NREGA is a path-breaking legislation with the main objective of
providing legal guarantee to all the rural households to have secured access
to employment opportunities. Employment now, is a legal entitlement to rural
households. Started in the year 2006, the scheme has been in operation in all
the states. The outcome of the scheme is quite encouraging as it has started
yielding dividends in terms of improved wages, improved income, and
marginal improvement in living standards and so on. The scheme has come
across certain hurdles or shortcomings which include delayed payment of
wages, instances of fudging of muster rolls, corruption, more emphasis on
employment rather than long-term interest such as ownership and
maintenance of assets, shortage of dedicated human resources at the
Panchayat level, failure to provide employment within 15 days of demand for
work, non-convening of Gram Sabha meetings, uneven performance within
the state and across the states and so on. Despite all these shortcomings, the
scheme, which is described unprecedented in the history of employment
programme throughout the world, has been slowly and steadily picking up.
Steps are being taken to position the safeguard mechanism related to
transparency and accountability at all levels. The success of the scheme
largely depends on the state, local bodies, civil society organizations and
ofcourse the proactive participation of the beneficiaries of the scheme. What
we have presented so far is the macro scenario of the NREGS over a period
of three years based on the review of earlier studies and the review of
secondary sources of data and information. We now present performance of
the scheme in a selected state (Kerala) based on an in-depth study using a
mix of methods such as survey, focus group discussion, case study and
observation. The presentation of macro scenarios, we thought, would provide
a backdrop to this study. The subsequent chapters will deal with the
methodology, the profile of the state and the districts under study and the
performance of NREGS in Selected districts of the State.
* * * * *

17
Chapter - 2
Design of the Study
Introduction
National Rural Employment Guarantee Scheme is the largest ever
public programme conceived and grounded in the human history. It is the
most powerful initiative ever undertaken for the transformation of rural
livelihoods. It goes beyond poverty alleviation and recognizes employment as
a legal right. It creates the right to work. It is demand-driven. It has the
potential to provide a ‘big push’ in Indian regions of distress. The immediate
objective of the Act is to ensure the livelihood security of households in rural
areas of the country by providing at least one hundred days of guaranteed
employment in a financial year to every household, whose adult members
volunteer to do unskilled manual work (The Ministry of Rural Development,
Government of India; 2008). The choices of work suggested in the Act
addresses causes of chronic poverty like drought, deforestation and soil
erosion, so that the process of employment generation is maintained on a
sustainable basis. Thus, the act has both short term and long term objectives.
Implemented in three phases, the Act is operational in 625 rural districts
spread across 34 states in the country.
The expected outcomes from the scheme are many. First, it is not just
a scheme to merely provide relief in times of distress. It is a scheme to
provide long-term drought and flood-proofing to Indian agriculture. Second,
effective implementation of the scheme would take the economy on to a more
sustainable growth path and as a result the economy would be less
vulnerable to the vicissitudes of nature. Third, the growth fuelled by the
scheme would help reduce poverty because it is an established fact that the
impact of growth on poverty is higher in areas where social infrastructure is
more developed. Fourth, it is strongly believed that the expenditure incurred
on the employment guarantee would be non-inflationary for it is likely to cause

18
a spurt in agricultural growth which would provide a strong foundation upon
which a wide spectrum of sustainable livelihoods could be developed. Fifth,
successive rounds of investments in the programme would result in multiplier
of secondary employment opportunities.
All these outcomes can be a reality only when all the salient features of
NREG Act, and the process suggested are meticulously planned and
implemented. The key factor for the success of the programme lies in the
active participation of the rural households coupled with effective involvement
of the functionaries at the grassroots level (panchayat) who are in-charge of
implementing the programme. Transparency - a critical input in designing and
executing the activities at the different levels of structures created to plan,
execute, monitor and evaluate the programme - plays an indispensable role in
making the programme sustainable.
The scheme was launched in the beginning of 2006. Almost four years
have elapsed since the inception of the scheme. How does the scheme
perform? Do the provisions of NREGA and the guidelines evolved under the
schemes provide a wholesome process for effective implementation of the
scheme? Has the process been followed in letter and spirit?. What are the
hurdles at different phases of the process? The scheme envisages visible
outputs and outcomes. What are the outputs and outcomes of the scheme?
To what extent has the scheme been able to bring changes in the living
conditions of the people? What are the problems experienced by the various
stakeholders especially at the grassroots level? These are all some of the
major issues which require a study and an indepth analysis. Such a study
would throw enough light on the functioning of the scheme, the actual
outcome against the expected outcome, the problems that crop up in
implementing programme and so on. It is against this backdrop, the present
study has been taken up in select districts of Kerala.

19
Objectives of the study
The broad objective of the study is to analyse the functioning of the
National Rural Employment Guarantee Scheme encompassing all its
essential aspects. More specifically, the study aims at:
i). analyzing the extent to which the scheme has guaranteed
employment and livelihood to different sections of rural
households;
ii). assessing the quality of the assets created and their likely impact
on the agrarian economy;
iii). ascertaining the impact of the scheme on the socio-economic
conditions of the people;
iv). assessing the limitations and constraints faced by the
functionaries in implementing the scheme;
v). identifying the problems faced by the participants (primary
stakeholders of the scheme; and
vi). identifying and document the best practices as (if any) adopted in
implementation of the scheme.
Scope and coverage
The broad issues to be addressed would include:
• There is a mismatch between employment days guaranteed and
the actual number of days employed. Why there is a gap? What are
the problems in providing guaranteed employment days?
• The problems in identifying the works as per the provisions of Act
and the guidelines issued.
• There is also a mismatch between the wage assured under the act
and the wages actually paid. What are the reasons? What are the
problems faced in providing wages assured?
• Do the functionaries of the panchayat have problems in
implementing the scheme at the panchayat level? What is the
nature and dimension of the problems? How could the problems be
overcome?

20
• Certain panchayats within the district and certain blocks within a
district are likely to perform better than others in implementing the
scheme. What are the enabling or pushing factors that help them
perform better? What are the retarding or pulling factors for poor
performance?
• The outcome and impact of the scheme to a larger extent depend
on the quality and relevance of assets created. What do people
think about quality and relevance of the assets created?
• An important objective of the scheme is to help reduce poverty. Has
the scheme succeeded in reducing poverty?
• The credibility and success of the scheme depends on the degree
of transparency exhibited in the project related activities. What is
the mechanism adopted to ensure transparency in the project?
These are all some of the important central issues that would be
addressed under the study. The findings and the inferences drawn thereon in
the context of the issues raised would definitely help in finding out the
problems, limitations and constraints in implementing the scheme and would
help in finding solutions to overcome the problems.
The target group for the study would include both primary and
secondary stakeholders of the project viz., the men and women who
participated in the scheme, the functionaries of the panchayat and the Block
Development Office, the personnel working in the project and the project
officer of DRDA.
Methodology
Methods
The study has employed mix of methods to address the objectives laid
down. Both primary and secondary data were collected.
To begin with, a thorough review of the secondary data related to the
NREGS at the district, block and panchayat levels was undertaken and
documented.

21
A comprehensive household survey was done mainly to ascertain the
outcome and impact of the project in the light of project interventions. A
pretested interview schedule was administered to collect the data from the
sample beneficiaries.
Qualitative methods such as focus group discussion, case study and
interview with key informants were used to supplement and complement the
inferences drawn from the survey data.
Research questions addressed
The major research questions addressed under the study are:
o What are the efforts made by the panchayat, Block Development
Office and DRDA for registering the rural households under the
scheme?
o Have all the eligible rural households got registered under the
scheme?
o Have all the registered households sought for employment
participated in the works under the scheme? If not what are the
factors hindering participation of the households?
o What is the average number of days employed in a year? Are there
variations in terms of number of days employed with reference to
caste and gender?
o What are the facilities made available in the worksite? Are they
adequate? If not, what facilities are required at the worksite?
o Have all the panchayats identified the works to be undertaken as
per the guidelines? How they estimated the quantum and value of
work identified? Is there any mismatch between the demand for
work and the availability of work? What are the steps taken by the
panchayats to fill the gap between demand and availability?
o What is the average wage earned by the household? Is there any
variation in the wages earned across the households? If so what
are the reasons? Are the wages distributed hovering around the

22
minimum wages prescribed? If ‘no’ what are the reasons? What is
the system followed in the distribution of wages? Have the
households experienced any problems in getting wages? If ‘yes’
what are the problems?
o What are the views and opinion of the women employed under the
scheme on the implementation of the scheme? What are the
problems that they face in the worksite?
o What is the quality of work? Have the works undertaken helped in
developing creative assets? Have they helped in conserving soil,
water and other natural resources?
o What is the impact of the programme on the rural households with
special reference to i) creation of livelihoods; ii) income iii) assets;
iv) expenditure; v) savings; vi) liability; vii) migration; and viii) social
capital? How do people spend the wages earned? What is the level
and intensity of migration after the introduction of the scheme?
o What is the mechanism evolved and adopted to ensure
transparency and accountability under the scheme? What is the
degree of transparency and accountability found in the scheme?
o Are the people satisfied with the way in which the programme is
implemented? If ‘no’ what are the improvements suggested by the
people?
o What are the difficulties experienced by the functionaries at different
levels to implement the scheme? What are the measures initiated to
overcome such difficulties?
Sample design
Kerala State was the venue of the study. Multi stage sampling process
was adopted to select the sample for the study.
First Stage: Selection of District
There are fourteen districts in Kerala. Four districts were selected for
the study. The criteria adopted were: i) Geographical location. The entire
State of Kerala divided into three regions viz., Eastern high land, Central

23
midland and Western coastal low land. We have chosen two districts from
eastern highland, one from central midland and one from western coastal low
land. ii) Period of implementation of the scheme. The scheme has been
implemented in three phases viz., Phase I, Phase 2 and Phase 3. Two of the
districts chosen fall under first phase, one under second phase and the fourth
under third phase. iii) Performance of the district in the implementation of
NREGS good performing, moderately performing and least performing
districts. Regarding performance of four districts chosen, one come under
best performing, the second one come under moderately performing and
remaining two districts come under least performing. The districts selected
based on these criteria are: i) Palakkad; ii) Wayanad; iii) Idukki; and
iv) Alapuzha.
Second Stage: Selection of Blocks
Having chosen the districts, the next stage is to select the blocks. Two
blocks from each district were chosen. The criteria followed were:
i) concentration of agricultural labourers; ii) concentration of SC/ST
households; and iii) performance of the block.
Third Stage: Selection of Panchayat
From each Block chosen, four panchayats were selected for the study
except one Block where there were only three panchayats. The criteria
followed were i) performance of the Panchayat ii) Concentration of agricultural
labourers. and iii) concentration of SC/ST households and The total number of
Panchayat selected for the study was 31.
Fourth Stage: Selection of Beneficiaries
Having selected panchayats, the next stage was to select the
beneficiaries of the NREGS. We obtained the list of workers from
panchayats. We chose 20 beneficiaries from each panchayat at random.
The total sample beneficiaries for the study were 620 (See Table 2.1)

24
Table 2.1: Sample frame work
District Block Panchayat Sample
Beneficiaries
Eruthenpathy 20 Vadakarapathy 20 Perumatty 20
Chittur
Kozhinjampara 20 Puthur 20 Agali 20
Palakkad
Attappady
Sholayur 20 Pozhuthana 20 Thoriyode 20 Kottathara 20
Kalpetta
Vengapally 20 Edavaka 20
Thavinhal 20 Thondarnad 20
Wayanad
Manathavady
Mananthavady 20
Adimali 20 Pallivasal 20 Bisonvalley 20
Adimali
Konnathady 20 Vattavada 20
Marayur 20 Mankulam 20
Idukki
Devikulam
Kanthalloor 20 Nedumudi 20 Thakazhy 20 Kainakari 20
Champakulam
Edathua 20 Neelamperur 20 Muttar 20 Kavalam 20
Alapuzha
Velliyanad
Ramankary 20 4 8 31 620
Tools for data collection
As indicated, an interview schedule was administered to collect the
data from the respondents. The schedule sought data on socio-economic
profile of the respondents like, family details, housing condition, income and
expenditure pattern, assets possessed like land owned, livestock and
household durables, loans, migration, social participation of members,
awareness about NREGA, registration, employment and wage under NREGA,

25
effects of NREGA, the impact of NREGA and the respondent’s perception
about the functioning of NREGA and so on.
We have conducted Focus Group Discussion in 31 panchayats for
which we used a check list. The checklist canvassed qualitative data on start-
up activities, launching of the scheme in the Panchayat, registration and issue
of job cards, identification of works, demand for employment, execution of
work, payment of wages, impact of the scheme, staff and training, record
maintenance, monitoring of the activities, social audit, grievances redressal
mechanism, organization structure, mechanism evolved to ensure
transparency, relevance of the scheme for the area, difficulties encountered
and suggestions for the better implementation of the scheme.
Framework of Analysis
The data gathered through survey were edited and tabulated. Two-way
tables were constructed for all the variables considered under the study to
present a comparative analysis of the performance of NREGS in selected
districts. District-wise data were compared against the aggregate data to
present a critical analysis and review of the scheme.
Qualitative data collected through the focus group discussion were
compiled, edited and used throughout the study to supplement and
complement the inferences drawn from the survey data.
Case studies conducted have been edited and presented in
appropriate places to support the inferences drawn from survey and focus
group discussion.
It should be noted here that the study has mostly relied on the primary
data gathered through survey, FGD, direct observation and case study.
However, the study has made use of secondary data drawn from website and
officials records, registers wherever they were found necessary and relevant.
* * * * *

26
Chapter - 3
Profile of Kerala and the Districts chosen for the Study
Location
Wedged between Arabian Sea in the west and the mountains of the
Western Ghats in the east, Kerala state stretches north-south along a coast
line of 580 kms with a varying width of 35 to 120 kms. The state with a
landmass of 38,863 square kilo meters is one of the smallest states as it has
just 1.18 per cent of the total landmass of the country. The nature of the
terrain and its physical features divide an east west cross section of the state
into three distinct regions viz., eastern highlands, central midlands and
western costal lowlands.
The high lands on the eastern edge, close to the Western Ghats,
comprises of steep mountains and deep valleys, covered with dense forests.
Almost all the 44 rivers of the state originate here. This area is dotted with tea
and coffee plantations as well as spice gardens. The central midlands with
rolling hills and shallow valleys are dotted with paddy fields in the lower areas
and groves of rubber and other cash crops in the elevated slops. The western
coastal lowlands comprises of relatively flat fertile plains, wide deltas, deep
back waters, lakes and shifting mud-flats. The important feature of this area is
the extensive paddy fields and groves of coconut trees crisscrossed by a
backwater network of interconnected canals, lakes and rivers. The backwater
networks of the costal lowlands, with its 1920 km length, cover more than 20
per cent of India’s waterways. Kerala receives a good annual rainfall
benefiting out of the South West and North East monsoons. The annual
rainfall of 3107 mm is much higher comparing the national average of 1197
mm. The state is bestowed with rich natural resources, and nick named as
‘Gods own Country’.

27
Administration
Kerala with its state capital in Thriruvanathapram has 14 districts. For
administrative purpose the state is divided into 63 Taluks and-development
blocks. Total number of Gram Panchayats in the state is 999.
Table 3.1 District profiles
S.No Districts Area
(sq. km) No of
Taluks No. of
Panchayaths 1 Kasaragod 1992 2 39 2 Kannur 2966 3 81
3 Wayanad 2131 3 25 4 Kozhikode 2344 3 77 5 Malappuram 3550 6 99 6 Palakkad 4480 5 90 7 Thrissur 3032 5 92 8 Ernamkulam 2407 7 91
9 Idukki 5019 4 54 10 Kottayam 2203 5 75 11 Alapuzha 1414 6 75 12 Pathanamthitta 2642 5 54 13 Kollam 2491 5 69 14 Thiruvanthapuram 2192 4 78
Kerala 38863 63 999 Source: Planing board of Kerala (2009) and district websites
Demographic features
Kerala is one of the thickly populated states in the country. According
to 2001 census, the state has a population of 31,838,559, which is 3.44 per
cent of the country’s total population. The population density of 819 people
per sq. km is one of the highest in India. The state also has the dubious
distinction of female outnumbering male population. The sex ratio is 1058
female for every 1000 male.
Kerala’s unique settlement pattern and wider infrastructure
development makes it difficult to see the differences between urban and rural
areas and there is a strong rural-urban continuum in all along the state. Of the
total population, urban dwellers figures to 82.7 lakh persons which is above
one-fourth (26 percent) of the whole population and rural populace constitute
235.7 lakhs.

28
Table. 3.2: District wise population profile (as per 2001 census)
Population Sl.no
District
Person Male Female
Population
Density/
sq. km
1 Kasaragod 1203342 587763 615579 604 2 Kannur 2412365 1154144 1258221 813 3 Wayanad 786627 393397 393230 369 4 Kozhikode 2878498 1398674 1479824 1228 5 Malappuram 3629580 1759479 1870101 1022
6 Palakkad 2617072 1265794 1351278 584 7 Thrissur 2975440 1422047 1553393 981 8 Ernamkulam 3098378 1535881 1562497 1050 9 Idukki 1128605 566405 562200 252 10 Kottayam 1952901 964433 988468 884 11 Alapuzha 2105349 1012572 1092777 1489
12 Pathanamthitta 1231577 588035 643542 467 13 Kollam 2584118 1248616 1335502 1038 14 Thiruvanthapuram 3234707 1571424 1663283 1476 Kerala 31838559 15468664 16369895 819
Source: Planning Borad of Kerala (2009)
Hindus, who constitute 56.20 per cent of the total population, is the
most prominent religious community in the state. This is followed by Muslims
(24.7 per cent) and Christians (19 per cent). A small number of Sikhs,
Buddhists, Jains, Jews and other religious communities are also present.
Kerala is also home for indigenous tribal population who constitute 1.14
per cent of the total population. Major portion of them reside in the main
stream with other people. The highest concentration of scheduled tribes is
seen in Wayanad district (37.36 per cent) followed by Idukki (14 per cent) and
Palakkad (10.89 per cent) and these three districts together account for over
60 per cent of ST population of the state. The coastal district of Alapuzha has
the lowest percentage of tribal population. The highest distribution of people
belonging to scheduled castes is in Palakkad district (13.85 per cent) followed
by Thiruvananthapuram (11.87 per cent), Thrissur (11.34 per cent) and
Kollam (10.34 per cent). Nearly half of SC population of the state is distributed
in these four districts.

29
The proportion of child population (0-14 yrs) to the total population is
just 26 percent in Kerala, which is the lowest among the major states of India.
The proportion of people in the working age group (15-59) is 63.4 percent in
Kerala as against 55.6 per cent in India. Kerala seems to be aging fast with
people who have above 60 years forming 10.5 per cent of the total population,
which is the highest among the major states of India. The aged population of
the state is 33.36 lakhs.
Figure 3.1 Age-wise Distribution of Population in Kerala
Source: Census of India. 2001
Literacy and health status
The state has progressed well in advance among the Indian states, in
terms of socio-demographic status of its population. Kerala’s achievement in
literacy attainment (90.9 per cent as per 2001 census) especially female
literacy (87.86 per cent) and 100 per cent enrolment of children in school,
irrespective of gender, has contributed much to the socio-economic progress
of the state. Besides, the state has a positive sex ratio, that favours female
population. Kerala also has the lowest Infant Mortality Rate(IMR)(13 per 1000
live births), lowest MMR (110 per l lakh live birth) in the country. Life
expectancy rate is highest in the country for both male (71.3 years) and
female (76.3 years).
82.96 ( 26%)
201.82, (64%)
33.35 (10%)
0-14 years
15-59 years
60+ years

30
Economy
While the social and demographic state of Kerala showing a rosy
picture, the weak state economy contradicts with it. The state is one of the
highest revenue deficit states in India, which is estimated to be 56 per cent of
the State GDP, as per the statistics published by the Dept. of Economic and
Statistics. The State GDP at factor cost at constant price is Rs.1,62,415 crore
in 2007-08) with a weak industrial development and ever declining trend of
agriculture in the state, the tertiary sector, including retail trade, tourism,
telecom, construction etc. contribute to the bulk of the state economic output.
The sectoral share of tertiary sector to the State GDP at constant prices
(2007-08) constitutes 57 per cent at current prices. The contribution from
agriculture (primary sector) is decreasing and constitutes just 17 per cent (at
constant prices). The secondary sector remains almost stagnant at about 26
per cent for the past years.
Figure 3.2. Sectoral contribution to state economy
Within the state, the districts such as Ernakulam, Trivananthapuram,
Thrissur and Palakkad have better trade and industrial background and
therefore have better State GDP status, while the districts such as Wayanad,
Idukki, Kasargode and Pathnamthitta which are mainly agriculture based,
have low GDP. The agriculture sector of the state is dominated by cultivation
of cash crops such as coconut, rubber, tea, coffee, cashew nut and spices.
17%
26%57%
Primary
Secondary
Tertiary

31
Further, the 580 km long costal front helps to gain economic advantage of rich
marine products.
Another key feature of Kerala’s economy is its heavy dependency on
remittance. In a state with 31.8 million people, 2.19 million people are
emigrants in other countries, especially Middle East Asian nations. Foreign
remittance to Kerala is showing an increased trend even during recession
period, and in the last 5 years it has increased 135 per cent to touch a
whooping Rs.43,300 crore, making it as the major contributor to the state
economy (25 per cent of the total economic output). With a slow industrial
growth and reduced opportunities in the primary sectors, migration to other
countries and the subsequent remittances to the state holds much
importance. Further, the high growth in the tertiary sector in the state has a
direct bearing on this “remittance economy”.
Though the state economy is weak, the household level financial
condition in the state is better. The per capita state income of Rs.41814 (at
current cost during 2007-08) is much higher than that of the per capita
national income of Rs.33299/-. The poverty ratio of the state is also low at 15
per cent ( as per the 2004-05 poverty estimation) against the country’s
poverty ratio of 27.50 per cent. An estimated 17,23,556 households in the
state fall under BPL category.
Employability and employment
Kerala, being an agrarian economy, a good percentage of its
population is confined to agriculture and other agro based industries. 32.3 per
cent of the total population belongs to the working category (main and
marginal workers) and 67.7 percent are non-workers. The distribution of the
working population in the state is cultivators (7.2 per cent), agricultural
labourers (16 per cent), household industries (3.5 per cent) and other workers
(73.2 per cent).
Though the state has progressed in literacy and education attainment,
the work participation rate (WPR) in Kerala, shows a negative status
comparing to the national average. More than half of the labour force of the

32
age group of 15-29 years is unemployed. Further, the WPR of women falls far
short for men. As against 51.6 per cent for male and 22.7 per cent for female
in 2001 at the all India level, the work participation rate in Kerala was 50.6
percent for male and 15.3 per cent for male. The educational specific WPR
also shows a clear gender gap. The structural change in the employment
scenario of the state has the impact on lower work participation especially the
female participation. The last few decades witnessed the continuous decline
of several labour intensive activities, such as rice cultivation, traditional
cottage industries, etc. The corresponding growth has not happened in the
industrial sectors in the state. Further, conversion of agriculture land for non
agriculture use has been fast in the recent years, which has resulted in a
sharp decline in women oriented agricultural works.
Table 3.3: Education specific WPR per persons of age 15 years and above
Kerala All-India Level of
Education Rural Male
Rural Female
Urban Male
Urban Female
Rural Male
Rural Female
Urban Male
Urban Female
Not literate 61.82 33.3 63.9 30.4 89.2 55 83.1 30.4
Lit. & upto Primary
81.9 38.1 75.7 28.7 89.5 44.9 85.5 23.4
Middle 82 32.6 81.3 20.1 80.2 37.1 76 16.1
Secondary 69.2 26.2 64 17.4 73.2 30.5 67.3 12.3
Higher Secondary
53.9 14.7 47.9 13 70.9 25.2 60.8 12.9
Diploma Certificate
81.7 46.6 81.6 40.4 82.1 52.3 79.8 48.6
Graduate & above
78.8 45.9 79.7 42.9 85.1 34.5 79.5 29
Source: NSSO Report (2004-05)
Among those who are employed, there is sharp disparity in wage
earning among the salaried people and the casual laborers. Also the rural-
urban divide in the earning is visible in Kerala (See Table 3.4).
Palakkad District
Palakkad district with a total area of 4,480 km is one of the largest
districts in Kerala. It is bounded on the east by the Coimbatore district of Tamil
Nadu, on the north and northwest by Malappuram district and on the south by
Thrissur district. Palakkad lies near the Palghat Pass, a, 32 to 42 km wide
natural gap through the Western Ghats ranges, that run parallel to the west

33
coast of India, and connects Kerala to the plains of the state of Tamil Nadu to
the east. This district, situated almost in the centre of the State, has no
coastal line. Based on the physical features, the district can be divided into
two natural divisions - midland and highland. The midland region consists of
valleys and plains. It leads up to the highland which consists of high mountain
peaks, long spurs, extensive ravines, dense forests and tangled jungles.
While Ottappalam taluk lies completely in the midland region, all other taluks
in the district lie in the midland and highland regions. About 1,360 sq.km of
land in the district is covered by forests.
Table 3.4: Employment in Kerala - An overview
Rural Urban Particulars
Female Male Female Male
Average wage/salary earning (Rs.) per day received by regular wage /salaried employees of age 15-59 years 116.93 151.61 150.89 229.74
Average wage/salary earning (Rs.) per day received by casual labourers of age 15-59 years 75.37 137.28 93.56 142.51
Unemployment rate ( usual principal status) 220 72 330 41
Percentage of workers 51.2 48.8 47.6 52.4
Number of full-time workers 362472 432132 110263 180311 Number of part-time workers 154376 59633 71842 19977
Number of working owners 327470 233297 102160 85660
Number of hired workers 130363 211582 49426 99266 Source: NSSO Report Nos.522 and 525 GOI
The district is divided into five taluks, viz, Alathoor, Palakkad, Chittoor,
Mannarkkad and Ottappalam. There are 90 Panchayats in the district
comprising 144 villages. Total number of households in the district is 0.53
million; and total population is 2.6 million. The density of population is 584 per
sq.km, which is lower than that of the state average. Sex ratio is 1,066 and
literacy level is 84.35 per cent (Male 89.52%; Female 79.56%).
The district is one of the main rice producing regions in Kerala and its
economy is primarily agricultural. Rice cultivation is taken up in 1,15,910
hectares. The district also has fairly well developed industrial sector with
1,975 factories and 2,516 SSI units. Work Participation Rate (WPR) is only
36.11 per cent. The WPR of female (21.20 %) is much less than that of the
male (51.99 %). 1.67 million people in the working age group are not engaged
in any activity. Agriculture and household industries engage more than 46 per

34
cent of the workers. Per capita income is very low (Rs.18,031). Of the total
households (5,30,216) in the district, 52.13 per cent families live below
poverty line . Among the total number of BPL households in the district,
51,595 households belong to SC community, while 2812 households belong
to Scheduled Tribes.
Wayanad District
The district with an area of 2,131 sq. km. is nicknamed as ‘Green
Paradise’ due to the presence of dense forests and foliage. It is bounded on
the east by Nilgiris ranges of the Western Ghats of Tamil Nadu and Mysore
district of Karnataka, on the north by Coorg district of Karnataka, on the south
by Malappuram district and on the west by Kozhikode and Kannur district. The
district has a rich forest cover of 78,787 ha. Most of the reserve forests in the
state are in this district.
The district is divided into three taluks, namely, Sulthan Bathery, Vythiri
and Mananthavady. There are 25 panchayats covering 48 villages. The total
number of households in the district is 1,66,763 while the total population is
7,80,619. The density of population is 369 per sq.km which is far below the
state average. The sex ratio is 995 female per 1000 male. The literacy rate in
the district is 85.52 per cent.
The different religious groups of the state are more or less equally
represented in the district. One-fourth of the population of Wayanad is
constituted by Christians. They are the largest religious group in Wayanad.
Hindus of different castes like Nairs, Thiyyas, etc. who settled here from
different parts of Kerala, form the rest. Wayanad has the highest
concentration of tribal in Kerala. They form 17.1 per cent of the total
population of the district. The native Adivasis mainly consist of various sects
like Paniyas, Kurumas, Adiyars, Kurichyas, Ooralis, Kattunaikkans, etc.
This high altitude district is characterised by the cultivation of perennial
plantation crops and spices. Wayanad is known for its sprawling spice
plantations. Coffee is ubiquitous in Wayanad. It is cultivated in every
panchayat, both in the form of large plantations and small holdings covering a

35
total area of 66,999 hectares. Tea is also cultivated in the district. Paddy is
cultivated in 22,772 hectares of land. The rice fields of Wayanad are in the
valleys formed by hillocks and in majority of paddy lands, only a single crop is
harvested. The districts have no major industrial units.
The work participation rate is 39.53 per cent. The WPR for male is
55.82 per cent, while that of female, it is 23.17 per cent. There are 4,72,006
people in the productive age group, who are not involved in any work. The
cultivators constitute 16.77 per cent (51,751 persons ) of the working
population, while 30.50 per cent of the workers (94,139 persons) are
agriculture labourers.
Per capita income of the district is Rs. 34,123. Of the total households
of 1,66,763 in the districts, 64,794 families (49.87 %) fall under below poverty
line category, of which 19,502 households are scheduled tribes.
Idukki District
Idukki has an area of 4,358 sq. km and is the second largest district of
Kerala. The district borders Pathanamthitta to the south, Kottayam to the
southeast, Ernakulam to the northeast and Thrissur to the north and
Coimbature, Dindigul and Theni Districts in Tamilnadu to the east. Sprawling
over an area of 5,061 sq. kms, the district is marked by undulating hills and
valleys. The highest peak of Kerala, Anamudi, is in the district. The different
levels of elevation promote the growth of diverse flora. The district has at
present about 2,60,907 ha. forest area. The district has several protected
areas including Periyar Tiger Reserve and Eravikulam National Park. Further,
the highlands of the district are dotted with tea and coffee plantations and
spice gardens.
The district has four Taluks viz, Udumpanchola, Devikulam, Peermedu
and Thodupuzha covering 51 Gram Panchayaths and 64 villages. Idukki has
a population of 11,29,221. With just 259 people per sq. km, the district has the
least population density among the 14 districts of Kerala. Total number of
households in the district is 2,65,344, which is lowest in the state. 88.69 per

36
cent of the population is literate (Male 92.33%; Female 85.02%). Sex ratio in
the district is 993, lower than that of the state average.
Christians constitute the majority among the population of the district.
The district has a high concentration of Scheduled Tribe population.
According to the latest Census around 11,516 Scheduled Tribe families are
living in the district. There are 245 tribal settlements in the District of which 74
are in Thodupuzha; 11 in Peermedu; 126 in Devikulam and 34 in
Udumbanchola Taluk. Almost all the scheduled tribes are living in the remote
hilly banks and in the deep interiors of forests of the district. Mannans, Mala
Arayans, Urali, Muthuvans, Malapulaya, Paliyan and Ulladan are the different
groups of tribals in the district. Many of the ST population are working as
agricultural labourers in the tea and cardamom estates. Devikulam and
Peerumedu taluks have a large concentration of Tamil population who are
mainly labourers in tea and cardamom estates.
86.98 per cent of the population in the district is literate, making it one
of the lowest in the state. This is mainly attributed to lower literacy rate among
the tribal population. .
The economy of Idukki is predominantly agriculture. The District has the
agro-climatic conditions suitable for the cultivation of plantation crops like tea,
coffee, rubber, coconut, cardamom, pepper, etc. The District acquired second
place in the state in agriculture produces. Idukki district is industrially very
backward. However, with its incredible scenic beauty, the district is a major
tourist attraction in the state, attracting lakhs of international and domestic
tourists every year. The Periyar Wildlife Sanctuary at Thekkady and Munnar
hill station are the renowned tourist centers in the district.
Work participation rate is just 39.71 per cent. 6,84,390 people in the
productive age group are not engaged in any work. Of the total working
population, half of them belong to agriculture and agriculture labourers. About
ten per cent of the total workers are estate labourers. The poverty ratio in the
district, as reported in 2001 census, is relatively low with just 15 per cent and
this includes 3,856 Scheduled Tribe families. However, the recent agriculture

37
crisis has resulted in increased risk of more households falling into poverty.
The closure of several tea estates in the region in the last few years has also
aggravated the situation.
Alapuzha District
Bounded on the northeast by Ernakulam and Kottayam districts, on the
east by Pathanamthitta, on the southeast by Kollam district and on the west
by the Arabian Sea, Alapuzha district lies in the eastern costal plains of the
state. The district is divided into two revenue divisions viz:Alapuzha division
comprising Cherthala, Ambalappuzha and Kuttanad taluks with 47 villages
and Chengannur division comprising Karthikapally, Chengannur and
Mavelikkara taluks with 44 villages. Total Gram Panchayaths in the district is
75. According to 2001 census, Alapuzha district has a population of 2.10
million. The density of population is 1489 persons per sq. km. which is highest
in the state. The district has 0.48 million households and population per
household is 4.36. The district has an SC population of 1,99,231 which
constitutes 9.45 per cent of the total population of the district. There is also a
small number of tribal population (3131) in the district.
The sex ratio recorded in this district is 1079 females to 1000 males.
The district has the third highest literacy level among the districts of Kerala
with 93.66 per cent. The female literacy rate is also high with 91.14 against
the state average of 87.86 per cent.
A good part of Alapuzha District is densely covered with waterways.
Kuttanad, a low lying area in the district is famous for paddy fields and a large
network of inland canals. The district economy depends primarily on the
agriculture and marine resources. The total production of rice here is almost
ten percent of the total production of the State. The district also has a major
share in the coconut cultivation. Alapuzha is the most important centre in the
State for coir industry. Almost 80 per cent of the coir factories in the State are
in this district. However, the district is industrially backward. Alapuzha district
occupies a very important position in the fisheries map of Kerala. Its western
boundary is the Arabian sea, having rich marine resources. More than 20 per

38
cent of the total area of the district is water-logged, and the 20,000 acres of
kari lands and 42,736 acres of paddy fields in Kuttanad are suitable for
pisciculture. The total population of fishermen in the district is 136,300.
Alapuzha is relatively backward district in terms of the standard of living
of the people. Per Capita income of the district, Rs 21,916, is one of the
lowest in the state. Agriculture and traditional industries in the district are
facing a major crisis, where a major section of population is engaged in
farming and in the coir industry. This had resulted in increased poverty among
the rural masses as the bulk of the poor in villages were employed in these
sectors. There was a decline in the per capita income of agricultural
labourers, farmers, and coir workers and small-scale manufacturers of coir
products. 45.95 per cent of the rural families in Alapuzha are considered
below-the-poverty line families. This makes it as the district with highest
proportion of population below poverty line.
The Work Participation Rate (WPR) of the district is very low with just
34.30 per cent of the population (in the productive age group) engaged in
some kinds of work. While the WPR of male is 49.41 per cent, the WPR of
female is only 20.29 per cent. Of the total workers in the district, 54,704 are
main workers while 1,76,305 are marginal workers. Only 3.81 per cent of the
workers are cultivators while 13.70 per cent are agriculture labourers. 7.20 per
cent are engaged in household industries and 75.29 per cent are other
workers.
Conclusion
The analysis of the socio-economic and demographic status of the
state points to the fact that Kerala has achieved a very distinct development
and has high potential of growth in terms of human resources. This is
supplemented by the rich natural resources of the state. However, the
economic scenario of the state is not very promising with poor growth in the
farm sector which employs a vast majority of the population and relatively
poor industrial growth. The State’s unique inter-linkage with international
economy through its large expatriate population and high concentration of

39
cash crops in the agriculture makes the State vulnerable to any economic
recession in the world economy. Even though the poverty rate in Kerala is low
(15%) among the Indian states, numerically the size of BPL families still holds
a serious attention as there are1.72 million BPL households. The low work
participation rate of Kerala (33.3%) further increases the concern over the
sustainability of the development of the state. The increased unemployment
among the population put the State with greater responsibility of creating
employment opportunities to this population. Thus focused intervention to
create sustainable livelihood source for the poor still holds importance in
Kerala.
The profile of the four chosen districts, viz. Palakkad, Wayanad, Idukki
and Alapuzha shows that the economy of these districts is predominantly
agrarian. In all these districts the dependency of the people on its rich natural
resources are visible and the livelihood security hence depends on the
protection of the natural resources. Though social and demographic progress
is better in all the districts, the economic situation is not promising. The
incidence of poverty and low work participation rate in these districts coupled
with the ever shrinking farm sector necessitates planned intervention like
NREGA in these districts.
* * * * *

40
48.31
51.69
49.61
50.39
49.93
50.07 50.14
49.86
49.58
50.42
46
47
48
49
50
51
52
Pe
rc
en
t
P alakkad Idduki Wayanad A lapuz ha Total
Male
F emale
Chapter - 4
Socio-Economic Profile of Sample Households
In the last chapter, we have presented the profile of the Kerala State
and the selected districts with reference to select key variables. We have
made an attempt here to sketch the profile of the NREGS workers in chosen
districts. The objective is to identify the socio-economic background of the
workers and their families. This, we thought, would enable us to ascertain and
portray what type of households get involved in NREGS. It must be noted that
all the respondents (620) we have interviewed across the four districts are
NREGS workers. Their profile are presented with reference to the population
of the households, size of the family, gender, community, literacy, housing,
occupation, migration, income, expenditure, assets possessed, borrowings
and social participation.
Population and Gender
The total population of the households is 2,592. The average size of
the family is 4.18. District wise distribution of the average size of the families
shows that Alapuzha has slightly large size of family followed by Wayanad.
The gender wise distribution of the population shows a slightly high
percentage of female population (50.42%). More or less similar pattern can be
observed in all the districts except Alapuzha, where the male population is
marginally high (50.14%) (See Figure 4.1)
Figure 4.1: Population and Gender

41
Age
The age-wise distribution of population of the sample households
reveals that around two-third of the population are in the productive age group
of 19 to 60 years. Further disaggregation shows that 30.32 per cent are in the
age group of 19-35 years and 33.41 per cent are in the age group of 36 to 59
years. School going age group constitutes around one-fourth of the total
population. The aged population accounts for 7.45 per cent while, children
below 5 years accounts for 4.48 per cent. District-wise analysis shows that the
age group of 36-59 is high in all the four districts. The aged population is
highest in Palakkad (9.74%) while population below five years is highest in
Idukki (6.10%) (See Table 4.1).
Table 4.1: Age of the Sample Population
Districts Age (Years)
Palakkad Idduki Wayanad Alapuzha Total
< 5 18
(3.4) 39
(6.1) 30
(4.3) 29
(4.0) 116 (4.5)
6-17 121
(22.7) 148
(23.2) 198
(28.2) 164
(22.9) 631
(24.3)
18-35 167
(31.3) 194
(30.4) 207
(29.5) 218
(30.5) 786
(30.3)
36-59 176
(32.9) 210
(32.9) 232
(33.0) 248
(34.6) 866
(33.4)
> 60 52
(9.7) 48
(7.5) 36
(5.1) 57
(7.9) 193 (7.5)
Total 534
(100) 639
(100) 703
(100) 716
(100) 2592 (100)
Source: NREGA in Kerala - HH Survey
The figures in the parenthesis represent the column percentage
Caste Composition
Caste-wise distribution of the households indicates that 16.9 per cent
of the sample households belong to Scheduled Caste community; 12.3 per
cent to Scheduled Tribes. The remaining 70.80 per cent of the households
belong to other caste groups. Idukki district has the highest percentage of SC
families with 26.9 per cent of the sample households followed by Alapuzha
with 25.6 per cent. Wayanad has the least number of SC households, where
just four households (2.5%) fall under this category. However, the district has
the highest number of Scheduled Tribe households (20.6%), followed by
Palakkad (17.9%) and Idukki (10%) (See Figure 4.2). An important inference

42
that can be drawn from the analysis is that all households, irrespective of
community, participated in NREGS.
Figure 4.2: Caste Composition of the Sample Households
12.117.9
70
26.9
10
63.1
2.5
20.6
76.9
25.6
1.3
73.1
16.912.3
70.8
0
10
20
30
40
50
60
70
80
Pe
rc
en
t
P alakkad Idduki W ayanad Alapuz ha Total
D is tric ts
S C
S T
Other
Literacy
The overall literacy rate among the sample population is 91.78 per
cent. District-wise analysis reveals that Alapuzha has the highest literacy rate
with 99 per cent followed by Wayanad (93.75%), Idukki (90.14%) and
Palakkad (81.46%). The educational attainment of the sample population
shows that majority of them have attained middle or secondary school level
education. They together accounts for 52 percent. Graduates constitute
around 5 percent. The percentage of professionals is around one per cent.
The educational attainment is slightly better in Alapuzha and Wayanad when
compared to other two districts. (See Table 4.2)
Number of Disabled
There are 105 disabled persons constituting 4.05 per cent of the total
population. The distribution of disabled population based on the nature of
disability shows that, 33.33 per cent of them are orthopaedic, followed by
visually disabled (24.76%) and hearing /speech impaired (20.95%). There are
a few cases of mental illness (9 persons), mental retardation (5 persons) and
cerebral palsy (8 persons). Among the districts, Palakkad has the maximum
disabled population followed by Alapuzha. (See Table 4.3)

43
Table 4.2: Literacy status of the sample population
Districts Literacy level
Palakkad Idduki Wayanad Alapuzha Total
Illiterate 99
(18.5) 63
(9.9) 44
(6.3) 7
(0.1) 213 (8.2)
Informal education 18
(3.4) 27
(4.2) 13
(1.9) 17
(2.4) 75
(2.9)
Primary 101
(18.9) 99
(15.5) 140
(19.9) 103
(14.5) 443
(17.1)
Middle 103
(19.3) 184
(28.8) 142
(20.2) 169
(23.6) 598
(23.1)
Secondary 141
(26.4) 151
(23.6) 195
(27.7) 258
(36.1) 745
(28.7)
Higher secondary 40
(7.5) 65
(10.2) 106
(15.0) 102
(14.3) 313
(12.1)
Graduate 22
(4.1) 31
(4.9) 44
(6.3) 32
(4.5) 129 (4.1)
Professionals 3
(0.6) 6
(0.9) 9
(1.3) 15
(2.1) 33
(1.3)
Not applicable 7
(1.3) 13
(2.0) 11
(1. 6) 12
(1.7) 43
(1.7)
Total 534
(100) 639
(100) 704
(100) 715
(100) 2592 (100)
Source: NREGA in Kerala - HH Survey
Figures in the parenthesis represent column percentage
Table 4.3: Number of Disabled among sample population
Districts Nature of the Disability
Palakkad Idukki Wayanad Alapuzha Total
Visual 8
(20.5) 3
(17.7) 2
(12.5) 13
(39.4) 26
(24.8)
Hearing/Speech 7
(17.1) 1
(5.9) 4
(25) 10
(30.3) 22
(20.1)
Orthapaedic 16
(41.0) 10
(58.8) 5
(31.3) 4
(12.1) 35
(33.3)
Mentally ill 3
(7.7) 2
(11.8) 2
(12.5) 2
(6.1) 9
(8.6)
Mentally retarded 2
(5.1) - 3
(18.8) - 5
(4.8)
Cerebral palsy 3
(7.7) 1
(5.9) - 4
(12.1) 8
(7.6)
Total 39
(37.1) 17
(16.2) 16
(15.2) 33
(31.4) 105
(100) Source: NREGA in Kerala - HH Survey
Figures in the parenthesis represent column percentage
Housing
A vast majority of the sample households (90.3%) have house of their
own. Around seven percent of them live in rented houses. The respondents
who live in rented houses are found to be more in Idukki and Wayanad. Six
households live in estate quarters at free of cost; all of them were in Idukki

44
district. District-wise analysis shows that Alapuzha has the maximum number
of households (96.3%) having own house followed by Palakkad (91.4%) (See
Table 4.4).
Table 4.4 Housing details of the Sample Households
Districts Ownership of the house
Palakkad Idduki Wayanad
Alapuzha
Total
Own 128
(91.4) 136
(85.0) 142
(88.8) 154
(96.3) 560
(90.3)
Rented 5
(3.6) 17
(10.6) 17
(10.6) 4
(2.5) 43
(6.9)
Living with parents
3 (2.1)
1 (0.6)
1 (0.6)
1 (0.6)
6 (1.0)
Staying with relatives
4 (2.9)
- - 1
(0.6) 5
(0.8)
Free Estate Quarters
- 6
(3.8) - -
6 (1.0)
Total 140
(100) 160
(100) 160
(100) 160
(100) 620
(100)
Source: NREGA in Kerala - HH Survey
Figures in the parenthesis represent column percentage
The type of house in which the respondents live indicates that majority
of them live in asbestos/tiled/tin roof houses (72.7%). Around 10 per cent of
them live in houses constructed under the Indira Awas Yojana. 8.5 per cent of
them live in huts. Respondents living in concrete houses were found to be
more in Idukki (15.6%) followed by Wayanad. More number of respondents in
Palakkad were found to have availed IAY when compared to respondents in
other districts. (See Figure 4.3)
Figure 4.3: Details on Housing Type of sample households
Palakka
d
Idduki
Waya
nad
Alapuzha
Tota
l
8.6
15
68.6
7.9
9.4
9.4
65.6
15.6
9.4
2.5
75.6
12.5
6.9
11.9
80.6
0.6
8.5
9.5
72.7
9.2
0
20
40
60
80
100
120
Percent
Distric ts
C oncrete
As bes tos /Tiled/Tin roof
IAY
Hut

45
Majority of the households (82.1%) have electricity connection. Among
the districts, Alapuzha has the maximum number of houses (91.3%) with
electricity connection followed by Palakkad (86.4%). The percentage of
households without electricity was found to be high in Idukki district (26.9%).
Figure 4.4: Electricity Connection in Sample Households
82.173.1
86.491.3
78.1
13.617.9
8.821.9
26.9
0
10
20
30
40
50
60
70
80
90
100
P alakkad Idduki Wayanad Alapuz ha Total
Dis tric ts
Pe
rc
en
t
Y es
No
Source of Drinking Water
The distribution of households based on the source of drinking water
shows that majority of the households have access to protected drinking
water sources (See Table 4.4). Around 83 per cent of the households have
safe sources of drinking water such as water tap within household premises
(24.2%), public stand post (28.9%) and open well (27.1%). Rest of the
households depend on unprotected water sources such as river, stream and
water falls. District-wise distribution of households shows that three sources of
drinking water viz, water tap within the household premises, public taps and
open wells constitute the main sources of drinking water in all the four
districts. In Alapuzha, 23.8 per cent of the households depend on rivers while
in Idukki 17 per cent of the population depends on unprotected sources of
drinking water. In Palakkad, however, 90 per cent have access to protected
sources of drinking water followed by Wayanad with 84.5 per cent.

46
Table 4.5: Source of Drinking Water for the sample households
Districts Source of drinking water
Palakkad Idduki Wayanad
Alapuzha
Total
Water tap in the HH premises
18 (12.9)
68 (42.5)
50 (31.3)
14 (8.1)
150 (24.2)
Public stand post 84
(60.0) 21
(13.1) 11
(6.9) 63
(39.4) 179
(28.9)
Hand pump 4
(2.9) 2
(1.3) 4
(2.5) 5
(3.1) 15
(2.5)
Open well 20
(14.3) 42
(26.3) 70
(43.8) 36
(22.5) 168
(27.1)
Pond 1
(0.7) 1
(0.6) 17
(10.6) 2
(1.3) 21
(3.5)
River 7
(5.0) 2
(1.3) -
38 (23.8)
47 (7.6)
Stream water 6
(4.3) 4
(2.5) 5
(3.1) 2
(1.3) 17
(2.7)
Falls - 14
(8.8) 2
(1.3) -
16 (2.6)
Direct pipe connection from falls
- 6
(3.8) 1
(0.6) -
7 (1.1)
Total 140
(100) 160
(100) 160
(100) 160
(100) 160
(100)
Source: NREGA in Kerala - HH Survey
Figures in the parenthesis represent column percentage
Households with latrine facilities
Majority of the households (83.2%) have latrine facilities in their
houses. A small number of households (1.8%) depend on community latrines.
Among the four selected districts, Wayanad has the maximum number of
households (95%) with latrine facilities.
Figure 4.5: Households with latrine facilities
72.9 73.1
94.4 91.383.2
26.421.9
5.6 7.51.50.7
50 1.3 1.8
0
20
40
60
80
100
Palakkad Idduki Wayanad Alapuzha Total
Districts
perc
en
t
Households with Toilet Households without Toilet Using Community Latrine

47
Main Occupation of the Sample Population
The working population constitutes 64 per cent of the total population.
The distribution of the population based on their main occupation reveals that
31.18 per cent of the working population is agriculture labourers. Farmers
constitute 11.41 per cent of the working population. Skilled labourers
constitute 6.19 per cent while unskilled labourers account for 13.26 per cent.
Quite an interesting observation is that NREGS has emerged as the main
occupation to a sizeable section of the working population (16.49%). It is quite
high in Wayanad district with 28.81 per cent of respondents responding
NREGS as the main occupation. In other districts, it hovers around 12 to 13
per cent. Farming as main occupation was high in Idukki district (23.56%)
while it was low (2.04%) in Alapuzha district. ( See Table 4.6)
Table 4.6 Main Occupation of the Sample Population
Districts Main Occupation
Palakkad Idduki Wayanad Alapuzha Total
House wife 8
(2.5) 53
(14.5) 54
(15.3) 77
(19.6) 192
(13.4)
Retired/ Old age 10
(3.1) 6
(1.7) 7
(1.1) 11
(2.8) 34
(2.4)
Farmer/Tiller 33
(10.6) 86
(23.7) 37
(10.5) 8
(2.0) 164
(11.4)
Agriculture labour 137
(42.2) 74
(20.3) 111
(31.4) 126
(32.1) 448
(31.2)
Skilled labour 27
(8.3) 15
(4.1) 15
(4.2) 32
(8.1) 89
(6.2)
Unskilled labour 38
(11.7) 55
(15.1) 10
(2.1) 66
(16.8) 169
(11.8)
Traditional artisan 2
(0.6) - - 1
(0.3) 3
(0.2)
Services 3
(0.1) 2
(0.6) 2
(0.6) 6
(1.5) 13
(0.9)
Petty shop 20
(6.2) 1
(0.3) - 1
(0.3) 22
(1.5)
Business 1
(0.3) - - -
1 (0.1)
Government 1
(0.3) 3
(0.8) 2
(0.5) 1
(0.2) 7
(0.4)
Private shop 5
(1.5) 25
(6.8) 14
(3.9) 14
(3.5) 58
(4.0)
NREGS 40
(12.3) 45
(12.3) 102
(28.8) 50
(12.7) 237
(16.5)
Total 325
(100) 365
(100) 354
(100) 393
(100) 1437 (100)
Source: NREGA in Kerala - HH Survey
Figures in the parenthesis represent column percentage

48
Subsidiary Occupation
Of the total working population of 1437 from the sample villages 899
have subsidiary occupation. NREGS has emerged as an important subsidiary
occupation for two-third of the working population. District-wise analysis
shows that NREGS is a very significant subsidiary occupation for 75 per cent
of the working population in Alapuzha, followed by Wayanad with 70 per cent.
Some of the other subsidiary occupations of the population include agriculture
labour (8.68%), farming (4.12%) and skilled labour (3.89%) (See Table 4.7).
An important inference that can be drawn from the analysis is that NREGS
has emerged as an important source of livelihood for the rural households.
Table 4.7: Subsidiary Occupation of the Sample Population
Districts
Subsidiary Occupation
Palakkad Idduki Wayanad Alapuzha Total
House wife
- 2
(0.7) 1
(0.6) 14
(6.1) 17
(1.9)
Retired/ Old age 4
(1.8)
-
3 (1.9)
6 (2.6)
13 (1.5)
Farmer/Tiller 1
(0.5) 24
(8.1) 12
(7.5) -
37 (4.1)
Agriculture labour 24
(11.1) 13
(4.4) 23
(14.4) 18
(7.9) 78
(8.7)
Skilled labour 11
(5.1) 15
(5.1) 2
(1.3) 7
(3.1) 35
(3.9)
Unskilled labour 8
(3.7) 68
(23.2) 3
(1.9) 10
(4.4) 89
(9.9)
Services - - 3
(19) 1
(0.4) 4
(0.4)
Petty shop 35
(16.1) - - -
35 (3.9)
Vendor - - - 2
(0.9) 2
(0.2)
Business - - 1
(0.6) -
1 (0.1)
Private shop 1
(0.5) 2
(0.7) 1
(0.6) -
4 (0.4)
NREGS 133
(61.3) 169
(57.7) 111
(69.4) 171
(74.7) 584
(64.1)
Total 217
(100) 293
(100) 160
(100) 229
(100) 899
(100)
Source: NREGA in Kerala - HH Survey
Figures in the parenthesis represent column percentage

49
Livestock Owned
Out of the total 620 sample households, only 237 (38.23%) possess
some kind of livestock. Among them, 37.13 per cent have cows and 29.54 per
cent possess goats. Owning of livestock is found to be more in Alapuzha,
where 73 households own one or more livestock followed by Palakkad with 59
households. The human-animal population ratio is very low with 1:0.1.
Table 4.8: Livestock Owned by Sample Households
Districts Details
Palakkad Idduki Wayanad Alapuzha Total
He buffaloes - - 1
(1.75 ) -
1 (0.42)
Cows 21
(35.5) 20
(41.7) 40
(70.1) 7
(9.6) 88 (37.1)
Bullock 2
(3.4) 1
(2.1) -
-
3 (1.3)
Goat 18
(30.5) 18
(37.5) 10
(17.5) 2
(27.4) 66
(27.9)
Sheep - - - 4
(5.5) 4
(1.7)
Pig - 2
(4.2 ) - - 2 (0.8)
Poultry 17
(28.8) 5
(10.4) 6
(10.5) 42
(57.5) 70
(29.5)
donkey 1
(1.7) - - -
1 (0.4 )
Rabbit - 2
(4.2 ) -
-
2 (0.8 )
Total 59
(100 ) 48
(100) 57
(100) 73
(100) 237
(100)
Source: NREGA in Kerala - HH Survey
Figures in the parenthesis represent column percentage
Household Assets
Owning household assets is an indicator of improved income and a
symbol of wellbeing. Around 19 per cent of households do not own any
household assets. Number of households without any household assets is
high in Idukki district with 27.50 per cent followed by Wayanad with 20 per
cent.
Respondents having household assets indicate that more than 50
percent them possess cell phone and television. Around one-third of them
have LPG connection. District-wise analysis shows that the respondents
possessing cell phone and LPG are more in Wayanad with 60.63 per cent and
41.88 per cent respectively. With regard to possession of television,

50
respondents in Alapuzha stand first with 60.63 per cent. The respondents in
Palakkad and Alapuzha are found to have possessed more items of
household assets when compared to other two districts.
Table 4.9 Household Assets of the Sample Respondents
Districts Details
Palakkad Idduki Wayanad Alapuzha Total
Nil 26 (18.6)
44 (27.5)
32 (20.0)
15 (9.4)
117 (18.9)
Grinder 59 (42.1)
9 (5.6)
8 (5.0)
13 (8.1)
89 (14.4)
LPG connection 21 (15.0)
33 (20.6)
75 (46.9)
64 (40.0)
193 (31.1)
Television 81 (57.9)
78 (48.8)
75 (46.9)
97 (60.6)
331 (53.4)
Fans 54 (38.6)
3 (1.9)
11 (6.9)
129 (80.6)
197 (31.8)
Cell phone 77 (55.0)
82 (51.3)
97 (60.6)
80 (50.0)
336 (54.2)
Cycle 17 (12.1)
- 1
(0.6) 16
(10.0) 34
(5.5)
Two wheeler 20 (14.3)
- 6
(3.8) 5
(3.1) 31
(5.0)
Three wheeler 3 (2.1)
1 (0.6)
- 2
(1.3) 6
(0.1)
Solar home lighting system
2 (1.4)
0
3 ( 1.9)
- 5
( 0.8)
Other assets -
- 4
(2.5) 2
(1.3) 6
(0.1) Total 140 160 160 160 620
Source: NREGA in Kerala - HH Survey
Figures in the parenthesis represent column percentage
Households Annual Income
The details on annual income of the respondents indicate that more
than one-third of the respondents still live below poverty line (less than Rs.
24,000/). The percentage of people having less than Rs.24,000/- per annum
was found to be high in Alapuzha (48.7%) followed by Palakkad (36.5%),
Idukki (31.3%) and Wayanad (26.3%). Around 24 per cent of the households
have an annual income of more than Rs.48,000/-. District-wise analysis
shows more or less similar pattern.

51
13.6 16.97.5
28.116.6
22.9 19.418.8
20.6
20.3
26.4 2528.1
19.424.7
17.1 12.5 18.810 14.5
20 26.3 26.9 21.9 23.9
P alakkad Idduki Wayanad Alapuz ha Total
Distric ts
Pe
rc
en
t > 48000
36000-48000
24000-36000
12000-24000
< 12000
Figure 4.6: Annual Income of the Sample Households
Expenditure Pattern
The data on expenditure pattern of households reveals that around 46
per cent was spent on food. The other major items of expenditure are
education (9%), medical (7.63%), clothing (7.12%), transport (7.01%) and
redemption of prior debts (5.5%). District-wise analysis shows that
households in Alapuzha were found to have spent more on food (51.6%).
Table 4.10: Annual Expenditure (in percentage)
Districts Expenditure
Palakkad Idduki Wayanad Alapuzha Total
Food 42.1 45.5 46.1 51.6 46.5
Fuel and electricity 4.2 2.6 2.7 6.6 4.0
Education 8.0 10.7 8.7 8.5 9.0
Tobacco, alcohol, gambling 4.4 1.4 1.4 0.8 1.9
Entertainment 2.5 1.1 2.0 2.0 1.9
Cosmetic 3.8 4.7 4.6 2.6 3.9
Clothing 6.3 7.5 8.5 6.1 7.1
Medicals 6.9 9.0 7.2 7.4 7.6
Transport 8.2 6.6 7.0 6.4 7.0
Festivals, religious ceremonies 4.5 3.9 4.7 2.6 3.9
House maintenance 2.4 1.7 1.5 1.1 1.6
Interest on loans, debts 7.0 5.2 5.6 4.4 5.5 Total 100.0 100.0 100.0 100.0 100.0
Source: NREGA in Kerala - HH Survey
Figures in the parenthesis represent column percentage

52
35.6
64.3
33.1
66.8
38.6
61.3
36.7
63.2
0
10
20
30
40
50
60
70
P ercent
P alakkad W ayanad Alapuz ha Total
Distric ts
Y es
No
SHG Membership
Self Help Group movement was successful in all the southern states
including Kerala. Both Government as well as Non Governmental
Organizations have promoted this community based women’s organizations in
the state. SHGs are predominantly a women organization. Men SHGs are yet
to emerge. Kudumbashri in Kerala promotes the SHGs of women. Of the total
sample population, 70.98 per cent are eligible to become members of SHG.
Of this, two-third of them is members of SHG. On an average, each
household has a membership in SHG. In Alapuzha, Idukki and Palakkad
certain households have more than one member in SHGs
Figure 4. 7: SHG Membership of women from sample households
Borrowing
Of the total sample population, 400 have taken loan from various
sources. The distribution of household shows that, majority (36.25%) have
taken loan from SHGs, followed by those from Co-operative banks (28.25%).
Around two-third of the respondents are reported to have borrowed during the
last year. A considerable number of respondents have gone in for second
loan. There are a very few respondents, who have gone in for third and fourth
loan. In the case of first Loan, the major source of borrowing for the
respondents is SHG (36.8%) followed by Co-operative banks and Commercial

53
banks (24.10%). The institutional sources including SHGs are found to be
major source of borrowing for 90 per cent of the borrowers. Non-institutional
sources such as moneylenders and relatives constitute around 3 per cent.
(See Figure 4.7)
The households were found to have borrowed for a variety of
purposes. Construction and repairing of house was the major purpose
(20.76%) followed by education (17.84%), medical (10.53%) and agriculture
(10.23 %). A sizable percentage of households borrowed money for purchase
of household assets (7.06 per cent), purchase of livestock (5.56%) and
purchase of food grain (4.09%). A few households borrowed to purchase land
and to redeem the prior debt. Around 10 per cent of the households borrowed
to meet expenses related to ceremonies and festivals. (See Table 4.11)
The extent of loan borrowed shows that around 46 per cent of the
households borrowed less than Rs.10,000/-. 22 per cent of the households
borrowed between Rs.10,000- Rs.20,000. A sizable percentage of
households (8.5%) borrowed more than Rs.50,000/-. The average loan
borrowed was Rs.28,913/-. (See Table 4.12)
The interest rate as reported by majority of the respondents (82.59%)
was less than 12 per cent, followed by 13-24 per cent (14.51%). The mean
rate of interest is around 13 per cent indicating that the households have been
able to borrow at a reasonable rate, as the major source of borrowing is
institutional agencies including the SHGs. (See Table 4.13)
The repayment of loan raised is found to be satisfactory as majority of
the respondents, who have borrowed started repaying the loan. Around one-
fourth of the loan raised by the households has been repaid. (See Table 4.14)

54
0
10
20
30
40
50
60
Pe
rc
en
t
Pala
kkad
Idduki
Waya
nad
Ala
puzha
Total
Distric ts
C ommerc ial B anks
C o-Operative B anks
S HG
Money lenders
R elatives
Ins uranc e C ompanies
P rivate B anks
Hous ing board
Figure 4.7: Source of Borrowing of the sample households
Table 4.11: Purpose of Borrowing of the sample population
Districts Purpose
Palakkad Idduki Wayanad Alapuzha Total
Enterprise 2
(2.4) 15
(18.8) 3
(3.1) 2
(2.4) 22
(6.4)
Agriculture 2
(2.4) 6
(7.5) 20
(20.8) 7
(8.5) 35
(10.2)
Purchase of land 5
(5.95) 1
1.3) 1
(1.0) 4
(4.8) 11
(3.2)
Purchase of household assets
8 (9.5)
5 (6.3)
6 (6.3)
4 (4.8)
23 (6.7)
Purchase of food grains
1 (1.2)
3 (3.8)
5 (5.2)
5 (6.1)
14 (4.1)
Purchase of animals 6
(7.1) 4
(5.0) 5
(5.2) 4
(4.8) 19
(5.6)
Construction of house 26
(30.9) 7
(8.8) 13
(13.5) 13
(15.8) 59
(17.2)
Repairing of house 1
(1.2) 1
(1.3) 4
(4.1) 6
(7.3) 12
(3.5)
Education 8
(9.5) 12
(15.0) 20
(20.9) 21
(25.6) 61
(17.8)
Medical treatment 8
(9.5) 15
(18.8) 7
(7.3) 6
(6.3) 36
(10.5)
Repayment of old loan 4
(4.8) 2
(2.5) 4
(4.1) 2
(2.4) 12
(3.5)
Social & Religious ceremony
37 (4.4)
7 (0.9)
1 (0.1)
- 45 (13.2)
Total 84 (100)
80 (100)
96 (100)
82 (100)
342 (100)
Source: NREGA in Kerala - HH Survey
Figures in the parenthesis represent column percentage
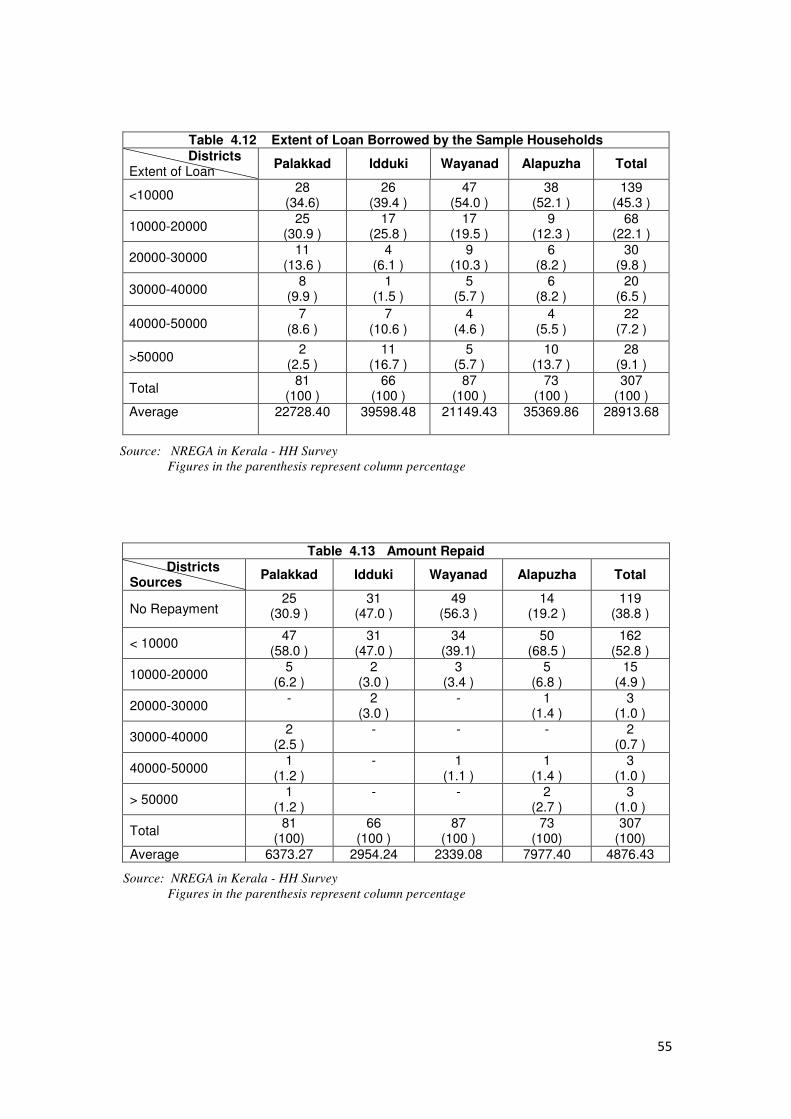
55
Table 4.12 Extent of Loan Borrowed by the Sample Households
Districts Extent of Loan
Palakkad Idduki Wayanad Alapuzha Total
<10000 28
(34.6) 26
(39.4 ) 47
(54.0 ) 38
(52.1 ) 139
(45.3 )
10000-20000 25
(30.9 ) 17
(25.8 ) 17
(19.5 ) 9
(12.3 ) 68
(22.1 )
20000-30000 11
(13.6 ) 4
(6.1 ) 9
(10.3 ) 6
(8.2 ) 30
(9.8 )
30000-40000 8
(9.9 ) 1
(1.5 ) 5
(5.7 ) 6
(8.2 ) 20
(6.5 )
40000-50000 7
(8.6 ) 7
(10.6 ) 4
(4.6 ) 4
(5.5 ) 22
(7.2 )
>50000 2
(2.5 ) 11
(16.7 ) 5
(5.7 ) 10
(13.7 ) 28
(9.1 )
Total 81
(100 ) 66
(100 ) 87
(100 ) 73
(100 ) 307
(100 )
Average
22728.40 39598.48 21149.43 35369.86 28913.68
Source: NREGA in Kerala - HH Survey
Figures in the parenthesis represent column percentage
Table 4.13 Amount Repaid
Districts Sources
Palakkad Idduki Wayanad Alapuzha Total
No Repayment 25
(30.9 ) 31
(47.0 ) 49
(56.3 ) 14
(19.2 ) 119
(38.8 )
< 10000 47
(58.0 ) 31
(47.0 ) 34
(39.1) 50
(68.5 ) 162
(52.8 )
10000-20000 5
(6.2 ) 2
(3.0 ) 3
(3.4 ) 5
(6.8 ) 15
(4.9 )
20000-30000 - 2
(3.0 ) - 1
(1.4 ) 3
(1.0 )
30000-40000 2
(2.5 ) - - - 2
(0.7 )
40000-50000 1
(1.2 ) -
1 (1.1 )
1 (1.4 )
3 (1.0 )
> 50000 1
(1.2 ) - - 2
(2.7 ) 3
(1.0 )
Total 81
(100) 66
(100 ) 87
(100 ) 73
(100) 307
(100)
Average 6373.27 2954.24 2339.08 7977.40 4876.43
Source: NREGA in Kerala - HH Survey
Figures in the parenthesis represent column percentage

56
Table 4.14 Interest Rate
Districts Interest Rate
Palakkad Idduki Wayanad Alapuzha
Total
No interest - - 1
(1.1) -
1 (0.3)
<12 57
(70.4) 60
(90.9) 85
(97.7) 39
(53.4) 241
(78.5)
13-24 22
(27.2) 3
(4.5) 1
(1.1) 33
(45.2) 59
(19.2)
25-36 1
(1.2) 1
(1.5) -
1 (1.4)
3 (1.0)
37-48 1
(1.2) 1
(1.5) - -
2 (0.7)
>49 - 1
(1.5) - -
1 (0.3)
Total 81
(100) 66
(100) 87
(100) 73
(100) 307 100)
Average Interest rate
13.58 12.13 10.21 15.52 12.78
Source: NREGA in Kerala - HH Survey
Figures in the parenthesis represent column percentage
Migration
Around 13 per cent of the 620 respondents reported incidence of
migration in their families (See Table 4.15).The incidence of migration was
high (20%) in Palakkad when compared to other districts. The number of
persons migrated from the households indicates that, only one has migrated
in majority of the households (87.5%) (See Table 4.16). The duration of
migration in majority of the families was more than six months. Persons
migrating for more than six months were quite high (82.35%) in Alapuzha
district, followed by Idukki with 69.56 per cent (See Figure 4.8). Places where
people migrate shows that 40 per cent migrate to other states; 20 per cent
within the district. People migrating to other states are high in Alapuzha
(82.4%) (See Table 4.18)
The main reasons for migration as reported by the respondents are:
i) seeking employment during lean season (40 %); ii) education of children
(32.5% ) and; iii) better wages (22.5%). (See Table 4.17)

57
Table 4.15: Migration of Sample Household
Number of Respondents Districts Response
Palakkad Idduki Wayanad Alapuzha Total
Yes
28 (20.0)
23 (14.4)
12 (7.5)
17 (10.6)
80 (12.9)
No
112 (80.0)
137 (85.6)
148 (92.5)
143 (89.4)
540 (87.1)
Total 140
(100) 160
(100) 160
(100) 160
(100) 620
(100)
Source: NREGA in Kerala - HH Survey
Figures in the parenthesis represent column percentage
Table 4.16 Number of Persons Migrated from the HH
Number of Respondents Districts No. of Persons Palakkad Idduki Wayanad Alapuzha Total
One
26 (92.9)
20 (87.0)
11 (91.7)
13 (76.5)
70 (87.5)
Two
1 (3.6)
2 (8.7)
- 3
(17.6) 6
(7.5)
Above Two 1
(3.6) 1
(4.3) 1
(8.3) 1
(5.9) 4
(5.2)
Total 28
(100) 23
(100) 12
(100) 17
(100) 80
(100)
Average 1.11 1.22 1.25 1.35 1.21
Source: NREGA in Kerala - HH Survey
Figures in the parenthesis represent column percentage
Table 4.17 Reasons for migration
Districts Reasons
Palakkad Idduki Wayanad Alapuzha Total
Seeking employment in lean season
21 (75.0)
7 (30.4)
2 (16.70)
2 (11.8)
32 (40.0)
Better earning - 8
(34.8) 3
(25.0) 7
(41.2) 18
(22.5)
Children education 5
(17.9) 8
(34.8) 7
(58.3) 6
(35.3) 26
(32.5)
Better amenities 2
(7.2) - -
2 (11.80)
4 (5.0)
Total 28
(100) 23
(100) 12
(100) 17
(100) 80
(100)
Source: NREGA in Kerala - HH Survey
Figures in the parenthesis represent column percentage

58
Figure 4.8 Duration of Migration
32.1
32.1
17.917.9
4.3
21.7
4.3
69.56
25
8.3
56.6
11.8
5.9
82.35
16.3
21.3
8.8
53.75
0
10
20
30
40
50
60
70
80
90
P erc ent
P alakkad Idduki W ayanad Alapuz ha Total
Distric ts
< 2 Months
2-4 Months
4-6 Months
A bove 6 Months
Table 4.18 Place of Migration
Districts Place migrated
Palakkad Idduki Wayanad Alapuzha
Total
Within in the District
10 (35.7)
5 (21.7)
4 (33.3)
1 (5.9)
20 (25.0)
Within the state
11 (39.4)
11 (47.8)
4 (33.3)
2 (1.8)
28 (35.0)
Outside the State
7 (25.0)
7 (30.4)
4 (33.3)
14 (82.4)
32 (40.0)
Total 28
(100) 23
(100) 12
(100) 17
(100) 80
(100) Source: NREGA in Kerala - HH Survey
Figures in the parenthesis represent column percentage
Social Participation as a Member in CBOS and CSI
Participation in community based organizations and civil society
institutions help build social capital among the members of the community.
The distribution of respondents based on their social participation shows that
almost all are members in one or the other local social organizations. Out of
the 620 respondents, 96.3 per cent used to attend Grama sabha meeting. 80
per cent of the respondents are members in caste based associations while
60.2 per cent are SHG members. Around 10 per cent are members in local
co-operatives, SHG federations and / or other CBOs. Thus it can be
concluded that the respondents are actively participating in local social
forums.

59
Table 4.19: Social Participation as a Member in CBOs and CSIs
Districts Social Participation CBOs and CSIs
Palakkad Idukki Wayanad Alapuzha Total
Gramasabha 124
(88.6 ) 154
(96.3) 159
(99.4) 160
(100.0) 597
(96.3)
Caste Association 16
(11.4) 43
(26.9) 10
(6.3) 59
( 36.9) 128
(80.0)
Youth Association 1
(0.7) -
5 (3.1)
5 (3.1)
11 (6.7)
Local Co-operatives 4
(2.7) 58
(36.3) 2
(1.3) 2
(1.3) 66
(10.7.)
NGOs 3
(2.1) 3
(1.9) 6
(3.8) 13
(8.1) 25
(4.0)
SHGs 74
(52.9) 117
(73.1) 89
(55.6) 93
(58.1) 373
(60.2)
SHG Federations 24
(17.1 ) 7
(4.3) 10
(6.2) 24
(15.0) 65
(10.5)
*Others CBOs 28
(20.00) 15
(9.38) 9
(5.62) 14
(8.75) 66
(10.65)
**Others 1
(0.71) -
2 ( 1.25 )
- 3
(0.48)
Total 140
160
160
160
620
Source: NREGA in Kerala - HH Survey
Figures in the parenthesis represent column percentage
* Temple Committee fisherman, Merchant Association, Welfare Association, construction
workers union,* Political Party Kerala State Tailoring Association National Social Service
Conclusion
An analysis of the socio-economic profile of the respondents and the
members of their families reveal that the beneficiaries of NREGA are from
different sections of the households. The marginalized sections of the
community have participated in the scheme. 4.5 per cent of the population are
disabled. A vast majority of the population (64%) are in productive age group.
The literacy rate is 91.78. However, inter-district variation could be noticed.
The housing conditions of the households are fairly good with 91.5 per cent of
the respondent living in tiled or concrete houses. 82 per cent of the
households have electricity connection. Around 80 per cent of the households
have access to protected drinking water sources with minor inter-district
variations. Regarding occupation pattern, NREGS has been emerging as
main occupation for 16.49 percent and as subsidiary occupation for two-third

60
of the population. The households do not possess much livestock. The
human-animal population ratio is very low with 1:0.1.
Around 19 per cent of the households do not own any household
assets. More than 50 per cent of the households own cell phone and
television. Around one-third of the households have LPG connection. Little
more than two-third of the households have an annual income of less than
Rs.24,000/-. The main sources of borrowing are SHGs, formal financial
institutions like commercial banks and co-operatives. The important purposes
of borrowing include construction and repairing of house, education, medical,
agriculture, purchase of household assets, redemption of prior debts and
social ceremonies. Around 45 per cent of the households have borrowed less
than Rs.10,000/- ; the mean borrowing being Rs.28,912/-. The repayment is
found to be good. The rate of interest on loan is normal and hovers around 13
per cent. The incidence of migration could be noticed in all the districts. It was
high in Palakkad. The main reasons for migration are seeking employment
during lean season, education of children and better wages. To sum up, the
beneficiaries of NREGS are from poor to moderate socio-economic
background and the NREGS has been emerging as the major source of
livelihood for BPL households in these districts.
* * * * *

Chapter - 5
Performance of NREGS in Kerala
Introduction
Kerala State is a pioneer in strengthening local governments in the
post constitutional amendment phase. It has more than a decade of
experience in local level planning and development. This has provided a
unique position to the state to take over full responsibility for implementation
of a right-based pro-poor programme of NREGA. The Government has
consciously decided to internalize the operationalisation of NREGA into
Panchayati Raj System.
The salient features of the approach are: i) implementation of NREGA
through Grama Panchayats; ii) communicating the distinctive features of the
scheme to the various stakeholders, especially to panchayat leaders; iii)
involvement of Kudumbasree network of poor women in a big way; iv) focus
on total resource management in forest areas, river basins and watershed
areas as the state has very little public land; v) designing processes and
programmes to see that NREGS fits into the administrative operating system
now existing in Panchayats; vi) institution of consistent and coherent
information and accountability systems and participatory processes to ensure
transparency; and vii) aiming of zero corruption in implementing NREGA
(S.M.Vijayanand 2009).
These features need to be kept in view while analyzing the
performance of NREGS in Kerala. This chapter makes an attempt to assess
the performance of NREGS based on the indepth study conducted among
620 respondents spread over 31 panchayats in eight blocks of four districts.
The inferences drawn from the survey were supplemented and complemented
by the qualitative data gathered through a series of focus group discussions
that we had in all selected 31 panchayats among the key stakeholders of the
project.

62
NREGS in Kerala
The scheme known as Kerala Rural Employment Guarantee Scheme
(KREGS) created under NREGA has been implemented in Palakkad and
Wayanad districts of Kerala in February 2006. Subsequently, it has been
implemented in all the remaining 12 districts.
An assessment of the progress of the NREGS in Kerala shows that
number of households registered under the scheme has increased from 3.27
lakhs in 2006-2007 to 23.30 lakhs in 2009-10. The percentage of households
provided employment under the scheme has shot up from 11.30 to 43.34 –
recording four fold increase over a period of four years. The total person days
employed witnessed a fourteen fold increase from 11.30 lakhs in 2006-07 to
155.87 lakhs in 2008-09. An interesting feature of NREGS in Kerala is the
participation of women. Of the total person days of employment, more than
80 per cent was constituted by women person days indicating very high
participation of women in the scheme. Person days of households employed
for 100 days, though found to be low has recorded a steady increase over a
period of time. The progress of NREGS in Palakkad and Wayanad, where the
scheme was introduced in 2005-06 in terms of households registered,
households provided employment, participation of SC, ST and woman were
found to be good. The scheme is picking up in Idukki and Alapuzha (See
table 5.1)
Start up Activities
This is the first ever massive scheme guaranteeing 100 days of
employment in a year. The responsibility of implementing the scheme has
been given to local panchayats. There is no room for machinery. Contractors
have no place in the scheme. It is a people-centered scheme. Hence,
meticulous planning and preparation of people are quite essential to see that
the scheme takes off smoothly. The Government has initiated various
measures to generate awareness about the essential features of the act
among the various stakeholders and to provide regular support and help to
the Grama Panchayats to implement the scheme in letter and spirit.

63
Table 5.1: Performance of NREGS at State level and selected sample Districts of Kerala
Levels Particulars 2006-07 Phase I
2007-08 Phase II
2008-09 Phase III
2009-10 Phase III
Households Registered 327132 579617 2330566 2330566
Percentage of Households provided employment
3.46 12.90 27.42 43.34
Total Person days (in Lakhs) 11.30 18.58 155.87 102.84
Percentage of SCs persondays
21.85 11.18 16.63 16.0
Percentage of STs persondays 3.40 20.86 8.82 9.96
Percentage of Women person days
80.30 70.26 85.92 86.23
State
Percentage of Households employed for 100 days
0.008 1.27 1.76 0.20
Households Registered 202916 208735 221733 221733
Percentage of Households provided employment
4.80 12.06 44.50 35.89
Total Person days (in Lakhs) 0.19 14.13 25.98 18.42
Percentage of SCs persondays
24.53 27.77 23.75 23.40
Percentage of STs persondays 82 2.24 5.54 5.56
Percentage of Women person days
83.08 87.98 89.56 92.41
Palakkad
Percentage of Households employed for 100 days
0.01 0.06 3.69
0.02
Households Registered 124216 125960 129831 129831
Percentage of Households provided employment
1.27 32.41 43.40 39.27
Total Person days (in Lakhs) 18769 1413301 2598104 1842820
Percentage of SCs persondays
6.04 7.03 6.78 6.42
Percentage of STs persondays 18.65 26.14 26.19 29.14
Percentage of Women person days
63.88 66.13 77.19 78.79
Wayanad
Percentage of Households employed for 100 days
-
2.29 6.59 0.33
Households Registered - 149255 184900 184900
Percentage of Households provided employment
- 5.86 27.02 31.03
Total Person days (in Lakhs) - 1.00 15.27 15.62
Percentage of SCs persondays
- 12.66 12.76 10.03
Percentage of STs persondays - 9.32 9.74 10.28
Percentage of Women person days
- 67.48 74.20 72.14
Idukki
Percentage of Households employed for 100 days
- - 2.49 0.21
Households Registered - - 219282 219282
Percentage of Households provided employment
- - 17.13 14.36
Total Person days (in Lakhs) - - 5.31 4.62
Percentage of SCs persondays
- - 18.82 18.98
Percentage of STs persondays - - 0.37 0.43
Percentage of Women person days
- - 89.71 91.84
Alapuzha
Percentage of Households employed for 100 days
- - 0.10 0.0004
Source: www.nrega.nic.in

64
The various start-up activities taken up to generate awareness and to
motivate the rural households to actively participate in the scheme include the
following:
o The District Poverty Alleviation Unit has been given the
responsibility of implementing the scheme. The DPAUs in
collaboration with KILA and SIRD organized a series of training
programmes on the essential features of NREGA and the mode of
implementation to all the Block level and Panchayat level
functionaries.
o Kudumbasree has been assigned a key role in different phases of
implementation of the scheme. Kudumbasree has three-tier
structure viz., Neighborhood Group, Area Development Society
(ADS), Community Development Society (CDS). The office bearers
of ADS and CDS were trained on the scheme by the block level
functionaries.
o The panchayat functionaries along with the trained office bearers of
ADS and CDS generate awareness among the rural households.
The process followed by them is as follows:
- Organising meeting among the various Kudumbasree units and
explaining the essential features of the scheme.
- Organising meeting in public places within the panchayat to
make the people aware of the scheme.
- Organising ward level meetings under the leadership of
respective ward members.
- Organising special meetings in SC/ST colonies to ensure that all
SC/ST households get registered under the scheme.
- Conducting exclusive Grama sabha meetings to create
awareness about the scheme and to discuss the issues related
to the functioning of the scheme.
- Displaying banners, boards and posters and distributing
handbills to the households to ensure that the scheme is known
to everybody.

65
- Making announcements about the scheme in every street
through public address system.
- Involving various CBOs such as youth clubs, farmers’
associations and co-operatives in promoting awareness
(Alapuzha District).
- Arranging exposure visits to generate awareness on best
practices.
The process has been meticulously followed throughout the state.
Awareness on the Scheme
Sources: Participation of the rural households in the scheme primarily
depends on the awareness about the scheme. The Government has
employed various methods and different agencies to generate awareness
about the scheme. The efforts initiated by the government have yielded the
desired results. The analysis on the sources through which the households
come to be aware of the scheme indicates that the Panchayat played a key
role in creating awareness about the scheme followed by SHGs. Media like
newspapers, radio, television were also found to have played a significant role
in generating awareness about the scheme.
District-wise analysis of the sources of awareness shows that the role
of SHGs, media, friends, relatives and neighbors was found to be minimal in
Palakkad District when compared to other districts (See Table 5.2).
Table 5.2: Awareness about NREGS: Sources
Districts Sources
Palakkad N= 140
Idukki N=160
Wayanad N=160
Alapuzha N=160
Total N=620
Panchayat 123
( 87.9) 155
(96.9) 131
(81.9) 145
(90.6) 554
(89.4 )
SHG 30
( 21.4) 98
(61.3) 92
(57.5) 114
(71.3) 334
(53.9)
Friends/Relatives/Neighbors 24
(17.1) 55
(34.4) 74
(46.3) 49
(30.6 202
(32.6)
News papers 12
(8.6) 23
(14.4) 87
(54.4) 66
(41.3) 188
(30.3)
Radio 3
(2.1 ) 11
(6.9 ) 55
(34.4) 35
(21.9) 104
(16.8)
Television 6
(4.3 ) 13
(8.1) 46
(28.8) 40
(25.0) 105
(16.9)
Government Officials 1
(0.7) 1
(0.6 ) 5
(3.1) 11
(6.9) 18
(2.9)
NGO Representative - 2
(1.2 ) 3
(1.9) 12
(7.5) 17
(2.7)
Source: NREGA in Kerala - HH Survey
Figures in the parenthesis represent percentage to Number of Respondents

66
Level of Awareness: The Act has certain salient features. People should be
aware of the essential features of the Act in order to be able to make use of
the scheme fully. Start-up activities undertaken by the government
functionaries, panchayats and Kudumbasree have largely helped in
generating awareness on the essential features of the Act and the Scheme
among the rural households. A very high level of awareness could be found
among them on the essential features of the Act such as: i) 100 days of
employment per household; ii) minimum wage; iii) equal wage for men and
women; iv) universal Act; v) work within a radius of 5 km; vi) no labour
displacing machinery; vii) right to payment within a fortnight; and viii) eligibility
for unemployment allowance, etc. The level of awareness was found to be
high among the Rural Households of Palakkad and Wayanad (See Table 5.3)
which is mainly because the scheme was introduced much earlier when
compared to the other two districts.
Table 5.3: Awareness on Main Provisions of NREGS
Number of Respondents Districts
Provisions of NREGS
Palakkad N= 140
Idukki N=160
Wayanad N=160
Alapuzha N=160
Total N=620
100 days of employment per household
140 (100)
158 (98.8)
160 (100)
160 (100)
618 (99.7)
Minimum wage 138
(98.6) 154
(96.3) 159
(99.4) 158
(98.8) 609
(98.2)
Knowledge about correct minimum wage
138 (98.6)
158 (98.8)
160 (100)
139 (86.9)
595 (96.0)
Equal wage for men and women
140 (100)
157 (98.1)
159 (99.4)
156 (97.5)
612 (98.7)
Work within a radius of 5km
137 (97.9)
144 (90.0)
159 (99.4)
129 (80.6)
569 (91.8)
Universal Act 131
(93.6) 141
(88.1) 144
(90.0) 93
(58.1) 509
(82.1)
Role of Grama Sabha 137
(97.9) 144
(90.0) 155
(96.9) 145
(90.6) 581
(93.7)
No Labour Displacing Machinery
134 (95.7)
132 (82.5)
149 (93.1)
134 (83.8)
549 (88.5)
Eligibility for Unemployment Allowance
131 (93.6)
122 (76.3)
140 (87.5)
112 (70.0)
505 (81.5)
Compensation for delayed payment
128 (91.4)
116 (72.5)
142 (88.8)
119 (74.4)
505 (81.5)
Medical assistance for injury at the worksite
133 (95.0)
143 (89.4)
149 (93.1)
153 (95.6)
578 (93.2)
Worksite Facilities 132
(94.3) 128
(80.0) 156
(97.5) 150
(93.8) 566
(91.3)
Exgratia payment for death and disability
134 (95.7)
124 (77.5)
133 (83.1)
123 (76.9)
514 (82.9)
Right to Payment Within a Fortnight
132 (94.3)
143 (89.4)
148 (92.5)
147 (91.9)
570 (91.9)
Source: NREGA in Kerala - HH Survey
Figures in the parenthesis represent percentage to Number of Respondents

67
Initial response and acceptance of the scheme
Inspite of concerted efforts made by the Government and the
Panchayats to generate awareness and to get the rural households
registered, the initial response for the scheme was not encouraging. The
focus group discussion with the various stakeholders revealed that the
response was low in the beginning in all the four selected districts. Seeing is
believing. Rural households were waiting to see how the scheme got
operationalised. Certain category of people, especially the educated,
registered under the delusion that Government would provide guaranteed
‘white-collar’ jobs depending on the level of their education. But when they
realized the pattern of works undertaken under the scheme, they either
withdrew or kept away from further procedures. However, in course of time,
when the scheme was implemented with all its essential features, households
have accepted and participated in the scheme.
Registration
To seek and get employment under the scheme, every household
should get registered with the panchayat. The rural households may not
register themselves spontaneously. The implementing agencies need to
motivate the people to get registered. The Panchayats along with
Kudumabashree have played a key role in this regard. The efforts taken by
them are : i) distribution of application for registration by the ward members
with the help of SHG members; ii) constitution of a special team consisting of
school teachers, anganwadi workers and ST promoters to get the households
registered (Wayanad District); iii) convening the ward level meetings and
persuading the households to register; iv) door-to-door canvassing by the
SHGs, ADS and CDS (Wayanad); v) convenes special meetings in SC/ST
colonies; vi) enabling the households to take photographs free of cost.
Inspite of the sincere efforts made by the Panchayats and the
Kudumbasree, there were households which did not show interest in
registration. The main reasons for not registering under the scheme are: i) the
nature and type of work undertaken under the scheme was a restricting factor

68
for some households; ii) the households that could sustain without 100 days
of guaranteed employment did not come forward; and iii) lack of awareness
about the scheme in some pockets (Idukki).
Registration is a continuous process. Applications are received at any
point of time in the year and the applicants are registered under the scheme.
For instance, around 50 per cent respondents only are reported to have
registered under the scheme in Palakkad District when the scheme was
launched in the year 2005-06. Around 31 per cent of the respondents
registered in 2007-08 and the rest in the subsequent years. This trend could
be noticed in other districts too (See Table 5.4). An important inference that
could be drawn from the analysis is that registration is not a one-shot affair. It
is a continuous process. The rural households after observing the benefits of
the scheme have started joining the scheme.
Table 5.4: Year of Registration
No of Respondents Districts
Years Palakkad Idukki Wayanad Alapuzha Total
2006-07 72
(51.4) -
123 (76.9)
- 195
(31.5)
2007-08 43
(30.7) 117
(73.1) 19
(11.9) 1
(0.6) 180
(29.0)
2008-09 19
(13.6) 36
(22.5) 15
(9.4) 149
(93.1) 219
(35.3)
2009-10 6
(4.3) 7
(4.4) 3
(1.9) 10
(6.3) 26
(4.2)
Total 140
(100) 160
(100) 160
(100) 160
(100) 620
(100)
Source: NREGA in Kerala - HH Survey
Figures in the parenthesis represent column percentage
Issue of Job Cards
Every household registered under the scheme should be issued a job-
card. The Act stipulates that job-cards should be issued within a fortnight of
application for registration. Photographs of adult members who are applicants
have to be attached to the job-cards. The cost of job-card including
photographing has to be borne as part of the programme cost.
The Secretary of the panchayat is responsible for issuing job-cards.
The job-cards are issued to the households free of cost. The focus group
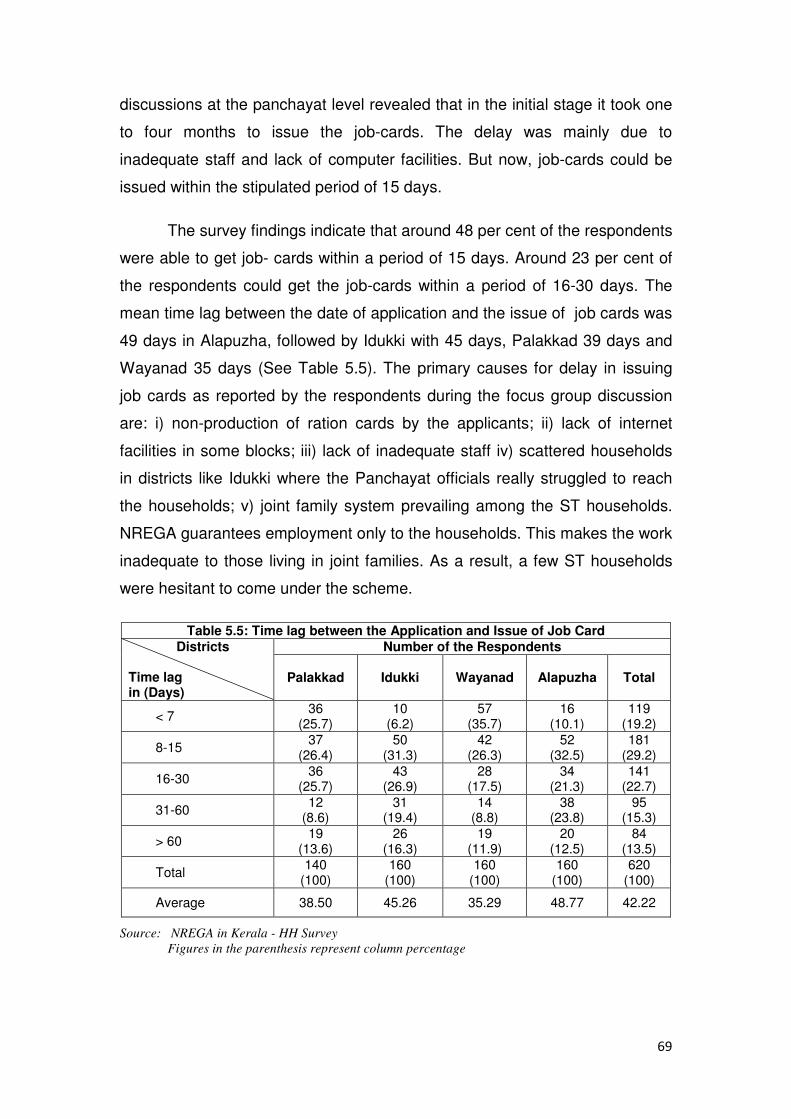
69
discussions at the panchayat level revealed that in the initial stage it took one
to four months to issue the job-cards. The delay was mainly due to
inadequate staff and lack of computer facilities. But now, job-cards could be
issued within the stipulated period of 15 days.
The survey findings indicate that around 48 per cent of the respondents
were able to get job- cards within a period of 15 days. Around 23 per cent of
the respondents could get the job-cards within a period of 16-30 days. The
mean time lag between the date of application and the issue of job cards was
49 days in Alapuzha, followed by Idukki with 45 days, Palakkad 39 days and
Wayanad 35 days (See Table 5.5). The primary causes for delay in issuing
job cards as reported by the respondents during the focus group discussion
are: i) non-production of ration cards by the applicants; ii) lack of internet
facilities in some blocks; iii) lack of inadequate staff iv) scattered households
in districts like Idukki where the Panchayat officials really struggled to reach
the households; v) joint family system prevailing among the ST households.
NREGA guarantees employment only to the households. This makes the work
inadequate to those living in joint families. As a result, a few ST households
were hesitant to come under the scheme.
Table 5.5: Time lag between the Application and Issue of Job Card
Number of the Respondents Districts Time lag in (Days)
Palakkad Idukki Wayanad Alapuzha Total
< 7 36
(25.7) 10
(6.2) 57
(35.7) 16
(10.1) 119
(19.2)
8-15 37
(26.4) 50
(31.3) 42
(26.3) 52
(32.5) 181
(29.2)
16-30 36
(25.7) 43
(26.9) 28
(17.5) 34
(21.3) 141
(22.7)
31-60 12
(8.6) 31
(19.4) 14
(8.8) 38
(23.8) 95
(15.3)
> 60 19
(13.6) 26
(16.3) 19
(11.9) 20
(12.5) 84
(13.5)
Total 140
(100) 160
(100) 160
(100) 160
(100) 620
(100)
Average 38.50 45.26 35.29 48.77 42.22
Source: NREGA in Kerala - HH Survey
Figures in the parenthesis represent column percentage

70
The respondents in the focus group discussion reported that the
problem can be overcome provided; i) a separate computer with internet
facilities could be made available exclusively for NREGS; and ii) adequate
staff are appointed based on the population and number of households
registered under the scheme.
Around 98 percent of the respondents reported that they did not spend
money to obtain the job card. Two percent (Palakkad and Idukki) reported that
they spend less than Rs.20/- to obtain the job cards.
The workers generally keep the job cards with them. They bring the job
card when they come to the worksite. This is a common practice that could be
observed in all the blocks of four districts. However, in certain worksites in
Idukki district, the mate (ADS) collects the job card, keep it with them till the
work gets completed and give it back to the workers on the last day of the
work.
Job cards are computerized in all the panchayats. Though the
Panchayats have problems in issuing job-cards, the process has been made
simple and easy over a period of time.
Identification of Work
The primary motto of NREGA is to provide employment guarantee in
rural areas. The Act has specified the kinds of work that can be taken up
under the scheme. They are labour-intensive in nature and include: i) water
conservation and water harvesting; ii) drought proofing, including afforestation
and tree plantation; iii) irrigation canals, including micro and minor irrigation
works; iv) provision of irrigation facility, plantation, horticulture land
development in land owned by households belonging to SC/ST; v) renovation
of water bodies including desilting of tanks; vi) land development; vii) flood
control and protection works including drainage in water logged areas; viii)
rural connectivity to provide all weather access.

71
The panchayats while preparing the plan of work under the scheme
should ensure that the works selected fall under the category suggested.
Identification and recommendation of the works were the responsibility of the
Gram Sabha. The priority in selecting the works that have to be taken up must
also be mentioned in the resolution of the Grama Sabha.
The focus group discussions revealed that Grama Sabha (Special)
were convened to select and recommend the works. People participating in
the Gram Sabha were invited to suggest works that could be undertaken in
their panchayat, keeping in view the provisions of NREGA. Priorities of works
are also decided at the Gram Sabha meeting. The representatives of the
people and panchayat officials and the staff concerned arrive at a consensus
and sort out the works that could be carried out. Once the items of works are
identified, prioritized and recommended by the Gram Sabha, the engineer and
overseer prepare the estimates for the works and get them approved by the
authorities concerned. Kudumbasree also plays a vital role in facilitating the
people to identify the work. An important factor that can be noticed in
selection of work is convening the Grama Sabha ward-wise which provides a
scope for harvesting the views of all the people from various wards of the
Panchayat.
Around two-third of the respondents reported that the works to be
undertaken under NREGA were selected in Gram Sabha meeting convened
at the ward level; and 21 per cent of the respondents said that the works were
selected in meeting convened by the ADS/CDS/mates. Around 19 percent of
the respondents reported that the works were selected by the panchayat (See
Table 5.6). District wise analysis shows that the works were mostly selected
at the Grama Sabha meeting at the ward level in Wayanad and Palakkad as
reported by more than three-fourths of the respondents. The inference is that
the Gram Sabha, the Panchayat and Kudumbasree play an active role in
identifying the works.

72
Table 5.6: Selection of Works
Districts Selection of Works
Palakkad N= 140
Idukki N=160
Wayanad N=160
Alapuzha N=160
Total N=620
Grama Sabha meeting at ward level
107 (76.8)
103 (64.4)
133 (83.2)
80 (50.1)
423 (68.2)
ADS/CDS/MATE meeting 33
(23.6) 1
(0.6) 38
(23.8) 57
(35.6) 129
(20.8)
Panchayat 20
(14.3) 64
(40.0) 6
(3.8) 27
(16.9) 117
(18.9)
AE - 2
(1.3.) - -
2 (0.3)
Source: NREGA in Kerala - HH Survey
Figures in the parenthesis represent percentage to Number of Respondents
Priority of Works
The works identified need to be prioritized. Priority is likely to differ from
block to block and district to district. Priority depends on the felt needs of the
people. The focus group discussions held at different locations across the
districts revealed that priority does differ from district to district (See Box 5.1).
Box 5.1: Priority of Works
Palakkad Idukki Wayanad Alapuzha
o Channel cleaning and renovation of water bodies
o Watershed activity
o Desilting the ponds
o Social forestry
o Trenches to prevent man-animal conflict
o Road work
o Drainage cleaning
o Land development
o Renovation of traditional water bodies.
o Agri-related works
o Maintenance of roads, culverts etc.
o Land improvement
o Rural connectivity
o Watershed
o Land development
o Water harvesting and soil conservation
o Agri-related works
o Common canal / channel renovation (Removal of Pola - Eichornia)
o Maintenance of road

73
Items of work undertaken as reported by the respondents corroborate
this. For instance, the major items of work undertaken in Palakkad include
renovation of traditional water bodies (67.1%) flood control and protection
work (53.6%) rural connectivity (46.4%) irrigation canals (45%) and water
conservation and water harvesting (29.3%). The major items of work
undertaken in Wayanad as reported by the respondents are rural connectivity
(77.5%) followed by land development (68.1%) and water conservation and
water harvesting (46.3%). In Alapuzha, the main items of work include
common canal / channel renovation (65%) and flood control and protection
work including drainage in the water logged area (63.8%) (See Table 5.7).
Thus, the priority in the selection of work differs from region to region.
Table 5.7: Items of Works Undertaken
Districts Works Undertaken
Palakkad N= 140
Idukki N=160
Wayanad N=160
Alapuzha N=160
Total N=620
Water conservation and water harvesting
41 (29.3)
31 (19.4)
74 (46.3)
6 (3.8)
152 (24.5)
Drought Proofing, including Afforestation and the tree plantation
3 (2.1)
7 (4.4)
1 (0.6)
37 (23.1)
48 (7.7)
Irrigation canals including micro and minor irrigation works
63 (45.0)
13 (8.1)
40 (25.0)
104 (65.0)
220 (35.5)
Provision of irrigation facilities, plantation, horticulture, land development to land owned by households belonging to the SC/ST / IAY/BPL families
1 (0.7)
41 (25.6)
50 (31.3)
42 (26.3)
134 (21.6)
Renovation of traditional water bodies including desilting of tanks
94 (67.1)
23 (14.4)
23 (14.4)
44 (27.5)
184 (29.7)
Land development 22
(15.7) 9
(5.6) 109
(68.1) 18
(11.3) 158
(25.5)
Flood control and protection work including drainage in the water logged areas.
75 (53.6)
48 (30.0)
42 (26.3)
102 (63.8)
267 (43.1)
Rural connectivity to provide all-weather access
65 (46.4)
149 (93.1)
124 (77.5)
36 (22.5)
374 (60.3)
Any other work that may be notified by the Central Govt.
6 (4.3)
3 (1.9)
- 6
(3.8) 15
(2.4)
Source: NREGA in Kerala - HH Survey
Figures in the parenthesis represent percentage to Number of Respondents

74
Problems in Identification of Work
The success of NREGS, to a great extent, depends on identification of
works as per the provisions of the Act. Adequate work has to be identified to
meet the demand of the local households. And, the work should be made
available within a radius of 5 km. from the household, so as to avoid the
hardships to the working population. However, in actual practice, the Gram
Sabha and Panchayat may come across certain problems and hurdles in
identifying the works. Problem may be location-specific. The focus group
discussions with the functionaries of the Panchayats and participants of the
programme have brought forth certain problems. They are listed below.
o The private land owners adjacent to the common land where the
NREGS works are proposed to be taken up raise boundary disputes as
there has been no clear and proper demarcation between common and
private lands
o The private land owners over a period of time have encroached the
common land. As a result, officials find it difficult to locate the extent of
common land encroached and evict the encroachment.
o People suggest various items of work in Grama Sabha meetings. Many
such works do not come under the purview of NREGA Act. Officials
have to struggle very hard to convince the people that such items of
work cannot be taken up under NREGS.
o Sometimes the functionaries may not be able to adhere to the
guidelines in selection of work as the geography of the district is
completely different from other districts. For example, flood control in
Kuttaanad in Alapuzha requires intervention every year on the same
site which is not possible under the Act.
Demand for employment
NREGS is demand-driven. People who are interested in doing work
under NREGS should come forward voluntarily and seek work job under the
scheme. The process of demanding employment as followed is stated here.

75
o Job seekers should submit the application form. The members of
ADS/CDS and mate facilitate the job seekers to submit the application
form.
o On receipt of the applications, dated receipts are given. The persons
responsible for issuing job cards are overseer, accountant-cum-
computer operator and Secretary of the Panchayat. It must be noted
that the dated receipts are given to only those job-seekers, who apply
in the prescribed format.
o Special efforts have been taken to see that SC/ST households get
representation; provided job cards; facilitated to apply for job and
provided job under the scheme.
o Special community meetings were organized in all the panchayats.
o Special awareness classes have been conducted in the SC hamlets
under the leadership of the Panchayat Presidents to ensure the
inclusion of all SC households under the scheme.
o It must be noted that all the households registered under the scheme
may not participate in the works. For instance, of the total households
registered under the scheme in Idukki district, around 50 per cent
participated. The reason is, tea estate labour constitute majority of the
working population in Idukki district. Many of them have registered
under NREGS. But they do not work under the scheme, as the
prevailing wage rate in tea estates is high. In Palakakd, only 55 per
cent of the registered workers participated in NREGS. The reasons are
i) initial misconception about the scheme; and ii) desire to get
unemployment allowance.
Figure 5.1: Employment sought under NREGA
95.7
94.4
92.5
95.6
94.5
Palakkad
Idukki
Wayanad
Alapuzha
Total

76
The survey shows that 95 per cent of the respondents sought work
under the scheme. District wise analysis indicates not much variation among
the respondents who sought employment. (See figure 5.1). The respondents
who sought employment in the prescribed application form should be given
the dated receipt. The Grama Panchayat should issue a dated acknowledge
the receipt of the written application for employment, against which the
guarantee of providing employment within 15 days operates. 57.1 per cent of
the respondents reported that they got the dated receipt from the Panchayat;
the rest did not. District wise analysis shows that majority of the respondents
(around 80%) in Palakkad and Alapuzha got the dated receipt; whereas the
job seekers, who got the dated receipt is less than 25 per cent in Idukki and
50 per cent in Wayanad (See Table 5.8). Thus, the practice of issuing dated
receipt is not fully adopted.
Table 5.8: Receipt of “Dated Receipt”
Number of Respondents Districts Response Palakkad Idukki Wayanad Alapuzha Total
Received 111
(79.3) 37
(23.1) 80
(50.0) 126
(78.8) 354
(57.1)
Not Received 29
(20.7) 123
(76.9) 80
(50.0) 34
(21.3) 266
(42.9)
Total 140
(100) 160
(100) 160
(100) 160
(100) 620
(100) Source: NREGA in Kerala - HH Survey
Figures in the parenthesis represent column percentage
Time lag between date of application and provision of employment
The National Rural Employment Guarantee Act stipulates that the
employment should be given to the job seekers within a period of 15 days
from the date of receipt of application. Focus group discussions with the
stakeholders shows that in majority of the panchayats, jobs could be given
within the stipulated period of the time, but it was delayed in some cases by
one month (Alapuzha), five months in Idukki, and seven months in Palakkad.
No delay beyond 15 days was reported in Wayanad.

77
Table 5.9: Time lag between the Application and Provision of Employment
Number of Respondents Districts Time lag in days
Palakkad Idukki Wayanad Alapuzha Total
< 15
66 (47.1)
121 (75.7)
146 (91.3)
109 (68.2)
442 (71.2)
16-30
40 (28.6)
18 (11.3)
14 (8.7)
20 (12.5)
91 (14.7)
31-45
8 (5.7)
1 (0.6)
- 3
(1.9) 12
(1.9)
46-60
7 (5.0)
16 (10.0)
- 13
(8.1) 36
(5.8)
> 60
19 (13.6)
4 (2.5)
- 15
(9.4) 39
(6.3)
Total 140
(100) 160
(100) 160
(100) 160
(100) 620
(100)
Average Time Lag 43 21 12 41 29
Source: NREGA in Kerala - HH Survey
Figures in the parenthesis represent column percentage
The survey findings reflect more or less a similar situation. Around 71
per cent of the total respondents said that they could avail job within 15 days
form the date of application. Around 15 per cent said that the time lag varied
between 15 to 30 days. District-wise analysis shows that Wayanad has been
able to provide employment within a period of 15 days. In other districts there
has been delay beyond 60 days. The average time lag between the date of
application and provision of job was the lowest in Wayanad (12 days) and the
highest in Palakkad with 43 days (See Table 5.9). One-third of the
respondents reported that they experienced delay in getting employment. Of
them, four percent got the unemployment allowance.
Execution of Work
The execution of activities designed under the NREGS goes through a
systematic process. Better execution and better reach of the scheme greatly
depends on the awareness about the process among all the stakeholders of
the project. The steps envisaged under the process include: i) Identification of
work; ii) preparation of people’s estimates by the engineers; iii) project
initiation meeting; iv) citizen’s information board; v) provision of implements;
vi) creating worksite facilities; vii) maintenance of muster roll;
viii) maintenance of worksite diary by the mate; ix) inspection of the work and
x) documentation of the works (visual).
The focus group discussions with various stakeholders of the project,
direct observation in the field and perusal of records maintained at different

78
levels have clearly indicated that the various steps envisaged under the
scheme have been meticulously followed. The process as narrated is more or
less the same in the various panchayats across the four districts. The process
as narrated by the stakeholders during focus group discussions and
crosschecked thro’ direct observation is outlined here.
o Convening the ward level meeting of the people to arrive at a
consensus on the works that can be taken up in the respective
wards.
o Preparation of proposal and action plan by the panchayat officials
and NREGS staff based on the works selected.
o Submission of proposals and action plan in Gram Sabha meeting
and getting its approval.
o Inspection of the worksite by the ward members and committee
concerned and taking photographs of the works site before the
commencement of the work.
o Sending the proposals to the appropriate bodies for approval (Block
and district level official)
o Receipt of technical support and notice from the block and district
level functionaries.
o Requisition and receipt of muster roll before commencing the work
o Receipt of technical and administrative sanctions from the
appropriate authorities.
o Fixing the dates for commencement of work and announcing the
same to the applicants.
o Commencement of the work on the stipulated date
o Provision of implements for doing the work and providing the
facilities required at the worksite
o Monitoring of the work by the local level functionaries and by the
officials atleast once in fourteen days where the work is under
progress.
o Measurement of the work executed on completion.
o Documentation of the completed works by the overseers and taking
photography of the completed works.
o Payment of wages to the workers through banks/post offices.

79
Average number of days of employment
The Act guarantees 100 days of employment to a rural households.
Any number of adult members, who registered under the scheme from a
household, can work. But the total number of personal days employed per
household should not exceed 100 days. There are households that have fully
made use of 100 days of guaranteed employment. There are also families,
which could not make use of the 100 days of employment. The average
number of days of employment, as per the survey, has shown an increasing
trend. The average number of days employed per household has increased
from 23.6 in 2006-07 to 61.5 days in 2008-09 in Wayand. In palakakd the
average number of days of employment has increased from 12.8 days to 53.2
days. These two districts have performed well. Idukki district, where the
scheme was introduced in 2007-08, has made slow progress in this regard.
Same trend could be seen in Alapuzha district too. (See Figure 5.2)
Figure 5.2 Average Number of days of employment
12.9
0
23.6
09
36.2
5
50.2
0
22.4
53.2
28.9
60.5
13.9
38.6
21.8
14.1
19.4
18.8
18.5
Palakkad Idukki Wayanad Alapuzha Total
Districts
2006-07 2007-08
2008-09 2009-10 Upto September 2009

80
Table 5.10: Community-wise average number of days employed
Districts
Years Community
2006-07 2007-08 2008-09 2009-10
Upto September 09
SC 18.47 23.94 47.76 20.88
ST 5.60 40.84 53.48 19.88
Others 13.73 37.18 54.00 19.04 Palakkad
Total 12.86 36.23 53.15 19.41
SC - 7.30 34.81 22.95
ST - 3.50 28.56 17.94
Others - 4.32 26.41 21.96 Idukki
Total - 5.04 28.88 21.83
SC 15.25 99.25 88.50 13.75
ST 12.12 41.09 65.76 19.33
Others 26.89 50.99 58.13 18.81 Wayanad
Total 23.55 50.16 60.46 18.79
SC - - 15.78 20.07
ST - - - 14.00
Others - - 13.42 12.00 Alapuzha
Total - - 13.86 14.09
SC 3.57 10.65 31.52 21.14
ST 7.11 32.01 52.16 19.08
Others 10.60 23.58 37.99 17.77 Total
Total 8.98 22.42 38.63 18.50
Source: NREGA in Kerala - HH Survey
Figures in the parenthesis represent column percentage
Community-wise analysis of the average number of days employed
indicates that SC/ST households have been able to make use of the scheme
to the maximum extent possible. For instance, the average number of days
employed was as high as 99.25 days for SC households in Wayanad in the
year 2007-08; it came down to 88.59 days in the year 2008-09. Yet, it was
much higher when compared to other groups including ST. A comparison of
average number of days employed among the different communities for the
year 2008-09 in Idukki shows that SC households have high average number
of days employed (34.81 days) followed by ST (28.56 days) and others (26.41
days). In Alapuzha too a similar trend could be seen (See Table 5.10). It can,
therefore, be concluded that SC/ST households have made use of the
scheme better when compared to other communities. This can be attributed to
the special efforts made by the functionaries of the scheme to generate
awareness among the SC/ST households and motivate them to join and make
use of the scheme.

81
100 days employed
An important indicator of the success of the programme is the number
of households made full use of the 100 days of employment. Higher
percentage of households fully making use of 100 days of work would mean:
i) the active participation of the rural households; ii) ability of the Panchayats
to identify the works, generate employment opportunities to meet the demand
for employment from the rural households; iii) improved income among the
households leading to security of access to food and other basic necessities;
and iv) checking of distress migration.
The field data on the number of rural households employed for 100
days show that there has been a steady and sure increase. The number of
households employed for 100 days was just 12 constituting 4 percent of the
respondents in 2006-07. It went upto 86 constituting 14 percent of the
households. District-wise analysis reveals that Wayanad leads with 30
percent employed for 100 days followed by Palakkad with 20 per cent of the
respondents in 2008-09. The other two districts have initiated the scheme
later. Only very few respondents are employed for 100 days. (See Figure 5.3).
Figure 5.3: Number of Respondents employed for 100 days per annum
2.90
50
1.9
10.7
0
21.3
0
7.9
20
5
30
1.3
13.9
1.4 0.6 0.6
0.6
0.8
Palakkad Idukki Wayanad Alapuzha Total
Districts
2006-2007 2007-2008 2008-2009 2009-2010
Participation in various items of work
The Act has listed certain items of labour intensive activities that can
be taken up under the scheme. It has also specified that the material cost
should not exceed the prescribed limit with an intention of channelising the
maximum benefit in the form of improved wages and income to the poor rural

82
households. Items of works undertaken across the state are likely to vary as
they depend upon the geographical and physiological conditions.
An analysis of the participation of the respondents in various items of
work reveals that majority of the workers (56.4%) were found to get involved
in road works; followed by flood control and protection work (35.5%), irrigation
canals (26.6%), land development (23.4%), renovation of traditional water
bodies (22.6%) and water conservation and water harvesting (19.4%).
District-wise analysis indicates that 93.1 per cent of the respondents in
Idukki were found to have participated in road works; in Wayanad too majority
of the respondents (69.4%) were found to have participated in road work.
While in Alapuzha, majority of the respondents were found to have
participated in flood control and protection works (48.8%), and cleaning
irrigation canals (43.8%). In Palakkad, majority of respondents (58.6%) were
found to have participated in renovation of traditional water bodies and flood
control and protection works (50.7%). (See Table 5.11).
Table 5.11: Participation in Works
Districts Items of works
Palakkad N= 140
Idukki N=160
Wayanad N=160
Alapuzha N=160
Total N=620
Rural connectivity to provide all-weather access
67 (47.9)
149 (93.1)
111 (69.4)
21 (13.1)
348 (56.1)
Flood control and protection work, including drainage in the water logged areas.
71 (50.7)
39 (24.4 )
32 (20.0)
78 (48.8)
220 (35.5)
Irrigation canals, including micro and minor irrigation work
63 (45.0)
11 (6.9)
21 (13.1)
70 (43.8)
165 (26.6)
Land development 17 (12.1)
8 (5.0)
99 (61.9)
21 (13.1)
145 (23.4)
Renovation of traditional water bodies including desilting of tanks
82 (58.6)
11 (6.9)
18 (11.3)
29 (18.1)
140 (22.6)
Water conservation and water harvesting
33 (23.6)
17 (10.6)
65 (40.6)
5 (3.1)
120 (19.4)
Provision of irrigation facilities, plantation horticulture, land development to land owned by households belonging to the SC/ST/IAY/BPL families
2 (1.4)
20 (12.5)
40 (25.0
35 (21.9)
97 (15.6)
Drought Proofing, including afforestation and the tree plantation
4 (2.9)
4 (2.5)
1 (0.6)
11 (6.9)
20 (3.2)
Any other work that may be notified by the Central Govt.
4 (2.9)
1 (0.6)
1 (0. 6)
3 (1.9)
9 (1.5)
Source: NREGA in Kerala - HH Survey
Figures in the parenthesis represent percentage to the Number of the Respondents

83
Distance between worksite and place of residence
The work should be made available within a radius of 5 km from place
of residence of the participants as far as possible. In case, the works could
not be identified, the workers are permitted to work in the adjoining
panchayats, where enough works are available. The logic in fixing the limits of
5 km radius is to ensure that the workers do not face hardships in reaching
the worksite and do not waste time and energy in commuting to the work site.
It is also to ensure that all development works are identified and executed
within the panchayat limits.
Table 5.12: Distance between residence and place of work
Number of Respondents
Palakkad Idduki Wayanad Alapuzha Total
Districts
Distance (in km.)
Min Max Min Max Min Max Min Max Min Max
< 1 71
(50.70) 7
(5.0) 101
(58.10) 8
(5.0) 112
(70.00) -
140 (87.5)
16 (10.0)
424 (68.40)
31 (5.0)
1-3 62
(44.30) 76
(54.30) 57
(35.60) 44
(27.50) 39
(24.4) 69
(43.1) 17
(10.6) 66
(41.3) 175
(28.2) 255
(41.10)
3-5 7
(5.00) 54
(38.60) 1
(0.60) 76
(47.5) 4
(2.50) 70
(43.80 3
(1.90) 78
(48.80) 15
(2.40) 278
(44.80)
> 5 - 3
(2.10) 1
(0.60) 32
(20.0) 5
(3.10 21
(13.10) -
-
6 (1.00)
56 (9.00)
Total 140
(100) 140
(100) 160
(1000 160
(100) 160
(100) 160
(100) 160
(100) 160
(100) 620
(100) 620
(100)
Source: NREGA in Kerala - HH Survey
Figures in the parenthesis represent column percentage
The distance between place of residence and place of work has clearly
revealed that two-thirds of the respondents have to travel less than 1 km to
reach their worksite. Around 28 percent of them have to travel 1 to 3 km and
24 of them have to cover a distance of 3-5 km. Thus, 99 per cent of the job
seekers under the scheme were able to get work within a radius of 5 km.
District-wise analysis shows that a vast majority of the respondents in
Alapuzha (98.1%), Wayanad (94.4%), Idukki (90.6%), Palakakd (93.6 %)
have reported that worksites were located within a radius of 3 km from their
residence. (See Table 5.12).
When the worksite lies beyond 5 km from the headquarters, transport
allowance needs to be paid, 30 respondents (4.8%) reported to have received
transport allowance.

84
Mode of transport
A vast majority of the respondents (95%) were able to reach worksite
by walk as the distance to worksite was less than 3 km. in all the panchayats.
Very few used other modes of transport such as bus, jeep, auto and bike.
District-wise analysis shows that workers in Idukki and Wayanad used Jeep,
bus and Auto (See Figure 5.4). Boats were the mode of transport in Alapuzha.
The mode of transport depends on the geographical condition and the type of
transport facilities available in the district.
Figure 5.4 Mode of Transport
96.491.3
96.6 96.9 95
3.67.5
3.1 0.6 3.70
15.610.6
006.9
0.6 0 1.90 0 04.4 1.1
6.8
0
20
40
60
80
100
120
Palakkad Idukki Wayanad Alapuzha Total
Districts
Perc
en
t
Foot Bus Jeep Auto Boat
The transport cost incurred by majority of the respondents (out of 30
respondents) was less than Rs.10/-. Very few respondents were found to
have incurred Rs.10/- to Rs.20/- The transport cost in the case of distance
exceeding 5 km was borne by the Panchayats. When the distance is less than
5 km. the workers met the travel expenses.
Working hours
The working hours as reported by majority of the respondents (88%)
across the districts is that the work commences at 8 am and closes at 5 pm.
In a few places of the districts, the works commenced at 9 am and or at 8.30
a.m. (See the Table 5.13). The workers do have lunch and tea breaks.
The working time and duration varies across the Districts. For instance,
the workers in Alapuzha district are not accustomed to the working hours
followed in other districts. The traditional agriculture labourers in Alapuzha

85
work from 06.30 a.m. to 01.30 p.m. The reason is obvious. The district is
covered with rivers and backwaters. The water during the morning will be at
normal temperature and as the time passes the temperature rises. In other
words, the people in the region have to experience hot humid temperature
around noon. As a result, the labourers stop working after 01.30 p.m. Thus,
working hour for the agriculture labourer in Alapuzha district starts earlier and
stops earlier. The workers who are used to this timing find it difficult to adjust
with the timings adopted in other districts.
Table 5.13: Working hours
Number of Respondents Districts Working hours Palakkad Idukki Wayanad Alapuzha Total
8.00 am to 5.00 pm 109
(77.8) 134
(83.8) 151
(94.4) 155
(96.9) 549
(88.5)
8.30 am to 5.00 pm 14
(10.0) -
3 (1.9)
1 (0.6)
18 (2.9)
8.00 am to 4.30 pm - 1
(0.6) 1
(0.6) -
2 (.3)
8.30 am to 4.30 pm 17
(12.1) 20
(12.5) - -
37 (6.0)
8.00 am to 4.00 pm - 4
(2.5) 5
(3.1) -
9 (1.5)
9.00 am to 5.00 pm - 1
(0.6) -
4 (2.5)
5 (0.8)
Total 140
(100) 160
(100) 160
(100) 160
(100) 620
(100)
Source: NREGA in Kerala - HH Survey
Figures in the parenthesis represent column percentage
Facilities at the worksite
Basic facilities are to be provided at the worksite. The facilities to be
provided as per the Act include medical aid, drinking water, shed and crèche if
there are more than 5 children below the age of six years.
The panchayats by and large have been able to provide facilities at the
worksite. The facilities provided as reported by majority of the respondents
include: drinking water (77.4%), first aid box (54%), shade (45%) and tools
(32.4%). Crèche facility was found to have been provided in a few worksites
of Wayanad and Alapuzha. Extra facilities extended at the worksite, as
reported by respondents include gloves (1%), tea and snacks (2.1%), and
arrangement for supply of food at the worksite (2.9%) etc., particularly in
Alapuzha district. (See Table 5.14).

86
Table 5.14: Facilities available at the work site
Districts
Facilities at the worksite
Palakkad N= 140
Idukki N=160
Wayanad N=160
Alapuzha N=160
Total N=620
Drinking water 102
(72.9) 111
(69.4) 143
(89.4) 124
(77.5) 480
(77.4)
Shed for dressing 58
(41.4) 53
(33.1) 90
(56.3) 76
(47.5) 277
(44.7)
Toilet (temporary) 41
(29.3) 19
(11.9) 16
(10.0) 3
(1.9) 79
(12.7)
First Aid box 85
(60.7) 61
(38.1) 112
(70.0) 87
(54.2) 355
(55.6)
Tools 25
(17.9) 90
(56.3) 29
(18.1) 57
(35.6) 201
(32.4)
Creche - - 3
(1.9) 2
(1.3) 5
(0.8)
Gloves - - - 6
(3.8) 6
(1.0)
Tea and Snacks - 1
(0.6) 5
(3.1) 8
(5.0) 14
(2.3)
Food available at worksite - - - 18
(11.3) 18
(2.9)
No Facilities 29 (20.7)
10 (6.3)
3 (1.9)
7 (4.4)
49 (7.9)
Source: NREGA in Kerala - HH Survey
Figures in the parenthesis represent percentage to number of the respondents
Regarding the adequacy of worksite facilities, a little less than two-
thirds of the respondents reported that facilities are not adequate. District-wise
analysis shows that the worksite facilities were found to be lacking in Idukki as
reported by majority of the respondents (72.5%) followed by Alapuzha
(61.3%) and Palakakd (64.6%). (See Table 5.15)
Table 5.15: Adequacy of the worksite facilities
Number of Respondents Districts Response
Palakkad Idukki Wayanad Alapuzha Total
Adequate 50
(35.7) 44
(27.5) 79
(49.4) 54
(33.8) 227
(36.6)
Not Adequate 90
(64.3) 116
(72.5) 81
(50.6) 106
(66.3) 393
(63.4)
Total 140
(100) 160
(100) 160
(100) 160
(100) 620
(100)
Source: NREGA in Kerala - HH Survey
Figures in the parenthesis represent column percentage
Of the 393 respondents who said that the facilities at the worksite are
inadequate, majority of them reported that facilities such as shade for
dressing and resting, tools, first aid box, toilet and drinking water should be

87
made available. Around one-third of them reported that tea and snacks can be
given at the worksite free of cost (See Table 5.16).
Table 5.16: Facilities required at the worksite
Districts Worksite facilities required
Palakkad N= 90
Idukki N=116
Wayanad N=81
Alapuzha N=106
Total N=393
Drinking water 15
(16.7) 28
(24.1) 9
(11.1) 8
(7.5) 60
(15.3)
Shed for dressing 44
(48.9) 70
(60.3) 24
(29.6) 34
(32.0) 172
(43.8)
Toilet 24
(26.7) 52
(48.2 ) 27
(33.3) 35
(33.0) 138
(35.1)
First Aid box 37
(41.1) 59
(50.9 ) 23
(28.3) 16
(15.1) 135
(34.4)
Tools 49
(54.4) 47
(40.5) 53
(65.4) 16
(15.1) 165
(41.9)
Creche 3
(3.3) 1
(1.9) 1
(1.2) 2
(1.9) 7
(1.8)
Gloves 3
(3.3) 3
(2.5) -
8 (7.5)
14 (3.6)
Tea and Snacks - 53
(45.7) 22
(27.1) 46
(43.4) 121
(30.8)
Vehicle - 16
(13.7) 8
(9.8) -
24 (6.1)
Food at the worksite - 5
(4.3) 13
(16.0) 23
(21.7) 41
(10.4)
Doctor/ nurse - - 1
(1.2) 23
(21.7) 24
(6.1)
Umbrella - - - 5
(4.7) 5
(1.3)
Shoes - - - 3
(2.8) 3
(0.8)
Source: NREGA in Kerala - HH Survey
Figures in the parenthesis represent percentage to number of the respondents
Tools
NREGS as indicated earlier is labour intensive. Use of machinery is
prohibited. As a vast majority of the participants are landless agriculture
labourers, they may not possess the tools. Hence, it is essential that tools are
made available at all the worksites by the panchayats for those who do not
possess tools for work. Around two-fifth of the respondents reported that
panchayats provided tools; around 22 per cent said they bought their own
tools for work. One-third of them said tools were jointly arranged by workers,
panchayat and Kudumbashree.
District-wise analysis shows that the tools were mostly made available
by the panchayats in Palakakd district and Kudumbashree is reported to have
played a good role in providing tools in Alapuzha (See Table 5.17). It must be

88
noted that 44 respondents were found to have hired tools for work; of whom
majority (75%) are from Alapuzha.
Table 5.17: Who provided tools for the work in the worksite
Number of Respondents Districts
Who provided tools Palakkad Idukki Wayanad Alapuzha Total
Panchayat 98
(70.0) 49
(30.6) 45
(28.1) 56
(35.1) 248
(40.0)
Self 8
(5.7) 5
(3.1) 45
(28.1) 78
(48.8) 136
(21.9)
Kudumbasree 4
(2.86) -
1 (0.6)
23 (14.4)
28 (4.6)
Self, Panchayat and Kudumbasree
30 (21.4)
106 (66.2)
69 (43.1)
3 (1.8)
208 (33.5)
Total
140 (100)
160 (100)
160 (100)
160 (100)
620 (100)
Source: NREGA in Kerala - HH Survey
Figures in the parenthesis represent column percentage
Problems faced at the worksite
Around 75 per cent of the respondents said that they did not face any
problems at the worksite. The rest did face some problems. Two important
problems faced at the worksite as reported are: i) tools are not good (67.7%);
and ii) too heavy tools to work (25.3%). There are few location specific
problems like snakebite at the worksites (8.9%) and difficulties in working
continuously in water bodies (12.0%) (See Table 5.18)
Women have reported certain specific problems during the focus group
discussion. They are: i) they are not able to strictly follow the time schedule
as they have responsibilities at home; ii) a few are not accustomed to hard
physical work; iii) tools are not women friendly; iv) toilets are not made
available at certain worksites; v) women above the age of 50 found it hard to
put up with the work under NREGS; and vi) they have also come across with
location specific problems. For instance, cleaning the weed-infested canals is
an important item of the works undertaken in Alapuzha district. The women
have to travel in boats to remove the weeds in the canals and load them in the
boat and deposit them on the banks of the canal. The women could not
balance themselves in the boat while performing all these activities.

89
Table 5.18: Problems faced at the worksite
Districts Worksite problems
Palakkad (N= 40)
Idukki (N=30)
Wayanad (N=33)
Alapuzha (N=55)
Total (N=158)
No need based work 2
(5.0) 1
(3.3) 3
(9.1) -
6 (3.8)
Using pickaxe/ lifting heavy stone (for women)
9 (22.5)
12 (40.0)
8 (24.2)
11 (20.0)
40 (25.3)
Lack of good tools/ Tools are not good
40 (100)
10 (33.3)
28 (84.8)
29 (52.7)
107 (67.7)
Hot weather condition 12
(30.0) 1
(1.3) 2
(6.0) 2
(3.6) 17
(10.8)
Non availability of First Aid facility
1 (2.5)
1 (1.3)
- - 2
(1.3)
Lack of co-operation from the land owners (road work)
- 6
(20.0) -
2 (3.6)
8 (5.0 )
Over work load - 1
(1.3) -
1 (1.8)
2 (1.3)
Injuries - - 2
(6.0) 4
(7.3) 6
(3.8)
Difficult in working continuously in water bodies
- - - 19
(34.5) 19
(12.0)
Snakes at the worksite - - - 14
(25.5) 14
(8.9)
Scarcity of boat - - - 2
(3.6) 2
(1.3)
Source: NREGA in Kerala - HH Survey
Figures in the parenthesis represent percentage to number of the respondents
Payment of Wages
Payment of wage is a very significant component under the scheme.
The Act has specifically stated that i) every worker under the scheme is
entitled to minimum wage as fixed by the state government; ii) equal wages
should be paid to men and women; iii) wage should be paid on a weekly basis
either through bank or post office; and iv) wage rate should be published
permanently at every worksite. These conditions are stipulated to ensure
transparency, accountability and corruption free system.
Field observations revealed that muster rolls received from the
panchayat office are maintained at the worksite. The muster rolls provide
details on the job card number, the number of workers and the days worked.
The mates maintain the muster rolls. The mates are mostly women drawn
from Kudumbashree. They are selected through a participatory process. They
are trained well. The interaction with them revealed that they are all aware of

90
the salient features of the NREGA, entitlements of the NREGA workers,
worksite facilities to be provided and transparency safeguards to be adopted
at the worksite. They are trained in the maintenance of muster rolls and
measurement of work. Field observations in the worksites have clearly
indicated that the mates have performed duties such as mobilizing the
workforce, marking the worksite, allotting the works, maintaining the muster
rolls, ensuring the provision of worksite facilities, ensuring the quality of work
executed, general worksite supervision, dealing with emergencies, helping the
overseer/engineers etc. to the utmost satisfaction of the various stakeholders
of the scheme.
Wages are paid after measuring the work. Overseer/engineer
measures the quantity of work before and after the execution of the work.
They visit the worksites and measure the work usually after the completion of
the muster rolls. They do visit the worksites in between and give necessary
instructions at the worksite. The wages are distributed through the bank/post
office after the measurements are made.
Awareness about minimum wages
98.4 per cent of the respondents were aware of the minimum wage
fixed by the state government. All the respondents in Wayanad and Alapuzha
were aware of the minimum wage; a few respondents in Palakkad (9.3%) and
Idukki (2.5%) were not aware of the minimum wages.
The respondents were also aware of the mode of fixation of wage
under the scheme. A high level of awareness on the various aspects of the
scheme including the fixation of wages can be attributed to the involvement of
Kudumbashree units from the beginning of the scheme and high literacy rate
among the participants.
Wages earned under the scheme
The minimum wage earned under the scheme as reported by majority
of the respondents (86.3%) is Rs.125/-. Around 19 per cent of them said it
varied from Rs.100 to 124/-. District wise analysis shows that the minimum
wage earned was lower in Palakkad District when compared to other districts
(See Table 5.19).

91
Table 5.19: Wages earned under the scheme
Number of Respondents Districts Minimum wage earned under the scheme
Palakkad Idukki Wayanad Alapuzha Total
<100 22
(15.7) -
4 (2.5)
2 (1.3)
28 (4.5)
100-124 55
(39.3) 25
(15.6) 4
(2.5) 4
(2.5) 88
(14.2)
>125 63
(45.0) 135
(84.4) 152
(95.0) 154
(96.3) 504
(81.3)
Total 140
(100) 160
(100) 160
(100) 160
(100) 620
(100)
Average 106.04 123.35 123.55 123.88 119.59
Source: NREGA in Kerala - HH Survey
Figures in the parenthesis represent column percentage
The maximum wage under the scheme as reported by the respondents
indicates that 99.4 per cent of them could get a wage of Rs.125 per day which
indicates that they are all assured of minimum wages prescribed by the state
government. (See Table 5.20)
Table 5.20: Maximum wage earned under the scheme
Number of Respondents Districts
Maximum wage earned under the scheme
Palakkad Idukki Wayanad Alapuzha Total
< 124 3
(2.1) - - -
3 (0.5)
125 136
(97.1) 160
(100) 160
(100) 160
(100) 616
(99.4)
> 126 1
(0.7) - - -
1 (0.2)
Total 140
(100) 160
(100) 160
(100) 160
(100) 620
(100)
Average minimum wage earned
121.4 124.18 123.44 124.99 123.51
Source: NREGA in Kerala - HH Survey
Figures in the parenthesis represent column percentage
Mode of payment of wage
Wages were paid either thro’ bank or thro’ post offices to prevent
corruption. 89.8 per cent of the respondents reported that they got wages
through the bank. Rest of them got the wages through post offices. Payment
of wage through post office was practised in Alapuzha District (See Table
5.21)

92
Table 5.21: Mode of payment of wage
Number of Respondents Districts Mode Palakkad Idukki Wayanad Alapuzha Total
Through Bank
140 (100)
160 (100)
160 (100)
96 (60.0)
556 (89.6)
Through Post Office - - - 64
(40.0) 64
(10.3)
Total 140
(100) 160
(100) 160
(100) 160
(100) 620
(100)
Source: NREGA in Kerala - HH Survey
Figures in the parenthesis represent column percentage
Around 95 per cent of the respondents reported that they did not face
any problem in withdrawing the cash form the bank. Rest did face problems
which were mostly related to initial reluctance on the part of the bank officials
to entertain NREGA accounts.
Time lag between date of completion of work and payment of wage
The wages should be paid on a weekly basis, and in many cases within
a fortnight of the date on which the work was done. Around 62 per cent of the
respondents reported that the wages were paid within a period of 15 days. It
took 16-30 days to get wage in the case of around one-fourth of the
respondents. A few respondents could get wage after a period of 60 days
only. District-wise analysis shows that around one-third of the respondents, in
Palakkad was able to get the wage after a period of one month. There were
incidents of delay beyond one month in other districts too. The average time
lag between date of completion of work and receipt of wage shows that
Wayanad has the lowest time lag of 12.57 days, followed by Alapuzha with
20.86 days. The average days for all the districts is 22.68 days (See Table
5.22).
Important reasons for the delay in payment of wages as reported by
the respondents and as learnt during the focus group discussions were; i) lack
of staff; ii) delay in providing muster rolls; iii) delay in measurement; iv) lack of
adequate monitoring by the Panchayat; and v) delay on the part of the bank.

93
Table 5.22: Time lag between date of completion of work and receipt of wages
Number of Respondents Districts Time lag in days
Palakkad Idukki Wayanad Alapuzha Total
< 15 20
(14.3) 115
(71.9) 140
(87.6) 107
(66.9) 382
(61.6)
16-30
67 (47.9)
26 (16.3)
16 (10.0)
36 (22.5)
145 (23.4)
31-45
8 (5.7)
6 (3.8)
4 (2.5)
8 (5.0)
26 (4.2)
46-60
34 (24.3)
13 (8.1)
- 7 (4.4)
54 (8.7)
> 60
11 (7.9)
- - 2 (1.3)
13 (2.1)
Total 140
(100) 160
(100) 160
(100) 160
(100) 620
(100)
Average 40.13 23.21 12.57 20.86 22.68
Source: NREGA in Kerala - HH Survey
Figures in the parenthesis represent column percentage
All the respondents reported that they were able to get full wages as
per the muster rolls. They were all fully paid and there has been no incidence
of non-payment or under payment.
NREGA wage and market wage
A comparison between NREGA wage and wage prevailing in the
market has revealed that NREGA wages were much lower than the prevailing
wage rates in the case of men. The average difference for all the districts put
together worked out Rs.74/-. In other words, the wages for men was around
Rs.200/- in the market, whereas it was Rs.125/- under NREGS. The
difference was quite high in Alapuzha district, where men were able to get
double the NREGA wage in the market.
However, the NREGA wages are better than what it generally prevails
for the women in all the four districts. The difference was as high as Rs.38 in
Palakkad District, whereas NREGA wage was closer to market wage in Idukki
and Alapuzha districts (See Table 5.23).
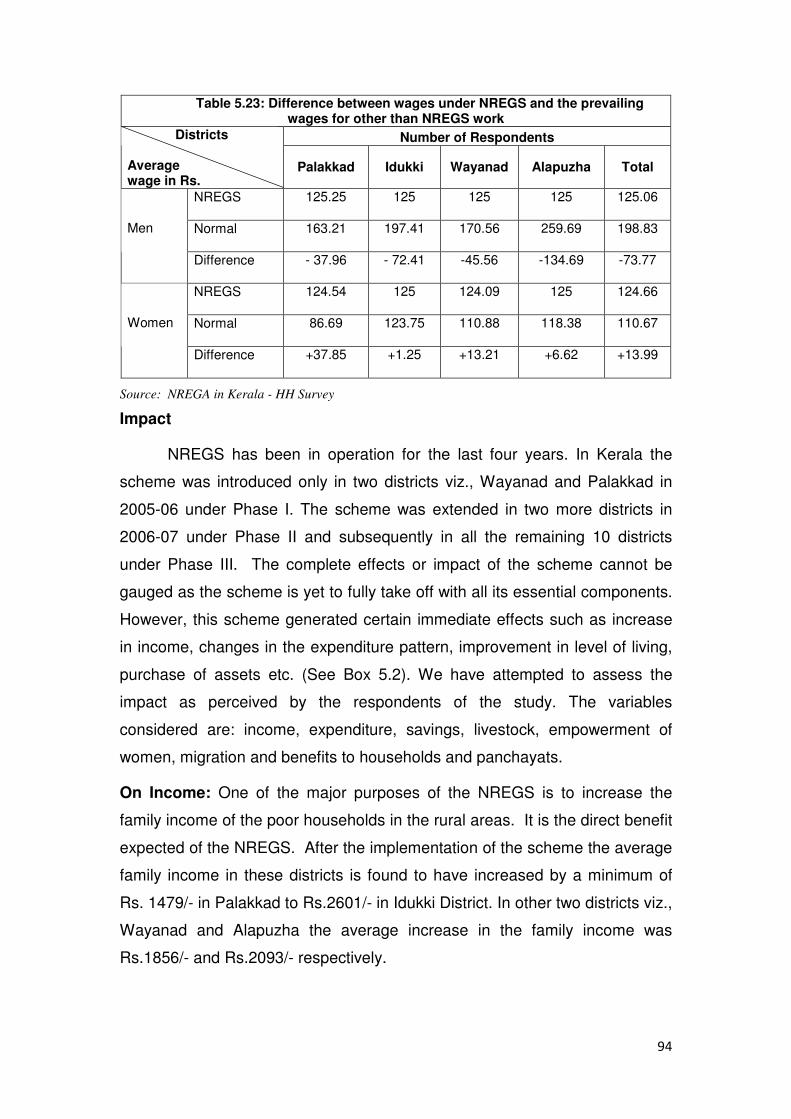
94
Table 5.23: Difference between wages under NREGS and the prevailing wages for other than NREGS work
Number of Respondents Districts
Average wage in Rs.
Palakkad Idukki Wayanad Alapuzha Total
NREGS 125.25 125 125 125 125.06
Normal 163.21 197.41 170.56 259.69 198.83 Men
Difference - 37.96 - 72.41 -45.56 -134.69 -73.77
NREGS 124.54 125 124.09 125 124.66
Normal 86.69 123.75 110.88 118.38 110.67 Women
Difference +37.85 +1.25 +13.21 +6.62 +13.99
Source: NREGA in Kerala - HH Survey
Impact
NREGS has been in operation for the last four years. In Kerala the
scheme was introduced only in two districts viz., Wayanad and Palakkad in
2005-06 under Phase I. The scheme was extended in two more districts in
2006-07 under Phase II and subsequently in all the remaining 10 districts
under Phase III. The complete effects or impact of the scheme cannot be
gauged as the scheme is yet to fully take off with all its essential components.
However, this scheme generated certain immediate effects such as increase
in income, changes in the expenditure pattern, improvement in level of living,
purchase of assets etc. (See Box 5.2). We have attempted to assess the
impact as perceived by the respondents of the study. The variables
considered are: income, expenditure, savings, livestock, empowerment of
women, migration and benefits to households and panchayats.
On Income: One of the major purposes of the NREGS is to increase the
family income of the poor households in the rural areas. It is the direct benefit
expected of the NREGS. After the implementation of the scheme the average
family income in these districts is found to have increased by a minimum of
Rs. 1479/- in Palakkad to Rs.2601/- in Idukki District. In other two districts viz.,
Wayanad and Alapuzha the average increase in the family income was
Rs.1856/- and Rs.2093/- respectively.

95
Box 5.2: The multiplier effects of NREGA
Parijan, a member of the traditional orthodox Muslim family is around 40 years of age.
She was married to Abdul Rehman in 1987 when she was 18 years old. Life was quite
happier until her husband met with an accident and got paralyzed in1991. There was nobody
to support her at times of distress and she had to work as a servant maid and agricultural
laborer to run her family. She has two daughters and the family lives in a hut.
Parijan came to know about NREGA only in 2007 even though it was introduced in
the year 2006. She registered and started working under the scheme. She worked for 23 days
in 2007 – ’08 and 50 days in 2008 – ’09. She has already completed 38 days of work for the
current year and she hopes to hit the guaranteed 100 days before the end of the financial
year.
The wages she earned during the initial period was mainly spent on consumption
expenditure. Later she could save some money and with that she started a canteen within the
premises of panchayat. The canteen is run well and yields profit. She has now enough
revenue to run the family. Her aim is to see that her daughters are got married and settled.
She feels that NREGA has not only helped her to earn wages, but also enabled her to start a
micro-enterprise which has now become an important source of livelihood.
Table 5.24: Impact of NREGS on the family income
Number of Respondents Districts Increase in income in Rs.
Palakkad Idduki Wayanad Alapuzha Total
No change 65
(46.4) 19
(11.9) 23
(14.4) 9
(5.6) 116
(18.7)
< 2500 47
(33.6) 93
(58.1) 111
(69.4) 112
(70.0) 363
(58.5)
2500-5000 20
(14.3) 26
(16.3) 16
(10.0) 23
(14.4) 85
(13.7)
> 5000 8
(5.7) 22
(13.8) 10
(6.3) 16
(10.0) 56
(9.0)
Total 140
(100) 160
(100) 160
(100) 160
(100) 620
(100)
Average 1479 2601 1856 2093 2024
Source: NREGA in Kerala - HH Survey
Figures in the parenthesis represent column percentage
District wise analysis shows that there has been a substantial change
in the family income on account of the NREGS in all the districts except the
Palakkad District. In Palakkad about 46 per cent of the people opined that the
scheme has hardly brought changes in the family income. Even among those
who reported change in the family income about 33.6 per cent reported that
only a marginal change is realized (Rs. >2500 per annum). The remaining 20
percent reported an increase of more than Rs.2500/- in their family income.
But in other three districts, about 85 to 95 per cent of the people reported to

96
have seen substantial increase in their family income. However, such
increase in the family income was less than Rs.2500/- in majority of the
cases. Those who reported to have marginal income of more than Rs.2500/-
constituted about one-fourth of the total respondents from these districts.
Thus, the change in the average family income in all these districts was
moderate. .
On Expenditure: Increase in family income should have resulted in more
family expenditure. The details on the family expenditure collected from the
respondents showed that about 40 per cent of them did not see any change
in the family expenditure whereas, about 47.3 per cent reported to have spent
more than what they were spending earlier to this intervention. The change in
the family expenditure ranged between less than Rs.2500/- and more than
Rs.5000/-. However, people who spend more than Rs.2500/- accounted for
12.8 percent in all the four districts.
Table 5.25: Impact of NREGS on the expenditure
Number of Respondents Districts The impact of NREGS on the expenditure in Rs.
Palakkad Idduki Wayanad Alapuzha Total
No change 84
(60.0) 36
(22.5) 60
(37.5) 68
(42.5) 248
(40.0)
< 2500
43 (30.7)
79 (49.4)
97 (60.6)
74 (46.3)
293 (47.3)
2500-5000
12 (8.6)
28 (17.5)
3 (1.9)
12 (7.5)
55 (8.9)
> 5000
1 (0.7)
17 (10.6)
- 6 (3.8)
24 (3.9)
Total 140
(100) 160
(100) 160
(100) 160
(100) 620
(100)
Average 763.21 2368.75 542.34 963.38 1172.20
Source: NREGA in Kerala - HH Survey
Figures in the parenthesis represent column percentage
District wise analysis of the family expenditure revealed that there was
not much change in Palakkad District, where about 60 per cent reported no
change. While in Idukki district it was only 22.5 per cent who reported no
change in the average family expenditure. In other two districts viz., Wayanad
and Alapuzha the number of respondents who reported no change was
around 40 per cent. Thus, in Idukki District change was noticed in the family

97
expenditure to a great extent while in Palakkad district people did not spend
more on family expenses. There have been obvious changes in the family
expenses after the implementation of the scheme. Majority stated that their
family expenses too increased in proportion to the increase in family income.
Only in Idukki district more than one fourth of the respondents reported
increase in the family expenditure by more than Rs.2500/-. Thus, with the
introduction of the scheme the family expenditure and purchasing capacity of
rural households have improved in all the four districts.
A look at the spending pattern of the income earned by the
respondents from the NREGS reveals that they use it for a variety of
purposes. The items of expenses include expenses on household activities,
buying of food grains, meeting day-to-day expenses, spending on education
of the children, hospital expenses repayment of old debts, construction of
house and buying durable assets.
Table 5.26: Spending pattern of the wages earned under NREGS
Districts Particulars
Palakkad (N=140)
Idduki (N=160)
Wayanad (N=160)
Alapuzha (N=160)
Total (N=620)
Household activities 76
(54.3) 58
(36.3) 73
(45.6) 90
(56.3) 297
(47.9)
Education 39
(27.9) 60
(37.5) 58
(36.3)) 51
(31.9 ) 208
(33.5)
Buying assets 14
( 10.0) 11
(6.9) ) 14
(8.8) 10
( 6.3) 49
( 7.9)
Buying food grains 27
( 19.3)) 61
(38.1) 46
(28.8) 54
( 33.8) 188
(30.3)
Hospital expenses 17
(12.1 ) 50
(31.3) ) 52
(32.5) 21
( 13.1) 140
(22.6)
Payment of old debts 42
(30.0 ) 11
(6.9 ) 21
( 13.1) 8
(5.0 ) 82
(13.2)
Celebrations 4
(2.9) 2
( 1.3 ) 7
(4.3 ) 6
( 3.8) 24
(3.9)
Agricultural activities 2
(1.4)) - - -
2 (0.3)
Buying clothes 3
(2.1) -
20 (12.5)
4 (2.5)
27 (4.4)
Day-to-day expenses - 5
(3.1) 2
(1.2) 2
(1.3) 9
(1.5)
Construction of house - 2
(1.3) 3
(1.9) 10
(6.3) 15
(2.4)
Source: NREGA in Kerala - HH Survey
Figure in the parenthesis represents the percentage to the Total Respondents
From the overall analysis it is found that the income is spent by a
sizeable number of respondents for meeting the household expenses.

98
(47.9%), expenses on education of the children (33.5%) buying food grains
(30.3%) and for meeting medical expenses (22.6 %). The other expenses met
out of the additional income include repayment of old debts (13.2%) buying of
assets (7.9%) buying clothes (4.4%) celebrations (3.9%) construction of
house (2.4%) (See Box 5.3 and 5.4) and other day- to-day expenses (1.5%).
People opined that the introduction of the scheme improved the debt-servicing
capacity of the poor households and also helped in reducing the liabilities. It
can be concluded that the households spend the income mainly on household
expenses and on education and clothing of the children. The spending pattern
of the people from different districts hardly shows any differences except
redemption of prior debts (30%) in Palakkad District.
Box 5.3: Age Has Not Withered Away the Spirit to Work
O. Kunjamma (72 years) is a senior citizen of Nedumudi Panchayat of Alappey district. He has seven children; all of them happily settled. He lives with his youngest son. He is an active member of CPI (M). NREGS was introduced in the panchayat in 2009. Planning to do something productive, he joined NREGS. The work taken up in his ward under the scheme was removal of weeds from the Bhoothapandam lake. He actively participated in the work. He said he was quite happy because i) he could earn at this stage ii) could do some useful work in the village and iii) he could spend the wages earned for a productive purpose viz., construction of a house for his son.
Box 5.4: NREGS enabled to come out of the vicious cycle of poverty
The case of two sisters
Karthiyani and Vasanthi are two sisters born and brought up in Nandiyodu, a hamlet
(9th ward in Pattancherry) of Chittor block. They are the daughters of Kombi and Devu who
belongs to ST. They had an elder brother supporting them. He became chronically ill and
died. The entire family fell into the vicious cycle of poverty.
It is at this juncture they came to know about NREGS through Kudumbashri. Both of
them registered themselves under the scheme. They were active participants of NREGS.
After 2 years of work, they had a bank balance of Rs. 20000/- (Canara bank,
Meenakshipuram). They were mostly idle without much work before the launch of NREGA.
NREGS provides assured work with a minimum wage of Rs. 125/- per day. They have plans
to construct a new house through IAY (Indira Awas Yojana) with an additional contribution
from their own savings.

99
Table 5.27: Impact of the NEREGS on the Saving (Per annum)
Number of Respondents Districts
The impact of the NEREGS on the Saving in Rs.
Palakkad Idduki Wayanad Alapuzha Total
No Saving 84
(60.0) 100
(62.5) 91
(56.9) 69
(43.1) 344
(55.5)
< 1250 37
(26.4) 54
(33.8) 43
(26.9) 69
(43.1) 203
(32.7)
1250-2500 9
(6.4) 2
(1.3) 9
(5.6) 19
(11.9) 39
(6.3)
> 2500 10
(7.1) 4
(2.5) 17
(10.6) 3
(1.9) 34
(5.5)
Total 140
(100) 160
(100) 160
(100) 160
(100) 620
(100)
Average savings 754.07 236.56 715.97 567.98 562.66
Source: NREGA in Kerala - HH Survey
Figures in the parenthesis represent column percentage
On Savings: The household savings is a function of the household income
and expenditure. In all the four districts increase in the family income was
reported to be moderate. The moderate income so earned on account of the
scheme was reported to have been spent by the families for meeting their
family expenses. As such, the extent of savings at the household level would
also be marginal if at all the families have propensity to save. The average
savings as reported by the respondents ranged from Rs. 236/- (in Idukki
district) to Rs.754/- in Palakkad district, while the overall average savings was
Rs.562/- . It is seen from the table that only 45 per cent of the households
have savings. 32 percent of the household save upto Rs.1250/- The rest
constituting about 12 per cent have savings ranging from Rs.1250 to Rs.2500.
District-wise analysis reveals that that there was no savings as
reported by majority of the respondents. They constituted 60 per cent in
Palakkad, 62.5 percent in Idukki, 56.9 per cent in Wayanad and 43.1 per cent
in Alapuzha. Thus, Alapuzha district has shown better results in this respect,
where majority has reported to have savings ranging from Rs. 1250 to Rs.
2500. In Idukki, people reported that the habit of saving has been picking-up
even among the weaker sections of the community. It should, however, be
noted that the extent of savings was less than Rs.1250 in majority of the
households in all the districts.

100
Table 5.28: Impact of NREGS on livestock
Number of Respondents Districts Livestock Palakkad Idduki Wayanad Alapuzha Total
No change 128 (91.4)
156 (97.5)
152 (95.0)
133 (83.1)
569 (91.8)
She buffalo - - 1 (0.6)
- 1 (0.2)
Cow 2 (1.4)
- 7 (4.4)
7 (4.4)
16 (2.6)
Goat 5 (3.6)
2 (1.3)
- 15 (9.4)
22 (3.5)
Poultry 5 (3.6)
2 (1.3)
- 5 (3.1)
12 (1.9)
Total 140 (100)
160 (100)
160 (100)
160 (100)
620 (100)
Source: NREGA in Kerala - HH Survey
Figures in the parenthesis represent column percentage
On Livestock: There has been increase in the livestock population after the
implementation period in all the four districts. In Alapuzha District 16.9 per
cent reported an increase in the livestock population especially cow, goat and
poultry. 97.5 percent of the respondents in Idukki reported that there was not
much change in the livestock population. Similar is the case with Wayanad
where 95 per cent reported no change in the livestock. In the case of
Palakkad District about 8.6 per cent expressed that there is an increase in the
livestock particularly the number of cows, goats and poultry birds. Thus, the
NREGS is found to have enabled a few households to buy livestock and
adopt it as the secondary occupation for improving their economic condition. It
is understood from the FGD that livelihood opportunities have increased after
the introduction of the scheme. Some of them bought goat out of their wages.
This scheme is specially benefiting the senior citizens, who didn’t have any
other choice to lead their life.
On Empowerment of women: The scheme has its focus on poor and
marginalized sections of the community. It has sought to do away with
discriminating practices in payment of wages to women. The Act has
categorically offered equal wages to men and women. Further, the Act
emphasized the role of women in the scheme. Field evidences do indicate
that participation of women in the scheme is quite high in states like Kerala
and Tamil Nadu when compared to other states.

101
High participation of women is likely to empower them socially,
economically and politically. 60 percent of the respondents reported that the
women are socially empowered. They work as group in NREGA resulting in
close relationship and connectivity with panchayats and government officials.
They state earning enhances their status in the family. They also participate in
Grama Sabha meetings and meeting of the Social Audit Committee which
earns a status for them in the community. Women are consulted in meetings.
All these give them a sort of social empowerment. 41.4 percent of the
respondents said that the women are economically empowered for obvious
reasons. First, they outnumber the men at the worksite but earning equal
wages. Second, they supplement and complement the income earned by the
male members in the household. Third, the income earned under the scheme
especially for the women headed households offer economic independence.
Fourth, women enjoy freedom in spending the money they earned. Few
respondents reported that the women are politically empowered as they
participate in decision making process under the scheme. (See Table 5.29).
District-wise analysis shows that social empowerment was found to be
high in Alapuzha as reported by majority of the respondents (74%) followed
by Idukki with two-thirds of the respondents reporting. Majority of the
respondents in Wayanad (60%) reported economic empowerment followed by
Idukki with 44 percent.
Table 5.29: Impact of the NREGS on women empowerment
Number of Respondents Districts Women Empowerment
Palakkad N= 140
Idukki N=160
Wayanad N=160
Alapuzha N=160
Total N+620
No change 58
(41.4) 36
(22.5) 55
(34.3) 26
(16.2) 175
(28.2)
Socially 64
(45.7) 106
(66.2) 86
(53.8) 118
(73.8) 374
(60.3)
Economically 38
(27.1) 70
(43.7) 96
(60.0) 53
(33.1) 257
(41.4)
Politically 1
(0.7) 5
(3.1) 11
(6.9) 2
(1.2) 19
(3.0
Source: NREGA in Kerala - HH Survey
Figure in the parenthesis represents the percentage to the Total Respondents

102
Table 5.30: Migration to other areas in search of job before the introduction of the NREGS
Number of Respondents Districts Response Palakkad Idduki Wayanad Alapuzha Total
Not migrated 109
(77.8) 155
(96.9) 155
(96.9) 154
(96.3) 573
(92.4)
Migrated 31
(22.1) 5
(3.1) 5
(3.1) 6
(3.8) 47
(7.6)
Total 140
(100) 160
(100) 160
(100) 160
(100) 620
(100)
Place of Migration
Within in the District 15
(48.4) 3
(60.0) 4
(80.0) 2
(33.3) 24
(51.1)
Within the state 8
(25.7) 1
(20.0) - 2
(33.3) 11
(23.4)
Outside the State 8
(12.9) 1
(20.0) 1
(20.00) 2
(33.3) 12
(25.53)
Total 31
(100) 5
(100) 5
(100) 6
(100) 47
(100)
Duration of the migration
Below 2 months 20
(64.5) 1
(20.0) 1
(20.0) -
22 (46.8)
2 to 4 months 2
(6.5) -
2 (40.0)
2 (33.3)
6 (12.8)
4 to 6 months 6
(19.4) -
1 (20.0)
1 (16.7)
8 (17.0)
6 to 12 months 2
(6.5) 3
(60.0) 1
(20.0) -
6 (12.8)
above 12 months 1
(3.2) 1
(20.0) -
3 (50.0)
5 (10.6)
Total 31
(100) 5
(100) 5
(100) 6
(100) 47
(100)
Source: NREGA in Kerala - HH Survey
Figures in the parenthesis represent column percentage
On migration: People of Kerala freely migrate to other states seeking
employment opportunities. Both educated and illiterate do so, if necessary.
Those who are qualified to work in organized sectors move to other countries
of the world. Whereas, those who are not lettered or who do not have
necessary qualification for getting a job in the organized sector normally move
to nearby places especially during the lean season. Table 5.30 shows that
only 7.6 percent of the total respondents reported to have migrated in search
of employment. The prevalence of migration was more in Palakkad district
than other districts. In Palakkad about 22 per cent of the respondents
reported migration for employment while, in other districts this remained
around three to four percent. Thus, except Palakkad district the extent of
migration was found to be meager.

103
Among those who have migrated, a vast majority had reported that
they migrated within the district (51.1%) and within the state (23.4%). The rest
who constituted 25.53 per cent reported to have migrated to other states.
Intra-district migration is found to be prevalent more in Wayanad (80%)
followed by Idukki (60%) and Palakkad (48.4%). In the case of Alapuzha, an
equal number of respondents (33.33%) reported prevalence of intra district,
inter district and inter state migration. (See Table 5.31)
In terms of periodicity of migration, around half of the total respondents
who reported to have migrated stated that they migrated for a period of less
than two months; 30 percent of the respondents migrated for a period of 2 to 4
months; the rest for a period ranging from six months to one year (12.8%) and
more than one year (10.6%). It can, therefore, be noted that there is no
uniform pattern among these districts in regard to the periodicity of migration.
Table 5.31: The level and intensity of migration after the introduction of NREGS
Number of Respondents Districts The level and intensity of migration after the introduction of NREGA
Palakkad Idduki Wayanad Alapuzha Total
No change
105 (75.0)
92 (57.5)
132 (82.5)
148 (92.5)
477 (76.9)
Decreased
24 (17.1)
68 (42.5)
26 (16.3)
10 (6.3)
128 (20.6)
Increased
10 (7.1)
- 2
(1.3) 1
(0.6) 13
(2.1)
Men migrated for better wage 1
(0.7) - - 1
(0.6) 2
(0.3)
Total 140 (100)
160 (100)
160 (100)
160 (100)
620 (100)
Source: NREGA in Kerala - HH Survey
Figures in the parenthesis represent column percentage
The details on the level and intensity of migration after introduction of
NREGS as reported by the respondents are presented in Table 5.31. About
77 percent of the respondents stated that there was no change in the level of
migration, while 20.6 per cent reported decrease in the level and intensity of
migration which the respondents attributed to the implementation of the
scheme. Even through the rate of migration has come down after the
implementation of the scheme, migration of men, especially those below the

104
age of 35 remained unchanged as the young men with reasonable level of
secondary and higher secondary school education feel inferior in working
under these kinds of programmes which involve manual/physical work. Such
migration was due to the educated men seeking better employment avenue
elsewhere. The extent of decrease in the migration was reported more in
Idukki district (42.5%) followed by Palakkad (17.1 %) and Wayanad (16.3 %).
However, in Palakkad district about 10 per cent of the respondents reported
increase in the level of migration even after the NREGS intervention. This
trend in Palakkad district is attributed to the fact that men in these villages of
Palakkad district move to nearby cities of Tamil Nadu for better paid jobs.
Benefits of NREGS
Table 5.32: Benefits of NREGS to HH
Number of Respondents Districts
Benefits Palakkad
N=140 Idduki N=160
Wayanad N=160
Alapuzha N=160
Total N= 620
Guaranteed employment 38
(27.1) 3
(1.9) 7
4.3) 18
(11.2) 66
(10.6)
Paying of children’s education fee
15 (10.7)
25 (15.6)
19 (11.9)
13 (8.1)
72 (11.6)
Hospital expense 10
(7.1) 29
(15.6) 16
(10.0) 22
(13.8) 77
(12.4)
Increase in family status 17
(12.1) 13
(18.1) 16
(10.0 ) 12
(7.5) 58
(9.4)
House maintenance 5
(3.6) 10
(6.2) 7
(4.3) 6
(3.8) 28
(4.5)
Household expenses 39
(27.9) 58
(36.2) 28
(17.5 27
(16.9) 152
(24.5 )
Payment of debts 7
(5.0) 26
(16.2) 18
(11.2) 20
(12.5) 71
(11.4)
Family savings increased 13
(9.2) 5
(3.1) 14
(8.8) 21
(13.1) 53
(8.5)
Women have cash in hand 14
(10.0) 6
(3.8) 2
(1.3) -
22 (3.5)
Purchased assets 2
(1.4) 3
(1.9) 4
(2.5) -
9 (1.4)
Family income increased - 32
(20.0) 58
(36.2) 54
(33.8) 144
(23.2)
Poverty reduced - - 3
(1.9) 16
(10.0) 19
(3.06)
No change 11
(7.9) 4
(2.5) 8
(5.0) 3
(1.9) 26
(4.1)
Source: NREGA in Kerala - HH Survey
Figure in the parenthesis represents the percentage to the Total Respondents
The NREGS has brought in several benefits to rural households. The
major benefits as listed by the respondents, include: guaranteed employment;
sufficient income for meeting expenses on education, healthcare and

105
household expenses; improved family income leading to improvement in the
status of the family; house maintenance, repayment of debts, purchase of
assets etc. (See Box 5.5).
Except a small percentage of (4.1) respondents, everyone expressed
that the additional income from NREGA helped them in several ways. They
stated that the additional and guaranteed income from NREGA was very
much useful in meeting the household expenses to a great extent. The
increase in the expenses of the households was obviously made possible
through implementation of NREGA.
Box 5.5: NREGA assures stable income: The case of Subadra
Subadra aged 57 is a resident of Vadakarappathy Panchayat of Chittoor block in Palakkad district. Her husband was an agricultural labourer. He could not continue to work as he is ageing. Hence he looks after his small farm of 1 acre. The couple has a son, who is working as a driver and a daughter.
Subadra was also working as an agricultural labourer before the advent of NREGA in her area. She came to know of NREGA when the panchayat initiated some start-up activities to generate awareness among the people about the scheme. She and her daughter-in-law registered themselves under the scheme. They were not aware of the provisions of the scheme. However, in course of time, they came to know more about the scheme because of the efforts taken by the panchayat. They said that they could perceive the opportunities available in the scheme and decided to make use of the scheme to the maximum extent possible.
Both of them worked for 80 days at the rate of 40 days each in 2006-07. In the subsequent two years, they fully made use of the guaranteed days of employment. For the current year they have already worked for 30 days and they were sure of hitting the maximum of 100 days.
Subadra and her daughter-in-law were quite satisfied with the scheme. The major benefits for them from the scheme are: i) secured livelihood opportunity for a period of 100 days; ii) better wages; iii) improved income which enabled them to buy income generating assets like cow and consumer durable asset like TV; and iv) redemption of prior debts.
They said that they did not have any problem in registration, getting employment and wages. They were quite satisfied with the way in which the scheme is implemented in their panchayat.
From the overall responses of the people, it is understood, that it
increased the family income (23.2%) and improved the households expenses
(24.5%). Other benefits as reported by the people are guaranteed
employment (10.6%), money for meeting educational expenses (11.6%),
hospital expenses (12.4%) and improve the capacity to service the old debts
(11.4%). Increase in the family economic status is another important benefit
realized on account of the NREGA intervention. District wise analysis reveals
more or less similar pattern of responses. People expressed that the scheme
helped them in getting 100 days of assured employment and a minimum

106
annual wage of Rs.12,500/- per family. This guarantee was not there earlier
and it relieved them from the problem of searching for wage-labour during the
off-season.
Table 5.33: Benefits of the NREGS for the Panchayat
Districts Benefits
Palakkad N= 140
Idukki N=160
Wayanad N=160
Alapuzha N=160
Total N=620
Road maintained 24
(17.1) 96
(60.0) 114
(71.62) 69
(43.1) 303
(48.8)
Land leveled/ developed
2 (1.4)
3 (1.8)
47 (29.3)
12 (7.5)
64 (7.26)
Elephant trench created 7
(5.0) - 1
(0.58) 5
(3.1) 13
(2.0)
Canal/ Channel Renovated
23 (16.4)
5 (3.1)
31 (19.3)
65 (40.6)
124 (20.0)
Well Renovated 4
(2.8) 3
(1.8) 12
(7.5) 17
(10.6) 36
(5.8)
Pond Renovated 29
(20.2) 1
(0.6) 28
(17.5) 11
(6.8) 69
(11.1)
Pond Created 9
(6.2) -
15 (9.3)
10 (6.2)
34 (5.4)
Check dam Created 19
(13.2) - -
3 (1.8)
22 (3.5)
Trees Planted 1
(0.7) 3
(1.8) 1
(0.6) 9
(5.6) 14
(2.2)
Rain water Harvested 9
(6.2) 7
(4.3) 6
(3.8) 4
(2.5) 26
(4.1)
Retaining Wall Constructed
11 (7.7)
1 (0.6)
3 (1.9)
1 (0.6)
16 (2.5)
Improved water resources
5 (3.5)
3 (1.8)
15 (9.3)
4 (2.5)
27 (4.3)
More people get employed
- 26
(16.2) 8
(9.3) 35
(21.8) 69
(11.1)
Increase in the social participation of backward community
- 10
(6.2) 7
(4.3) 3
(1.8) 20
(3.2)
Senior citizen's are employed in the work
- 9
(5.6) 1
(0.6) - 10
(1.6)
Panchayat funds are saved
- 1
(0.6) 1
(0.6) - 2
(0.3)
Better yield for land owners
- 3
(1.8) 11
(6.9) 13
(8.1) 27
(4.3)
New road created - -
2 (1.2)
3 (1.8)
5 (0.8)
Source: NREGA in Kerala - HH Survey
Figure in the parenthesis represents the percentage to the Total Respondents
The immediate concern of the scheme is to guarantee employment and
certain level of income. The scheme has also kept in view sustainability of
income by insisting on such works that would have spin off effects. For
instance, works related to water and soil conservation are likely to result in
intensification of agriculture which in turn would lead to improved employment
opportunities in the long run. (See Box 5.6). It would also result in

107
maintenance of community assets in a state of efficiency. The panchayats
and the people therefore, gain from the scheme.
It is clear from the views of the majority of the respondents that the
Panchayats made use of the scheme for maintenance of road and renovation
of pond, rivers, canals and channels. The NREGA helped the Panchayats in
maintaining the public assets which are useful to the society. District-wise
analysis of the benefits accrued to the panchayats shows that benefits
accrued differ from district to district. This is due to different geographic nature
and the preference and priorities of the people in the Panchayat in the
selection of works for implementation under the scheme.
Box 5.6: Regenerating agriculture through NREGA
Vadakarapatty Grama Panchayath in Chittoor block of Palakkad district with a
geographical area of 5480 ha. is a rain-shadow region. The major sources of livelihood for
the households in the panchayat are agriculture and animal husbandry. The households
in this region did not face much problem as they had enough rain and ground water was
available at the depth of 12 feet. This situation slowly deteriorated due to
commercialization of agriculture, declining ground water and failure to network the existing
water bodies. This situation further worsened due to continuous drought in the area from
1986 – 1996. Public had to stand in long queue to get even drinking water supplied
through lorries. The situation improved with the implementation of the watershed
programme in the region.
The real turning point, however, in the opinion of the people is the launching of
NREGA in the panchayat in 2005-06. The scheme with the focus on soil and water
conservation helped in renovating many supply channels and the 12 ponds/tanks, which
were in a bad shape for many years. The impact of the work executed is quite visible.
Ground water level has increased; area under cultivation has gone up; cropping system
has changed; employment in agriculture has slightly improved; people are quite conscious
of importance of soil and water conservation. There is also marked improvement in the
participation of people in Grama Sabha meeting and the people demand schemes and
projects that would enhance their well being.
Box 5.7: A pond in a private land for a common purpose
Krishnasami, residing in Perumatty Panchayat of Chittoor block of Palakkad
district, owns 30 cents of land. Karupathurankkadu, which is situated in a valley. The land
could be converted into a water body. He agreed that the panchayat could make use of
the land for developing a pond. The subject was discussed in the grama sabha meeting
and it was decided to dig a pond.
A group of 44 workers worked for three months and completed the work of
digging a pond with a length of 60 feet and a width of 45 feet. Of the 44 workers, 40 were
women and four were men. The total estimate was Rs. 5 lakhs; but the work was
completed at a cost of 3.23 lakhs. The effect of the work was improved ground water in
the surrounding areas which led to improved agricultural activities.

108
The works taken up by the panchayats under NREGS helped the
Panchayat in several ways either directly or indirectly. The road works carried
out enabled the pancayats creating good connectivity with neighbouring
villages and urban centres. The land and water improvement activities were
very useful to the panchayats in recharging the ground water which leads to
improved irrigation facilities (See Box 5.7). The clearance of drainages helped
easy flow of water and in draining the rainwater and maintaining overall
sanitation in the villages.
Table 5.34: Changes that the Scheme has brought in the Panchayat
Districts Changes
Palakkad N= 140
Idukki N=160
Wayanad N=160
Alapuzha N=160
Total N=620
Soil erosion prevented 25
(17.9) 3
(1.9) 13
(8.1) 6
(3.7) 47
(7.5)
Ground water level increased
29 (20.7)
1 (0.6)
37 (23.1)
7 (4.3)
74 (11.9)
Community assets created 25
(17.8) 2
(1.2) 6
(3.7) 3
(1.9) 36
(5.8)
Check dam constructed 2
(1.4) 2
(1.2) 4
(2.5) 1
(0.6) 9
(1.4)
Good connectivity 22
(15.7) 95
(59.3) 80
(50.0) 73
(45.6) 270
(43.5)
Drainage canal cleaned 7
(5.0) 1
(0.6) 8
(5.0) 32
(20.0) 44
(7.0)
Easy flow of rain water 9
(6.4) 2
(1.2) 2
(1.2) 23
(14.3) 36
(5.8)
People's contact increased with Panchayat
6 (4.2)
2 (1.2)
4 (2.5)
11 (6.9)
23 (3.7)
Unemployment reduced 6
(4.2) 20
(12.5) 6
(3.7) 17
(10.6) 49
(7.9)
Agriculture Improved 16
(11.4) 1
(0.6) 45
(28.1) 33
(20.6) 95
(15.3)
Sanitation maintained 1
(0.7) 13
(8.1) 3
(1.9) 20
(12.5) 37
(5.9)
Social awareness increased
- 4
(2.5) 30
(18.7) 2
(1.2) 36
(5.8)
Women empowered - 4
(2.5) 5
(3.1) 18
(11.2) 27
(4.3)
Poverty reduced - - 10
(6.2) 7
(4.3) 17
(2.7)
Source: NREGA in Kerala - HH Survey
Figure in the parenthesis represents the percentage to the Total Respondents
Box 5.8: Prevention of men – animal conflict
Sholayur is a Panchayat in Attappady block of Palakkad district. This is a place where 3 rivers – Kodakarapallon, Bhavani and Siruvani meet. The area is elephant frequented region. The elephant cross the rivers and cause damage to the crops cultivated and disturbed human population. The Grama Sabha decided that a trench from Thekkimukkiyoor to Koodapetty would help solve the problem. The total estimate was Rs. 9 lakhs. The work was commenced on 5
th September 2007 and completed on 7
th August
2009. The total person days spent on the work is 2000.

109
This scheme by providing employment helped in reducing the
magnitude of unemployment in these villages. These changes in the
panchayats are not however uniform in the villages of different districts. We
could notice differences in respect of each item among the districts.
Change in Relationship
Sharing of work with other members is supposed to improve the social
relationship among the NREGS employees. 54.7 percent of the respondents
reported that there is appreciable change in the relationship among the
members involved in the NREGS works. The scheme has helped in bringing a
sense of oneness among the community members. It has also created
confidence among the people and willingness in them to take up any work for
the welfare of the Panchayat as a whole. The district wise analysis reveals
that NREGA has resulted improved relationship among the respondents in
Wayanad and Alapuzha as reported by majority of the respondents. The
improved relationship is a sign of emergence of social capital which could be
meaningfully used for developing other forms of capital such as human
capital, physical capital and financial capital.
Table 5.35: Change in the relationship among the Households after the introduction of NREGS
Number of Respondents Districts Response Palakkad Idduki Wayanad Alapuzha Total
No Change in relationship
77 (55.0)
110 (68.8)
48 (30.0)
46 (28.8)
281 (45.3)
Change in relationship
63 (45.0)
50 (31.3)
112 (70.0)
114 (71.3)
339 (54.7)
Total 140
(100) 160
(100) 160
(100) 160
(100) 620
(100)
Kind of Changes
Cooperation 14
(10.0) 33
(20.6) 73
(45.6) 72
(45.0) 192
(30.9)
Acceptance 11
(7.8) 9
(5.6) 15
(9.3) 16
(10.0) 51
(8.2)
Sharing the Households Expenses
48 (34.2)
- 10
(6.2) 15
(9.3) 89
(14.4)
Confidence in moving with the people
- - 17
(10.6) 17
(10.6) 34
(5.4)
Source: NREGA in Kerala - HH Survey
Figures in the parenthesis represent column percentage

110
Social Audit
Social Audit is one of the salient features of NREGS. This is meant to
ensure transparency and create a corruption-free atmosphere in the
implementation of the programme. Social audit process along with appropriate
use of Right to Information (RTI) Act is expected to uphold the rights of the
citizenry in rural India. As per the guidelines of the NREGS each Panchayat
needs to have a Social Audit Team, which should carry out the audit in order
to verify if the programme is socially beneficial, corruption-free, and yields the
results it is expected to produce amidst the rural community.
• The social audit teams in all the study districts have been formed
based on the guidelines of the NREGS. It consisted of 12 members,
which included ward members, workers in NREGS, representatives
from SC/ST population, a representative from the neighbouring ward
etc.
• It was found that Social Audit has been conducted in all the four
districts under review viz., Palakkad, Idukki, Alapuzha, and Wayanad.
In Idukki and Alapuzha districts the number of social audit conducted
was found to be less, and upon probing, it was found that the
programme got initiated in these two districts, only a little later than the
other two districts (Palakkad and Wayanad) under study.
• The social audit team has pursued the records, in order to understand
the works undertaken, estimation, spill over details, SC/ST
participation, muster roll and job card related details. The social audit
team interacts with beneficiaries of NREGS in person and crosscheck
the details given in the muster roll such as attendance, wage received
for each work etc. The teams also visited the worksites and monitored
the work that are taken up and evaluated the works that are completed.
They check whether the work done tallies with the works given in
measurement book. The team verifies the vouchers and receipts if
material component is used in the work.
• The team interacts with Panchayat functionaries to understand the
problems faced, draw-backs if any they feel in the programme, and

111
their suggestions for overcoming the hitches with policy guidelines or
practical problems in implementation.
• The team, based on their observation, interaction and perusal of
records, prepares the social audit report. The report is then submitted
to authorities concerned and functionaries of the Panchayat for making
necessary changes, observation and suggestions. The final social
audit report after making necessary changes is presented in the Grama
sabha. The report as approved by the Grama sabha is compiled and
consolidated and submitted to the authorities concerned at the block
and District levels.
• The report is submitted to the Block Office. However, no significant
changes in the way the programme is implemented has been
suggested in the social audit report.
Grievance Redressal
In a massive rural employment generation scheme like NREGS,
grievances from some sections of the population or from workers themselves
are possible. The NREGS guidelines provides for grievance redressal
mechanism and a toll-free number to make complaints, in case the problems
are not solved locally. It was found that in all the four study districts
complaints have been raised. People have had complaints; and workers have
had complaints as well. All these problems have been discussed, sorted out
and settled either at the Panchayat level or through the intervention of the
block level officials. No complaint has taken shape out of proportion to be able
to handle beyond the block level. The toll-free number available for making
complaints about mismanagement of the programme or individual grievances
is not known to many of the respondents present in the FGDs. As a result,
none of them could use the toll-free number meant for grievance redressal.
Transparency and Accountability
The response about transparency and accountability under NREGS in
all the four districts under study is identical and unwavering. They reported
that there is cent per cent transparency and accountability under the scheme

112
because monitoring is done regularly by VMC, Social audit team, Overseer /
AE, and the Panchayat officials.
Difference between NREGS and SGRY
How do people perceive the difference between NREGS and the
earlier SGRY – both aimed at employment generation at local level - but at
different scales and with varying implications and methodologies? This is one
of the vital points that required probing. The responses of the participants of
the FGD has been consolidated and presented here (See Box 5.9).
Relevance of the Scheme to the Panchayat
In Palakkad, Idukki, and Wayanad districts the programme was
reported to be very much beneficial to the Panchayat in general, and for the
rural community who are dependent on wage employment in particular.
However, it was reported from some regions of Alapuzha district (such as
Box 5.9: NREGA vs SGRY
NREGA SGRY
This is an Act with a legal guarantee for employment, being given operational face through a scheme called NREGS.
This is one of the schemes like any other scheme of the government.
One gets 100 days of guaranteed employment in a year.
There is no legal guarantee about providing employment.
It is possible everyone of the population, if they are willing can get benefited.
The allocation might be sufficient to meet about 40% of the people, even if more people wanted.
Imperative it should be labour intensive Emphasis is given to labour intensive work.
No involvement of contractors Housing works under SGRY mostly given to contractors.
Gram Sabha and Panchayat decide which works should be undertaken, and which one should be given priority.
The officials decide based on instructions and funds they received.
The Panchayat can decide to create sustainable community assets.
Works taken as piece meal.
People directly involved in planning as Gram Sabha is involved.
Plan comes from the top.
40% material cost; 60% labour cost There is no specification about labour component.
Registration, ID, muster roll for making corruption-free administration.
No muster roll.
Bank transfer of wages considerably reduces leakage of the funds reaching the poor workers.
Payment made by cash, which gives room for misuse while distribution.
Women’s participation high Men’s participation high.
Social Audit Official Audit

113
Kuttanad area) where the geographical condition was not conducive to take
works under NREGS. They demand revision in the guidelines of NREGS in
such a way that such regions, and people in such regions also benefit.
Convergence of the Scheme
In all the four districts under study, it was reported that convergence
with schemes / works of other departments take place. No district reported of
impossibility or difficulty in convergence. For example, (i) in Wayanad and
Palakkad districts convergences have taken place with departmental activities
of Irrigation, Agriculture, PWD (Highway), and Fisheries; (ii) in Alapuzha
convergence has taken place with Forestry Department; (iii) in Idukki district
convergences are reported of departments of Agriculture and Forestry.
Roles of various functionaries associated with NREGS
The successful implementation of the NREGS to great extent, depends
on active role of various agencies associated with the scheme. We could
identify the indispensable role of Grama Sabha, elected representatives
Kudumbashree and officials in-charge of implementing NREGS. We would
briefly state the role of each of the functionaries.
i) Grama Sabha: Grama Sabha is an important stakeholder of the project. It
recommends the works to be taken up under the project. It conducts social
audit on the implementation of the scheme. In addition, Grama Sabha is used
extensively as a forum for sharing information about the scheme. Hence, it is
essential on the part of the functionaries of the panchayat to ensure the
participation of the rural households in all the Grama Sabha meetings. The
focus group discussion with the various stakeholders revealed that
participation in Grama Sabha meeting has increased with the introduction of
NREGS in the state.
Survey findings reveal that around 93 per cent of the respondents
reported to have participated in the Gram Sabha meeting convened specially
to discuss the matters related to NREGS. District-wise analysis shows that the
participation of members is quite high in Alapuzha with 98.1 percent of the
respondents reported to have participated; followed by Wayanad with 96.3 per
cent; Palakkad with 92.9 per cent; and Idukki (86.3%). (See Table 5.36)

114
Table 5.36: Participation in Grama Sabha Meeting
Number of Respondents Districts Response Palakkad Idukki Wayanad Alapuzha Total
Participated 130
(92.9) 138
(86.3) 154
(96.3) 157
(98.1) 579
(93.4)
Not Participated 10
(7.1) 22
(13.8) 6
(3.8) 3
(1.9) 41
(6.6)
Total 140
(100) 160
(100) 160
(100) 160
(100) 620
(100)
Source: NREGA in Kerala - HH Survey
Figures in the parenthesis represent column percentage
Mere attendance in such meeting does not result in better outcome.
Participation needs to be active leading to better awareness on various issues
discussed in such meeting. Of the 579 members who participated in the
Grama Sabha meeting, 94 per cent of them were aware of the discussions on
various matters related to the operation of NREGA in their Panchayats.
The members who participated in the Gram Sabha meeting were found
to have discussed various aspects/issues related to NREGS. Prominent
among these aspects / issues include: Selection of worksite (44.5%), increase
in wages (23.7%), on-going work (19.7%), work timing (13.4%), work demand
(10.5%), facilities at the worksite (9.5%) and delay in payment (6.9%), (See
Table 5.37). District wise analysis shows that the respondents are found to
have discussed the rules and regulations of the scheme (Azhapuzha and
Wayanad). It can be seen from the table that the Grama Sabha has served as
a forum to discuss various issues related to the implementation of NREGA
scheme.
ii) Elected Representatives: One big way in which elected representatives
involve themselves is monitoring the execution of the work. This scheme has
made many ward members active because works are taken up in wards as
well. People who questioned the Panchayat Presidents have now started
questioning the ward members also, if a ward member was not active enough
to suggest works in their respective wards under the scheme.

115
Table 5.37: Matters Discussed on NREGS in Grama Sabha
Districts Matters discussed
Palakkad N= 140
Idukki N=160
Wayanad N=160
Alapuzha N=160
Total N=620
Selection of worksite 67
(47.9) 55
(34.4) 66
(41.7) 88
(55.0) 76
(44.5)
Wage increment 15
(10.7) 70
(43.8) 38
(23.8) 24
(15.0) 147
(23.7)
Ongoing Work 37
( 26.4) 31
(19.4) 27
(16.9) 27
(16.9) 122
(19.7)
Work timing - 16
(10.0 ) 33
(20.6) 34
(21.3) 83
(13.4)
Issue of Job Card 3
(2.1) 1
(0.6) 2
(1.3) 2
(1.3) 8
(1.3)
Delay in Payment 21
(15.0) 7
(4.4) 8
( 5.0) 7
(4.4) 43
(6.9)
Medical assistance - 1
(0.6) -
1 (0.6)
2 (0.3)
Worksite measurement 6
(4.3) 6
(3.8) 1
(6.9) -
23 (3.7)
Work demand 10
( 7.1 ) 11
(6.9) 26
(16.3) 18
(11.3) 65
(10.5)
Muster roll maintenance 1
(0.7) 2
(1.3) -
1 (0.6)
4 (0.6)
Problems of working with ADS/CDS/MATE
3 ( 2.1)
- 13
(8.1) 4
(2.6) 20
(3.2)
Worksite Facilities 12
( 8.6) 19
(11.9) 24
(15.0) 4
(2.5) 59
(9.5)
Increase of Employment days in NREGS
10 (7.1)
6 (3.8)
11 (6.9)
4 (2.5)
31 (5.0)
Monitoring of work 2
( 1.4) 4
(2.5) 2
(1.3) 3
(1.3) 11
(1.6)
Purchase of new tools - 2
(1.3 ) 1
(0.6) -
3 (0.5)
Rules and regulations - 1
(0.6) 8
(5.0) 28
(17.5) 37
(6.0)
Source: NREGA in Kerala - HH Survey
Figures in the parenthesis represent percentage to Number of Respondents
iii) Kudumbashree: Kudumbashree members are involved right from the
stage of registration of community members under NREGS for providing job
cards. They facilitate proper implementation of the scheme standing by the
Village Panchayats. They in fact, serve as a bridge between workers and the
Panchayat functionaries.
iv) NREGS Functionaries: NREGA Staff offer technical and non-technical
assistance, monitoring the worksite, assessment of the work, payment

116
facilitation, documentation, supervising the activities undertaken, guiding the
Panchayats wherever needed. All of them act as facilitators in the whole
process for the Panchayats to be able to implement the scheme successfully.
Performance of NREGS as perceived by the Rural Households
We have so far discussed the functioning of the scheme in selected
districts of Kerala with reference to start-up activities, registration, issue of job-
cards, provision of employment and the utilization of the scheme by the rural
households. We have also made an attempt to ascertain the effects of the
scheme on the income, expenditure, savings and migration of the rural
households, benefits accrued to the individual households and to the
panchayat. The functioning of the scheme and the outcome from the scheme
largely depends on the way in which various activities designed under the
scheme are implemented. The beneficiaries are the best judges in judging the
execution of various activities. Hence, we have attempted here to assess the
performance of NREGS as perceived by the beneficiaries with reference to
select variables. They are:
o Process of registration
o Issue of job cards
o Selection of works
o Relevance and usefulness of the work to the village people
o Execution of the work
o Quality of the work executed
o Supervision at the worksite
o Support of government officials
o Facilities at the worksite
o Mode of distribution of wages
o Transparency
o Grievance redressal
o Participation of people
o Benefits occurred to the panchayat
o Benefits to the household

117
Each of these variables was rated by the respondents on a five-point
scale ranging from very good to very poor. To quantify the rating, numerical
score is assigned to each of the items in the rating scale as given below:
Rating Score
Very good 5
Good 4
Satisfactory 3
Poor 2
Very poor 1
Based on the responses obtained from the respondents for each
variable under consideration, the average score in respect of each item
district-wise is arrived at and the results are presented in the Table 5.38.
The table indicates that the process of registration was done with
utmost care by the village Panchayat in almost all the four districts. The
aggregate average score is 4.34. Among the four districts the registration
process was carried out in a much better manner in Idukki (4.51) and
Wayanad (4.36) than other two districts. Focused Group Discussions with all
the stakeholders in the Grama Panchayats in all the districts revealed the best
practices adopted in this regard.
o Special Grama sabha meeting for NREGS was convened in each
panchayat and the participation of the people were ensured in all
the districts.
o Training sessions were arranged to make the Kudumbashree
members aware of the essential features of the scheme and they
were motivated to register under the scheme.
o Photographs were taken free of cost. For those residing closer to
the Panchayat office, it was arranged at the Panchayat office and
for those who live far away photographic sessions were arranged in
the respective hamlets.
o Ward level meetings were arranged in each ward under the
leadership of respective ward members.

118
o Efforts were also taken to conduct special meetings in SC/ST
colonies to ensure their active participation in the whole
programme.
Table 5.38: Performance of NREGS as perceived by the beneficiaries (District wise Scoring)
Performance Scores Districts
Variables Palakkad Idduki Wayanad Alapuzha Total
Process of registration 4.25 4.51 4.36 4.23 4.34
The issuance of job cards 4.18 4.27 4.35 4.17 4.24
The Selection of Works 3.88 4.46 4.03 3.75 4.03
Relevance and usefulness of the work to the village/people
4.06 4.31 3.93 3.95 4.06
The Execution of Works 3.86 4.21 4.01 3.74 3.96
Quality of the work executed 3.79 4.16 3.96 3.91 3.96
Supervision at the worksite 4.14 4.44 3.93 4.24 4.19
Support of govt. officials 3.81 4.26 4.25 4.29 4.16
Facilities at the worksite 3.44 3.19 3.63 3.81 3.52
Mode of the distribution of wages
3.33 3.91 3.79 3.79 3.72
Transparency 3.78 3.82 3.96 3.59 3.79
Grievance redressal 3.63 3.82 3.75 3.48 3.67
Participation of people 3.99 4.51 4.19 4.34 4.26
Benefits accrued to the Panchayat
3.88 4.43 4.29 4.33 4.24
Benefits to the household 3.72 4.69 4.26 4.43 4.29
Source: NREGA in Kerala - HH Survey
Figures in the parenthesis represent column percentage
With regard to the issue of job-cards, the respondents rated the
performance as very good in all the four districts. The average rating score
ranged between 4.17 and 4.35. This shows that the registration and issue of
job-cards were done to the satisfaction of the primary stakeholders of the
programme.
The selection of works under the scheme by various panchayats has
been rated as very good – the average score being 4.03. District-wise
analysis shows that the respondents in Idukki were found to have rated highly

119
the selection of work, compared to other districts. Focused Group Discussions
with the stakeholders in all Grama Panchayats revealed that works to be
taken up were decided by the people in the Grama sabha meeting. Every item
of work was decided based on the consensus arrived at in the meeting.
Regarding relevance and usefulness of the works to the people and to
the village, the respondents rated it as very good. District-wise analysis shows
that respondents in Idukki District are found to have given high rating for this
variable when compared to other districts. It means functionaries in-charge of
NREGS selected only those works which are relevant and useful to the
people.
The execution of work and the quality of work executed has been rated
as ‘good’ in general - the score being 3.96. District-wise analysis indicates
that respondents in Idukki have given a higher score and rating as very good.
The FGDs across the panchayats support these findings. The workers are
quite conscious of the fact that they need to work hard to earn minimum
wages assured under the Act. Hence, they sincerely worked which inturn
resulted in creation of productive assets. The quality of such assets created
has been rated only as ‘good’ which means there is room for improvement.
Supervision at the worksite was, by and large, rated as ‘very good’ by
the respondents in all districts expect the Wayanad district where it was rated
as ‘good’. The FGDs revealed that the scheme has evolved a good system
of supervision at the worksite. The salient features of the system are stated:
o The advisory committee is responsible for: i) screening the
proposals and giving necessary suggestions regarding the work; ii)
purchasing of necessary materials to carry out the work; iii) solving
the problems if any, in the work site; iv) monitoring the ongoing
works; v) redressing the grievances of the workers; and vi) guiding
them to work appropriately.

120
o There has been constant monitoring and support from the block
level functionaries. District level functionaries have also visited the
worksites. District, state and central level functionaries have made
visits to the worksites in panchayats in all the four districts.
o Vigilance and Monitoring committee acts as an effective mechanism
to keep track of the works under NREGS. Vigilance and Monitoring
committee - consisting of a ward member, farmers, women
representatives, social worker, representatives of SC/ST and a
retired teacher - play an effective role in supervising the work.
Regarding the facilities at the worksite, the respondents from all the
four districts rated as ‘good’. However, the degree varied, in Idukki and
Palakkad, a sizeable percentage of the people stated that they are satisfied
but still there is scope for improvement in this regard. People in two other
districts felt that it is good but it can be improved keeping the welfare of the
people engaged in NREGS work. The focus group discussion revealed that
shed for dressing, drinking water, toilets, first aid box with necessary
medicines and tools are available at the worksites in all the four districts. In
Alapuzha rain caps and gloves were provided. In some worksites, tea was
served.
Regarding distribution of wages, respondents rated it as ‘good’ in
almost all the districts - the average score being 3.72. It is understood from
the FGD that wages were paid only through bank accounts. In some places
the ADS members who are appointed as mates help the workers in accessing
the money. Incidence of delay in getting wages was reported. The reason as
attributed was delay in processing muster rolls.
Support and guidance of the government officials, especially from BDO
and DPAU is quite essential for the smooth implementation of the scheme.
The respondents rated the support from officials as very good – the average
score being 4.16. District-wise analysis indicates more or less similar ratings
except Palakkad.

121
Transparency is another important factor which brings quality to the
implementation of activities by avoiding misutilization and misappropriation of
funds under the scheme. Respondents have given a score of 3.76 for
transparency-rating is good. The responses at the FGD about transparency
and accountability under NREGS in all the four districts under study were
identical and unwavering. They reported that there have been cent percent
transparency and accountability under the scheme.
Grievance redressal is yet another aspect which assures smooth
implementation of the scheme. Grievances arise in respect of timing, the
quantum of work done, work turn out of the other members of the group and
payment of wages. Timely redressal is important to keep the programme
going as envisioned. It was found that in all the four study districts complaints
have been registered. All the grievances have been addressed, sorted out
and settled either at the Panchayat level or through the intervention of the
block level officials. No complaint has taken the shape that could not be
handled locally. The performance of the scheme with reference to grievance
redressal has been rated as ‘good’ – average score being 3.67. District-wise
analysis indicates more or less the similar rating.
With regard to benefits accrued to the Panchayats and to the people,
the respondents rated the performance of the NREGA as “very good” except
in Palakkad indicating multiple benefits accrued to the individual and to the
panchayats.
Conclusion
The National Rural Employment Guarantee Scheme is being
implemented in all the 14 districts of Kerala. The scheme has been slowly
and surely taking deeper roots in Kerala with the active participation of a
strong local government having time tested experience in local level planning
and development. The start-up activities initiated at different levels have
helped in launching the scheme smoothly. The level of awareness among the
households about the scheme, its components and its salient features is quite
high, which can be mainly attributed to the efforts taken by functionaries at
different levels to take the scheme to every nook and corner of rural areas.
Though there was some initial inertia in registration, the process of

122
registration picked up later, due to special efforts made by the panchayats
and Kudumbasree. All the households registered under the scheme received
the job cards free of cost. There has been delay in issuing job cards due to
lack of staff and internet facilities and non-production of ration cards by the
workers.
The works under the scheme have been selected in special Gram
Sabha meetings convened at the ward level. Works selected are prioritized
based on the felt needs of the public. The functionaries of the Panchayat and
ADS/CDS create an enabling environment for the workers to demand work.
Around 95 per cent of the respondents sought the work. Of them around
three-fifths received dated receipt. Majority of the respondents were able to
get the employment within the stipulated period of 15 days. The average
number of days employed has registered an increasing trend in all the districts
though there are variations among the districts. SC/ST households have
been able to make use of the scheme better. They have high average number
of days employed when compared to others. 14 per cent of the total
households were employed for 100 days. Wayanad leads with 30 per cent of
the households employed for 100 days.
Majority of the respondents were found to have involved in road works
followed by flood control and protection, irrigation canals, land development
and renovation of traditional water bodies. A vast majority of the workers
were able to get work within a radius of 3 km from their residence. Working
hours vary across the districts. The NREGS functionaries have tried their level
best to provide the facilities at the worksite as per the provisions of the Act.
However, majority of the workers felt the facilities were inadequate.
Men and women were able to get the minimum wage prescribed by the
state government. Wages are distributed thro’ banks/post offices. Majority of
the respondents were able to get wages within a period of 15 days. There are
incidents of delay beyond one month. Women earned better wages under
NREGS when compared to wage rates prevailed locally. Wages earned by
men under NREGA are much lower when compared to prevailing wages. The
scheme has discernible impact on the income, expenditure, savings and
migration of the rural households. It has empowered the women in social,

123
economic and political fronts. The scheme has also yielded many benefits to
the individual households and panchayats. The functionaries have ensured
that essential components of the scheme such as social audit, grievance
redressal, transparency and accountability are grounded and practiced. The
performance of the scheme as perceived by the rural households in selected
district is found to be ‘very good’, indicating the good work done by
functionaries of the scheme at different levels.
* * * * *

124
Chapter - 6
Summary of Findings and Inferences
Introduction
The National Rural Employment Guarantee Scheme, the first ever
scheme that guarantee wage employment at an unprecedented scale was
introduced through an Act known as “National Rural Employment Guarantee
Act” notified on September 07, 2005. Implemented in a phased manner, the
programme was launched in 200 districts in February 2006, 130 more districts
in 2007-08 and in 285 districts in April 2008. The budget outlay for the
scheme was Rs.30,000/- crores in 2008-09. Inspite of certain problems and
shortcomings in the implementations of the scheme, the scheme has yielded
discernible benefits to the rural households, which include guaranteed
employment, assured income, equal wages to women, ensuring minimum
wages prescribed, and security of access to livelihood opportunities.
Purpose and objectives of the study
The scheme was introduced in two districts of Kerala in 2006. It was
subsequently launched in the remaining 12 districts. Almost four years have
elapsed since the inception of the scheme. How does the scheme performed
with reference to activities envisaged under the scheme? What are the output
and outcome of the scheme? What are the changes that the scheme has
brought in the lives of the people? What are the problems in implementing the
scheme? These are some of the pertinent questions and prominent issues
which the study attempts to address.
The primary objective of the study is to analyse the functioning of
NREGS encompassing all its essential aspects. The specific objectives are to:
i) analyse the extent to which the scheme has guaranteed employment and
livelihood to different sections of rural households; ii) assess the quality of
assets created and their likely impact on agrarian economy; iii) ascertain the
impact of the scheme on the socio-economic conditions of the people; iv)
asses the limitations and constraint faced by the functionaries in implementing

125
the scheme; and v) identify the problems faced by the various participants in
the scheme.
Methods
The study employed a mix of methods to address the objectives laid
down. A comprehensive household survey using pre-tested interview
schedule was conducted among the rural households. Qualitative methods
such as focus group discussion, case study and interview with key informants
were used to supplement and complement the data and information collected
through survey.
Sampling
Multi-stage sampling technique was used to select the sample for the
study. Four districts viz., Palakkad, Wayanad, Idukki and Alapuzha were
chosen based on extensive discussion with the officials at the State level. The
criteria followed to select the districts were: i) geographical location; ii) period
of implementation; and iii) performance of the district. Two blocks were
chosen from each panchayat. The criteria adopted were: i) performance of the
block; ii) concentration of SC/ST households; and iii) concentration of
agricultural labourers. From each block, four panchayats were selected,
(except one where there are only three panchayats). From each panchayat,
20 respondents (beneficiaries) were chosen at random. The sample for the
study includes four districts, eight blocks, 31 panchayats and 620
beneficiaries.
Profile of Kerala State and selected districts
Kerala is a small State constituting 1.18 percent of total landmass of
the country. The State has three distinct regions viz., eastern high lands,
central midlands and western coastal lands. The average annual rainfall is
3107 mm. Kerala is endowed with rich natural resources and is known as
‘Gods own country’. The State has 14 districts, 63 taluks and 999 panchayats.
The State has a population of 3.18 crores - the density of population being
819 people per sq.km. Around three-fourths of the population live in rural
areas. Tribals constitute 1.84 percent of the total population. Their
concentration could be found in Wayanad, Palakkad and Idukki. The

126
proportion of people in working age group is 63.4 percent. The state has the
highest literacy rate, the lowest IMR and MMR and the highest life expectancy
in the country. The poverty ratio is low with 15 percent. A good proportion of
its population is confined to agriculture and agro-based industries. More than
half of the labour force of the age group of 15-29 is unemployed.
Palakkad is one of the largest districts in Kerala. It has 5 Taluks, 90
panchayats with 144 villages. Population density of the district is 584 persons
per sq. km. It has a sex ratio of 1066. Literacy level is quite high with 84.35
percent. It is one of the main rice producing regions in Kerala. It has fairly well
developed industrial sector with 1975 factories. The worker participation rate
is 36.11 percent. The per capita income is Rs.18,031/-. BPL household
constitutes 52.13 percent of the households in the District.
Wayanad, known as ‘Green Paradise’, has a rich forest cover. It has
three taluks, 25 panchayats with 48 villages. The density of population is 369
persons per sq. km., which is much lower than the State average. Wayanad
has the highest concentration of tribals, constituting 17.1 percent of the total
population of the district. The worker participation rate is 39.53 percent. The
per capita income is Rs.34,123/-. The BPL households account for 49.87
percent of the total households.
Idukki, marked by undulating hills and valleys, is the second largest
district of Kerala. The district has four taluks, 51 panchayats with 64 villages.
It has the least population density of 259 persons per sq. km. among the 14
districts of Kerala. It has a high concentration of ST households. Many of the
ST population are working as agricultural labour in tea and cardamom
estates. Worker participation rate is 39.71 percent. Poverty ratio is 15 percent.
The recent agriculture crisis has resulted in increased risk of more households
falling into poverty.
Alapuzha, district lies in the eastern coastal plains of the State. The
district has 6 taluks having 75 panchayats with 91 villages. The density of
population is the highest in the state with 1489 persons per sq. km. The SC
population constitutes 9.45 percent of the total population. The district is
densely covered with waterways. The economy of the district primarily

127
depends on agriculture and fisheries. More than 20 percent of the total area is
water logged. It is a backward district with low per capita income. The worker
participation rate is 34.30 percent.
Socio-economic profile of the respondents
The sample households numbering 620 has a total population of 2592
with an average size of family of 4.18. The female population constitutes
50.42 per cent indicating slightly high sex ratio. Two-third of population among
the sample population is in the productive age group of 19-60 years. 4.5 per
cent of the population is disabled.
Around 30 per cent of the sample households belong to SC/ST; SC
alone accounts for 12 per cent; and the rest are from other communities.
The literacy rate is around 92 per cent. The sample households in
Alapuzha have the highest literacy with 99 per cent followed by Wayanad with
94 per cent.
Around 90 percent of the sample households have own houses.
Majority of them (79%) live in asbestos / tin / tiled roof houses. Around 10 per
cent live in IAY houses. Around four-fifth of the houses are electrified. 83 per
cent have access to safe drinking water and have toilet facilities.
The working population constitutes 64 per cent of the total population.
The main source of livelihood is agriculture labour (31.2%) followed by
NREGS (16.5%) and farming (11.4%). NREGS as the main source of
livelihood is quite high (29%) in Wayanad when compared to other districts.
NREGS has emerged as the major subsidiary occupation for two-thirds of the
working population.
Around two-fifth of the households possess some kind of livestock. The
human-animal population ratio is very low (1:01) and it is reported to be
improving after the introduction of NREGS.
Around 20 per cent of the households do not own any household
assets. 50 pre cent own cellphone and television; one-third of the sample
households have LPG connection.

128
Around one-third of the sample households have an annual income of
less than Rs.24,000/-, indicating prevalence of poverty. The incidence of
poverty in terms of income was high in Alapuzha followed by Palakkad, Idukki
and Wayanad. The expenditure pattern reveals that a large amount was spent
on food followed by education, clothing, medical expenses and servicing of
debts.
The main sources of borrowing for the sample households are SHGs
and formal institutional sources such as cooperatives and commercial banks.
Money lenders are found to be marginalized. Households have borrowed for
investment and consumption purposes at a normal rate of interest.
The incidence of migration could be observed in all the districts; but it
was comparatively high in Palakkad. The main reasons are lack of
employment during the off-season, education of children; and better wages.
To sum up, the sample households hail from poor to moderate socio-
economic background
Performance of NREGS
With more than a decade long experience in local planning and
development, the state of Kerala has been in a unique position of taking the
full responsibility of the implementation of NREGS. The government has
consciously made use of the Scheme not only to provide secured livelihood
opportunities to the rural poor but also to strengthen the resource
regeneration in forest areas, river basins and watershed areas as the state
has very little public lands.
Implemented in three phases, the scheme is now in operation in all the
fourteen districts. Number of households registered under the scheme
recorded seven-fold increase over a period of four years. The percentage of
households employed has shot up from 11.3 lakh to 43 lakh – roughly around
four fold increase. Person-days employed witnessed a fifteen fold increase
from 11.30 lakh in 2006-07 to 155.87 lakh in 2008-09. Of the total persons-
days, 80 percent was constituted by women person-days, indicating high
participation of women in the scheme. The scheme has been picking up

129
slowly, steadily and surely in the State of Kerala though there were some
initial apprehensions about the feasibility of the scheme.
Start-up activities and awareness about the scheme
The government initiated several start-up activities to spread the salient
features of the Act and the Scheme among the public. The core activities are:
i) training the various functionaries of the scheme at different levels,
ii) organizing meeting among the stakeholders in different settings to ensure
that the “last are put first” under the scheme, iii) organizing exclusive Gram
Sabha meeting on NREGS, iv) involving various types of community based
organizations and formal institutions like co-operatives, v) employing a wide
spectrum of audio-visual methods and techniques to popularize and
propagate the essential elements of the scheme.
Panchayats, SHGs, friends and relatives and neighbours are found to
be the key sources of awareness – ofcourse the government playing the role
of a facilitator behind the curtain. Other main sources of awareness include
print and electronic media. A very high level of awareness could be noticed
among the sample households about the essential features of the Act and the
Scheme such as: 100 days of guaranteed employment, equal wages for men
and women, minimum wage rate, payment within a fortnight, role of Gram
Sabha, worksite facilities and medical assistances at the worksite and so on.
Registration and issue of job cards
Every household should get registered with the panchayat to get
employment under the scheme. Measures taken to get the people registered
are: i) distribution of applications for registration at the doorsteps of
beneficiaries; ii) constitution of special team to quicken the process of
registration among the tribals; and iii) convening ward level meeting and
special meeting in SC/ST colonies.
The respondents were found to have registered under the scheme in
different spells. There were certain initial hurdles in registration. They are: i)
the nature and type of work undertaken under the scheme was a restricting
factor for some; ii) lack of awareness in some villages; and iii) better off

130
households who would sustain without the employment assured under this
scheme did not come forward.
All the households registered under the scheme were issued job cards
free of cost. Around 50 per cent of the sample respondents were able to get
the job card within a period of 15 days. It took more than 15 days in the case
of remaining respondents indicating the delay in issuing of job cards. The
main reasons for the delay are: i) failure on the part of the households to
provide the required documents; ii) lack of adequate staff and internet facilities
with the panchayats; and iii) scattered location of houses resulting in poor
communication in certain parts of the districts.
Job cards are computerized. The process of issuing job cards has
been made easy. No fee is found to have been charged for job cards. The job
cards are with the workers. They are insisted to bring the job cards to the
worksite
Identification of Works
The works to be taken-up under the scheme in each panchayat have
been discussed and decided in Gram Sabha meetings. Ward-wise meeting
convened by the panchayat has greatly helped in incorporating the ‘voice’ of
the people in selecting the works. Area Development Society was found to
have played an important role in facilitating the people and panchayats in the
selection of works. The works identified are prioritized by the panchayat.
Priority differs from district to district as each district is found to distinctively
differ in geographic conditions.
The panchayats do come across certain problems in identifying the
works. Prominent among them include: i) boundary dispute in the selected
worksites; ii) suggestion of works by the people, which do not fall under the
purview of the Act; and iii) inability of the panchayats to strictly adhere to the
guidelines as the works could not be identified as per the provisions of the
Act.
Demand for employment
All the households registered under the scheme did not participate.
There are inter-district variations. For instance, in Idukki, 50 per cent of the

131
registered households participated while in Palakkad 55 per cent of the
registered workers participated in NREGS. However, of the 620 sample
respondents of the study, 95 per cent reported they got employment under the
scheme. Whenever registered households demanded employment, they
should be given a dated receipt. 57 per cent of the sample respondents got
the dated receipt. District-wise analysis shows that majority of the
respondents got dated receipts in Alapuzha, while in Idukki, less than 25
percent of the respondents got it.
Each job seeker should be given job within 15 days from the date of
receipt of application. Majority of respondents (71.2%) got job within the
prescribed period. Wayand leads among the districts with average time lag of
12 days followed by Idukki with 21 days. One-third of the respondents
reported to have experienced delay. Of them four per cent got unemployment
allowances.
Execution of Work
The work under the scheme have been executed through a well
defined process which include; i) identification of work, ii) preparation of
people’s estimates by engineers, iii) project initiation meeting, iv) citizen
information board, v) provision of implements, vi) arrangement of worksite
facilities, vii) maintenance of muster rolls, viii) maintenance of worksite diary
by mate, ix) implementation of work, and x) documenting the work executed.
The various steps in the process have been meticulously followed in all the
selected panchayats.
Average number of days employed
The average number of days employed per households has increased
from 23.6 days in 2006-07 to 61.5 days in 2008-09 in Wayanad. In Palakkad
the average number of days employed per household has increased from
12.8 days to 53.2 days during the same period. Both these districts, where the
scheme was introduced first, performed relatively well. The progress has been
slow in Alapuzha and Idukki.
The SC/ST households were found to have made use of the scheme,
better when compared to other communities. The average number of days

132
employed per SC/ST households was higher than the other communities in
Wayanad, Idukki and Alapuzha.
The number of households employed for 100 days in a year has
registered an upward trend. Wayand leads with 30 per cent of the households
employed for 100 days, followed by Palakkad with 20 per cent in 2008-09.
The other two districts are late starters. Their progress is slow in this regard.
Participation in various items of work
The major items of work in which the respondents found to have
participated include, road connectivity (56.4%), flood control and protection
work (35.5%), irrigation canals (26.6%), renovation of traditional water bodies
(22.6%) and water conservation and water harvesting (19.4%). However, inter
district variations are observed in this regard. In Idukki and Wayand, majority
of the respondents are found to have participated in the works related to road
connectivity. In Alapuzha majority have participated in flood control and
protection work and cleaning of irrigation canals. In Palakkad, the participation
was found to be high in renovation of traditional water bodies.
The distance between the place of resident and worksite as reported
by majority of the respondents was less than 1 km. It hardly exceeds the
permissible limit of 5 km. A vast majority of the respondents (95%) have been
able to reach the worksite by walk. Very few used other modes of transport.
The work as reported by a vast majority of respondents commences at
8 am and closes at 5.00 pm with a short lunch break. The timing is not
suitable to households in Alapuzha. They are accustomed to starting and
closing the work early (6.30 am to 1.30 pm) due to hot weather during the
afternoon.
The basic facilities as stipulated in Act are made available in the
worksite. However workers are not satisfied with the facilities. In certain
districts viz., Idukki, Alapuzha and Palakkad, the facilities required by the
workers at the worksite include, shade for dressing and resting, first-aid box,
supply of tools, toilet facilities and drinking water. Around one-third of them
suggested tea and snacks can be provided at the worksite free of cost.

133
Majority of the respondents (75%) did not face any problem at the
worksite. The rest did face some problems which include: i) tools are not
good, ii) snakebite at the worksite and iii) difficulty in continuously working in
water bodies. Women have come across certain specific problems. They are:
i) They are not able to strictly follow time schedule; ii) a few are not
accustomed to physical work; iii) tools are too heavy to carry; and iv) toilet
facilities are not made available in certain worksites.
Payment of wages
Muster rolls are maintained by the mates at the worksite. The mates,
who are drawn from Kudumbasree are well trained in all the essential aspects
of NREGA. Wages are paid after measuring the work. Overseer/engineer
assisted by mates measure the quality of work. They visit the worksite and
measure the work usually after completion of the muster rolls. The wages are
distributed through banks/post offices.
The NREGA workers are to be paid minimum wage prescribed under
the Act. 98.4 per cent of the respondents were aware of the minimum wage
fixed by the state government. District-wise analysis indicates that all the
respondents in Wayand and Alapuzha are aware of the minimum wage. The
respondents are also aware of the mode of fixation of wage under the
scheme. High level of awareness can be attributed to meticulous planning and
execution of start-up activities, training, involvement of Kudumbashree and
high level of literacy rate.
99.4 per cent of the respondents reported that they received wage rate
of Rs.125/-per day which shows that all of them were assured of minimum
wages prescribed by the state. All the respondents received wages in ‘full’. No
incidence of under payment and non-payment was reported.
Wages are to be paid within a period of 15 days from the date of
completion of work. Little less than two-third of the respondents have received
wages within 15 days. The rest got wages only after 15 days. Wayand has the
lowest time lag of 12.57 days, between date of completion of work and receipt
of wage, followed by Alppuzha with 20.86 days. The reasons for the delayed
payment as reported in the focus group discussion are: i) lack of staff; ii) delay

134
in providing muster rolls; iii) delay in measurement and iv) lack of monitoring
by panchayat.
Wages earned by men under NREGA was much lower when compared
to wages earned elsewhere. The average wage difference was Rs.74/-. In
certain districts like Alapuzha wages in the market for men is double the
wages under NREGA. However, for women the wages under NREGA was
better. The average difference was as high as Rs.38 in Palakkad.
Impact of NREGA
There has been substantial change in the household income after the
introduction of NREGA. The change in the average income was found to be
much higher in Idukki with Rs.2601/- followed by Alapuzha with Rs.2093/-.
NREGA has impacted on the expenditure of households. Majority of
the respondents reported that their family expenses increased in proportion to
the increase in family income. Increase in family expenditure was high in
Idukki (Rs.2369/-). The average increase in family expenditure for all the
districts put together is Rs.1172/-.
The wages earned under NREGA was spent on a variety of purposes
such as household activities, education, buying of assets, purchase of food
grain, hospital expenses, payment of old debts and so on. Majority of the
respondents (47.9%) reported that they spent the NREGA wages for
household activities, education (33.5%), purchase of food grains (30.3%) and
medical expenses (22.6%).
The scheme has impact on savings too. Around 45 per cent of the
households have savings of less than Rs.1250/-. The average savings per
household was Rs.563/-.
There has been increase in the livestock population after the
implementation the scheme. The increase is marginal as reported by the
respondents.
The scheme has empowered the women in social and economic
domains. Participation of women in large number in the scheme and in the
Grama Sabha meeting, the wages earned by them under the scheme, their

135
connectivity to the external world through NREGS especially with banks,
government functionaries and local government etc., have improved their
status in the family and community. The women felt a ‘change’ in their status
after the introduction of the scheme.
The scheme has helped in bringing down the level and intensity of
migration as reported by one-fifth of the respondents. The effects of decrease
in migration was found high in Idukki (42.5%) followed by Palakkad (17.1%)
and Wayanad (16.3%).
Box 6.1: NREGA enhanced the credibility of the poor
Mercy Joseph Pantrandil, a resident of Edathuva Gram Panchayat is a beneficiary of AAP (Anthyodaya Anna Poorna) scheme. Her family comprises of her mother- in-law, husband and two children. Before the introduction of the scheme in Allapey District, the family had to depend only on the income earned by Mercy’s husband Mr. P.Joseph, who is an agricultural labourer. As Mercy’s mother-in-law is a heart patient, a major part of the income had to be spent to meet her medical expenses. The NREGA was introduced in her area in the year 2008. In the beginning, Mercy was reluctant to register and work under NREGS, as she is not used to the type of works taken up in Kuttanadu area of Kerala. Even her friends discouraged her from taking up such works. But, she was convinced of the benefits of the scheme; registered herself under the scheme; and started working. She said that she could pick up the work so fast and she started benefiting from the scheme. The wages she earned under the scheme has been spent on meeting the medical expenses of her mother-in-law and the day-to-day household expenses. Besides, she also bought 4gms of gold and bought a goat. She could also utilize a part of the wage she got from the scheme to construct the kitchen. Mercy said that, everyone is now willing to lend money as her debt servicing capacity has increased due to the improved income through NREGS.
Benefits of NREGA
NREGS has brought in several benefits to the households. Important
among them as perceived by the households are: improved family income
(23.2%); improved household expenses (24.5%), guaranteed employment
(10.8%), payment of children education fee (11.6%), improved family status
(9.4%) and so on. The members participated in the FGD across the
panchayats invariably expressed the fact that the scheme has guaranteed
employment with an annual income of Rs.12,500/-.

136
Box 6.2: NREGA Lends a Helping Hand to the Victim of Agrarian Crisis
Prasanna Gopi of Poothady Panchayat in Wayanad district will never forget 5th
August 2005. It was the day when her son Prajeesh joined 11th standard and her husband
Mr. Thadathil Gopi committed suicide. Gopi used to work as an agricultural labourer on a daily wage basis to earn his living. The agrarian crisis in Wayanad area gave a rude shock to his livelihood source. As a result he borrowed from private bank and local money lenders. He could not service his debts resulting in soaring of interest charges. He committed suicide as many did so in Wayanad area. Prasanna lost the only bread winner of her family. She struggled very hard to find work to support her family consisting of two sons. It was at that juncture NREGA was launched in Wayanad. She came to know about the scheme through the panchayat and registered herself under the scheme. She has been very active participant in the scheme. She worked for 100 days in 2007-08 and also in 2008-09. She is quite happy now. She has assured employment. Her sons are attending school. She could bear the educational expenditure of her sons. She does not have any problem in meeting day to day expenses. In fact she has started saving some amount of money out of the wages earned under NREGA.
Box 6.3: “I need not go with empty stomach with the introduction of NREGA”
Vallyammal (39 years old), wife of Ranganathan (46 years old) belongs to Puthur Panchayat of Attappady block, Palakkad district. Vallyammal’s family consists of her husband Ranganathan, who is an agricultural labourer, their daughter Krishnaveni, who is studying in higher secondary and their son Sreenath who is in middle school. They have one and a half acres of dry land which is not amenable for cultivation. Before the introduction of the NREGA, Ranganathan, the head of the family was the only bread- winner and they find it really hard to make both the ends meet with meager and erratic income. Vallyammal has a strong conviction that a scheme like NREGA is a boon to families like theirs. After the introduction of the scheme, she got 100 days of employment every year under the scheme. She is happy that she could make use of the provision of the scheme to the fullest extent. The works in which she participated includes, construction of rain pit, retaining wall, check dam, and renovation of traditional water bodies like ponds and river. She got a minimum wage of Rs.125 per day and earned RS.12, 500/- per annum. She could get an amount of Rs.37,500/- over a period of 3 years. She said that she made use of the money mostly to meet the household expenses and educational needs of her children. Vallyammal reported that she had to go with an empty stomach in order to provide food to her children, before the introduction of the scheme. It is now a thing of the past and all the members of the family are assured of food. She had completed 42 days of employment in the current financial year (up to September 2009) and she is confident that she could find 100 days of employment by the end of the financial year.

137
Box 6.4: Water-body retained
Kolukkapara (Ward no.4) of Kozhinjampara Grama Panchayat is a remote village. Majority of the households are engaged in agriculture and agriculture labor. The village has experienced water scarcity both in agriculture and domestic purpose.The village has a traditional tank (Thenakulam) which is almost silted. There is a Vinayakar temple adjacent to the pond. The pond was a source of water for domestic and agricultural purposes. The people of Kolukkapara identified desilting of Thenakulam as one of the items of work that could be taken up under NREGS. The subject was discussed in Grama Sabha and it was included in the schedule of work.The work was taken up on 1
st Oct. 2008 and completed
on 17th Dec 2008. The size of desilted pond is 100m x 82m x 5m. 141 laborers worked for
45 days, of whom130 were women and 11 were men. Of the total workers 29 of them belonged to SC. The pond was desilted; follow-up activities such as construction of retaining wall, steps etc. were taken up and completed. The panchayat has taken up the task of cleaning the channels and pond on a regular basis. Around 100 families got benefited in the form of water for cultivation, water for domestic use and cattle. People felt that the pond would not have been desilted but for NREGS.
Box 6.5: NREGS Empowered Socially Marginalized Woman
Mrs. Omana, aged 57, has studied up to 8th standard. She has 3 daughters. She
owns a house provided under IAY. She is an agricultural laborer and a member of Kudumbashri. Her husband fell down and subsequently affected mentally. She came to know about NREGS in 2008 thro’ panchayat and government officials. She registered herself; received job card and applied for work. She got work within the stipulated period and worked for 24 days in 2008 – ’09 and 36 days in the 2009 – ’10 (up to Oct. 15
th 2009). She has participated in works such as cleaning either side of road,
cleaning of drainage, desilting of river etc. She has spent the wages earned on purchasing of food grains and milk, payment of electricity bills and meeting medical bills. She has also started repaying the old debts. She said that the scheme is very relevant in remote areas as it not only provides assured employment, but also empower socially marginalized women like her.
The scheme has also brought benefit to panchayats. The benefits as
reported by respondents and reiterated in the focus group discussions
include: maintenance of road, renovation irrigation canal and channel,
creation and renovation of water bodies like tanks, ponds and wells, rainwater
harvesting, improved water resources and so on.
The works taken up by the panchayats have brought may changes.
The road works carried out enabled the panchayats to develop better
connectivity between villages and urban centres. The soil and water
conservation activities helped in recharging the ground water which in turn
resulted in improved irrigation facilities. The clearance of drainage channels
helped easy flow of water and in draining the excess rain water.

138
The respondents reported that there is appreciable change in the
relationship among the NREGS workers. (See Box 6.6). Improved relationship
is a sign of creation of social capital in the villages which in turn would help to
have better access to other sources of capital.
Box 6.6: NREGA facilitated socialisation
Rasheed (34 years) is from Thavinhal Grama Panchayat of Wayanad district. He is mentally ill. His family comprises of his father, mother, wife, sister and niece. Before the introduction of NREGA, Rasheed’s main source of livelihood was cattle rearing and he could always be seen with a herd of cattle. His father became sick and was bed – ridden. The health of his mother too was deteriorating. The entire family was depended on Rasheed’s income. There was no other choice for Rasheed than to take up a better work which would earn him more money. When NREGS was introduced in Thavinhal Panchayat, Rasheed registered under the scheme and started working under the scheme. The scheme provided a great deal of opportunity to socialize with others which has brought the changes in him. His illness too diminished gradually. At present, he is a family man works enthusiastically and earns a livelihood for the whole family through NREGA.
Social Audit
Social audit has been conducted in all the four districts. Social audit
teams consisting of 12 members have been formed in all the panchayats as
per the guidelines of NREGS. The teams are found to have perused the
records, interacted with beneficiaries and functionaries, visited the worksites
and monitored the works, crosschecked the muster rolls, wages received for
each work and completed all the works essential to complete the process of
social audit. The team has prepared and submitted the social audit report to
Grama Sabha for approval. The approved reports have been submitted to
appropriate authorities.
Grievance redressal
Complaints raised are solved then and there. No complaints has taken
shape out of proportion to be able to solve locally. The toll free number
available for making complaints about mismanagement of the programme on
individual grievance is not known to many of the respondents. As a result,
none of them could use the toll-free number meant for grievance redressal.
Convergence
Convergence of schemes of different departments could be observed.
Convergence has taken place with departmental activities of irrigation,

139
agriculture, highway and fisheries in Wayanad and Palakkad districts.
Convergence with Forest department has taken place in Alapuzha.
Convergence is reported of Department of Agriculture and Department of
Forestry in Idukki District.
Roles of various functionaries
Grama Sabha has played a very active role in initiating and
implementing various activities under the NREGS. Participation in Grama
Sabha meeting was quite high and the members actively participated in
deliberations related to NREGS works such as selection of worksite, payment
of wages, monitoring of on-going works, work timing, measurement of
worksite and so on. Elected representatives involve themselves in monitoring
the works undertaken and execution of the work. Kudumbasree members get
involved at different stages of NREGS. They serve as a bridge between the
workers and the panchayat. NREGA staff offer technical and non-technical
assistance and act as facilitators in the whole process for the panchayat to be
able to implement the scheme successfully.
Performance of the scheme as perceived by the respondents
The performance of the scheme with reference to variables such as
‘process of registration’, issues of job-card, selection of work-site, relevance of
the works selected, supervision at the work-site, support of government
officials, participation of people, benefits accrued to the panchayat and to
households have been rated as ‘very good’ by the respondents. However, the
performance of the scheme with reference to aspects such as execution of
work, quality of work executed, facilities at the worksite, mode of distribution
of wages, transparency and grievance redressal has been rated as ‘good’
indicating the scope for improvement. There are however, inter-district
variations in the performance as perceived by the respondents.
Conclusion
The study carried out in Kerala has its focus on assessing the
performance of the NREGS in Kerala. The study has covered a sample of 620
respondents selected at random in 31 panchayats, spread over 8 blocks in 4
districts. The study has employed a mix of methods in order to gather both

140
quantitative and qualitative data and information that would help objectively
analyse the performance of the scheme in the state. The scheme has been
implemented in three phases - two districts in first phase, two districts in
second phase and the rest in the third phase. Kerala with its pioneering
experience in local planning and development has been able to effectively
ground all the essential activities specified under the NREGA. The scheme
has reached the right category of households. The start up activities designed
and carried out in various panchayats have generated high degree of
awareness among the people resulting in their active participation. All the
registered households were issued job cards. Right type of works have been
identified inspite of differing geographical conditions across the districts.
Works have been executed in a methodical and systematic manner.
There is a marked improvement in the average number of days
employed per household and the number of households employed for 100
days. Works are provided within a radius of 5 km. Basic facilities are made
available at the worksite though they are inadequate. Wages are paid in full
through banks and post offices. There has been no report of delay in payment
of wages. Wages for men under NREGA is less than prevailing wage rates.
Wages for women under NREGA is higher than the prevailing wage rates.
Though it is too early to expect the impact of the scheme, evidences clearly
indicate that the scheme has impacted on the income, expenditure pattern,
savings, migration, assets, status of women and social relationship. The
scheme has also brought in benefits to the households as well as to the
community. The respondents have rated the functioning of the scheme with
reference to select variables as ‘very good’ which is a sign of good work done
by the various functionaries of the scheme.
* * * * *

141
Chapter - 7
Recommendations
We present here a set of recommendations based on the inferences
drawn from indepth qualitative and quantitative analysis and dialogue with
various stakeholders of NREGA.
• 100 days of employment per adult member of rural household should be
guaranteed instead of 100 days per rural household. This would help
improve the income level of households who primarily depend on NREGS
for their livelihood.
• A major complaint about NREGS is that it affects the agricultural
operations especially during the peak season. Hence, NREGS work may
be temporarily suspended during the peak season to facilitate the smooth
operation of agricultural activities. In fact, such arrangements have been
informally made in some of the panchayats visited by the study team.
• Land improvement and soil conservation works in private agricultural lands
and construction of farm ponds in the lands of small farmers may be taken
up in the larger interests of enhancing agricultural production in various
regions. Such kinds of work may be taken up with matching financial
contributions of the land owners.
• Panchayats should be allowed to take up works involving material cost
(even if it exceeds the prescribed limit) as one cannot always find
labor-intensive works in certain pockets of districts and the state.
• We have at present a blanket-type of guidelines uniformly applied in all the
states and regions. Evidences from the field have clearly indicated the
problems in adhering to the guidelines especially when it comes to the
selection of worksites and adhering to the limit prescribed for the material
cost. It is, therefore, recommended that the panchayats may be permitted
to prepare region-specific employment plans without deviating much from
the twin objectives of employment guarantee and sustainable natural
resource management.

142
• Minimum wages, especially in a state like Kerala, need to be revised
upward. Men’s participation is restricted due to low wages under NREGA.
The wages for women under NREGA, in certain districts (Alapuzha), is
much closer to the prevailing wages. Hence, there is a strong ‘case’
towards revision of minimum wages prescribed and also wages paid under
NREGA.
• Though NREGA is labour-intensive work with emphasis on physical
labour, certain items of work like water and soil conservation require
skilled lobourers. Provision should be made to temporarily employ skilled
labourers. This may necessitate payment of higher wages to such
labourers.
• The Act does not permit re-intervention in an area where the works have
already been taken up and completed. This rule may not be applied
uniformly in all the regions. For instance, flood control and protection work
needs to be taken up annually in the water logged areas like Kuttanad in
Alapuzha district. Hence, it is recommended that provision of one time
intervention need to be revised and the panchayats should be allowed to
re-intervene based on the nature of work ( e.g. removal of ‘Pola’- a type of
waterweed)
• Delegation of responsibilities, works and the required authority from the
block to the panchayats may be seriously thought of to avoid procedural
delays. For instance, the responsibility of worksite measurement may be
given to the panchayat administration. The officials from the block may
supervise the work done as often as possible and thereby can quicken the
process of payment of wages.
• The Act guarantees ‘the right to work’. Hence, the ‘demand for work’ will
be there for ever. Hence, there is a need for staff exclusively to look after
the works taken up under the NREGA. The staff who are currently working
under the scheme may be made permanent. Taking in to account the
quantum of work done in each panchayat, we may have to revise the
organizational structure and make necessary modification. The
organizational structure as proposed during the FGD is given below.

143
Proposed Organizational Structure
Existing Proposed
President (1) President
Secretary (1) Secretary
A.E. (1) A.E. (2)
Overseer (1) Overseer (2)
Accountant -cum Accountant-cum Computer Operator (1) Computer Operator (2)
Driver with vehicle
• Certain districts have prepared a district perspective plan under NREGS.
The perspective plan is prepared with a long-term vision and mission. The
purpose of the perspective plan is to ensure sustainable employment
opportunity through sustainable development of natural resources such as
soil, water, forests etc. Panchayats are not aware of the perspective plan.
Panchayat may be facilitated to prepare a perspective plan keeping in
view the NREGA guidelines.
• The panchayats should provide tools and implements required by the
labourers. They should be user-friendly and should be maintained well and
be kept in a state of efficiency.
• The working hours should be modified keeping in view the difficulties
expressed by the women. The revised working hours as proposed is 8.30
a.m. to 04.00 p.m.
• BSNL net connection should be made available in all the panchayats to
have better e-connectivity for sharing information on NREGS with
authorities at various levels.
• Taking into account the amount of work taken-up in a given block, a
separate vehicle may be provided for facilitating and monitoring.
* * * * *

146
Performance of National Rural Employment Guarantee Scheme in Kerala An Appraisal
(Study sponsored by Ministry of Rural Development, Govt. of India. Funded by UNDP New Delhi)
Household Interview Schedule
1. Identification
1.1. Name of the respondent 1.2. Community SC/ST/Others
1.3. Village 1.4. Block
1.5. Panchayat 1.6. District
2. Socio-economic Profile
2.1 Family Details
S. No Code
Name Age in yrs
Sex
if Disabled;
type Education
Main occupation
Subsidiary occupation
Relationship with HH head
SHG Membership
1 2 3 4 5 6 7 8
FD1
FD2
FD3
FD4
FD5
FD6
FD7
FD8
FD9
FD10
Column 2: 1 - Male; 2 - Female Column 3: 1 - Visual; 2 - Hearing/and/ or speech; 3 - Orthopaedic; 4 - Mentally ill; 5 - Mentally retarded; 6 - Cerebral Palsy; Column 4: 1 - illiterate; 2 - Informal education; 3 - Primary; 4 - Middle; 5 - Secondary; 6 - Higher Secondary; 7 - Graduate; 8 - Professional; 99 - not applicable [not of school going age] Column 5 & 6: 999 - Not Applicable; 1 - Housewife; 2 - Retired/old age; 3 - farmer;/Tiller; 4 - Agriculture labour; 5 - Skilled labour /e.g. carpenter, plumber, driver, mason, etc; 6 - Unskilled labour / e.g. construction
labourer, loader, house help, caretaker; watchman, etc; 7 - Traditional Artisan; 8 - Services e.g. barber; milkman, dhobi; cobbler; etc; 9 - Petty shop; 10 - Vendor; 11 - Business;(e.g., shop - owner); 12 - Collection of NTFP; MFP; 13 - Government service; 14 - Private service; 15 - Others _________________________
Column 7: 1 - Head; 2 - Spouse of head; 3 - Mother; 4 - Father; 5 - Son; 6 - Daughter; 7 - Daughter-in-law; 8 - Son-in-law; 9 - Grand son; 10 - Grand daughter; 11 - Grand mother; 12 - Grand father; 13 - Brother; 14 - Sister; 15 - Sister
in law; 16 - Brother in law; 17 - Relatives; 18 - Other specify: _____________________ Column 8: 1 - Yes; 2 - No

147
2.2 Housing Details
Description Choice Response
1. Ownership of house 1 - Own; 2 - Rented; 3 - Others (specify)
2. If ‘Own’, is it given by
Government?
1 - Yes; 2 - No
If ‘no’ GOTO Q No. 4
3. If ‘Rented’, what is the rent In Rs.
4. Type of Structure 1 - Hut 2 - IAY, 3 - Asbestos/Tiled/Tin Roof; 4 - Concrete
5. Do you have electricity connection? 1 - Yes; 2 - No
6. What is the source of drinking
water?
1 - Water tap in the household premises;
2 - Public stand post; 3 - Hand pump;
4 - Open well; 5 - Pond; 6 - River;
7 - Any other ________________
7. Do you have a latrine in your
house?
1 - Yes; 2 - No 3 - using community toilet
2.3 Income
What is your monthly HH income?
Sources of income Unit.(Period) 1 - Monthly; 2 - Quarterly; 3 - Half yearly; 4 - Annual
Income (Rs.) Total [not to be filled in]
1 2 3 4
1. Agricultural Income
2. Salary; Wage work of all family members
(including services, crafts, etc.)
3. Income from Livestock
4. Income from Petty Shop (Small Business)
if any
5. Remittance from wards/ relatives
6. Govt. assistance (OAP, Disability
Assistance, etc.) NSAP
7. NREGA
8. Others (specify)
NSAP: National Social Security Assistance Programme

148
2.4 Expenditure
What is your monthly HH expenditure? Mention the amount against each item.
Particular
Unit.(Period) 1 - Monthly; 2 - Quarterly; 3 - Half yearly; 4 - Annual
Amount Spent Total [not to be filled in]
1 2 3 4
Consumption Expenses
1. Food
2. Fuel and electricity
3. Education
4. Tobacco, Alcohol, gambling
5. Entertainment
6. Cosmetics, Toiletries, etc.
7. Clothing
8. Medical: Medicines/ Doctor
9. Transport
10. Festivals, religious ceremonies
11. House maintenance
12. Interest on loans, debts, etc.
13. Others (Specify)
2.5 ASSETS
1. Land
Description Options Response 1. Do you own land? 1 - Yes; 2 - No
If ‘No’, GOTO Q No. 3
2. If ‘Yes’, specify the extent of land do you possess?
1. Dry
2. Wet
3. Farm Land (Garden)
(In Acres)
4. Housing
3. Have you purchased / taken on lease any land during last 1 year? 1 - Yes; 2 - No
4. If ‘Yes’, specify the extent of land purchased/ taken on lease? Specify in Acres

149
2.6 Livestock
S. No Livestock Number Total Value Income derived 1 2 3 4
1 He buffalo
2 She buffalo
3 Cow
4 Bullock
5 Goat
6 Sheep
7 Pigs
8 Poultry
9 Donkey
10 Others Specify
2.7 Household Assets
S. No Asset Yes/ No S No. Asset Yes/ No 1 Grinder 8 Cart 2 LPG Connection 9 Cycle 3 Television 10 Two Wheeler 4 Air conditioner 11 Three Wheeler 5 Fans 12 Tractor 6 Personal Computer 13 Tiller 7 Cell Phone 14 Others Specify
2.8 LOANS
1. Do you or your family member have an account in any bank?
1 - Yes; 2 - No If No, GOTO Q No.3
2. Have you taken any loan in last one year? 1 - Yes; 2 - No
3. If ‘Yes’, give details.
Last one year
From Whom No. of
Times Purpose
Loan
amount
Interest
rate
Mode of
repayment
Any
repayments
in Rs
How did
you mange
to get loan
Current
out-
standing
[1] [2] [3] [4] [5] [6] [7] [8] [9]
Code: Column 3: 1 - Construction of house; 2 - Purchase of land; 3 - Purchase of household assets; 4 - Purchase of food grains; 5 -
Marriage of daughter/ son/brother;/sister; 6 - Medical treatment; 7 - Repayment of old loan; 8 - Death Ceremony; 9 - Other social ceremony; 10 - Education; 11 - Celebration of festivals; 12 - Others ______________
Column 6: 1 - Installment; 2 - Lumpsum; 3 - Any other specify ________________ Column 8: 1 - Mortgage immovable property; 2 - Mortgage assets; 3 - Promissory note; 4 - Through a guarantor; 5 - SHG membership; 6 - Any other specify ______________________

150
2.9 Migration
1. Has any member of the family migrated? If yes How many members? Specify the reason
1 – Yes; 2 – No
2. If ‘yes’ specify the reasons for migration?
3. for what duration
4. Where do they migrate normally?
Code: For Row 2: 1 - Seeking employment in lean season; 2 - better wage earning; 3 - Better amenities; 4 - Children education; 5 - Others ___________ For Row 3: 1 - <2 Month; 2 - 2-4 Months; 3 - 4-6 Months; 4 - 6-12 Months; 5 - Above 12 months 2.10 Social Participation of the Members
Particulars Office Bearer Member only
1. Local Panchayat
2. Caste Association
3. Youth Association
4. Local Cooperatives
5. NGOs
6. SHGs
7. SHG Federation
8. Temple committees
9. Others
i)
ii)
iii)
3. Participation in NREGA
3.1 Awareness about NREGA
3.1.1 How do you come to know about NREGA in your area?
i) News papers
ii) Radio
iii) Television
iv) NGO Representative
v) Panchayat
vi) Govt. officials
vii) SHG
viii) Friends / Relatives / Neighbours
ix) Any other specify

151
3.1.2 Are you aware of the important provisions of NREGA? Yes / No
3.1.3 If yes, Specify
Provisions RS RAP
i) 100 days per households
ii) Minimum wage
iii) Knowledge about correct minimum wage
iv) Equal wages for men and women
v) Work within a radius of 5 km.
vi) Universal Act
vii) Role of Grama Sabha
viii) No labour displacing machinery
ix) Eligibility for unemployment allowance
x) Compensation for delayed payment
xi) Medical assistance for injury in the worksite
xii) Worksite facilities
xiii) Exgratia payment for death and disability
xiv) Right to payment within a fortnight
RS: Response Spontaneous RAP: Response after probe
3.2 Registration
3.2.1 Have you registered under NREGA? Yes / No
3.2.2 If yes, give details
i) When did you register?
ii) Have you received job card? Yes / No
iii) What was the time lag between date of registration and receipt of job card?
iv) Have you faced any problem? Yes / No
v) If yes, specify the problems
vi) Have you spent any amount for receiving job card? Yes / No
vii) If yes, specify the amount.
viii) Who bears the cost of photography

152
3.2.3 Mention the other members in your family who registered under the programme.
3.2.4 What are the steps taken by the panchayat to complete the process of issue of job cards?
3.3 Employment
3.3.1 When was the scheme introduced in your panchayat?
3.3.2 What are the various items of works undertaken in your panchayat?
3.3.3 How the works were selected?
3.3.4 Did you participate in the Grama Sabha meeting? Yes / No
3.3.5 If yes, was there any discussion on any matters related to NREGA? Yes / No
3.3.6 If yes, specify
3.3.7 Have you sought employment under the scheme? Yes / No
3.3.8 If yes, were you given ‘dated receipt’ by the panchayat? Yes / No
3.3.9 What is the time-lag between date of application and the provision of employment?
3.3.10 Was there any delay beyond 15 days in getting employment Yes / No
3.3.11 If yes were you given unemployment allowance? Yes / No
3.3.12 If yes what is the amount received?
3.3.13 For how many days have you got employed? (year-wise)
No. of days employed S.no Year
Self Family members
1.
2.
3.
4.
5.
3.3.14 Specify the various items of work in which you participated?
3.3.15 What is the distance from the residence to the place of work?
Minimum km. ________ Maximum km. ___________

153
3.3.16 Were you given TA if the worksite was beyond the distance of 5 km? Yes / No
3.3.17 If ‘yes’ what was the TA received?
3.3.18 What is the mode of transport used by you to reach the place of work?
3.3.19 What is the transport cost incurred?
Minimum Rs. ________ Maximum Rs. ___________
3.3.20 Who bore the transport cost?
3.3.21 What is the working hour?
3.3.22 What are the facilities made available at the worksite?
3.3.23 Are they adequate? Yes / No
3.3.24 If ‘no’ what more facilities are required?
3.3.25 How would you rate the quality of the work executed?
Very Good / Good / Average / Poor / Very Poor
3.3.26 Who provides the tools for the work in the worksite? Panchayat / Self /Kudumbasree/
Area Development Society
3.3.27 If ‘self’, are the tools of your own or hired?
3.3.28 If ‘hired’ what is the rent paid by you for the tools?
3.3.29 Are the tools worker friendly? Yes / No
3.3.30 If yes how?
3.3.31 Have you faced any problems in the worksite? Yes / No
3.3.32 If ‘yes’ give details
3.4 Wages
3.4.1 What is the minimum wage rate fixed in your state?
3.4.2 Do you know the mode of fixation of wage for the work done by the workers under NREGA? Yes / No
3.4.3 If ‘yes’ specify.
3.4.4 What is the wage earned by you under the scheme?
Minimum Rs. :
Maximum Rs. :
Average Rs. :

154
3.4.5 How is your wage paid? By cash / through bank / through panchayat office /thro’ post office
3.4.6 If the wage is paid through bank / post office, was there any problem in withdrawing the cash from the bank/post office Yes / No
3.4.7 If ‘yes’ specify the problems.
3.4.8 What is the time-lag between date of completion of work and receipt of wages?
3.4.9 Was there any delay in payment of wages? Yes / No
3.4.10 If ‘yes’ specify the
i) extent of delay
ii) reasons attributed for the delay
3.4.11 Were you able to get the wages in ‘full’? Yes / No
3.4.12 If ‘no’ why?
3.4.13 Is the muster roll read out when wages are paid? Yes/No
3.4.14 What is the difference between wages under NREGA and the prevailing wages for other than NREGA work?
Normal NREGA Men Rs. :
Women Rs. :
3.4.15 What is the effect of NREGA on the wage structures in the market?
Decreased / increased from Rs. _____ to Rs. _____ for men.
Decreased / increased from Rs. _____ to Rs. _____ for women.
3.5 Effects of NREGA
3.5.1 How did you spend the wages earned under NREGA?
3.5.2 What according to you are the benefits of NREGA to your family?
3.5.3 What are the benefits of the scheme for the panchayat as such?
3.5.4 What are the changes that the scheme has brought into your panchayat?
3.5.5 Did you migrate to other areas in search of job before the introduction of the scheme? Yes / No
3.5.6 If ‘yes’ specify:
i) Where did you go?
ii) What was the duration?
3.5.7 What is the level and intensity of migration after the introduction of the scheme?

155
3.5.8 Do you find any change in the relationship among the households after the introduction of the scheme? Yes/No
3.5.9 If ‘yes’ specify the nature and intensity of relationship.
3.5.10 What according to you are the impacts of the scheme on the following?
i) Livestock
ii) Income
iii) Expenditure
iv) Liability
v) Savings
vi) Empowerment of Women
4. PERFORMANCE OF THE NREGA
Given below are the key criteria related to the functions of NREGA. Rate them on a five point scale.
Criteria
Very Good 5
Good 4
Satisfactory 3
Poor 2
Very Poor 1
4.1 Process of Registration
4.2 Issue of job cards
4.3 Selection of works
4.4 Execution of works
4.5 Supervision at the worksite
4.6 Facilities at the worksite
4.7 Mode of distribution of wages
4.8 Quality of the work executed
4.9 Relevance and usefulness of work to the village / people
4.10 Transparency
4.11 Grievance redressal
4.12 Participation of people
4.13 Support of govt. officials
4.14 Benefits occurred to the panchayat
4.15 Benefits occurred to the households
Date & Time of Interview Name & Signature of the Volunteer

156
Focus Group Discussion with panchayat functionaries
District : Block :
Panchayat: Venue :
Date : Number of participants:
Checklist
1. Start-up activities
1.1. What are the various start-up (IEC) activities undertaken by the panchayat to generate
awareness about NREGS among the households? Who get involved in IEC activities?
1.2. How are such activities received by the households?
1.3. What are the effects of start-up activities?
1.4. What is the amount of funding received towards start-up activities? How was it spent?
Were you able to fully utilize the fund for the activities? If ‘no’ why?
1.5. Did you convene exclusive Grama Sabha meeting on NREGS? If so what was the
response to the meeting? What were the decisions taken in the meeting?
2. Launching of the scheme
2.1. When was the programme launched in your panchayat?
2.2. Are you aware of the key provisions and procedures of the Act? If so specify.
2.3. Did the President, ward members of the panchayat attend the orientation training on
NREGA? Yes / No. If ‘yes’ what is the content and quality of the training?
2.4. What was the initial response of the people to NREGA?
3. Registration and issue of job cards
3.1. What are the efforts made by the panchayat for registering the rural households under
the scheme?
3.2. What is the role of Kudumbasree in registration and issue of job cards?
3.3. Have all the rural households got registered under the scheme? If ‘no’ why?

157
3.4. Are employment seekers able to register freely and easily for job cards?
3.5. Is the data bank available about the registered candidates? If so how is it prepared and
maintained?
3.6. How are the job cards generated? (manually/ computerbased)
3.7. Who is in-charge of issue of job cards?
3.8. What is the time gap between registration and issue of job card?
3.9. Did you charge any amount for registration and issue of job card?
3.10. Who has the possession of job cards?
3.11. Did you come across any problem in registering and issuing job cards? Yes/No. If ‘yes’
specify?
3.12. What are your suggestions to overcome such problems?
4. Identification of work
4.1. Was the Grama Sabha convened to select the work? If ‘no’ why?
4.2. Who identifies the work? Do they follow the guidelines to select the work? Do they
estimate the quantum and value of work? If yes how do they estimate?
4.3. Have you got an approved shelf of projects of atleast five works with technical and
financial estimates ready to start when employment demand is received?
4.4. What kinds of works have been given priority?
4.5. What are the approved works on public display in the panchayat?
4.6. Have your come across any problems in identifying the work? Yes/No
If you what are they add to in do you overcome such problem
5. Demand for employment
5.1. Do the job seekers submit application for employment? Yes/ No. If ‘no’ why?
5.2. Are the applications given in writing? If ‘so’ are receipts given? Are receipts dated?
Who is responsible for providing dated receipts in the Grama Panchayat?
5.3. Is there any delay in provision of employment? If ‘yes’ give details.

158
5.4. Are there any instances of provision of unemployment allowance? If ‘yes’ give details.
5.5. Have any special efforts been made to create demand among SC/ST? If ‘yes’ give
details.
6. Execution
6.1. Have all the registered households participated in the scheme? If ‘no’ what are the
factors hindering participation of the households?
6.2. Describe the step-by-step process followed in execution of NREGS work. (Please note
whether respondents are able to list the following key steps
i) Identification of work.
ii) Preparation of people’s estimate by engineers
iii) Project initiation meeting.
iv) Citizen information board
v) Provision of implements.
vi) Worksite facilities ( drinking water, first aid box, crèche, provision of shade, toilet )
vii) Maintenance of muster roll
viii) Maintenance of worksite diary by the mate.
ix) Inspection of work.
x) Photography of the activities (project initiation meeting; before execution , during
execution, after execution)
6.3. Is there any mismatch between the demand for work and the availability of work?
What are the steps taken by the panchayat to fill the gap between demand and supply?
6.4. How is the muster roll generated? Are muster rolls properly maintained?
6.5. Were there any incidents when workers without job-cards working on worksites? If
‘yes’ why?
6.6. How and when the measurement of work is done? Is the measurement delayed beyond
14 days? If so why?

159
6.7. Have engineers/overseers visited the worksite? If so how often? Are works-in-progress
technically supported on a regular basis? Yes / No. If ‘no’ why?
6.8. What is the average number of days employed in a year? Are there variations across the
households in terms of number of days employed with reference to caste, gender,
occupation, family size, age etc.? If ‘Yes’ what are the reasons?
6.9. Are you able to provide employment continuously for 14 days? If no why? What is the
percentage of disabled employed under the scheme? What type of work is allotted to
them? What are the problems faced by them under the scheme?
6.10. What are the facilities made available at the worksite? Are they adequate? If not what
more facilities are required?
7. Payment of wages
7.1. Does all the workers possess savings bank account?
7.2. What is the average amount of wage paid per day per labour? Does it vary from group
to group? If ‘yes’ specify the reason?
7.3. Are the workers able to earn the notified wage for agriculture labourers?
7.4. Are the workers earning the full task rate notified in the schedule of rates? If ‘no’ what
are the reasons?
7.5. Is the task rate earned equal to minimum wages? If no specify the reasons.
7.6. Is there any variation in the wages earned across the households? Is so what are the
reasons?
7.7. What is the system followed in distribution of wages? Have the households expressed
any problems in getting wages? If so what are the problems?
7.8. What is the time lag between work completion and payment of wages?
7.9. Women got employed in large number under the scheme. What are the problems faced
by them in the worksite? What steps have been taken to overcome such problems?

160
8. Impact
8.1. What is the impact of the programme on the rural households with special reference
to:
i) Livelihood
ii) Income
iii) Assets
iv) Expenditure
v) Savings
vi) Liability
vii) Migration
viii) Social capital
ix) Empowerment of women
8.2. How do people spend their wages?
8.3. What is the level and intensity of migration after the introduction of the scheme?
8.4. Has the scheme resulted in creation of allied livelihood on the foundation of water
security?
8.5. What is the quality of the work? Have the works undertaken helped in developing
productive assets? Have they helped in conserving soil, water and other natural
resources?
9. Staff and Training
9.1. Do you have any advisory group for effective planning implementation and monitoring
of the programme? If so give details of:
i) how is it constituted
ii) Composition of the advisory group
iii) Roles and responsibilities of the advisory group

161
9.2. Have the functionaries such as accountant-cum-computer operator, Panchayat
Secretary, President and Ward members been trained in planning and implementing
the scheme? If so give details of:
i) Nature of training
ii) Content of training
iii) Duration of training
iv) Participants of training
v) Effectiveness of training
vi) Problems in imparting training
9.3. Have you introduced the system of online monitoring? If ‘yes’. Gives details of:
i) The items of work monitored.
ii) Effectiveness of online monitoring
iii) Problems in online monitoring.
10. Records
10.1. What are the various books, registers maintained? Are they maintained as per the provisions of the Act? 10.2 What are the problems in maintaining the books and registers?
11. Monitoring
11.1. Have the works been inspected by block / state functionaries? If ‘yes’ how often? Have
they recorded their observations? If so what is the nature and content of observation?
11.2. Have you constituted vigilance and monitoring committee? Who are the members?
What are their roles and responsibilities? How do they function? Have they been
trained? If so specify the nature and content of the training?
11.3. Does the VMC monitor and certify the completion of work?

162
12. Social Audit
12.1. Has social audit of all work been done? Who did the social audit? What is the process
followed in social audit? What was the outcome of social audit?
13. Grievance Redressal
13.1. Do you maintain the complaint register? How many complaints are received? What is
the nature of the complaints? How complaints are disposed?
13.2. You have toll free helplines? Are people aware of it? How many complaints have you
received thro’ Toll free helplines? How many of them are disposed? Were there any
problems in disposing grievances thro’ online? If so give details.
14. General
14.1. Is the organizational structure to implement the scheme adequate? Does it require
modification / change? What is support infrastructure available to implement the
scheme?
14.2. What is the mechanism evolved and adopted to ensure transparency and
accountability under the scheme? What is the degree of transparency and
accountability found in the scheme?
14.3. How do you differentiate NREGA scheme from earlier schemes for such as SGRY
14.4. Is the relevant scheme to your area If so How?
14.5. What are the various issues in converging the activities of various departments (e.g
forest, Irrigation, Agriculture) with NREGA work?
14.6. Explain the role of
i) Elected representatives
ii) Kudumbasree
iii) Officials in NREGA (panchayat, Block& district – Technical & Non Technical)
14.7. What in the next step envisaged at the local level for better implementation.