knockdown of connective tissue growth factor (ctgf...
TRANSCRIPT
1
KNOCKDOWN OF CONNECTIVE TISSUE GROWTH FACTOR (CTGF), TRANSFORMING GROWTH FACTOR BETA 1 (TGF-B1) AND TRANSFORMING
GROWTH FACTOR BETA RECEPTOR 2 (TGF-BR2) BY THE TOPICAL APPLICATION OF SHORT INTERFERING RNA MOLECULES IN RABBIT CORNEAL
FIBROBLASTS
By
SRINIWAS SRIRAM
A THESIS PRESENTED TO THE GRADUATE SCHOOL OF THE UNIVERSITY OF FLORIDA IN PARTIAL FULFILLMENT
OF THE REQUIREMENTS FOR THE DEGREE OF MASTER OF SCIENCE
UNIVERSITY OF FLORIDA
2011

2
© 2011 Sriniwas Sriram

3
To mom and dad

4
ACKNOWLEDGMENTS
I would like to thank my two mentors, Dr. Alfred Lewin and Dr. Gregory Schultz,
without whom my journey of scientific exploration would not have been nearly as
fulfilling or complete. Their technical assistance and practical guidance have been vital
in the successful completion of my thesis.
I would also like to thank my committee members Dr. William Ogle and Dr.
Benjamin Keselowsky. Their expertise and advice have been indispensible to my
success.
I express sincere gratitude to Paulette Robinson for all of her experimental advice,
friendship and support. I greatly appreciate the numerous hours you took away from
your busy schedule to train me in techniques related to my experiments.
Finally, the affirmation provided by family and friends during this period also
promoted the achievement of this project. My father lent support and guidance to me
during this period and continues to be my role model as he has been throughout the
years. My mother embraced me with open arms during the high and low points of this
project as she has done during all of the projects life has presented.
The help extended by these individuals as well as others too numerous to mention
have been essential to my success.

5
TABLE OF CONTENTS
page
ACKNOWLEDGMENTS .................................................................................................. 4
LIST OF TABLES ............................................................................................................ 7
LIST OF FIGURES .......................................................................................................... 8
LIST OF ABBREVIATIONS ........................................................................................... 10
ABSTRACT ................................................................................................................... 11
CHAPTER
1 INTRODUCTION .................................................................................................... 13
RNA interference .................................................................................................... 13 Mechanism of RNAi .......................................................................................... 14 siRNA Design ................................................................................................... 14
siRNA Delivery ................................................................................................. 15 Some Concerns in Using RNAi Therapy .......................................................... 16
Corneal Wound Healing .......................................................................................... 17 Transforming Growth Factor Beta’s and Wound Healing ................................. 18
Activation of TGF-ß1 and Role of TGF-ßR2 ..................................................... 19 Role of Connective Tissue Growth Factor ........................................................ 20
2 METHODS .............................................................................................................. 29
siRNA Design ......................................................................................................... 29 Targeting Coding Region.................................................................................. 29
Off Target Effects ............................................................................................. 30 Cell Isolation and Culture ................................................................................. 30 Transfection Efficiency ..................................................................................... 30
Stimulation Experiment ........................................................................................... 31 TGF-ß1 Quantitation ........................................................................................ 31
CTGF and TGF-ßR2 Protein Quantitation ........................................................ 32 siRNA Knockdown Study.................................................................................. 32
CTGF, TGF-ß1 and TGF-ßR2 Quantitation ............................................................ 33 Quantitation of CTGF, TGF, TGF-ßR2 mRNA using q RT-PCR ....................... 33 Statistical Analysis ............................................................................................ 33
3 RESULTS ............................................................................................................... 35
Experiment I ............................................................................................................ 36 Stimulation of TGF-ß1 ...................................................................................... 36

6
TGF-ß1 Knockdown Experiment ...................................................................... 37
Experiment II ........................................................................................................... 38 Stimulation of CTGF ......................................................................................... 38
CTGF Knockdown Experiment ......................................................................... 39 Experiment III .......................................................................................................... 41 TGF-ß-R2 Knockdown Experiment ......................................................................... 41
4 DISCUSSION ......................................................................................................... 61
Experiment I ..................................................................................................... 62
Experiment II .................................................................................................... 63 Experiment III ................................................................................................... 64
5 CONCLUSIONS ..................................................................................................... 65
Overall Conclusions ................................................................................................ 65 Future Work ............................................................................................................ 65
APPENDIX
A TGFβ1 ALIGNMENT SEQUENCES ....................................................................... 68
B TGFβR2 ALIGNMENT SEQUENCES ..................................................................... 83
C CTGF ALIGNMENT SEQUENCES ....................................................................... 111
LIST OF REFERENCES ............................................................................................. 117
BIOGRAPHICAL SKETCH .......................................................................................... 121

7
LIST OF TABLES
Table page 2-1 Accession number of target growth factors ........................................................ 34
2-2 siRNA target sequences ..................................................................................... 34
2-3 TAQMAN™ RT PCR Primers and probe sequences .......................................... 34
5-1 TGF-ß1 Knockdown percentages, protein and mRNA level ............................... 67
8
LIST OF FIGURES
Figure page 1-1 Schematic of RNA interference .......................................................................... 22
1-2 Polymer based delivery system .......................................................................... 23
1-3 Corneal wound healing steps ............................................................................. 24
1-4 Major phases of wound healing and their associated pathologies ...................... 25
1-5 TGF-ß activation and signaling systems ............................................................. 26
1-6 Domains of CTGF ............................................................................................... 27
1-7 Interaction of TGF-ß and CTGF in fibrosis ......................................................... 28
3-1 Transfection reagent optimization results, knockdown percentage .................... 43
3-2 Transfection reagent optimization results, optimal balance factor. ..................... 43
3-3 TGF-ß1 stimulation, cell extract .......................................................................... 44
3-4 TGF-ß1 stimulation, media (Arrow mark indicates highest concentration) ......... 45
3-5 TGF-ß1 siRNA knockdown ELISA results .......................................................... 46
3-6 TGF-ß1 siRNA knockdown percentage, media (Arrow mark indicates highest knockdown) ........................................................................................................ 47
3-7 TGF-ß1 siRNA knockdown percentage, cell ....................................................... 48
3-8 TGF-ß1 siRNA knockdown q-RT PCR results, knockdown ................................ 49
3-9 TGF-ß1 siRNA knockdown q-RT results, ratio of expression ............................. 50
3-10 CTGF stimulation, cell ........................................................................................ 51
3-11 CTGF stimulation, media (Arrow mark indicates highest concentration) ............ 52
3-12 CTGF knockdown ELISA results ........................................................................ 53
3-13 CTGF siRNA knockdown percentage, media (Arrow mark indicates highest knockdown) ........................................................................................................ 54
3-14 CTGF siRNA knockdown percentage, cell ......................................................... 55
3-15 CTGF siRNA knockdown q-RT results ............................................................... 56

9
3-16 CTGF siRNA knockdown q-RT results ............................................................... 57
3-17 TGF-ßR2 siRNA knockdown ELISA results ........................................................ 58
3-18 TGF-ßR2 siRNA knockdown percentage, media ................................................ 59
3-19 TGF-ßR2 siRNA knockdown percentage, cell .................................................... 60

10
LIST OF ABBREVIATIONS
CCN2 / CTGF Connective Tissue Growth Factor
ECM Extracellular matrix
ELISA Enzyme-linked immunosorbent assay
GAPDH Glyceraldehyde-3-phosphate dehydrogenase
HEPES 4-(2-hydroxyethyl)-1-piperazineethanesulfonic acid
PBS Phosphate Buffered Saline
RBCF Rabbit Corneal Fibroblasts
siRNA Short Interfering Ribonuclease acid
TGF-ß Transforming Growth Factor - Beta
TGF-ßR2 Transforming Growth Factor Type II Receptor

11
Abstract of Thesis Presented to the Graduate School of the University of Florida in Partial Fulfillment of the Requirements for the Degree of Master of Science
KNOCKDOWN OF CONNECTIVE TISSUE GROWTH FACTOR (CTGF),
TRANSFORMING GROWTH FACTOR BETA 1 (TGF-B1) AND TRANSFORMING GROWTH FACTOR BETA RECEPTOR 2 (TGF-BR2) BY THE TOPICAL
APPLICATION OF SHORT INTERFERING RNA MOLECULES IN RABBIT CORNEAL FIBROBLASTS
By
Sriniwas Sriram
May 2011
Chair: William Ogle Major: Biomedical Engineering
Purpose: Transforming Growth Factor ß (TGF-ß) is a key mediator of the fibrotic
response to wounding. It is up regulated during different types of wound healing in the
eye, liver, and skin. Connective Tissue Growth Factor (CTGF) acts as a downstream
mediator of TGF-ß in promoting scar formation. Both CTGF mRNA and CTGF protein
are induced by TGF-ß in fibroblastic cells. The purpose of the study was to determine if
short interfering RNAs (siRNAs) targeting TGF-ß1, CTGF and type II receptor of TGF-
ß1 (TGF-ßR2) could be used to suppress the action of TGF-ß and CTGF.
Methods: The mRNA sequences of human, mouse, rat and rabbits were aligned to
compare their homology. Potent siRNA sequences designed from the coding region of
the rabbit gene sequence specific to the growth factors being targeted were transfected
into cultured rabbit corneal fibroblasts (RBCF). To observe knockdown, the growth
factors were initially stimulated to increase their respective concentrations. The proteins
and mRNA levels were then determined by Enzyme-linked immunosorbent assay
(ELISA) and quantitative real time PCR (q-RT PCR).

12
Results: Knockdown in the expression of all three growth factors was observed in
the samples transfected with siRNAs. More specifically, TGF-ß1 siRNAs caused a
relative significant (p<0.05%) reduction of ~88% in the protein expression when
compared to the scrambled control. The q-RT PCR results showed a similar significant
mRNA level knockdown of ~94% for the same siRNA sample. Two TGF-ß1 siRNA
sequences that abrogated protein and mRNA level expressions in vitro were identified.
Conclusions: TGF-ß1 specific siRNAs were efficacious in knocking down the TGF-
ß1 action both in the protein and mRNA level. A direct application of siRNA into eyes to
downregulate the TGF-ß1 expression may provide a novel therapy for preventing
corneal inflammation and scarring.
13
CHAPTER 1 INTRODUCTION
RNA interference
Post-transcriptional gene silencing (PTGS) is a method that silences gene
expression by modifying mRNA using double-standard RNA (dsRNA). This method
termed, RNA interference (RNAi) is a cellular mechanism that acts to change the gene
expression at the post-transcriptional level as opposed to the pre-transcriptional level in
DNA gene therapy where the changes are made before information is transcribed from
the DNA (Fire, 1999). It was first discovered in plants in the 1990s and has since been
observed in animal cells. It utilizes the cells natural defense against double stranded
RNA, possibly related to an antiviral defense mechanism.
Studies have also shown that siRNA-mediated gene silencing is more effective
than other antisense methods such as antisense oligodeoxynucleotides, ribozymes and
DNAzymes (Khan et al., 2004). There are many advantages of siRNA based therapy
that makes the technology so desirable. Firstly, it can have a high degree of specificity
and gene silencing efficiency. It is relatively non-immunogenic in the correct dosage and
can be made resistant to degradation via ribonucleases. Additionally, there is no
integration of siRNA with the host DNA, thus eliminating concerns for unintentional
mutagenesis that is often a safety concern for gene therapy. While DNA gene therapy
methods require DNA plasmid to reach the host cell nucleus to induce the desired gene
expression, RNAi occurs in the cytosol of a cell, allowing for easier delivery. These
inherent advantages of RNAi makes it a more viable method of altering gene expression
than other methods (Martinez et al., 2002).

14
Mechanism of RNAi
Long double stranded RNA (dsRNA) is processed to short interfering RNAs
(siRNAs) by the action of a dsRNA-specific endonuclease known as Dicer (Bernstein et
al., 2001; Hammond et al., 2001). The resultant siRNAs are 21 to 24 nucleotide in
length, are double stranded and have 3’ overhangs of 2nucleotides (Stevenson, 2004).
The basic schematic of RNA interference is given in Figure 1-1. The requirement
for dsRNA processing by Dicer can be bypassed by incorporating exogenous synthetic
siRNAs or endogenously expressing siRNAs into the RNA-induced silencing complex
(RISC). A helicase in RISC unwinds the duplex siRNA, which then pairs by means of its
unwound antisense strand to messenger RNAs (mRNAs) that bear a high degree of
sequence complementarity to the siRNA (Stevenson, 2004). The target mRNA is then
cleaved leading to its subsequent knockdown.
siRNAs and microRNAs (miRNAs) are two small RNAs in the RNAi pathway that
are generated via processing of longer dsRNA and stem loop precursors (Yin and Wan,
2002). Dicer enzymes play a critical role in the formation of these two effectors by
cleaving dsRNAs in an ATP-dependent manner (Angaji et al., 2010). siRNA-
programmed RISC (siRISC) silences expression by cleaving a perfectly complementary
target mRNA, whereas miRNA-induced silencing complexes (miRISC) inhibits
translation by binding imperfectly matched sequences in the 3′ UTR of target mRNA
(Chu and Rana, 2006).
siRNA Design
There are multiple considerations in order to achieve efficient RNAi in vivo by
delivering exogenous siRNA. siRNA has to be designed to avoid unintended (off-target)
effects targeting only hybridization-accessible regions within the target mRNA (Walton

15
et al., 2010). In addition, siRNA can also induce adverse effects such as immune
responses or interferon responses through RNA-activated Protein Kinase (Samuel-
Abraham and Leonard, 2010). Therefore, a combination of computer algorithms and
experimental validation should be employed to determine the optimized siRNA
sequences that are complementary to target mRNA while inducing minimal immune
responses (Amarzguioui and Prydz, 2004).
siRNA Delivery
siRNA can be delivered either exogenously to cells, or expressed endogenously
via plasmid transfection or viral siRNA expression vectors. The types of target tissues
and cells dictate the optimum administration routes of local versus systemic delivery.
For example, siRNA can be directly applied to the eye, skin or muscle via local delivery,
whereas systemic siRNA delivery is the only way to reach metastatic and hematological
cancer cells. Local delivery offers several advantages over systemic delivery, such as
low effective doses, simple formulation, low risk of inducing systemic side effects and
facilitated site-specific delivery (Dykxhoorn et al., 2006).
Therefore, if applicable, a more cost-efficient strategy for siRNA delivery would be
the local delivery method. Although, viral vectors act as efficient delivery systems they
can potentially induce accidental gene expression changes following integration to host
genome or induce toxic responses. Hence, a safer option would be to use the non-viral
delivery system if efficient delivery of exogenous siRNA to the cytoplasm can be
achieved (Shim and Kwon, 2010).
Since, siRNAs are negatively charged and readily bind to cationic molecules,
delivery carriers usually consist of cationic polymers, peptides or liposomes that form
complex by ionic interactions (Zimmermann et al., 2006). The resulting complex

16
facilitates cellular uptake via the endocrytic pathway, providing excellent protection of
siRNAs from nuclease attack. Lipid based transfection reagents are the most common
approach for nucleic acid delivery to cells in vitro.
The cationic lipids in these reagents provide a suitable platform for incorporating
the negatively charged siRNA. However, cationic lipid based reagents are considered
too toxic for systemic siRNA delivery in vivo (Peer et al., 2008). Similar to liposomes,
cationic polymers can also serve as efficient transfection reagents because they can
bind and condense nucleic acids into stabilized nanoparticles. Figure 1-1 shows the
encapsulation of siRNA in a polymer based delivery system (Kim et al., 2009).
Polyethyleneimine (PEI) is a synthetic polymer that has been used in branched or linear
forms of different lengths for nucleic acid delivery both locally as well as systemically
(Shim and Kwon, 2008). The Mirus TransIT – TKO® transfection reagent, a non-
liposomal cationic proprietary polymer/lipid formulation, was used for all the
transfections in the experiments (Mirus, 2011).
Some Concerns in Using RNAi Therapy
Indication of off target effects came from studies conducted by Merck-Rosetta.
Their results showed that the expression levels of dozens of non-targeted transcripts
were altered when siRNAs were applied ectopically. They also suggested that even
short complementary stretched of siRNAs with non-targeted transcripts can affect their
expression(Jackson and Linsley, 2010).
It was understood that microRNAs affect down-regulation of target proteins and in
some cases trigger non-specific degradation by binding to the 3’-UTR, which in turn
inhibits protein translation. It was quickly realized that ectopically applied siRNAs were
affecting non-targeted gene expression via microRNA like functions. This off-targeting

17
by siRNAs can be easily controlled by a 2’-OMe modification at the second ribose from
the 5’-end of the siRNA. Although this solution should be used for all in vivo siRNA
applications, it is not the case probably due to the long time it takes to develop a
compound for clinical trials (Jackson et al., 2006).
There have also been reports in the literature showing that certain sequence
motifs in siRNA triggers type I interferon production via activation of toll-like receptors
(TLRs) 7 and 8 thereby compromises the sequence specific knockdown effects of the
RNAi pathway (Hornung et al., 2005; Robbins et al., 2008).
The promise of RNAi as a powerful new approach for therapeutic treatment of
disease has propelled early stage clinical testing of siRNAs for a variety of diseases.
Strategies must be developed to capitalize upon the endogenous mechanism without
disrupting the natural pathway to achieve maximal benefit from RNAi
therapeutics(Tiemann and Rossi, 2009).
Corneal Wound Healing
The main purpose of the wound healing process is to regain the anatomical and
functional abilities of the tissue in the fastest way. The corneal wound healing response
is a complex cascade involving cytokine mediated interactions between the epithelial
cells, stromal keratocytes, corneal nerves, lacrimal glands, tear film and cells of the
immune system(Eraslan and Toker, 2009).
Elsewhere in the body, wound healing culminates in scar formation and
vascularization whereas one of the most crucial aspects of corneal wound healing is
how the healing processes aim to minimize these end results, which would otherwise
have serious visual consequences. Corneal epithelium responds rapidly to injury,
healing a wound by migrating as a sheet to cover the defect and to reestablish its

18
barrier function. Successful wound healing involves a number of processes including
cell migration, cell proliferation, re-stratification, as well as matrix deposition and tissue
remodeling (Lu et al., 2001). Figure 1-4, shows the major phases involved in corneal
wound healing. Cell migration and proliferation which are driven by growth factors
released coordinately into the injury sites are particularly critical. Epithelium plays a
central role in the wounded cornea, not only as a key cell type in repairing the cornea
but also as the source of a number of growth factors (Yu et al., 2010). A variety of
growth factors are suggested to play a role in the regulation of corneal epithelial function
and wound healing. We would be focusing on the role of TGF-ß and CTGF.
Transforming Growth Factor Beta’s and Wound Healing
The TGF-ß superfamily currently consists of more than 25 molecules, isolated
from many species, encompassing a wide range of functions. They are multipotent
cytokines that are important modulators of cell growth, inflammation, matrix synthesis
and apoptosis(O'Kane and Ferguson, 1997).
Active TGF-ß is a 25-kDa disulfide-linked homodimer. TGF-ß Receptors I and II
are transmembrane glycoproteins of 55 and 70 kDa. Betaglycan (TGF-ß receptor III) is
a cell surface proteoglycan that has both heparan and chondroitin sulfate chains on its
extracellular domain (Song et al., 2000).
The TGF-ß family of proteins are synthesized and secreted as large pro-peptide
molecules consisting of three regions; an amino terminal (5’) signaling sequence, a pro-
domain / Latency Associated Peptide (LAP) and a mature protein carboxy (3’) domain.
In addition, Latent TGF-ß can contain a protein of variable size called the Latent TGF-ß
Binding Protein (LTBP). Unless an LTBP gene is co-transfected, there is little secretion
of TGF-ß even if the cells are transfected with the full (signal. pro- and active domain)

19
sequence. This indicates that the large latent complex (TGF-ß plus the LAP and an
LTBP) is a frequently secreted form. Both the LTBP and LAP must be removed before
the mature protein can function, therefore activation of TGF-ß is a crucial target for
biological control of the molecule (Saharinen et al., 1996).
The multiple activators of latent TGF-ß complex comprise of seemingly unrelated
group of molecules. The three TGF-ß isoforms – TGF-ß1, TGF-ß2 and TGF-ß3 are
quite similar in their effects in vitro, yet in vivo, the spatial and temporal distribution and
actions of these isoforms is quite specific. TGF-ß1 is most abundant in all tissues and
cells, then TGF-ß2 and least of all, TGF-ß3. TGF-ß2 is present mostly in bodily fluids
such as saliva, amniotic fluid, breast milk and the eye whereas TGF-ß3 is not present at
all in great amounts in either fluids or tissues.
Activation of TGF-ß1 and Role of TGF-ßR2
The conversion of latent TGF-ß to active TGF-ß regulates the activity of the
extracellular concentration of TGF-ß. This conversion takes place through a complex
process of proteolytic activation and dissociation of latency protein subunits. Figure 1-5.
Shows the basic steps involved in the activation of latent TGF-ß. Tissues contain
significant quantities of latent TGF-ß and activation of only a small fraction of this latent
TGF-ß generates maximal cellular responses (Annes et al., 2003).
The action of TGF-ß is mediated by TGF-ß receptor types I (TGF-ß R1) and II
(TGF-ßR2), both of which are serine and threonine kinases. The binding of TGF-ß to
TGF-ßR2 initiates signal transduction, which is followed by its association with TGF-
ßR1. TGF-ßR2 phosphorylates multiple serines and threonines in t`he cytoplasmic
region of TGF-ßR1. The activated TGF-ßR1 in turn phosphorylates and activates the
transcription factors, Smads (Massague, 1998; Massague, 2000).

20
The important role of TGF-ß in the wound repair has led to the use of anti-TGF-ß
antibody (Cordeiro et al., 1999a) and antisense oligonucleotides (Cordeiro et al., 2003)
to block the TGF-ß action. However, these studies in general have targeted the ligand
rather than the receptor. Since, a major limiting step in the cellular activation of TGF-ß
appears to be the ligand engagement by TGF-ßR2; we designed siRNAs targeting this
receptor.
Role of Connective Tissue Growth Factor
CTGF is upregulated in both fibroblasts and epithelium after corneal wound
healing (Blalock et al., 2003). Although it participates in the regulation of diverse
biological processes related to growth and development, the overexpression of CTGF is
correlated with severe fibrotic disorders, including fibrosis in skin, kidney, liver, lung, and
vasculature. CTGF was initially identified as a growth factor, then classified as a
matricellular protein, and most recently appreciated as a matrix component
(Grotendorst, 1997).
It is a member of the CCN2 family of secreted, cell surface, and extracellular
matrix (ECM)–associated 35- to 40-kDa proteins. The diverse range of biological
functions affected by CCN2 proteins is enabled by a unique multi-modular structure
characteristic of the CCN2 family whereby each protein is comprised of four functional
domains. Ligands such as growth factors and cell surface proteins interact specifically
and uniquely with each domain, enabling CTGF and other CCN2 proteins to influence
cellular functions through modulation, potentiation and integration of ligand signals,
signal cross-talk, and intracellular signaling pathways. The different domains of CTGF
are given in Figure 1-7. .

21
Grotendorst and Duncan reported that different domains of the CTGF protein are
responsible for the mediation of the proliferation and differentiation/collagen synthesis
activities of CTGF. The N-terminal domain of CTGF mediates differentiation and
collagen synthesis in concert with IGF-2. The C-terminal domain of CTGF mediates cell
proliferation in concert with EGF (Grotendorst and Duncan, 2005).

22
Figure 1-1. Schematic of RNA interference (Source: Kim, S. S., Garg, H., Joshi, A. and
Manjunath, N. (2009). Strategies for targeted nonviral delivery of siRNAs in vivo. Trends Mol Med 15, 491-500.)

23
Figure 1-2. Polymer based delivery system (Source: Kim, S. S., Garg, H., Joshi, A. and Manjunath, N. (2009). Strategies for targeted nonviral delivery of siRNAs in vivo. Trends Mol Med 15, 491-500.)

24
Figure 1-3. Corneal wound healing steps (Source: Eraslan, M. and Toker, E. (2009).
Mechanisms of Corneal Wound Healing and its modulation following Refractive Surgery. Marmara Medical Journal 22, 169-178.)

25
Figure 1-4. Major phases of wound healing and their associated pathologies (Source:
O'Kane, S. and Ferguson, M. W. J. (1997). Transforming growth factor βs and wound healing. The International Journal of Biochemistry & Cell Biology Volume 29, 63-78.)

26
Figure 1-5. TGF-ß activation and signaling systems (Source: Ruiz-Ortega, M.,
Rodriguez-Vita, J., Sanchez-Lopez, E., Carvajal, G. and Egido, J. (2007). TGF-beta signaling in vascular fibrosis. Cardiovasc Res 74, 196-206.)

27
Figure 1-6. Domains of CTGF

28
Figure 1-7. Interaction of TGF-ß and CTGF in fibrosis
29
CHAPTER 2 METHODS
siRNA Design
The first step in the design of a siRNA is to find the messenger RNA (mRNA)
sequence or the sequence accession number. NCBI’s online database, RefSeq was
used as they represent non-redundant, curated and validated sequences. RefSeq
mRNA sequences are referenced by unique accession numbers starting from NM or XM
followed by 6 digits. Accession numbers for all the three growth factors being tested –
CTGF, TGF-ß, TGF-ßR2 and GAPDH are given in Table 2-1.
Targeting Coding Region
For a siRNA to be effective, it should target the coding region of the gene.
However, the coding region of the growth factors that is being targeted has not been
sequenced in the rabbit genome. Hence, in order to improve the knockdown efficiency,
the designed siRNA’s were aligned and compared with the corresponding sequences of
three different species – mouse, rat and human. siRNA’s were then designed for those
rabbit gene sequences which were homologous to the coding regions of all the three
species. The sequences were aligned using the software – Vector NTI from Invitrogen.
An initial pool of siRNA sequences were designed using the online tools of the
companies –Applied Biosystems and Thermo Scientific. The siRNA selections were
based on the common guidelines, choosing around 21 nucleotides with TT overhangs
that have 30-70% GC content. The most common sequences were then picked out and
custom engineered from Dharmacon. The final target sequence of the siRNA’s of all the
three growth factors are given in Table 2-2.
30
Off Target Effects
It is important to ensure that a region targeted by the siRNA’s does not share
significant homology with other genes or sequences in the genome. Hence, in order to
minimize the off-target effects, the sequences are searched for homology with other
genes using the BLAST design tool from NCBI. There were no homologous regions to
the sequences listed in the table. In addition, a nonspecific, scrambled siRNA duplex
was used as a control to monitor the disruptive effects of transfection on the cell.
Cell Isolation and Culture
Primary fibroblasts were isolated from rabbit cornea. The corneas were peeled off
from the eye, scrapped clean of debris and cut into small pieces. The cornea fragments
were subsequently washed with serum-free Dulbecco’s Modified Eagle’s Medium
(DMEM) and seeded onto 25-mm tissue culture plates using media prepared from a
mixture of DMEM, 15% heat inactivated fetal bovine serum and 1.5% antibiotic-
antimycotic (ABAM). These rabbit fibroblast cells were incubated in 5% CO2 at 37oC.
After 3 days, cells were emerging from the corneal fragments. The fragments were
discarded and the cells were seeded onto T-75 flasks. The media was changed every 3
days and the cells were sub-cultured if the confluency exceeded 80%.
Transfection Efficiency
siRNA’s can be transiently transfected using commonly available transfection
reagents. However, to achieve maximum effectiveness, transfection optimization
experiments are required. In preparation for transfection, cells from T-75 flasks are
trypsinized and plated onto 96 well plates. The cells were serum starved for 48 hours.
The cells were transfected with GAPDH specific siRNA (2uM) duplex and a scrambled
siRNA (2uM) using Mirus transfection reagent (0.3uL, 0.5uL and 0.7uL). The media was

31
changed to normal growth medium after 6 hour and back to serum free after 24 hours.
The cells were tested 48 hours after transfection using the KDalert Tm GAPDH analysis
kit (Applied Biosystems). Also as controls, the corneal fibroblasts were either untreated
or treated only with Mirus transfection reagent. KDalert Tm
Stimulation Experiment
To stimulate the expression CTGF, TGF-ß1 and TGF-ßR2, rabbit corneal
fibroblast cells were seeded and cultured in three 96 well plates. They were serum
starved for 48 hours. CTGF was stimulated by treating one of the plates with TGF-ß1 (3
doses) while TGF-ß1 and TGF-ßR2 were stimulated by treating the plates with varying
concentrations of estradiol (3 doses) dissolved in Absolute ethanol and salt solution. 24
hours after the final dose, the medium was collected in micro centrifuge tubes while cell
lysates were extracted using cell lysis buffer prepared from PBS supplemented with
0.1% Triton® X and protease inhibitors (Roche Cat#1836153). The extracts were stored
at -20oC until further analysis.
TGF-ß1 Quantitation
The frozen samples were thawed on ice. An enzyme-linked immunosorbent assay
(ELISA) kit specific for the quantitation of TGF-ß1 was purchased from R&D Systems,
Inc and used according to the protocol provided. A standard sandwich ELISA
incorporating an immobilized primary antibody in each well of a 384-well Nunc plate was
performed. The latent TGF-ß1 in samples must be activated to an immunoreactive form
that can be detected by an ELISA. Hence, the samples were treated with 1N HCl and
incubated at room temperature for 10 minutes. They were then neutralized by a mixture
of 1.2N NaOH and 0.5M HEPES. The activated samples were then added to plates
seeded with primary antibody overnight. The plates were washed with a washing buffer

32
(0.05% Tween20 in PBS) after each step to remove any non-specifically bound
proteins. A biotin-linked secondary antibody was added and incubated with streptavidin
conjugated to horseradish-peroxide for 20 minutes. The reaction was visualized by the
addition of a substrate solution (H2O2 and tetramethylbenzidine) followed by the addition
of a stop solution (2N H2SO4). The plates are read on a spectrophotometer at 450nm.
CTGF and TGF-ßR2 Protein Quantitation
CTGF and TGF-ßR2 protein quantitation were performed in a similar manner as
previously described for TGF-ß1. Both the proteins do not require activation to be
detected by the ELISA. The antibodies for the CTGF and TGF-ßR2 were separately
ordered from R&D Systems.
siRNA Knockdown Study
Two 96 well plates, one to test the protein level knockdown and the other to test
the mRNA expression knockdown, were seeded for each of the three growth factor. The
cells were serum starved for 2 days and treated with three doses of TGF-ß1 (4ng/mL
per day) and estradiol (8ug/mL per day) respectively. The plates are then transfected
with siRNA (15nM, 30nM, 60nM and 90nM) using the previously optimized
concentration of transfection reagent. Medium was changed to DMEM after 6 hours and
then back to serum free after 24 hours post-transfection. For testing protein expression,
medium was collected in micro centrifuge tubes and cell extracts were lysed using a cell
lysis buffer prepared from PBS supplemented with 0.1% Triton X and protease
inhibitors. The RNA samples were stabilized using an RNAlater RNA Stabilization
Reagent (Qiagen, Inc., Cat. # 76104). The samples were frozen at -20oC until further
use.

33
CTGF, TGF-ß1 and TGF-ßR2 Quantitation
Quantitation of CTGF, TGF, TGF-ßR2 mRNA using q RT-PCR
A Qiagen RNeasy mini isolation kit (Qiagen, Inc., Cat. #74104) was used
according to the manufacturer’s directions to extract RNA from the stabilized samples.
The amount of RNA in the samples was determined using a ND-2000 1-position
spectrophotometer (Thermo Scientific Nano drop). The probes and primers were
optimized to get the final probe and primer concentration. TAQMan™ gene expression
assays specific to CTGF, TGF, TGF-ßR2 and the housekeeping gene GAPDH were
acquired from Applied Biosystems, Inc. and combined with the reverse-transcribed
cDNA and the 2-fold concentrated TAQMan™ Universal PCR Master Mix in a 96-well
PCR reaction plate. Real-Time PCR (RT-PCR) was performed on an Applied
Biosystems 7900HT Fast Real Time PCR System utilizing the manufacturer’s
recommended thermal cycling conditions. The relative gene expression of the growth
factors was calculated using the 2-ΔΔCt method.
Statistical Analysis
All statistical analyses were conducted using GraphPad prism version 5.00 for
Windows (GraphPad Software, San Diego California USA, www.graphpad.com). All
observed statistical differences in this thesis that were in excess of a 95% confidence
interval were considered statistically significant. For protein expression comparisons,
Analysis of Variances (ANOVA) was performed between control, scrambled and all of
the siRNA samples. Tukeys post-hoc assessments were performed to elucidate the
magnitude of the differences.

34
Table 2-1. Accession number of target growth factors
Growth Factor Species Accession Number
CTGF Human Rat Rabbit Mouse
NM_001901 NM_022266.2 AB217855.1 NM_010217
TGF-ßR2 Human Rat Rabbit Mouse
NM_001024847.2 NM_031132 BD061291.1 NM_009371
TGF-ß1 Human Rat Rabbit Mouse
NM_000660 NM_021578 XM_002722312.1 NM_011577.1
Table 2-2. siRNA target sequences
Growth Factor Target sequences
CTGF AAGCTGACCTGGAAGAGAA AAGAAGAGCATGATGTTCA AAGAAGGGCAAGAAGTGCA
TGF-ßR2 GGAAAGAACATGTGAGCAA CGACAGGACTATAAAGATA CAAACTACCTACAGAGATT
TGF-ß1 GCUGACACCCAGUGACACA GCTGAGAGGTGGAGAGGAA GGAGAGAGCTAAACAGAAG
Table 2-3. TAQMAN™ RT PCR Primers and probe sequences
Growth Factor Species Accession Number
CTGF Forward Reverse Probe
AGGAGTGGGTGTGTGATGAG CCAAATGTGTCTTCCAGTCG ACCACACCGTGGTTGGCCCT
TGF-ßR2 Forward Reverse Probe
CGTCGAGACTCCATCTCAAA AAACAGCCCACAAATGTCAA TCAGCTTTGCACAAGGGCCCT
TGF-ß1 Forward Reverse Probe
CCTGTACAACCAGCACAACC CGTAGTACACGATGGGCAGT CTCCAGCGCCTGTGGCACAC
GAPDH Forward Reverse Probe
GAGACACGATGGTGAAGGTC ACAACATCCACTTTGCCAGA CCAATGCGGCCAAATCCGTT

35
CHAPTER 3 RESULTS
Transfection reagents were used to transfect the RBCF cells with the designed
siRNAs. RBCF cells were cultured and seeded onto 96 well plates. Following 48 hours
of serum starvation, the cells were transfected with pre-designed commercially available
GAPDH siRNA using the silencer siRNA transfection kit (Ambion). The KDalert Tm
GAPDH Assay measures the conversion of NAD+ to NADH by GAPDH in the presence
of phosphate and G-3-P. Under the recommended assay conditions, the rate of NADH
production is proportional to the amount of GAPDH enzyme present. This assay can
hence be used to quantitatively determine the amount of GAPDH protein in a sample.
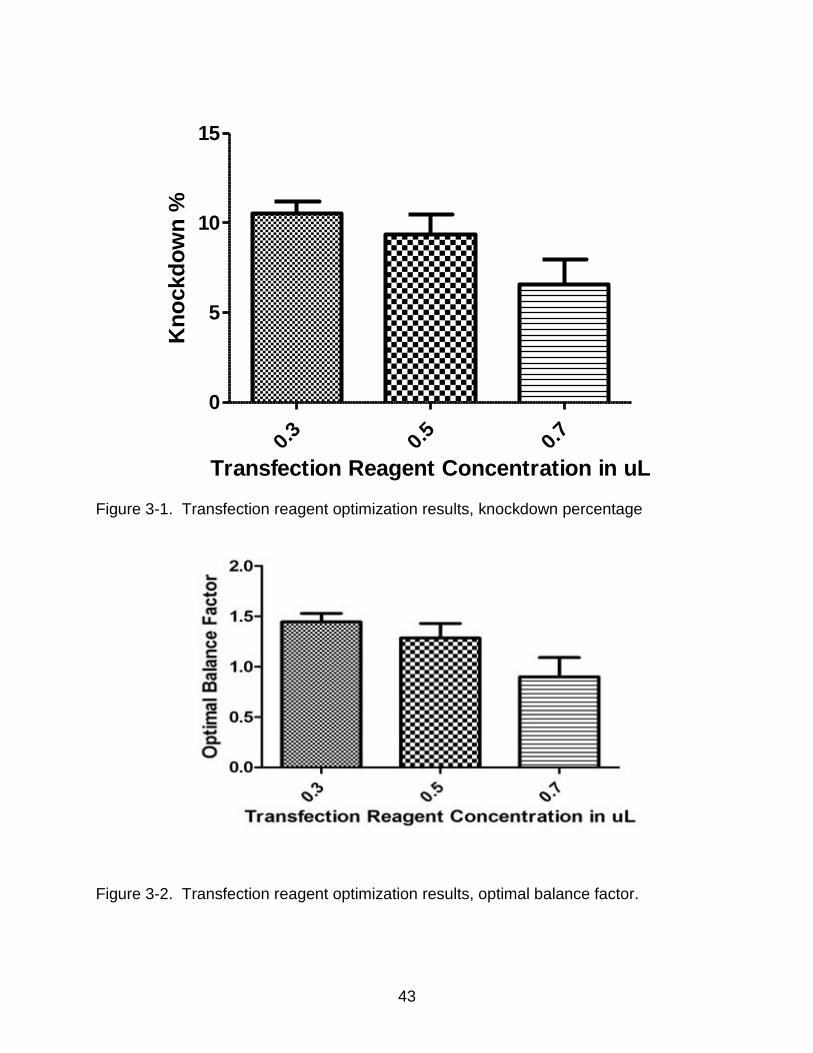
Optimal balance factor (OBF) takes into account both knockdown efficiency and
the effect of a scrambled siRNA on cells. Different reagent concentrations were tested
to optimize transfection complex formation (Applied-Biosystems, 2009).
OBF = ΔA615-Neg × % knockdown
= ΔA615-Neg * {100 – [100 x (ΔA615-GAPDH / ΔA615-Neg)]}
It has been reported in the literature that estradiol stimulated the production of
TGF-ß (Takahashi et al., 1994; Wira et al., 2002). TGF-ß was similarly used as a
stimulant for increasing the concentration of CTGF. In separate experiments, various
concentrations of both the stimulants were tested. It was found that a three day dose of
estradiol (8ug/mL) and TGF-ß (4ng/mL) as opposed to a single high dose resulted in an
increase in the concentration of TGF-ß and CTGF respectively. More specifically, there
was an increase in the protein concentration in the media when compared to the cell
extract. This can probably be explained by the fact that both TGF-ß1 and CTGF are
secreted proteins.

36
Following stimulation, the protein level knockdown efficiency of the siRNA
sequences was calculated by performing ELISA on the stimulated cell cultures. Both the
media and the cell extract were tested and compared against the controls to calculate
knockdown. The results were analyzed using ANOVA and the sequences with
significant knockdown were further analyzed using q-RT PCR.
Custom designed TAQMAN™ probes and primers were designed for each of the
three growth factors. The q-RT PCR results showed that there was reduced mRNA level
expression in the samples when compared with the controls, confirming knockdown
efficiency of the siRNA sequences.
Experiment I
Stimulation of TGF-ß1
The effect of estradiol on TGF-ß1 production by Rabbit corneal fibroblasts in
culture is given in Figure 3-3. Isolated Rabbit corneal fibroblast cells were treated with
varying concentrations of estradiol for 1, 2, and 3 days and incubated in serum free
media for 3 days. Following a change of media at 1 and 2 day of culture, media and cell
extract was collected 24 h later (day 4). The isolated media and cell extract were
collected and stored at 20oC until assayed for TGF-ß1 as described in Materials and
Methods (n =3). Figure 3-3 and Figure 3-4 show the result of ELISA on both the cell
extract and media. In the cell extract, there was no major increase in the concentration
of TGF-ß1 when compared to the controls. However in the media, at a stimulation
concentration of 8ug/mL per day, there was a definite increase in the levels of TGF-ß1
when compared to the controls.
37
TGF-ß1 Knockdown Experiment
Isolated Rabbit corneal fibroblast cells were treated with the previously optimized,
8 ug/mL concentration of estradiol for 1, 2, and 3 days and incubated in serum free
media for 3 days. Following a change of media at day 1 of culture, the cells were
transfected with the designed siRNA sequences. Four different concentrations of siRNA
– 15nM, 30nM, 60nM and 90nM were experimented for transfection. As optimized by
the previous experiment, a concentration of 0.3uL of transfection reagent was used for
all siRNA transfection. Six hours following transfection, the media was changed to
normal growth media with 15% Fetal Bovine Serum to buffer the effect of transfection
on the cells. 18 hours after the media change the cells are reverted back to serum free
media. The remaining two doses of estradiol were administered on days 2 and 3. The
isolated media and cell extract were collected on Day 4 and stored at 20oC until
assayed for TGF-ß1 as described in Materials and Methods (n =3).
Figure 3-5. gives the result of ELSIAs performed on the extracted media and cell
extract. The graph shows the concentration of TGF-ß1 over different concentrations of
siRNA. The arrow bars represent the standard deviation and the symbol * over the bars
signify statistically significant data where p<0.05. It was observed that, when compared
to controls, the concentration of TGF-ß1 was significantly reduced in the media of cells
treated with siRNA sequences 1 and 2 at concentrations of 15nM and 30nM. Although
there was significant reduction in the TGF-ß1 concentration in the cell extract of cells
treated with siRNA concentration of 15nM, none of the other samples show significant
reduction.
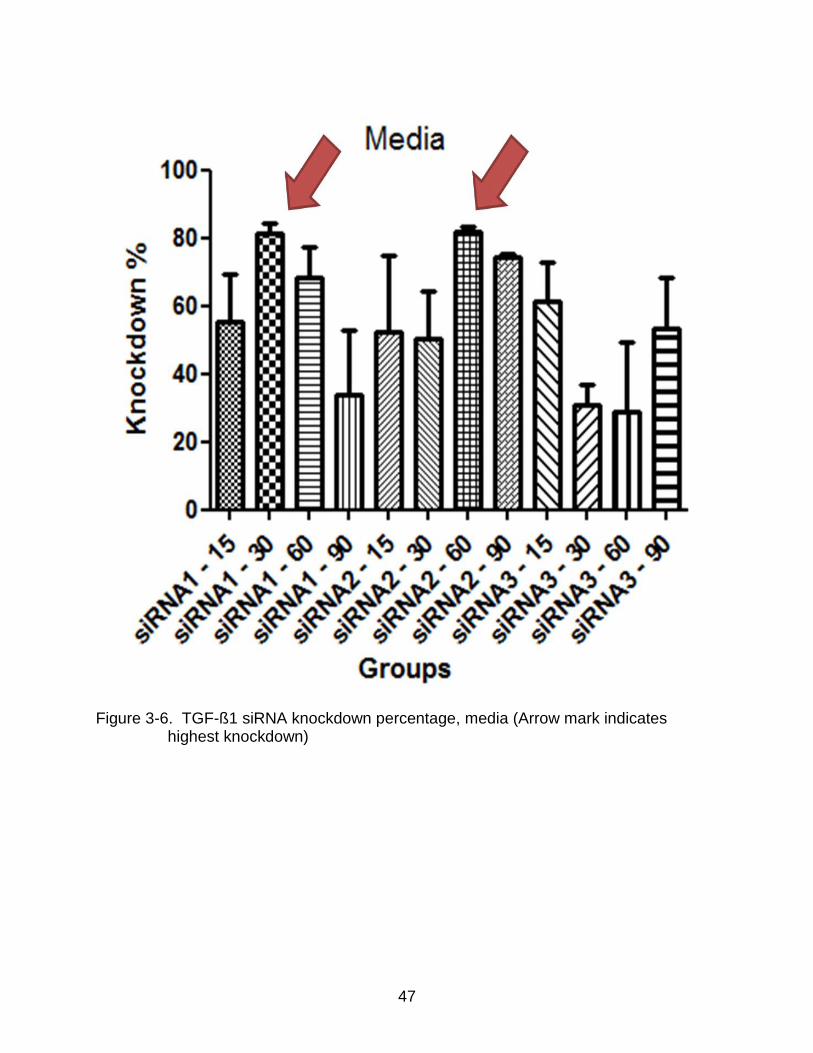
The results were further corroborated by calculating the respective knockdown
percentages of the siRNA treatments. Figure 3-6 and 3-7 give the media and cell extract

38
knockdown percentages of the siRNA sequences. The results show that the highest
knockdown percentage obtained by using siRNA1 was 88% at a concentration of 30nM
while siRNA 2 at concentrations of 60nM respectively gave a knockdown percentage of
89% in the media extract. No knockdown exceeding 60% was observed in the cell
extract of the samples.
mRNA was extracted from samples in which there was significant knockdown
observed. These samples were then subjected to q-RT PCR to measure the mRNA
level knockdown. The primers and probes were optimized using the manufacturer’s
protocol. GAPDH was used as the control. Figure 3-8 gives the mRNA level knockdown
percentages obtained by performing TAQMAN™ q-RT PCR. The resulting knockdown
percentages obtained were similar to those obtained from ELISA at the protein level.
siRNA 1 at a concentration of 30nM showed a knockdown percentage of 94% while
siRNA 2 gave a knockdown percentage of 88% at a concentration of 60nM.
Figure 3-9. shows the ratio of expression of the samples when compared to the
scrambled cells. The cells without transfection had the highest ratio of expression of 1.0
when compared to the transfected cells. Although the scrambled siRNA were designed
not to affect the expression, it does have a slight effect probably due to the stress on
cells from the transfection process.
Experiment II
Stimulation of CTGF
The effect of TGF-ß1on CTGF production by Rabbit corneal fibroblasts in culture
is given in Figure 3-9. Isolated Rabbit corneal fibroblast cells were treated with varying
concentrations of TGF-ß1for 1, 2, and 3 days and incubated in serum free media for 3
days. Following a change of media at 1 and 2 day of culture, media and cell extract was
39
collected 24 h later (day 4). The isolated media and cell extract were collected and
stored at 20oC until assayed for CTGF as described in Materials and Methods (n =3).
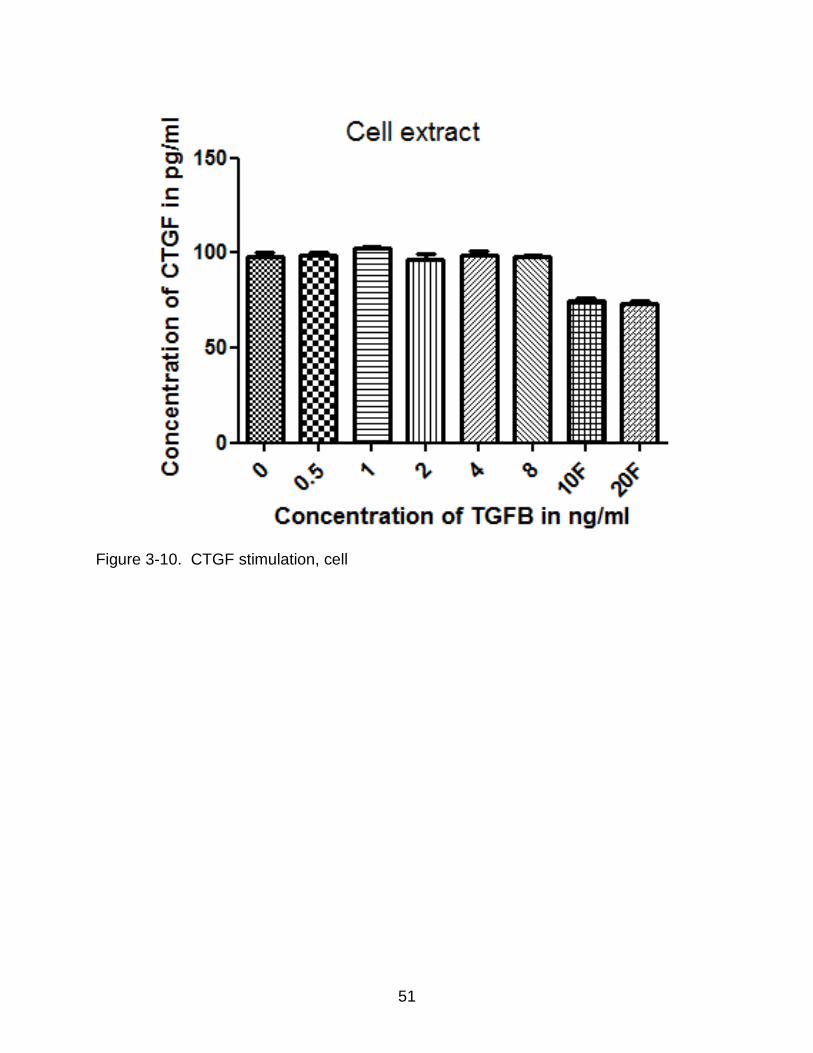
Figure 3-10 and Figure 3-11 show the result of ELISA on both the cell extract and
media. In the cell extract, there was no major increase in the concentration of CTGF
when compared to the controls. However in the media, at a stimulation concentration of
4ng/mL per day, there was a definite increase in the levels of TGF-ß1 when compared
to the controls. Single high doses of 10 ng/mL and 20 ng/mL also failed to stimulate the
production of TGF-ß1.
Effective knockdown was calculated for all three administered siRNAs based on
the level of protein concentration in the controls. The mean knockdown percentage of
the triplicates was calculated to get an average value. siRNA sequences 3 was found to
be effective in knocking down the protein concentration levels of CTGF.
The knockdown percentages were calculated relative to that of the scrambled
siRNA. The knockdown percentages were similar to those calculated from the protein
level concentrations. The triplicate samples were tested in duplicates.
CTGF Knockdown Experiment
Isolated Rabbit corneal fibroblast cells were treated with the previously optimized,
4 ng/mL concentration of TGF-ß1for 1, 2, and 3 days and incubated in serum free
media for 3 days. Following a change of media at day 1 of culture, the cells were
transfected with the designed siRNA sequences. Four different concentrations of siRNA
– 15nM, 30nM, 60nM and 90nM were experimented for transfection. As optimized by
the previous experiment, a concentration of 0.3uL of transfection reagent was used for
all siRNA transfection. Six hours following transfection, the media was changed to
normal growth media with 15% Fetal Bovine Serum to buffer the effect of transfection

40
on the cells. 18 hours after the media change the cells are reverted back to serum free
media. The remaining two doses of TGF-ß1are administered on days 2 and 3. The
isolated media and cell extract were collected on Day 4 and stored at 20oC until
assayed for CTGF as described in Materials and Methods (n =3).
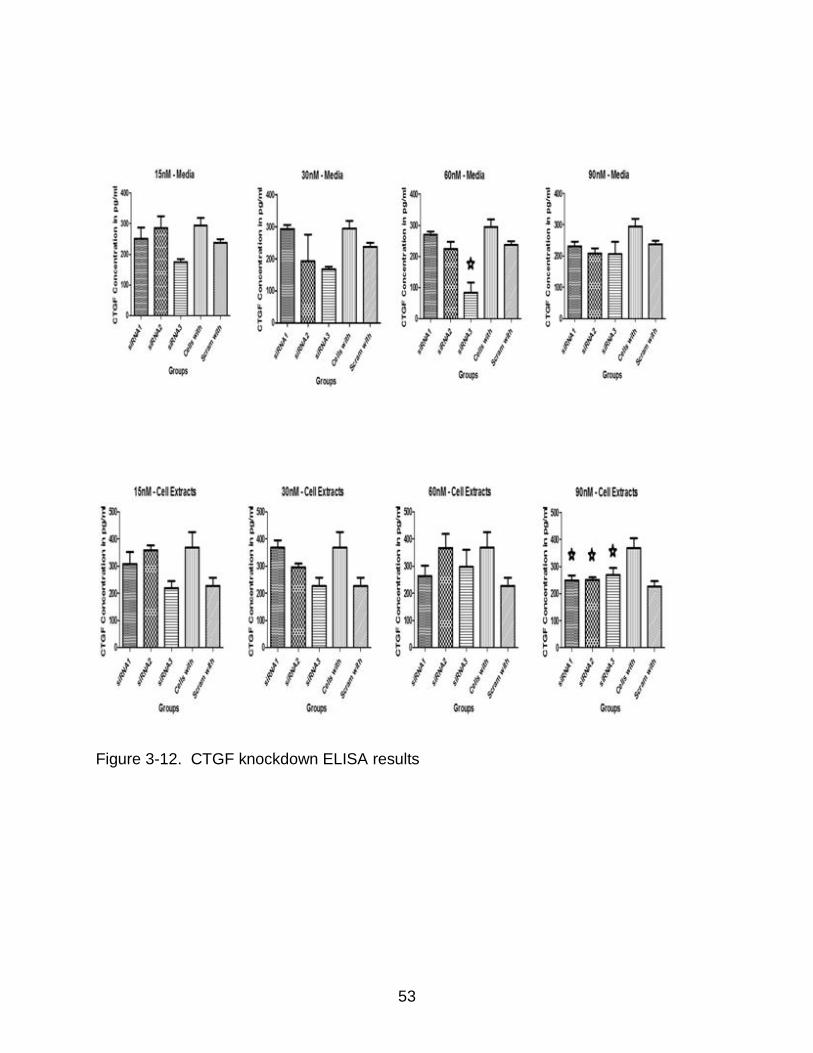
Figure 3-12. gives the result of ELSIAs performed on the extracted media and cell
extract. The graph shows the concentration of CTGF over different concentrations of
siRNA. The arrow bars represent the standard deviation and the symbol * over the bars
signify statistically significant data where p<0.05. It was observed that, when compared
to controls, the concentration of CTGF was significantly reduced in the media of cells
treated with siRNA3 at a concentration of 60nM. There was significant reduction in the
CTGF concentration in the cell extract of cells treated with siRNA concentration of
90nM. However, the knockdown effects were observed only at a high concentration of
siRNA and none of the other samples show significant reduction.
The results were further corroborated by calculating the respective knockdown
percentages of the siRNA treatments. Figure 3-13 and 3-14 give the media and cell
extract knockdown percentages of the siRNA sequences. The results show that the
highest knockdown percentage obtained by using siRNA3 was around 80% at a
concentration of 60nM in the media extract. No knockdown percentage exceeding 60%
was observed in the cell extract of the samples.
mRNA was extracted from samples in which there was significant knockdown
observed. These samples were then subjected to q-RT PCR to measure the mRNA
level knockdown. The primers and probes were optimized using the manufacturer’s
protocol. GAPDH was used as the control. Figure 3-15 gives the mRNA level
41
knockdown percentages obtained by performing TAQMAN™ q-RT PCR. Although, the
q-RT PCR results show some knockdown for siRNA 3 sequences at 60nM
concentration, the standard deviation of the results were high.
Figure 3-16. shows the ratio of expression of the samples when compared to the
scrambled cells. The cells without transfection had the highest ratio of expression of 1.0
when compared to the transfected cells. However, the standard deviations of all the
samples were high to make meaningful conclusions.
Experiment III
TGF-ß-R2 Knockdown Experiment
Isolated Rabbit corneal fibroblast cells were treated with the previously optimized,
8 ug/mL concentration of estradiol for 1, 2, and 3 days and incubated in serum free
media for 3 days. Following a change of media at day 1 of culture, the cells were
transfected with the designed siRNA sequences. Four different concentrations of siRNA
– 15nM, 30nM, 60nM and 90nM were experimented for transfection. As optimized by
the previous experiment, a concentration of 0.3uL of transfection reagent was used for
all siRNA transfection. Six hours following transfection, the media was changed to
normal growth media with 15% Fetal Bovine Serum to buffer the effect of transfection
on the cells. 18 hours after the media change the cells are reverted back to serum free
media. The remaining two doses of estradiol are administered on days 2 and 3. The
isolated media and cell extract were collected on Day 4 and stored at 20oC until
assayed for TGF-ßR2 as described in Materials and Methods (n =3).
Figure 3-17 gives the result of ELSIAs performed on the extracted media and cell
extract. The graph shows the concentration of TGF-ßR2 over different concentrations of
siRNA. The arrow bars represent the standard deviation and the symbol * over the bars
42
signify statistically significant data where p<0.05. It was observed that, when compared
to controls, the concentration of TGF-ßR2 was significantly reduced in the media of cells
treated with siRNA sequence 1 at a concentration of 90nM. Although knockdown of
TGF-ßR2 concentration was observed in the cell extract of cells treated with siRNA,
there was no significant reduction observed. However, the knockdown effects were
observed only at a high concentration of siRNA and none of the other samples show
significant reduction.
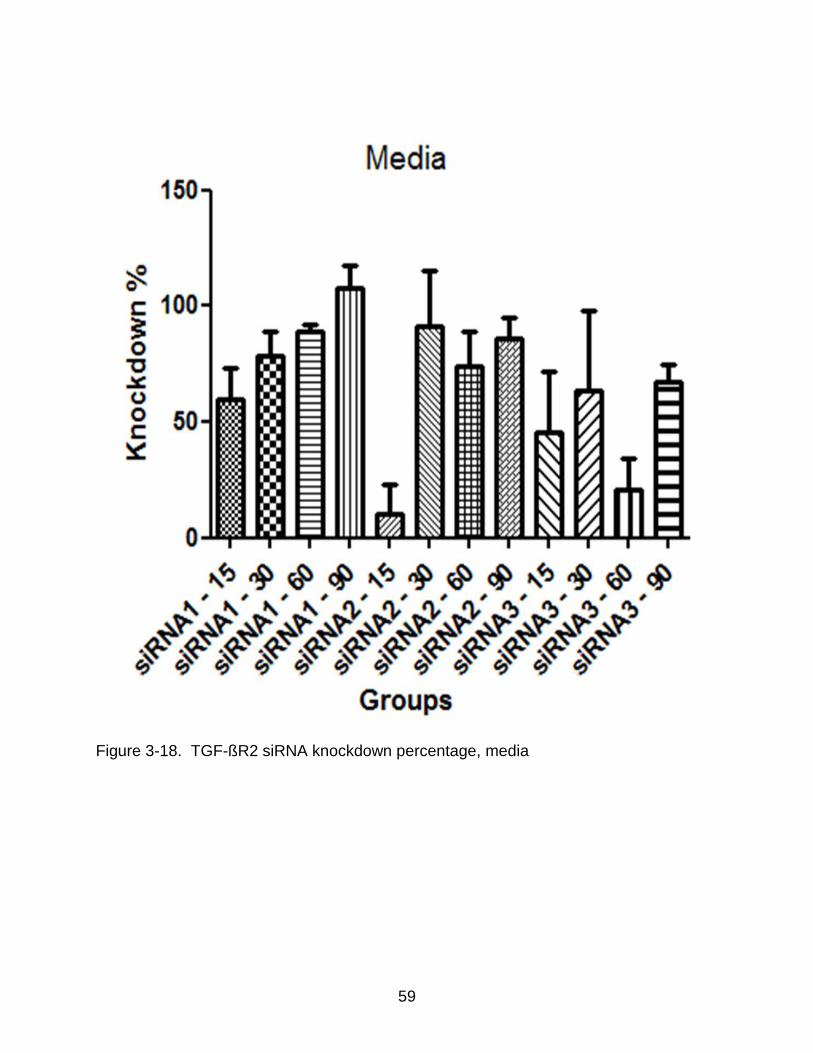
The results were further corroborated by calculating the respective knockdown
percentages of the siRNA treatments. Figure 3-18 and 3-19 give the media and cell
extract knockdown percentages of the siRNA sequences. The results show that the
highest knockdown percentage obtained by using siRNA1 was around 70% at a
concentration of 90nM in the media extract. No knockdown percentage exceeding 60%
was observed in the cell extract of the samples.
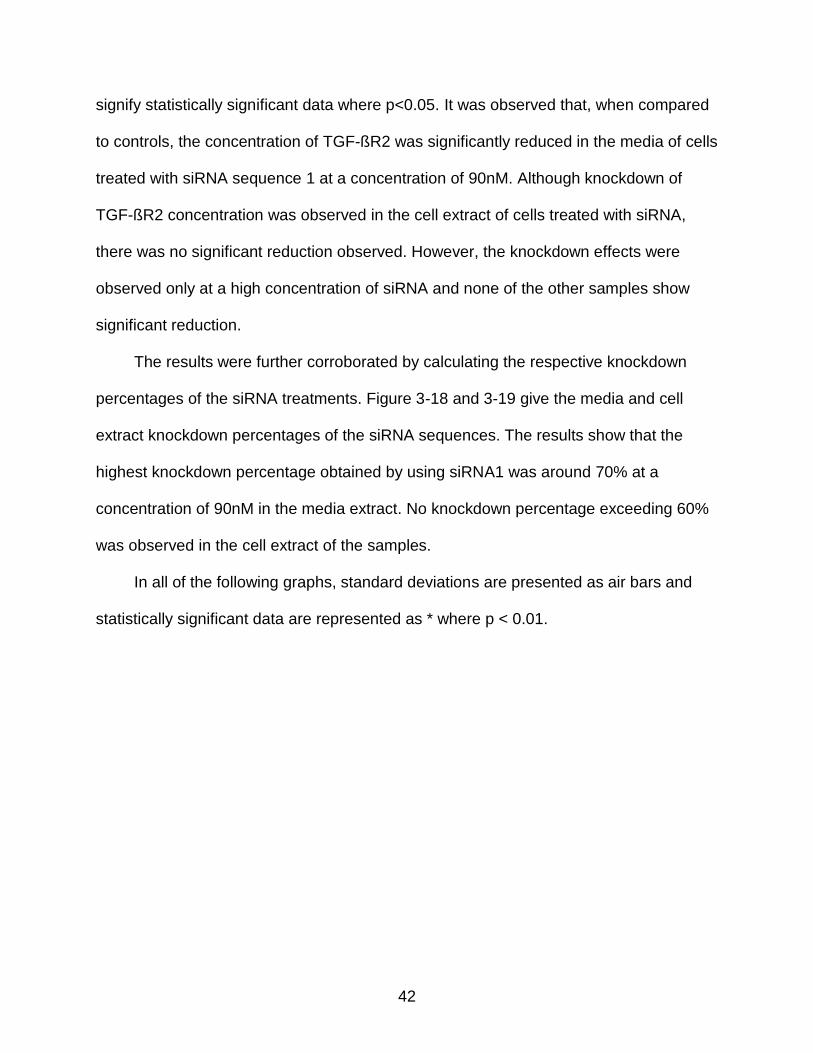
In all of the following graphs, standard deviations are presented as air bars and
statistically significant data are represented as * where p < 0.01.
43
0.3
0.5
0.7
0
5
10
15
Transfection Reagent Concentration in uL
Kn
ockd
ow
n %
Figure 3-1. Transfection reagent optimization results, knockdown percentage
Figure 3-2. Transfection reagent optimization results, optimal balance factor.

44
Figure 3-3. TGF-ß1 stimulation, cell extract

45
Figure 3-4. TGF-ß1 stimulation, media (Arrow mark indicates highest concentration)

46
Figure 3-5. TGF-ß1 siRNA knockdown ELISA results
47
Figure 3-6. TGF-ß1 siRNA knockdown percentage, media (Arrow mark indicates
highest knockdown)

48
Figure 3-7. TGF-ß1 siRNA knockdown percentage, cell

49
Figure 3-8. TGF-ß1 siRNA knockdown q-RT PCR results, knockdown

50
Figure 3-9. TGF-ß1 siRNA knockdown q-RT results, ratio of expression
51
Figure 3-10. CTGF stimulation, cell

52
Figure.3-11. CTGF stimulation, media (Arrow mark indicates highest concentration)
53
Figure 3-12. CTGF knockdown ELISA results

54
Figure 3-13. CTGF siRNA knockdown percentage, media (Arrow mark indicates
highest knockdown)

55
Figure 3-14. CTGF siRNA knockdown percentage, cell

56
Figure 3-15. CTGF siRNA knockdown q-RT results

57
Figure 3-16. CTGF siRNA knockdown q-RT results

58
Figure 3-17. TGF-ßR2 siRNA knockdown ELISA results
59
Figure 3-18. TGF-ßR2 siRNA knockdown percentage, media

60
Figure 3-19. TGF-ßR2 siRNA knockdown percentage, cell

61
CHAPTER 4 DISCUSSION
The goal of this study was to evaluate the knockdown efficiencies of different
custom designed siRNA sequences against TGF-ß1, TGF-ßR2 and CTGF at the protein
as well as the mRNA level. Literature reports that TGF-ß’s expression is largely up-
regulated at wounded sites when compared to the normal tissue. It has also been
shown that CTGF acts as a downstream mediator of TGF-ß during the wound healing
process (Grotendorst, 1997). It was hypothesized that blocking the expression of CTGF
and TGF-ß would help regulate the scarring of tissues. The mRNA sequences of
human, mouse, rat and rabbits were aligned to check their homology. The coding
regions of all the mRNA sequences were found to be highly similar. In this regard,
potent siRNA sequences with high knockdown efficiency against each of the three
identified growth factors were identified.
Ocular fibrotic wound response is a major cause of impaired vision and blindness,
especially following surgical treatment for glaucoma (Migdal et al., 1994). Excessive
post-operative scarring often leads to failure of filtration surgery. While conjuctival anti-
scarring treatments like mitomycin C and 5-fluorouracil benefit a number of patients,
these agents are associated with potentially blinding complications including hypotony,
maculopathy and infection(Cordeiro et al., 1999b; Khaw et al., 1993). Therefore, an
important target in preventing inflammation and fibrosis is to sequester mature TGF-ß
and CTGF. Antibodies to TGF-ß (Jester et al., 1997),TGF-ßR2 (Khaw et al., 1993) and
CTGF(Blalock et al., 2003) have been reported to reduce conjuctival scarring. In
addition, antisense oligonucleotides and ribozymes were also shown to be effective in
wound healing in animal and cell culture studies (Blalock et al., 2003; Cordeiro et al.,

62
2003). However, the neutralizing antibody approach exhibits relatively weak effects in
general as it may not gain full access to the targeted molecules (Yamamoto et al.,
2000). Antisense phosphorothioate oligonucleotides and ribozymes can be successful,
but their effectiveness , stability, and specificity are still in debate(Stein, 2001). It should
also be noted that the TGF-ß1and CTGF produced in lachrymal glands secreted into
tears would not be altered by treatment of the cornea. The concentrations of the siRNA
are generally in the μM range, whereas our present study shows that TGF-ß1 siRNA is
efficacious at 15nM.
Experiment I
The production of TGF-ß1 was greater in the culture media of cells treated with
estradiol when compared to the unstimulated controls. Although, the concentration of
TGF-ß1 in the cell extract was higher than in the media, the amount of stimulation was
lower (Annes et al., 2003). In other words, the difference in the levels of concentration
between the controls and the stimulated samples were higher in the media than in the
cell extract. This could be due to the fact that TGF-ß1 is a secreted protein and a preset
amount of latent TGF-ß1 is already sequestered in the cell. Hence, in response to the
stimulation this latent TGF-ß1 would be activated, initiating the cell response to the
stimulation. This accounts for the high concentration of TGF-ß-1 in the cell extract.
The siRNA sequences were tested at various concentrations. Two of the designed
siRNA sequences gave significant knockdown percentages at lower concentrations of
15nM and 30nM. The knockdown percentages were also similar when compared to
both the media and cell extract. siRNA3 may not have targeted the coding region, which
may be the reason for the lower knockdown percentages.
63
The samples with significant knockdown percentages were subjected to q-RT PCR
analysis. The relative expression of stimulated cells without siRNA transfection was
higher than the cells transfected with siRNA. Although the scrambled siRNA did not
target a coding region and was not supposed to reduce the expression, there was a
slight reduction in the average relative expression. This may be due to the stress on a
cell during the transfection process. The knockdown percentages were calculated from
the relative expression. The results show that there is no knockdown observed in the
controls. Also, the knockdown percentages of the siRNA sequences were similar to
those observed in protein level using ELSIA.
Experiment II
The production of CTGF was greater in the culture media of cells treated with
estradiol when compared to the unstimulated controls. CTGF being a secreted protein
would be expected to have a higher concentration in the media than the cell extract.
Only one of the three designed siRNA sequences (siRNA sequence 3) gave
significant knockdown when compared to the controls. This may be due to the fact that
the siRNA sequences designed did not target the coding region. In the cell extract, there
were significant knockdown percentages at 90nM concentration of three siRNA
sequences. However, these sequences might not be the most efficient in knocking
down due to the high concentration of siRNA required for their effect.
mRNA samples from siRNA sequence 3 along with a dummy inefficient siRNA
was isolated and subjected to q-RT PCR analysis. Although there was some
knockdown observed, the results from the q-RT PCR were inconclusive. The standard
deviations of the controls were high due to low number of verifiable data. This may have
been due to inefficient design of primer sequences.

64
Experiment III
The production of TGF-ßR2 was greater in the cell extract of cells treated with
estradiol when compared to the unstimulated controls. TGF-ßR2 being a membrane
bound protein would be expected to have a higher concentration in the cell extract than
the media (Nakamura et al., 2004).
None of the siRNA sequences showed significant knockdown when compared to
the controls. siRNA sequence 1 showed significant knockdown percentage in the media
at a high concentration of 90nM. However, there was no corresponding knockdown in
the cell extracts and hence was not verifiable. The reason for such low knockdown
percentages may be that the sequences are not targeting the coding region of the TGF-
ßR2 gene.
mRNA samples from siRNA sequence 1 along with a dummy inefficient siRNA
was isolated and subjected to q-RT PCR analysis. No results were observed from the q-
RT PCR analysis. This may be due to inefficient design of primers or there might not
have been a sufficient quantity of mRNA isolated from the samples.
The experiments successfully indicate that the expressions of TGF-ß1, TGF-ßR2
and CTGF can be silenced by efficiently designed siRNA sequences. Both the protein
level concentrations as well as the mRNA expressions were tested and evaluated to
prove this effect.

65
CHAPTER 5 CONCLUSIONS
Overall Conclusions
In this study, we had investigated the knockdown percentages of three individual
siRNA sequences designed against three growth factors namely – TGF-ß1, CTGF and
TGF-ß-R2. Prior to the knockdown experiments, the expression of these growth factors
were stimulated to mimic the cellular wound healing process. The siRNA sequences
designed for TGF-ß1 gave significant knockdown in both the protein and mRNA level.
Future Work
CTGF acts as a downstream mediator of TGF-ß in promoting scar formation. Both
CTGF mRNA and CTGF protein are induced by TGF-ß in fibroblastic cells. Hence, a
siRNA sequence targeting TGF-ß1 should in theory knockdown the activity of CTGF.
Protein and mRNA level expression of CTGF in the samples from TGF-ß1 siRNA
knockdown experiments should be tested for CTGF knockdown.
Although we observed some protein level knockdown in the CTGF knockdown
experiments, the q-RT PCR results were not verifiable. The primer sequences have to
be redesigned and the q-RT PCR analysis has to be repeated. Finally in the TGF-ßR 2
experiments, we were not able to observe significant knockdown in the cell extract nor
were we able to obtain q-RT PCR results. Thus, the siRNA sequences and the primers
have to be redesigned and tested again.
The overall design of the experiment can further be improved by testing the
viability of delivering two siRNA sequences together at the same time. This may in
theory knockdown both the growth factors at the same time, making it more efficient.
Increasing the number of markers associated with the activity of growth factors can also

66
increase the confidence with which the knockdown can be established. The final step in
advancing the experiment would be to test the siRNA sequences in animal models. This
would enable us to observe the off target effects of the siRNA sequences.
67
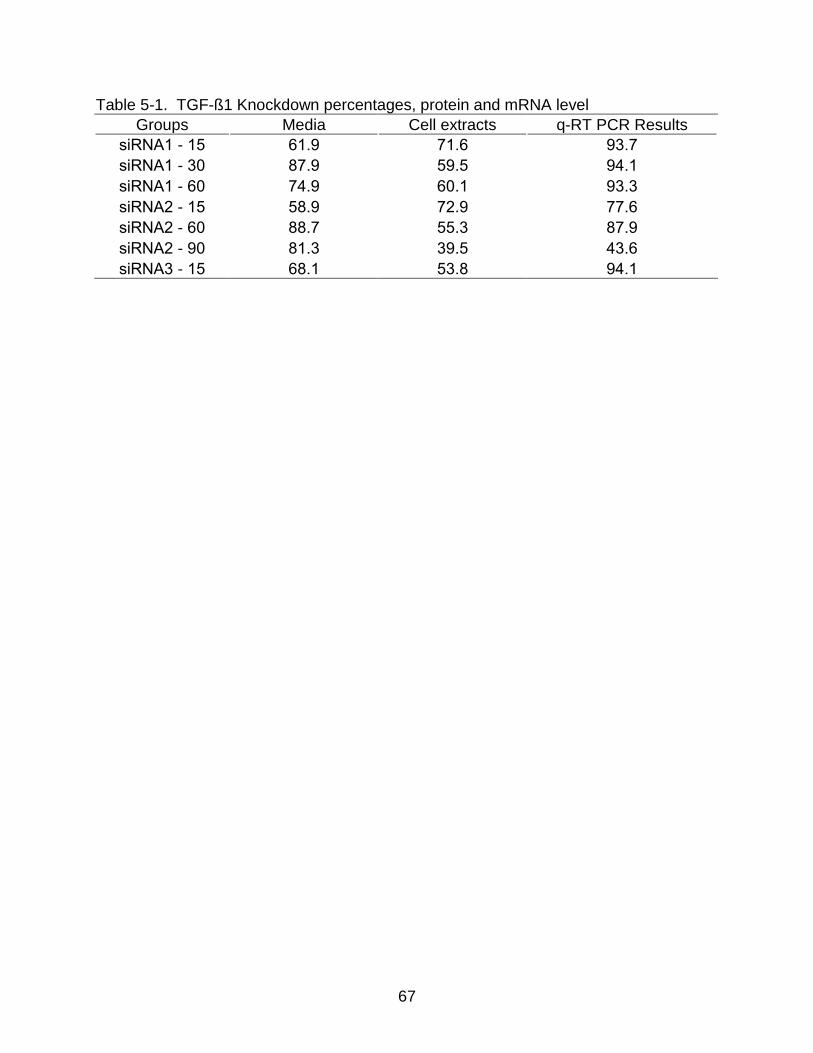
Table 5-1. TGF-ß1 Knockdown percentages, protein and mRNA level
Groups Media Cell extracts q-RT PCR Results
siRNA1 - 15 61.9 71.6 93.7
siRNA1 - 30 87.9 59.5 94.1
siRNA1 - 60 74.9 60.1 93.3
siRNA2 - 15 58.9 72.9 77.6
siRNA2 - 60 88.7 55.3 87.9
siRNA2 - 90 81.3 39.5 43.6
siRNA3 - 15 68.1 53.8 94.1

68
APPENDIX A TGFΒ1 ALIGNMENT SEQUENCES

69

70

71

72

73

74

75

76

77

78

79

80

81

82

83
APPENDIX B TGFΒR2 ALIGNMENT SEQUENCES

84

85

86

87
88

89

90

91
92

93

94

95

96

97

98

99

100

101

102

103

104

105

106
107

108

109

110
111
APPENDIX C CTGF ALIGNMENT SEQUENCES

112

113

114
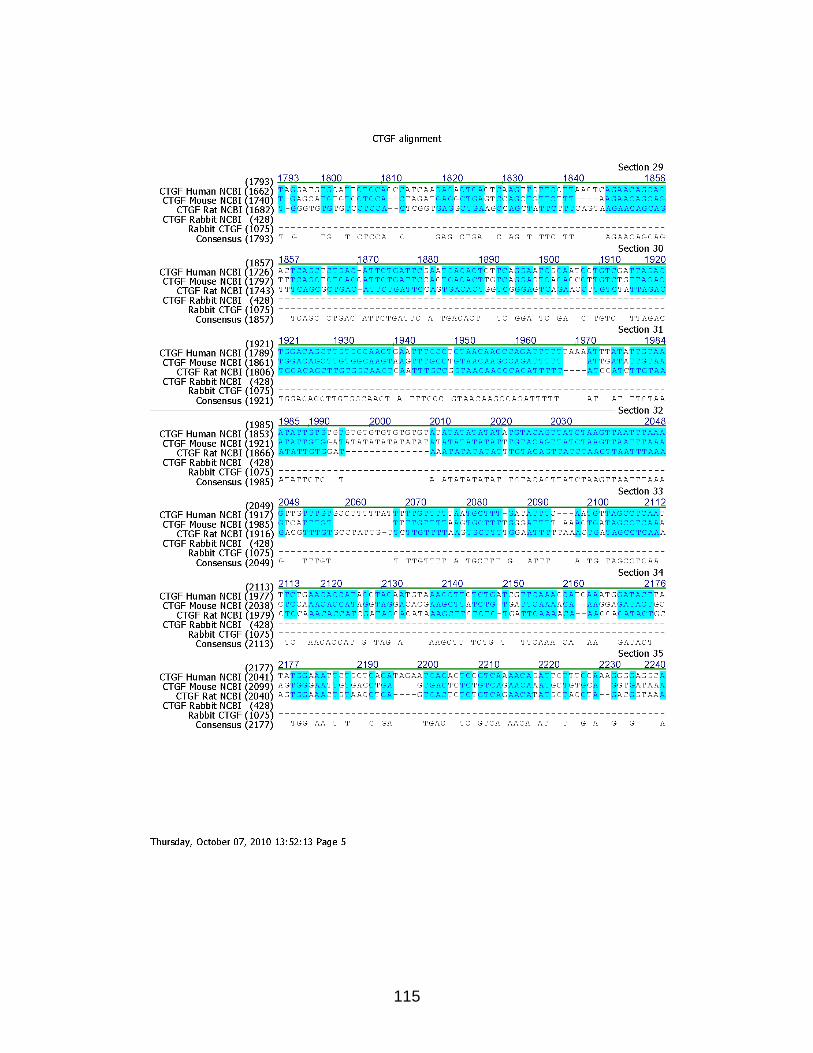
115

116

117
LIST OF REFERENCES
Amarzguioui, M. and Prydz, H. (2004). An algorithm for selection of functional siRNA sequences. Biochem Biophys Res Commun 316, 1050-8.
Angaji, S. A., Hedayati, S. S., Poor, R. H., Madani, S., Poor, S. S. and Panahi, S.
(2010). Application of RNA interference in treating human diseases. J Genet 89, 527-37.
Annes, J. P., Munger, J. S. and Rifkin, D. B. (2003). Making sense of latent TGFbeta
activation. J Cell Sci 116, 217-24. Applied-Biosystems. (2009). KDalert GAPDH Assay kit. Bernstein, E., Caudy, A. A., Hammond, S. M. and Hannon, G. J. (2001). Role for a
bidentate ribonuclease in the initiation step of RNA interference. Nature 409, 363-6. Blalock, T. D., Duncan, M. R., Varela, J. C., Goldstein, M. H., Tuli, S. S.,
Grotendorst, G. R. and Schultz, G. S. (2003). Connective tissue growth factor expression and action in human corneal fibroblast cultures and rat corneas after photorefractive keratectomy. Invest Ophthalmol Vis Sci 44, 1879-87.
Chu, C. Y. and Rana, T. M. (2006). Translation repression in human cells by
microRNA-induced gene silencing requires RCK/p54. PLoS Biol 4, e210. Cordeiro, M. F., Gay, J. A. and Khaw, P. T. (1999a). Human anti-transforming growth
factor-beta2 antibody: a new glaucoma anti-scarring agent. Invest Ophthalmol Vis Sci 40, 2225-34.
Cordeiro, M. F., Mead, A., Ali, R. R., Alexander, R. A., Murray, S., Chen, C., York-
Defalco, C., Dean, N. M., Schultz, G. S. and Khaw, P. T. (2003). Novel antisense oligonucleotides targeting TGF-beta inhibit in vivo scarring and improve surgical outcome. Gene Ther 10, 59-71.
Cordeiro, M. F., Reichel, M. B., Gay, J. A., D'Esposita, F., Alexander, R. A. and
Khaw, P. T. (1999b). Transforming growth factor-beta1, -beta2, and -beta3 in vivo: effects on normal and mitomycin C-modulated conjunctival scarring. Invest Ophthalmol Vis Sci 40, 1975-82.
Dykxhoorn, D. M., Palliser, D. and Lieberman, J. (2006). The silent treatment:
siRNAs as small molecule drugs. Gene Ther 13, 541-52. Eraslan, M. and Toker, E. (2009). Mechanisms of Corneal Wound Healing and its
modulation following Refractive Surgery. Marmara Medical Journal 22, 169-178. Fire, A. (1999). RNA-triggered gene silencing. TIG 15 358.

118
Grotendorst, G. R. (1997). Connective tissue growth factor: a mediator of TGF-beta action on fibroblasts. Cytokine Growth Factor Rev 8, 171-9.
Grotendorst, G. R. and Duncan, M. R. (2005). Individual domains of connective tissue
growth factor regulate fibroblast proliferation and myofibroblast differentiation. FASEB J 19, 729-38.
Hammond, S. M., Boettcher, S., Caudy, A. A., Kobayashi, R. and Hannon, G. J.
(2001). Argonaute2, a link between genetic and biochemical analyses of RNAi. Science 293, 1146-50.
Hornung, V., Guenthner-Biller, M., Bourquin, C., Ablasser, A., Schlee, M.,
Uematsu, S., Noronha, A., Manoharan, M., Akira, S., de Fougerolles, A. et al. (2005). Sequence-specific potent induction of IFN-alpha by short interfering RNA in plasmacytoid dendritic cells through TLR7. Nat Med 11, 263-70.
Jackson, A. L., Burchard, J., Schelter, J., Chau, B. N., Cleary, M., Lim, L. and
Linsley, P. S. (2006). Widespread siRNA "off-target" transcript silencing mediated by seed region sequence complementarity. RNA 12, 1179-87.
Jackson, A. L. and Linsley, P. S. (2010). Recognizing and avoiding siRNA off-target
effects for target identification and therapeutic application. Nat Rev Drug Discov 9, 57-67.
Jester, J. V., Barry-Lane, P. A., Petroll, W. M., Olsen, D. R. and Cavanagh, H. D.
(1997). Inhibition of corneal fibrosis by topical application of blocking antibodies to TGF beta in the rabbit. Cornea 16, 177-87.
Khan, A., Benboubetra, M., Sayyed, P. Z., Ng, K. W., Fox, S., Beck, G., Benter, I. F.
and Akhtar, S. (2004). Sustained polymeric delivery of gene silencing antisense ODNs, siRNA, DNAzymes and ribozymes: in vitro and in vivo studies. J Drug Target 12, 393-404.
Khaw, P. T., Doyle, J. W., Sherwood, M. B., Grierson, I., Schultz, G. and McGorray,
S. (1993). Prolonged localized tissue effects from 5-minute exposures to fluorouracil and mitomycin C. Arch Ophthalmol 111, 263-7.
Kim, S. S., Garg, H., Joshi, A. and Manjunath, N. (2009). Strategies for targeted
nonviral delivery of siRNAs in vivo. Trends Mol Med 15, 491-500. Lu, L., Reinach, P. S. and Kao, W. W. (2001). Corneal epithelial wound healing. Exp
Biol Med (Maywood) 226, 653-64. Martinez, J., Patkaniowska, A., Urlaub, H., hrmann, R. L. and Tuschl, T. (2002).
Single-Stranded Antisense siRNAs guide target RNA cleavage in RNAi. Cell 110, 563-574.

119
Massague, J. (1998). TGF-beta signal transduction. Annu Rev Biochem 67, 753-91. Massague, J. (2000). How cells read TGF-beta signals. Nat Rev Mol Cell Biol 1, 169-
78. Migdal, C., Gregory, W. and Hitchings, R. (1994). Long-term functional outcome after
early surgery compared with laser and medicine in open-angle glaucoma. Ophthalmology 101, 1651-6; discussion 1657.
Mirus. (2011). TransIT-TKO ® Transfection Reagent protocol. Nakamura, H., Siddiqui, S. S., Shen, X., Malik, A. B., Pulido, J. S., Kumar, N. M. and
Yue, B. Y. (2004). RNA interference targeting transforming growth factor-beta type II receptor suppresses ocular inflammation and fibrosis. Mol Vis 10, 703-11.
O'Kane, S. and Ferguson, M. W. J. (1997). Transforming growth factor βs and wound
healing. The International Journal of Biochemistry & Cell Biology Volume 29, 63-78 Peer, D., Park, E. J., Morishita, Y., Carman, C. V. and Shimaoka, M. (2008).
Systemic leukocyte-directed siRNA delivery revealing cyclin D1 as an anti-inflammatory target. Science 319, 627-30.
Robbins, M., Judge, A., Ambegia, E., Choi, C., Yaworski, E., Palmer, L.,
McClintock, K. and MacLachlan, I. (2008). Misinterpreting the therapeutic effects of small interfering RNA caused by immune stimulation. Hum Gene Ther 19, 991-9.
Saharinen, J., Taipale, J. and Keski-Oja, J. (1996). Association of the small latent
transforming growth factor-beta with an eight cysteine repeat of its binding protein LTBP-1. EMBO J 15, 245-53.
Samuel-Abraham, S. and Leonard, J. N. (2010). Staying on message: design
principles for controlling nonspecific responses to siRNA. FEBS J 277, 4828-36. Shim, M. S. and Kwon, Y. J. (2008). Controlled delivery of plasmid DNA and siRNA to
intracellular targets using ketalized polyethylenimine. Biomacromolecules 9, 444-55. Shim, M. S. and Kwon, Y. J. (2010). Efficient and targeted delivery of siRNA in vivo.
FEBS J 277, 4814-27. Song, Q. H., Singh, R. P., Richardson, T. P., Nugent, M. A. and Trinkaus-Randall,
V. (2000). Transforming growth factor-beta1 expression in cultured corneal fibroblasts in response to injury. J Cell Biochem 77, 186-99.
Stein, C. A. (2001). The experimental use of antisense oligonucleotides: a guide for the
perplexed. J Clin Invest 108, 641-4.

120
Stevenson, M. (2004). Therapeutic potential of RNA interference. N Engl J Med 351, 1772-7.
Takahashi, T., Eitzman, B., Bossert, N. L., Walmer, D., Sparrow, K., Flanders, K. C.,
McLachlan, J. and Nelson, K. G. (1994). Transforming growth factors beta 1, beta 2, and beta 3 messenger RNA and protein expression in mouse uterus and vagina during estrogen-induced growth: a comparison to other estrogen-regulated genes. Cell Growth Differ 5, 919-35.
Tiemann, K. and Rossi, J. J. (2009). RNAi-based therapeutics-current status,
challenges and prospects. EMBO Mol Med 1, 142-51. Walton, S. P., Wu, M., Gredell, J. A. and Chan, C. (2010). Designing highly active
siRNAs for therapeutic applications. FEBS J 277, 4806-13. Wira, C. R., Roche, M. A. and Rossoll, R. M. (2002). Antigen presentation by vaginal
cells: role of TGFbeta as a mediator of estradiol inhibition of antigen presentation. Endocrinology 143, 2872-9.
Yamamoto, K., Morishita, R., Tomita, N., Shimozato, T., Nakagami, H., Kikuchi, A.,
Aoki, M., Higaki, J., Kaneda, Y. and Ogihara, T. (2000). Ribozyme oligonucleotides against transforming growth factor-beta inhibited neointimal formation after vascular injury in rat model: potential application of ribozyme strategy to treat cardiovascular disease. Circulation 102, 1308-14.
Yin, J. Q. and Wan, Y. (2002). RNA-mediated gene regulation system: now and the
future (Review). Int J Mol Med 10, 355-65. Yu, F. S., Yin, J., Xu, K. and Huang, J. (2010). Growth factors and corneal epithelial
wound healing. Brain Res Bull 81, 229-35. Zimmermann, T. S., Lee, A. C., Akinc, A., Bramlage, B., Bumcrot, D., Fedoruk, M.
N., Harborth, J., Heyes, J. A., Jeffs, L. B., John, M. et al. (2006). RNAi-mediated gene silencing in non-human primates. Nature 441, 111-4.
121
BIOGRAPHICAL SKETCH
Sriniwas Sriram was born in 1987 in Chennai, India. He graduated from
Sathyabama University in 2002 with a bachelor of technology in biomedical engineering.
He fulfilled his lifelong ambition of studying in the United States when he was granted
admission to a graduate degree in the University of Florida. An internship in the
Carnegie Melon University in the summer of 2010 piqued his interest in the field of RNA
interference. Subsequently in the next semester, he joined the lab of Dr. Schultz and
began working on a treatment to control excessive corneal scarring. He successfully
defended his thesis and completed his graduate studies in May 2011.
On a personal level, Sriniwas loves football and is a passionate fan of Chelsea
football club. Watching Chelsea play live still remains one of his unfulfilled dreams.