laboratory surveillance of proteus morganella and ... · providencia . spp. bacteraemia per 100,000...
TRANSCRIPT

Laboratory surveillance of Proteus, Morganella and Providencia species bacteraemia in England, Wales and Northern Ireland: 2016
Health Protection Report Volume 11 Number 21 16 June 2017

Laboratory surveillance of Proteus, Morganella and Providencia species bacteraemia in England, Wales and
Northern Ireland: 2016.
Health Protection Report Volume 11 Number 21
2
Laboratory surveillance of Proteus, Morganella and Providencia species bacteraemia in England, Wales and Northern Ireland: 2016
These analyses are based on Proteus spp., Morganella spp. and Providencia spp.
bloodstream infections in England, Wales and Northern Ireland during 2009 to 2016. The
data were extracted on 23 May 2017 from Public Health England’s voluntary surveillance
database, Secondary Generation Surveillance System (SGSS). Data for Wales and Northern
Ireland were extracted separately (DataStore on 9 March 2017 and CoSurv on 24 April 2017,
respectively) and are included in the geographical and species analyses only.
SGSS comprises a communicable disease module (CDR; formerly CoSurv/LabBase2) and
an antimicrobial resistance module (AMR; formerly AmSurv). Compared to CDR’s
antimicrobial susceptibility data, the AMR module captures more comprehensive antibiogram
data (involving all antibiotics tested); however, until the launch of SGSS in 2014 fewer
laboratories used the AMR module. Therefore, antimicrobial resistance (defined as reduced-
or non-susceptibility) trends cannot currently be undertaken using data from the AMR
module, but data for 2016 were extracted to assess multidrug-resistance rates.
The data presented here may differ from data in previous publications due to inclusion of late
reports.
Rates of laboratory reported bacteraemia were calculated using mid-year resident population
estimates for the respective year and geography with the exception of 2016 rates, which
were based on 2015 population estimates as population estimates for 2016 were not
available at the time of producing this report [1]. Geographical analyses were based on
residential postcode of the patient if known (otherwise GP postcode if known, or failing that
the postcode of the reporting laboratory) with cases in England being assigned to one of nine
local PHE Centres (PHECs) formed from administrative local authority boundaries.
This report includes analyses of the trends, age and sex distribution, geographical distribution
cases of by Proteus spp., Morganella spp. and Providencia spp. bacteraemia in England,
Wales and Northern Ireland. In addition, antimicrobial susceptibility five-year trends for
England and Northern Ireland have been included in the report, as has a single year of
Laboratory surveillance of Proteus, Morganella and Providencia species bacteraemia in England, Wales and
Northern Ireland: 2016.
Health Protection Report Volume 11 Number 21
3
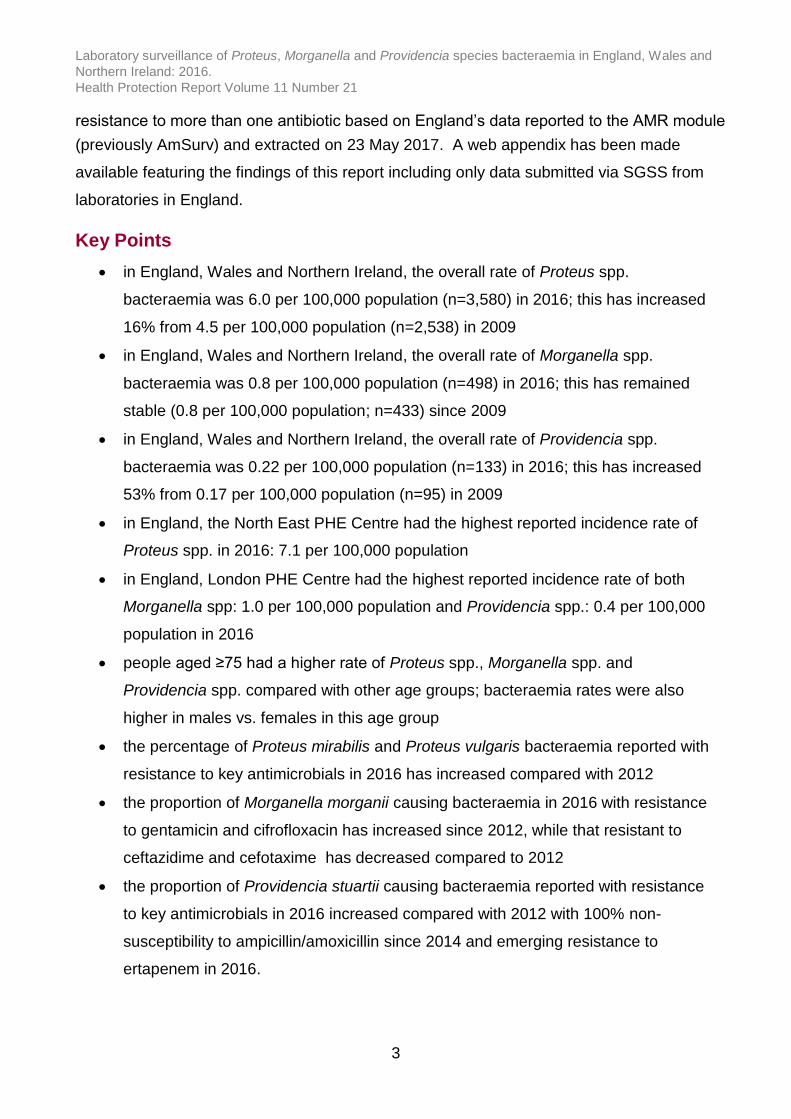
resistance to more than one antibiotic based on England’s data reported to the AMR module
(previously AmSurv) and extracted on 23 May 2017. A web appendix has been made
available featuring the findings of this report including only data submitted via SGSS from
laboratories in England.
Key Points
in England, Wales and Northern Ireland, the overall rate of Proteus spp.
bacteraemia was 6.0 per 100,000 population (n=3,580) in 2016; this has increased
16% from 4.5 per 100,000 population (n=2,538) in 2009
in England, Wales and Northern Ireland, the overall rate of Morganella spp.
bacteraemia was 0.8 per 100,000 population (n=498) in 2016; this has remained
stable (0.8 per 100,000 population; n=433) since 2009
in England, Wales and Northern Ireland, the overall rate of Providencia spp.
bacteraemia was 0.22 per 100,000 population (n=133) in 2016; this has increased
53% from 0.17 per 100,000 population (n=95) in 2009
in England, the North East PHE Centre had the highest reported incidence rate of
Proteus spp. in 2016: 7.1 per 100,000 population
in England, London PHE Centre had the highest reported incidence rate of both
Morganella spp: 1.0 per 100,000 population and Providencia spp.: 0.4 per 100,000
population in 2016
people aged ≥75 had a higher rate of Proteus spp., Morganella spp. and
Providencia spp. compared with other age groups; bacteraemia rates were also
higher in males vs. females in this age group
the percentage of Proteus mirabilis and Proteus vulgaris bacteraemia reported with
resistance to key antimicrobials in 2016 has increased compared with 2012
the proportion of Morganella morganii causing bacteraemia in 2016 with resistance
to gentamicin and cifrofloxacin has increased since 2012, while that resistant to
ceftazidime and cefotaxime has decreased compared to 2012
the proportion of Providencia stuartii causing bacteraemia reported with resistance
to key antimicrobials in 2016 increased compared with 2012 with 100% non-
susceptibility to ampicillin/amoxicillin since 2014 and emerging resistance to
ertapenem in 2016.

Laboratory surveillance of Proteus, Morganella and Providencia species bacteraemia in England, Wales and
Northern Ireland: 2016.
Health Protection Report Volume 11 Number 21
4
Trends
In England, Wales and Northern Ireland, the overall rate of Proteus spp. bacteraemia in
2016 was 6.0 per 100,000 population (n=3,580), 25.7% higher than 4.5 per 100,000
population in 2009 (n=2,538; figure 1). In England, Wales and Northern Ireland, the overall
rate of Morganella spp. bacteraemia in 2016 was 0.8 per 100,000 population (n=498),
remaining stable since 2009 (0.8 per 100,000 population; n=433; figure 1). In England,
Wales and Northern Ireland, the overall rate of Providencia spp. bacteraemia in 2016 was
0.22 per 100,000 population (n=133), this has increased by 53% from 0.17 per 100,000
population (n=95) in 2009 (figure 1).
Proteus miribilis. accounted for 2.0% of monomicrobial bloodstream infections (BSI; all
reported bacteraemia and/or fungaemia) in 2016 making them the seventh most
commonly reported cause of monomicrobial BSI [2]. In contrast, M. morganii accounted for
0.3% (ranked 39th) and Providencia rettgeri and Providencia stuartii accounted for <0.1%
(ranked 103st & 109th) of monomicrobial BSI, respectively in 2016 [2]. Proteus miribilis., M.
morganii, Providencia rettgeri and Providencia stuartii were identified in 2.4%, 0.6%, 0.1%
and 0.1% of polymicrobial BSI, respectively in 2016 [2].
Figure 1. Proteus spp., Morganella spp. and Providencia spp. bacteraemia rate per
100,000 population (England, Wales and Northern Ireland): 2009 to 2016
0
1
2
3
4
5
6
7
2009 2010 2011 2012 2013 2014 2015 2016
Rate
pe
r 1
00
,00
0 p
op
ula
tio
n
Year
Proteus spp. Morganella spp. Providencia spp.

Laboratory surveillance of Proteus, Morganella and Providencia species bacteraemia in England, Wales and
Northern Ireland: 2016.
Health Protection Report Volume 11 Number 21
5
Geographic distribution
The North East PHE Centre had the highest reported incidence rate of Proteus spp.
bacteraemia in 2016, 7.1 per 100,000 population, followed by the East of England PHE
Centre with 6.6 per 100,000 population. North West PHE Centre had the lowest reported
incidence rate of Proteus spp. bacteraemia in 2016 (5.3 per 100,000 population). All PHE
Centres have seen increases in their rates of Proteus spp. bacteraemia since 2012. The
largest increase in the rate of Proteus spp. bacteraemia has been observed in the North
East PHE Centre (66% between 2012 and 2016; table 1a).
Figure 2a. Geographical distribution of Proteus spp. bacteraemia rates per 100,000
population (England, Wales, Northern Ireland): 2016

Laboratory surveillance of Proteus, Morganella and Providencia species bacteraemia in England, Wales and
Northern Ireland: 2016.
Health Protection Report Volume 11 Number 21
6
Table 1a. Proteus spp. bacteraemia per 100,000 population by region (England,
Wales, Northern Ireland): 2012 to 2016
Rate per 100,000 population
Region PHE Centre 2012 2013 2014 2015 2016
North of England
North East 4.3 4.8 5.8 5.4 7.1
North West 4.2 4.1 4.1 5.2 5.3
Yorkshire and Humber 4.3 3.9 4.2 4.4 5.8
Midlands and East of England
East Midlands 4.8 5.1 4.5 5.2 6.1
East of England 4.9 4.9 5.4 5.3 6.6
West Midlands 5.0 4.7 4.7 5.1 5.7
London London 4.3 4.3 4.4 4.3 5.6
South of England South East 3.4 3.9 3.9 4.6 5.4
South West 4.6 4.6 4.4 5.6 6.4
England
4.4 4.4 4.5 4.9 5.9
Wales
5.1 5.7 6.4 6.9 7.1
Northern Ireland 6.1 6.2 5.8 5.9 7.5
England, Wales & Northern Ireland 4.5 4.5 4.6 5.1 6.0

Laboratory surveillance of Proteus, Morganella and Providencia species bacteraemia in England, Wales and
Northern Ireland: 2016.
Health Protection Report Volume 11 Number 21
7
Figure 2b. Geographical distribution of Morganella spp. bacteraemia rates per
100,000 population (England, Wales, Northern Ireland): 2016
London PHE Centre had the highest reported incidence rate of Morganella spp.
bacteraemia in 2016, 1.0 per 100,000 population, followed by the East Midlands and West
Midlands, South West and South East, all with 0.9 per 100,000 population. East of
England had the lowest reported incidence rate of Morganella spp. in 2016, 0.6 per
100,000 population. There has been an overall 16% increase in England, Wales and
Northern Ireland compared with 2012, with decreases observed in East of England (15%),
North West (5%) and Northern Ireland (16%; table 1b).

Laboratory surveillance of Proteus, Morganella and Providencia species bacteraemia in England, Wales and
Northern Ireland: 2016.
Health Protection Report Volume 11 Number 21
8
Table 1b. Morganella spp. bacteraemia per 100,000 population by region (England,
Wales, Northern Ireland): 2012 to 2016
Rate per 100,000 population
Region PHE Centre 2012 2013 2014 2015 2016
North of England
North East 0.6 0.4 0.7 0.4 0.8
North West 0.8 0.5 0.7 0.7 0.8
Yorkshire and Humber 0.7 0.4 0.4 0.6 0.8
Midlands and East of England
East Midlands 0.6 0.6 0.6 0.9 0.9
East of England 0.6 0.8 0.7 0.5 0.6
West Midlands 0.7 0.7 0.8 0.8 0.9
London London 0.9 0.7 0.9 0.8 1.0
South of England South East 0.6 0.6 0.6 0.9 0.9
South West 0.5 0.7 0.8 0.7 0.9
England
0.7 0.6 0.7 0.7 0.8
Wales
0.9 1.0 0.9 1.2 0.8
Northern Ireland 0.8 0.7 0.5 0.5 0.6
England, Wales & Northern Ireland 0.7 0.6 0.7 0.7 0.8

Laboratory surveillance of Proteus, Morganella and Providencia species bacteraemia in England, Wales and
Northern Ireland: 2016.
Health Protection Report Volume 11 Number 21
9
Figure 2c. Geographical distribution of Providencia spp. bacteraemia rates per
100,000 population (England, Wales, Northern Ireland): 2016
London PHE Centre had the highest reported incidence rate of Providencia spp.
bacteraemia in 2016 (0.4 per 100,000 population) followed by East of England, with 0.3
per 100,000 population. Yorkshire and Humber had the lowest reported incidence rate of
Providencia spp. bacteraemia in 2016, <0.1 per 100,000 population. There was variability
in the trends across PHE Centres, however, the aggregate rate has increased steadily by
53% since 2012 from 0.15 per 100,000 population in 2012 to 0.22 per 100,000 population
in 2016.

Laboratory surveillance of Proteus, Morganella and Providencia species bacteraemia in England, Wales and
Northern Ireland: 2016.
Health Protection Report Volume 11 Number 21
10
Table 1c. Providencia spp. bacteraemia per 100,000 population by region (England,
Wales, Northern Ireland): 2012 to 2016
Rate per 100,000 population
Region PHE Centre 2012 2013 2014 2015 2016
North of England
North East 0.2 0.0 0.1 0.2 0.2
North West 0.1 0.1 0.1 0.1 0.2
Yorkshire and Humber 0.2 0.1 0.1 0.1 0.1
Midlands and East of England
East Midlands 0.2 0.1 0.1 0.2 0.2
East of England 0.1 0.2 0.2 0.1 0.3
West Midlands 0.1 0.1 0.3 0.0 0.1
London London 0.2 0.3 0.2 0.3 0.4
South of England South East 0.1 0.2 0.1 0.2 0.2
South West 0.1 0.1 0.1 0.1 0.2
England
0.1 0.2 0.2 0.2 0.2
Wales
0.3 0.2 0.2 0.4 0.2
Northern Ireland 0.2 0.2 0.2 0.1 0.2
England, Wales & Northern Ireland 0.1 0.2 0.2 0.2 0.2
It is of note that in England and Northern Ireland, there are links from the different
laboratories reporting clinically significant isolates to SGSS/CoSurv. Data from Wales is
collected by extraction from a single laboratory information system used by all
microbiology laboratories, where all positive blood cultures are extracted from all
laboratories, including those not thought to be clinically significant.
Laboratory surveillance of Proteus, Morganella and Providencia species bacteraemia in England, Wales and Northern Ireland: 2016.
Health Protection Report Volume 11 Number 21
11
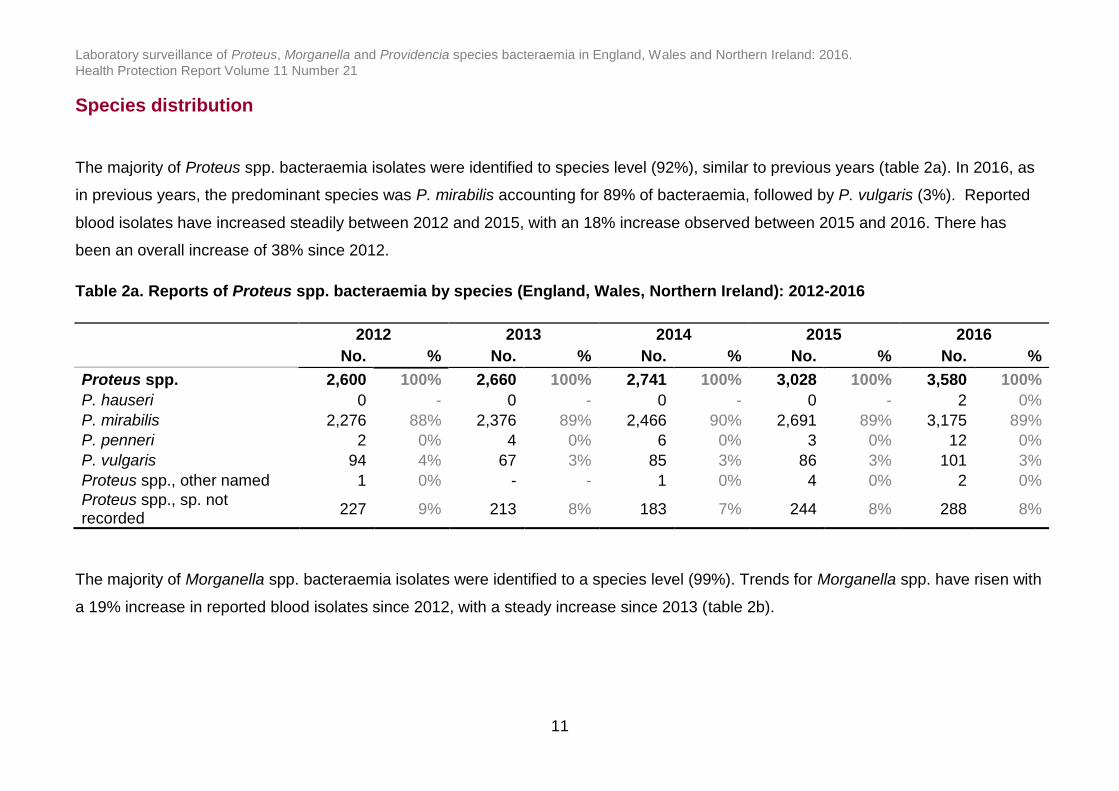
Species distribution
The majority of Proteus spp. bacteraemia isolates were identified to species level (92%), similar to previous years (table 2a). In 2016, as
in previous years, the predominant species was P. mirabilis accounting for 89% of bacteraemia, followed by P. vulgaris (3%). Reported
blood isolates have increased steadily between 2012 and 2015, with an 18% increase observed between 2015 and 2016. There has
been an overall increase of 38% since 2012.
Table 2a. Reports of Proteus spp. bacteraemia by species (England, Wales, Northern Ireland): 2012-2016
2012 2013 2014 2015 2016
No. % No. % No. % No. % No. %
Proteus spp. 2,600 100% 2,660 100% 2,741 100% 3,028 100% 3,580 100%
P. hauseri 0 - 0 - 0 - 0 - 2 0%
P. mirabilis 2,276 88% 2,376 89% 2,466 90% 2,691 89% 3,175 89%
P. penneri 2 0% 4 0% 6 0% 3 0% 12 0%
P. vulgaris 94 4% 67 3% 85 3% 86 3% 101 3%
Proteus spp., other named 1 0% - - 1 0% 4 0% 2 0%
Proteus spp., sp. not recorded
227 9% 213 8% 183 7% 244 8% 288 8%
The majority of Morganella spp. bacteraemia isolates were identified to a species level (99%). Trends for Morganella spp. have risen with
a 19% increase in reported blood isolates since 2012, with a steady increase since 2013 (table 2b).
Laboratory surveillance of Proteus, Morganella and Providencia species bacteraemia in England, Wales and Northern Ireland: 2016.
Health Protection Report Volume 11 Number 21
12
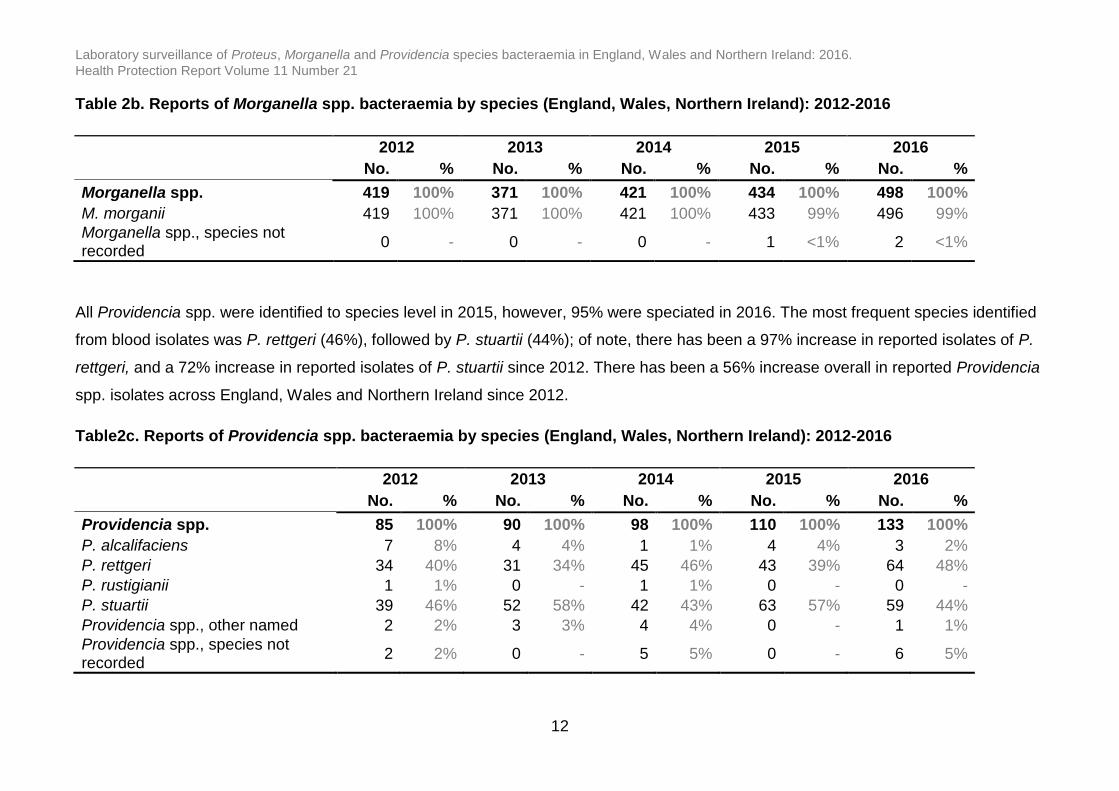
Table 2b. Reports of Morganella spp. bacteraemia by species (England, Wales, Northern Ireland): 2012-2016
2012 2013 2014 2015 2016
No. % No. % No. % No. % No. %
Morganella spp. 419 100% 371 100% 421 100% 434 100% 498 100%
M. morganii 419 100% 371 100% 421 100% 433 99% 496 99%
Morganella spp., species not recorded
0 - 0 - 0 - 1 <1% 2 <1%
All Providencia spp. were identified to species level in 2015, however, 95% were speciated in 2016. The most frequent species identified
from blood isolates was P. rettgeri (46%), followed by P. stuartii (44%); of note, there has been a 97% increase in reported isolates of P.
rettgeri, and a 72% increase in reported isolates of P. stuartii since 2012. There has been a 56% increase overall in reported Providencia
spp. isolates across England, Wales and Northern Ireland since 2012.
Table2c. Reports of Providencia spp. bacteraemia by species (England, Wales, Northern Ireland): 2012-2016
2012 2013 2014 2015 2016
No. % No. % No. % No. % No. %
Providencia spp. 85 100% 90 100% 98 100% 110 100% 133 100%
P. alcalifaciens 7 8% 4 4% 1 1% 4 4% 3 2%
P. rettgeri 34 40% 31 34% 45 46% 43 39% 64 48%
P. rustigianii 1 1% 0 - 1 1% 0 - 0 -
P. stuartii 39 46% 52 58% 42 43% 63 57% 59 44%
Providencia spp., other named 2 2% 3 3% 4 4% 0 - 1 1%
Providencia spp., species not recorded
2 2% 0 - 5 5% 0 - 6 5%

Laboratory surveillance of Proteus, Morganella and Providencia species bacteraemia in England, Wales and
Northern Ireland: 2016.
Health Protection Report Volume 11 Number 21
13
Age and sex distribution
Age distribution of Proteus spp. bacteraemia for 2016 in England, Wales and Northern
Ireland can be seen in figure 3a. The highest rate of Proteus spp. bacteraemia was
observed in those aged 75 years or older (70.8 per 100,000 population), followed by those
aged 65 to 74 years (15.9 per 100,000 population). There were few cases reported in
children aged one to 14. Males had higher rates of Proteus spp. bacteraemia than females
in all age groups, except the 15 to 44 years age group, however incidence in this age band
is low (<1 per 100,000 population).
Figure 3a. Proteus spp. bacteraemia rates per 100,000 population by age and sex
(England, Wales and Northern Ireland): 2016
0
10
20
30
40
50
60
70
80
<1 1 - 4 5 - 9 10 - 14 15 - 44 45 - 64 65 - 74 ≥75
Rate
pe
r 1
00
,00
0 p
op
ula
tio
n
Age group (years)
Female Male

Laboratory surveillance of Proteus, Morganella and Providencia species bacteraemia in England, Wales and
Northern Ireland: 2016.
Health Protection Report Volume 11 Number 21
14
Age distribution of Morganella spp. bacteraemia for 2016 can be seen in figure 3b. The
highest rate of Morganella spp. bacteraemia was observed in those aged 75 years or older
(7.4 per 100,000 population), followed by those aged 65 to 74 years (3.0 per 100,000
population). Males had higher rates of Morganella spp. bacteraemia than females in all
age groups, except in those less than one year of age, where there were no reported
cases in males and the rate in females was 0.6 per 100,000 population. There were no
Morganella spp. bacteraemias reported in females aged one to 14 years.
Figure 3b. Morganella spp. bacteraemia rates per 100,000 population by age and sex
(England, Wales and Northern Ireland): 2016
0
1
2
3
4
5
6
7
8
<1 1 - 4 5 - 9 10 - 14 15 - 44 45 - 64 65 - 74 ≥75
Rate
pe
r 1
00
,00
0 p
op
ula
tio
n
Age group (years)
Female Male

Laboratory surveillance of Proteus, Morganella and Providencia species bacteraemia in England, Wales and
Northern Ireland: 2016.
Health Protection Report Volume 11 Number 21
15
Age distribution of Providencia spp. bacteraemia for 2016 can be seen in figure 3c. The
highest rate of Providencia spp. bacteraemia was observed in those aged 75 years or
older (2.7 per 100,000 population), followed by those aged 65 to 74 years (0.8 per 100,000
population). Males had higher rates of Providencia spp. bacteraemia than females in all
age groups. This gender-disparity was greatest in those aged 75 years or older, with over
a 5-fold difference (2.7 per 100,000 population in males versus 0.5 per 100,000 population
in females in 2016). There were no Providencia spp. bacteraemias reported in persons
less than 15 years of age.
Figure 3c. Providencia spp. bacteraemia rates per 100,000 population by age and
sex (England, Wales and Northern Ireland): 2016
0
1
1
2
2
3
3
<1 1 - 4 5 - 9 10 - 14 15 - 44 45 - 64 65 - 74 ≥75
Rate
pe
r 1
00
,00
0 p
op
ula
tio
n
Age group (years)
Female Male

Laboratory surveillance of Proteus, Morganella and Providencia species bacteraemia in England, Wales and
Northern Ireland: 2016.
Health Protection Report Volume 11 Number 21
16
Antimicrobial resistance: England and Northern Ireland
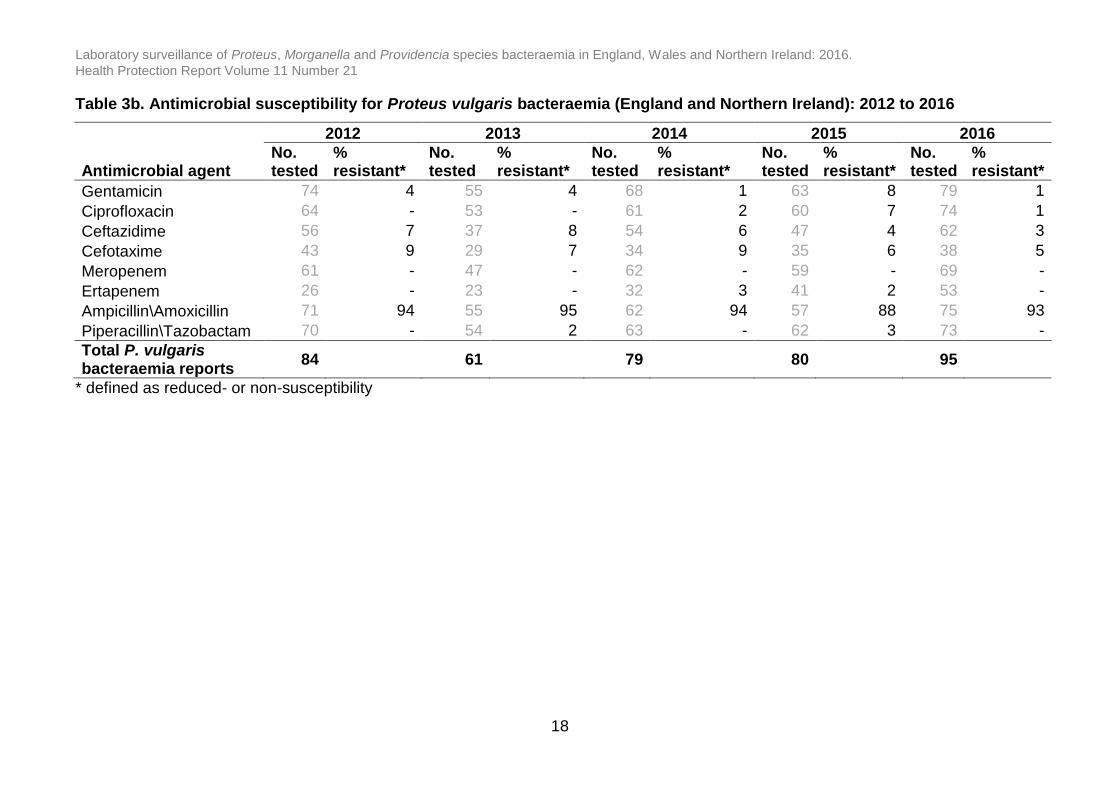
The percentage of Proteus mirabilis and Proteus vulgaris isolates with susceptibility test
results reported in 2016 ranged from 48%-90% and 40%-83%, respectively, for key
antimicrobials (table 3a and 3b). The percentage of non-susceptible P. mirabilis
bacteraemia isolates reported was ampicillin/amoxicillin (32%), gentamicin (9%),
cefotaxime (3%), ceftazidime (2%), ciprofloxacin (8%), piperacillin/tazobactam (2%),
ertapenem (<1%) and meropenem (<1%); which have remained relatively constant since
2012 (table 3a). The percentage of non-susceptible P. vulgaris bacteraemia isolates
reported was ampicillin/amoxicillin (87%), gentamicin (8%), cefotaxime (6%), ceftazidime
(4%), ciprofloxacin (5%), piperacillin/tazoabactam (0%), ertapenem (3%) and meropenem
(0%), these have remained relatively stable since 2012; of note, ertapenem resistance
emerged in 2014 (3%; table 3b). EUCAST report intrinsic resistance to ampicillin in P.
vulgaris [3].
The percentage of Morganella morganii isolates with susceptibility test results reported in
2016 ranged from 45%-86% (table 3c) for key antimicrobials. The percentage of non-
susceptible M. morganii bacteraemia isolates reported was ampicillin/amoxicillin (98%),
gentamicin (12%), cefotaxime (18%), ceftazidime (18%), ciprofloxacin (17%),
piperacillin/tazobactam (6%), ertapenem (1%) and meropenem (<1%); increased
resistance to gentamicin (31%) and ciprofloxacin (45%), and decreased resistance to
ceftazidime (13%) and cefotaxime (3%) has been observed since 2012 (table 3c).
Resistance to meropenem and ertapenem emerged in 2013. EUCAST report intrinsic
resistance to ampicillin/amoxicillin in M. morganii [3].
The percentage of Providencia stuartii isolates with susceptibility test results reported in
2016 ranged from 43%-82%, for key antimicrobials (table 3d). The percentage of non-
susceptible P. stuartii bacteraemia isolates reported in 2016 was ampicillin/amoxicillin
(91%), gentamicin (61%), cefotaxime (13%), ceftazidime (7%), ciprofloxacin (9%),
piperacillin/tazoabactam (2%), ertapenem (5%) and meropenem (2%). Rates of P. stuartii
resistance have increased to the reported antibiotics since 2012 and emerging resistance
to cefotaxime has been observed since 2013 (table 3d). One-hundred percent non-
susceptibility to ampicillin/amoxicillin has been observed in P. stuartii since 2014, with a
slight decrease in resistance observed in 2016; however, high non-susceptibility is
expected due to the possession of chromosomal β-lactamases in P. stuartii [3, 4].

Laboratory surveillance of Proteus, Morganella and Providencia species bacteraemia in England, Wales and Northern Ireland: 2016.
Health Protection Report Volume 11 Number 21
17
Table 3a. Antimicrobial susceptibility for Proteus mirabilis bacteraemia (England and Northern Ireland): 2012 to 2016
2012 2013 2014 2015 2016
Antimicrobial agent No. tested
% resistant*
No. tested
% resistant*
No. tested
% resistant*
No. tested % resistant*
No. tested
% resistant*
Gentamicin 1,931 9 1,978 8 1,971 9 2,277 7 2,679 9 Ciprofloxacin 1,787 9 1,834 8 1,776 8 2,130 9 2,524 8 Ceftazidime 1,462 2 1,448 2 1,430 2 1,745 1 2,017 2 Cefotaxime 1,109 2 1,166 3 1,088 2 1,270 3 1,427 3 Meropenem 1,479 <1 1,619 - 1,623 <1 2,050 - 2,440 <1 Ertapenem 671 <1 871 <1 1,057 <1 1,672 <1 2,049 <1 Ampicillin\Amoxicillin 1,879 34 1,878 34 1,840 35 2,102 34 2,535 32 Piperacillin\Tazobactam 1,778 2 1,882 2 1,796 3 2,133 2 2,466 2
Total P. mirabilis bacteraemia reports
2,144
2,217
2,287
2,493
2,972
* defined as reduced- or non-susceptibility
Laboratory surveillance of Proteus, Morganella and Providencia species bacteraemia in England, Wales and Northern Ireland: 2016.
Health Protection Report Volume 11 Number 21
18
Table 3b. Antimicrobial susceptibility for Proteus vulgaris bacteraemia (England and Northern Ireland): 2012 to 2016
2012 2013 2014 2015 2016
Antimicrobial agent No. tested
% resistant*
No. tested
% resistant*
No. tested
% resistant*
No. tested
% resistant*
No. tested
% resistant*
Gentamicin 74 4 55 4 68 1 63 8 79 1
Ciprofloxacin 64 - 53 - 61 2 60 7 74 1
Ceftazidime 56 7 37 8 54 6 47 4 62 3
Cefotaxime 43 9 29 7 34 9 35 6 38 5
Meropenem 61 - 47 - 62 - 59 - 69 -
Ertapenem 26 - 23 - 32 3 41 2 53 -
Ampicillin\Amoxicillin 71 94 55 95 62 94 57 88 75 93
Piperacillin\Tazobactam 70 - 54 2 63 - 62 3 73 -
Total P. vulgaris bacteraemia reports
84 61 79 80 95
* defined as reduced- or non-susceptibility

Laboratory surveillance of Proteus, Morganella and Providencia species bacteraemia in England, Wales and Northern Ireland: 2016.
Health Protection Report Volume 11 Number 21
19
Table 3c. Antimicrobial susceptibility for Morganella morganii bacteraemia (England and Northern Ireland): 2012 to 2016
2012 2013 2014 2015 2016
Antimicrobial agent No. tested
% resistant*
No. tested
% resistant*
No. tested
% resistant*
No. tested
% resistant*
No. tested
% resistant*
Gentamicin 349 9 300 8 343 8 351 12 405 12
Ciprofloxacin 322 11 278 9 317 12 325 17 384 17
Ceftazidime 261 21 229 18 241 20 275 23 327 18
Cefotaxime 211 18 167 20 181 17 190 22 213 18
Meropenem 262 - 249 <1 289 - 319 <1 384 <1
Ertapenem 120 - 135 <1 178 - 257 <1 320 1
Piperacillin\Tazobactam 319 5 284 8 317 7 342 8 381 6
Total M. morganii bacteraemia reports
391
339
393
397
470
* defined as reduced- or non- susceptibility

Laboratory surveillance of Proteus, Morganella and Providencia species bacteraemia in England, Wales and Northern Ireland: 2016.
Health Protection Report Volume 11 Number 21
20
Table 3d. Antimicrobial susceptibility for Providencia stuartii bacteraemia (England and Northern Ireland): 2012 to 2016
2012 2013 2014 2015 2016
Antimicrobial agent No. tested
% resistant*
No. tested
% resistant*
No. tested
% resistant*
No. tested
% resistant*
No. tested
% resistant*
Gentamicin 29 62 43 56 32 63 51 59 46 61
Ciprofloxacin 30 3 40 13 30 10 48 10 45 9
Ceftazidime 27 7 33 6 25 8 44 9 42 7
Cefotaxime 17 - 29 7 22 5 29 10 24 13
Meropenem 24 - 38 - 24 - 48 2 44 2
Ertapenem 12 - 18 - 20 - 33 3 38 5
Piperacillin\Tazobactam 29 3 41 5 31 3 49 8 44 2
Total P. stuartii bacteraemia reports 37 47 39 60 56
* defined as reduced- or non-susceptibility

Laboratory surveillance of Proteus, Morganella and Providencia species bacteraemia in England, Wales and
Northern Ireland: 2016.
Health Protection Report Volume 11 Number 21
21
Tables 4a-d show the multi-drug resistance of Proteus mirabilis, Proteus vulgaris,
Morganella spp. and Providencia stuartii respectively to third-generation cephalosporins,
gentamicin or ciprofloxacin in a single year snapshot. Multi-drug resistance is rare, seen
for 1-3% of all bacteraemia isolates due to Proteus spp., 4-9% due to M. morganii and 0-
6% of Providencia spp. No multi-drug resistance (MDR) involving three or more antibiotics
was detected in M. morganii or P. vulgaris in 2016. In 2016, less than 1% of bacteraemia
isolates were MDR involving three or more antibiotics in P. mirabilis and 4% were MDR in
P. stuartii, however in P. stuartii, these percentages may be due to small numbers.
Table 4a. Multi-drug antimicrobial testing and resistance summary for Proteus
mirabilis bacteraemia (England): 2016
Antimicrobial combinations No. tested % resistant†
Gentamicin and Ciprofloxacin 2,648 3
Gentamicin and 3rd Generation Cephalosporins* 1,480 2
Ciprofloxacin and 3rd Generation Cephalosporins* 1,465 1 Gentamicin, Ciprofloxacin and 3rd Generation Cephalosporins*
2,605 1
*Cefotaxime, Ceftazidime, Ceftriaxone, Cefpodoxime †defined as reduced- or non-susceptible
Table 4b. Multi-drug antimicrobial testing and resistance summary for Proteus
vulgaris bacteraemia (England): 2016
Antimicrobial combinations No. tested % resistant†
Gentamicin and Ciprofloxacin 73 0
Gentamicin and 3rd Generation Cephalosporins* 38 0
Ciprofloxacin and 3rd Generation Cephalosporins* 39 0 Gentamicin, Ciprofloxacin and 3rd Generation Cephalosporins*
70 0
*Cefotaxime, Ceftazidime, Ceftriaxone, Cefpodoxime †defined as reduced- or non-susceptible

Laboratory surveillance of Proteus, Morganella and Providencia species bacteraemia in England, Wales and
Northern Ireland: 2016.
Health Protection Report Volume 11 Number 21
22
Table 4c. Multi-drug antimicrobial testing and resistance summary for Morganella
spp. bacteraemia (England): 2016
Antimicrobial combinations No. tested % resistant†
Gentamicin and Ciprofloxacin 428 9
Gentamicin and 3rd Generation Cephalosporins* 231 3
Ciprofloxacin and 3rd Generation Cephalosporins* 231 4 Gentamicin, Ciprofloxacin and 3rd Generation Cephalosporins*
417 4
*Cefotaxime, Ceftazidime, Ceftriaxone, Cefpodoxime †defined as reduced- or non-susceptible
Table 4d. Multi-drug antimicrobial testing and resistance summary for Providencia
stuartii bacteraemia (England): 2016
Antimicrobial combinations No. tested % resistant†
Gentamicin and Ciprofloxacin 52 6
Gentamicin and 3rd Generation Cephalosporins* 23 4
Ciprofloxacin and 3rd Generation Cephalosporins* 23 0 Gentamicin, Ciprofloxacin and 3rd Generation Cephalosporins*
50 2
*Cefotaxime, Ceftazidime, Ceftriaxone, Cefpodoxime †defined as reduced- or non-susceptible
For treatment or antibiotic-resistant advice of these opportunistic pathogens or reference
services (species identification, molecular comparison and confirmation of susceptibility
testing results) laboratories may contact the Medical Microbiologists at PHE’s Bacteriology
Reference Department at Colindale on [email protected] and PHE’s
Antimicrobial Resistance and Healthcare Associated Infections (AMRHAI) Reference Unit
in London [5].

Laboratory surveillance of Proteus, Morganella and Providencia species bacteraemia in England, Wales and
Northern Ireland: 2016.
Health Protection Report Volume 11 Number 21
23
Acknowledgements
These reports would not be possible without the weekly contributions from microbiology
colleagues in laboratories across England, Wales, and Northern Ireland, without whom
there would be no surveillance data. The support from colleagues within Public Health
England, the AMRHAI Reference Unit, Public Health Wales and HSC Public Health
Agency (Norther Ireland) in particular, is valued in the preparation of the report. Feedback
and specific queries about this report are welcome and can be sent to
References
1. Office for National Statistics (2015). Population Estimates for UK, England and Wales, Scotland and Northern Ireland: mid-2015, https://www.ons.gov.uk/peoplepopulationandcommunity/populationandmigration/populationestimates/bulletins/annualmidyearpopulationestimates/mid2015.
2. Public Health England (2016). Polymicrobial bacteraemia and fungaemia in England, Wales, and Northern Ireland: 2016. Health Protection Report 11(12), https://www.gov.uk/government/publications/polymicrobial-bacteraemia-and-fungaemia-in-england-wales-and-northern-ireland-2012.
3. European Committee on Antimicrobial Susceptiblity Testing (2016). EUCAST Expert Rules Version 3.1 Intrinsic Resistance and Exceptional Phenotypes Tables, http://www.eucast.org/fileadmin/src/media/PDFs/EUCAST_files/Expert_Rules/Expert_rules_intrinsic_exceptional_V3.1.pdf.
4. Stock I, Wiedemann B (1998). Natural antibiotic susceptibility of Providencia stuartii, P. rettgeri, P. alcalifaciens and P. rustigianii strains. Journal of Medical Microbiology 47: 629-42.
5. PHE website. Antimicrobial Resistance and Healthcare Associated Infections (AMRHAI) Reference Unit, https://www.gov.uk/amrhai-reference-unit-reference-and-diagnostic-services.
Laboratory surveillance of Proteus, Morganella and Providencia species bacteraemia in England, Wales and
Northern Ireland: 2016.
Health Protection Report Volume 11 Number 21
24
About Public Health England
Public Health England exists to protect and improve the nation’s health and
wellbeing, and reduce health inequalities. We do this through world-class science,
knowledge
and intelligence, advocacy, partnerships and the delivery of specialist public health
services. We are an executive agency of the Department of Health, and are a
distinct delivery organisation with operational autonomy to advise and support
government, local authorities and the NHS in a professionally independent manner.
About Health Protection Report
Health Protection Report is a national public health bulletin for England and
Wales, published by Public Health England. It is PHE’s principal channel for the
dissemination of laboratory data relating to pathogens and
infections/communicable diseases of public health significance and of reports on
outbreaks, incidents and ongoing investigations.
Public Health England, Wellington House, 133-155 Waterloo Road, London SE1
8UG
Tel: 020 7654 8000 www.gov.uk/phe
Twitter: @PHE_uk Facebook: www.facebook.com/PublicHealthEngland
Queries relating to this document should be directed to:
HIV and STI Department,
National Infection Service, PHE Colindale,
61 Colindale Avenue, London NW9 5EQ.
© Crown copyright 2017
You may re-use this information (excluding logos) free of charge in any format or
medium, under the terms of the Open Government Licence v3.0. To view this
licence, visit OGL or email [email protected]. Where we have identified
any third party copyright information you will need to obtain permission from the
copyright holders concerned.
Published June 2017
PHE publications gateway number: 2017121