proteus, morganella and providencia species causing ... · table 1c. five-year rates for...
TRANSCRIPT
Infection report
Volume 10 Number 36 Published on: 21 October 2016
Surveillance of Proteus, Morganella and Providencia species causing bacteraemia in England: 2015
These analyses are based on Proteus spp., Morganella spp. and Providencia spp.
bloodstream infections in England during 2008 to 2015. The data were extracted on
23rd September 2016 from Public Health England’s voluntary surveillance database,
Secondary Generation Surveillance System (SGSS). SGSS comprises a
communicable disease module (CDR; formerly CoSurv/LabBase2) and an
antimicrobial resistance module (AMR; formerly AmSurv). Data for Wales and
Northern Ireland were extracted separately (DataStore on 20 July and CoSurv on 27
July 2016, respectively) and are included in the geographical and species analyses
only.
The analyses presented were based on data extracted from the CDR module of
SGSS with the exception of analysis relating to multidrug resistance; this was
extracted from the AMR module of SGSS, which captures more comprehensive data
of multi-resistance rates than the CDR module. The AMR module is not suitable for
trend analyses as it is comprised of recently collected data and has limited laboratory
coverage in previous years.
Rates of bacteraemia were calculated using the relevant mid-year population
estimates [1]. Geographical analyses for England were based on the 15 local PHE
Centres, these were derived by using available postcode (in hierarchical order:
patient, GP or laboratory).
This report includes analyses of the trends, age and sex distribution, geographical
distribution and antimicrobial susceptibility data in cases of bacteraemia caused by
Proteus spp., Morganella spp. and Providencia spp.
Health Protection Report Vol 10 No. 36 – 21 October 2016
The data presented here may differ from previous reports due to inclusion of late
reports and the exclusion of Wales and Northern Ireland from some analyses: eight-
year trends, age and sex distribution and antimicrobial susceptibility.
Key points
in England, the overall rate of Proteus spp. bacteraemia was 4.8 per 100,000
population (n=2,645) in 2015; this has increased from 4.3 per 100,000
population (n=2,285) in 2008
in England, the overall rate of Morganella spp. bacteraemia was 0.7 per
100,000 population (n=385) in 2015; this has decreased from 0.8 per 100,000
population (n=404) in 2008
in England, the overall rate of Providencia spp. bacteraemia was 0.2 per
100,000 population (n=97) in 2015; this has remained stable with 0.2 per
100,000 population (n=94) in 2008
in England, the Devon, Cornwall and Somerset PHE Centre had the highest
reported incidence rate of Proteus spp. in 2015: 6.1 per 100,000 population,
followed by Cumbria and Lancashire (5.7 per 100,000 population). The lowest
rate was seen in Thames Valley (3.5 per 100,000 population)
in England, Kent Surrey and Sussex PHE Centre had the highest reported
incidence rate of Morganella spp. in 2015: 1.1 per 100,000 population,
followed by the East Midlands (0.9 per 100,000 population). The lowest rates
were seen in South Midlands and Hertfordshire (0.3 per 100,000 population)
in England, Thames Valley PHE Centre had the highest reported incidence
rate of Providencia spp. in 2015: 0.4 per 100,000 population, followed by
London (0.3 per 100,000 population). The lowest rate was seen in the West
Midlands (<0.1 per 100,000 population)
the majority of bloodstream infection isolates identified as Proteus spp. were
P. mirabilis (87.4%) and P. vulgaris (3.4%)
the majority of bloodstream infection isolates identified as Providenca spp.
were P. stuartii (54.6%) and P. rettgeri (34.1%)
those aged ≥75 had a higher rate of Proteus spp., Morganella spp. and
Providencia spp. compared with other age groups
males were more commonly infected by Proteus spp., Morganella spp. and
Providencia spp. compared with females

Health Protection Report Vol 10 No. 36 – 21 October 2016
the proportion of Proteus mirabilis and Proteus vulgaris bacteraemia reported
with resistance to key antimicrobials in 2015 remained stable compared with
2011, emerging resistance to ertapenem has been observed in P. vulgaris
since 2014
the proportion of Morganella morganii bacteraemia reported with resistance to
key antimicrobials in 2015 has observed increased resistance to gentamicin
and ciprofloxacin, decreased resistance to ceftazidime and cefotaxime and no
change in ampicillin/amoxicillin resistance since 2011
the proportion of Providencia stuartii bacteraemia reported with resistance to
key antimicrobials in 2015 increased compared with 2011 with 100% non-
susceptibility to ampicillin/amoxicillin since 2014 and emerging resistance to
ertapenem in 2015
Health Protection Report Vol 10 No. 36 – 21 October 2016
Trends: England
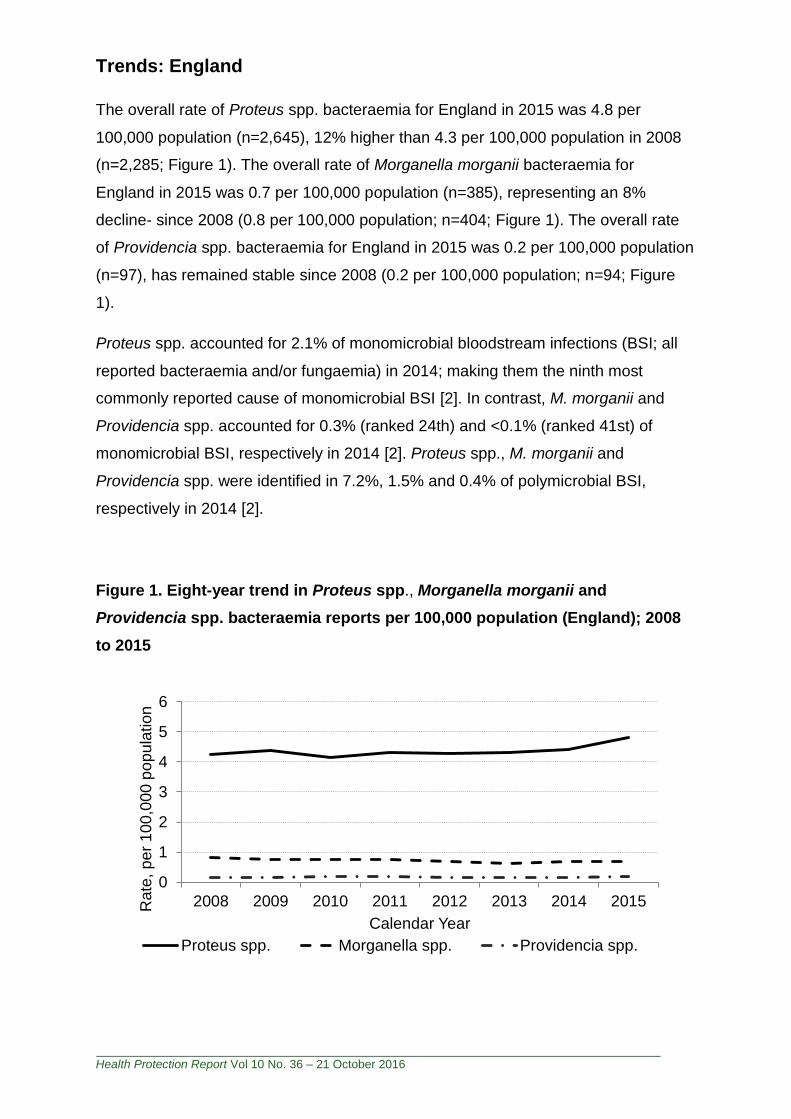
The overall rate of Proteus spp. bacteraemia for England in 2015 was 4.8 per
100,000 population (n=2,645), 12% higher than 4.3 per 100,000 population in 2008
(n=2,285; Figure 1). The overall rate of Morganella morganii bacteraemia for
England in 2015 was 0.7 per 100,000 population (n=385), representing an 8%
decline- since 2008 (0.8 per 100,000 population; n=404; Figure 1). The overall rate
of Providencia spp. bacteraemia for England in 2015 was 0.2 per 100,000 population
(n=97), has remained stable since 2008 (0.2 per 100,000 population; n=94; Figure
1).
Proteus spp. accounted for 2.1% of monomicrobial bloodstream infections (BSI; all
reported bacteraemia and/or fungaemia) in 2014; making them the ninth most
commonly reported cause of monomicrobial BSI [2]. In contrast, M. morganii and
Providencia spp. accounted for 0.3% (ranked 24th) and <0.1% (ranked 41st) of
monomicrobial BSI, respectively in 2014 [2]. Proteus spp., M. morganii and
Providencia spp. were identified in 7.2%, 1.5% and 0.4% of polymicrobial BSI,
respectively in 2014 [2].
Figure 1. Eight-year trend in Proteus spp., Morganella morganii and
Providencia spp. bacteraemia reports per 100,000 population (England); 2008
to 2015
0
1
2
3
4
5
6
2008 2009 2010 2011 2012 2013 2014 2015Rate
, p
er
10
0,0
00
po
pu
lation
Calendar Year
Proteus spp. Morganella spp. Providencia spp.
Health Protection Report Vol 10 No. 36 – 21 October 2016
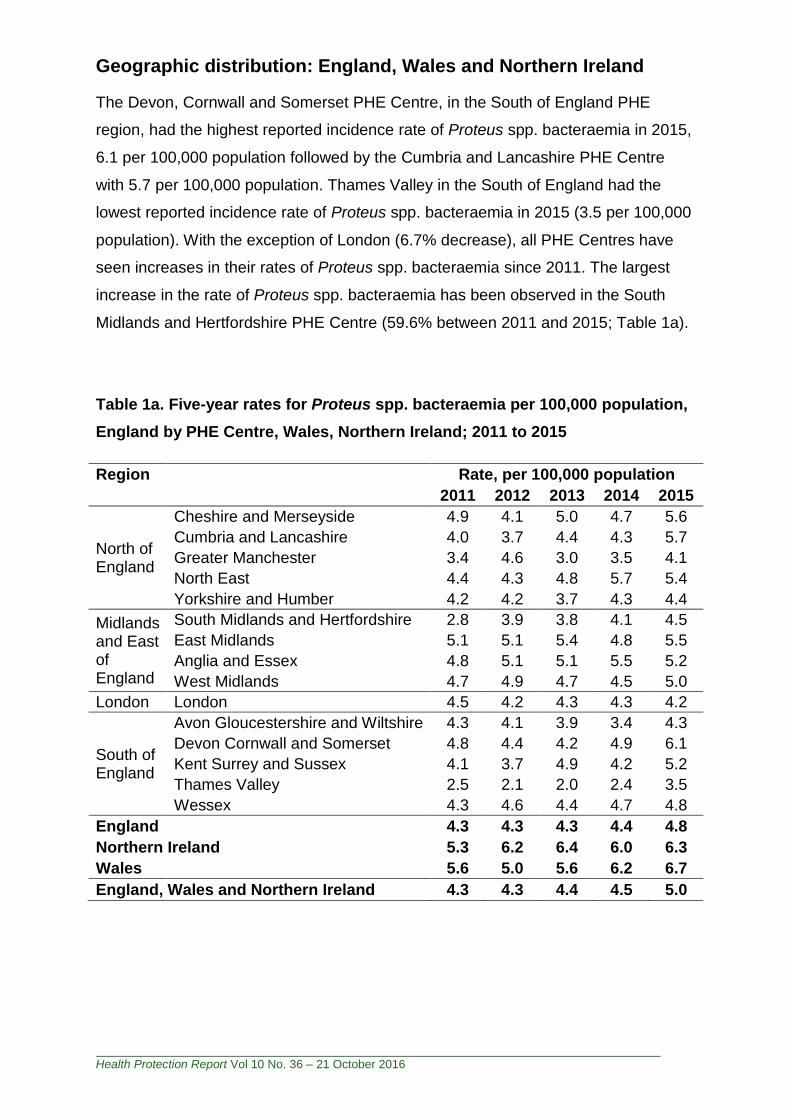
Geographic distribution: England, Wales and Northern Ireland
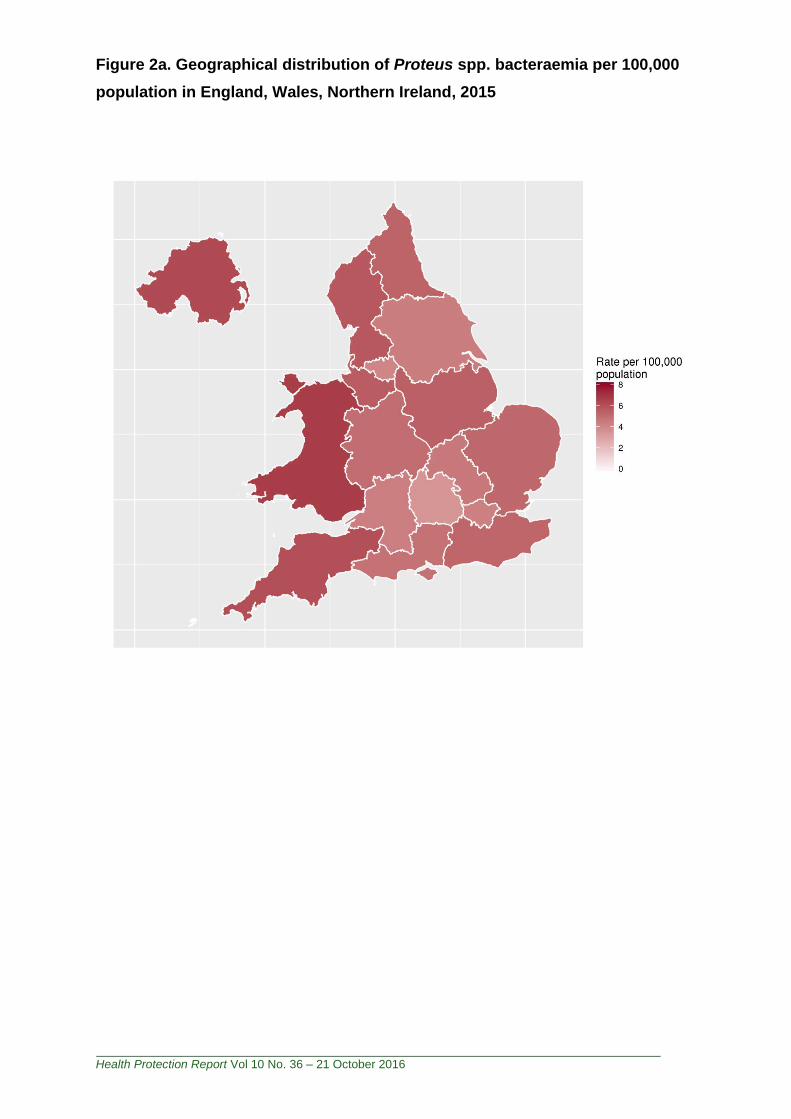
The Devon, Cornwall and Somerset PHE Centre, in the South of England PHE
region, had the highest reported incidence rate of Proteus spp. bacteraemia in 2015,
6.1 per 100,000 population followed by the Cumbria and Lancashire PHE Centre
with 5.7 per 100,000 population. Thames Valley in the South of England had the
lowest reported incidence rate of Proteus spp. bacteraemia in 2015 (3.5 per 100,000
population). With the exception of London (6.7% decrease), all PHE Centres have
seen increases in their rates of Proteus spp. bacteraemia since 2011. The largest
increase in the rate of Proteus spp. bacteraemia has been observed in the South
Midlands and Hertfordshire PHE Centre (59.6% between 2011 and 2015; Table 1a).
Table 1a. Five-year rates for Proteus spp. bacteraemia per 100,000 population,
England by PHE Centre, Wales, Northern Ireland; 2011 to 2015
Region Rate, per 100,000 population
2011 2012 2013 2014 2015
North of England
Cheshire and Merseyside 4.9 4.1 5.0 4.7 5.6
Cumbria and Lancashire 4.0 3.7 4.4 4.3 5.7
Greater Manchester 3.4 4.6 3.0 3.5 4.1
North East 4.4 4.3 4.8 5.7 5.4
Yorkshire and Humber 4.2 4.2 3.7 4.3 4.4
Midlands and East of England
South Midlands and Hertfordshire 2.8 3.9 3.8 4.1 4.5
East Midlands 5.1 5.1 5.4 4.8 5.5
Anglia and Essex 4.8 5.1 5.1 5.5 5.2
West Midlands 4.7 4.9 4.7 4.5 5.0
London London 4.5 4.2 4.3 4.3 4.2
South of England
Avon Gloucestershire and Wiltshire 4.3 4.1 3.9 3.4 4.3
Devon Cornwall and Somerset 4.8 4.4 4.2 4.9 6.1
Kent Surrey and Sussex 4.1 3.7 4.9 4.2 5.2
Thames Valley 2.5 2.1 2.0 2.4 3.5
Wessex 4.3 4.6 4.4 4.7 4.8
England 4.3 4.3 4.3 4.4 4.8
Northern Ireland 5.3 6.2 6.4 6.0 6.3
Wales 5.6 5.0 5.6 6.2 6.7
England, Wales and Northern Ireland 4.3 4.3 4.4 4.5 5.0
Health Protection Report Vol 10 No. 36 – 21 October 2016
Figure 2a. Geographical distribution of Proteus spp. bacteraemia per 100,000
population in England, Wales, Northern Ireland, 2015

Health Protection Report Vol 10 No. 36 – 21 October 2016
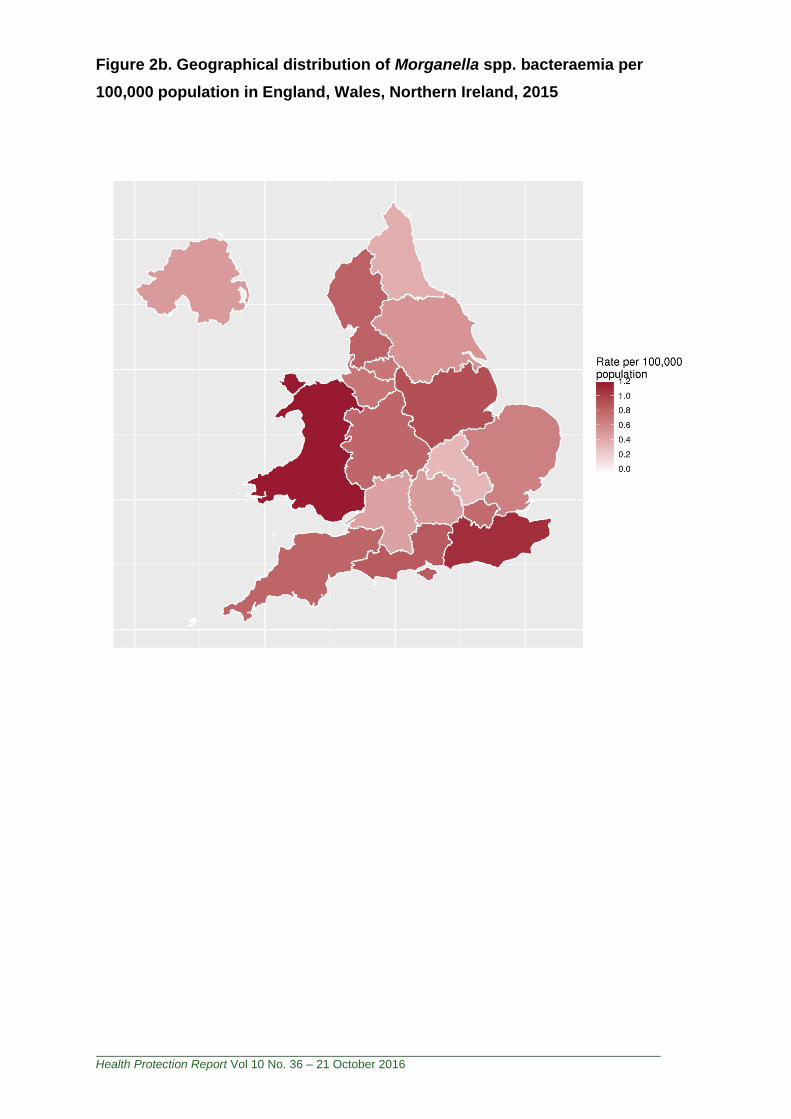
Kent, Surrey and Sussex PHE Centre, in the South of England PHE region, had the
highest reported incidence rate of Morganella spp. bacteraemia in 2015, 1.1 per
100,000 population, followed by the East Midlands with 0.9 per 100,000 population.
South Midlands and Hertfordshire had the lowest reported incidence rate of
Morganella spp. in 2015, 0.3 per 100,000 population. There has been an overall
decrease in England, Wales and Northern Ireland compared with 2011, however,
there was variability in the trends across PHE Centres, with a 72% increase in rate,
between 2011 and 2015, observed in the Wessex PHE Centre (Table 1b).
Table 1b. Five year rates for Morganella spp. bacteraemia per 100,000
population, England by PHE Centre, Wales, Northern Ireland; 2011 to 2015
Region Rate, per 100,000 population
2011 2012 2013 2014 2015
North of England
Cheshire and Merseyside 0.5 0.7 0.5 0.9 0.7
Cumbria and Lancashire 0.7 1.2 0.7 0.5 0.8
Greater Manchester 0.9 0.7 0.4 0.7 0.7
North East 0.5 0.6 0.4 0.7 0.4
Yorkshire and Humber 0.9 0.7 0.4 0.4 0.5
Midlands and East of England
South Midlands and Hertfordshire 0.6 0.6 0.7 0.7 0.3
East Midlands 1.0 0.6 0.6 0.7 0.9
Anglia and Essex 0.8 0.6 0.8 0.7 0.6
West Midlands 0.8 0.7 0.7 0.8 0.8
London London 0.8 0.9 0.7 0.8 0.8
South of England
Avon Gloucestershire and Wiltshire 0.7 0.4 0.5 0.7 0.5
Devon Cornwall and Somerset 0.6 0.5 0.9 0.8 0.8
Kent Surrey and Sussex 0.9 0.8 0.7 0.9 1.1
Thames Valley 0.5 0.3 0.3 0.4 0.5
Wessex 0.5 0.5 0.5 0.5 0.8
England 0.8 0.7 0.6 0.7 0.7
Northern Ireland 0.7 0.8 0.7 0.5 0.5
Wales 1.8 0.9 1.0 0.9 1.2
England, Wales and Northern Ireland 0.8 0.7 0.6 0.7 0.7
Health Protection Report Vol 10 No. 36 – 21 October 2016
Figure 2b. Geographical distribution of Morganella spp. bacteraemia per
100,000 population in England, Wales, Northern Ireland, 2015
Health Protection Report Vol 10 No. 36 – 21 October 2016
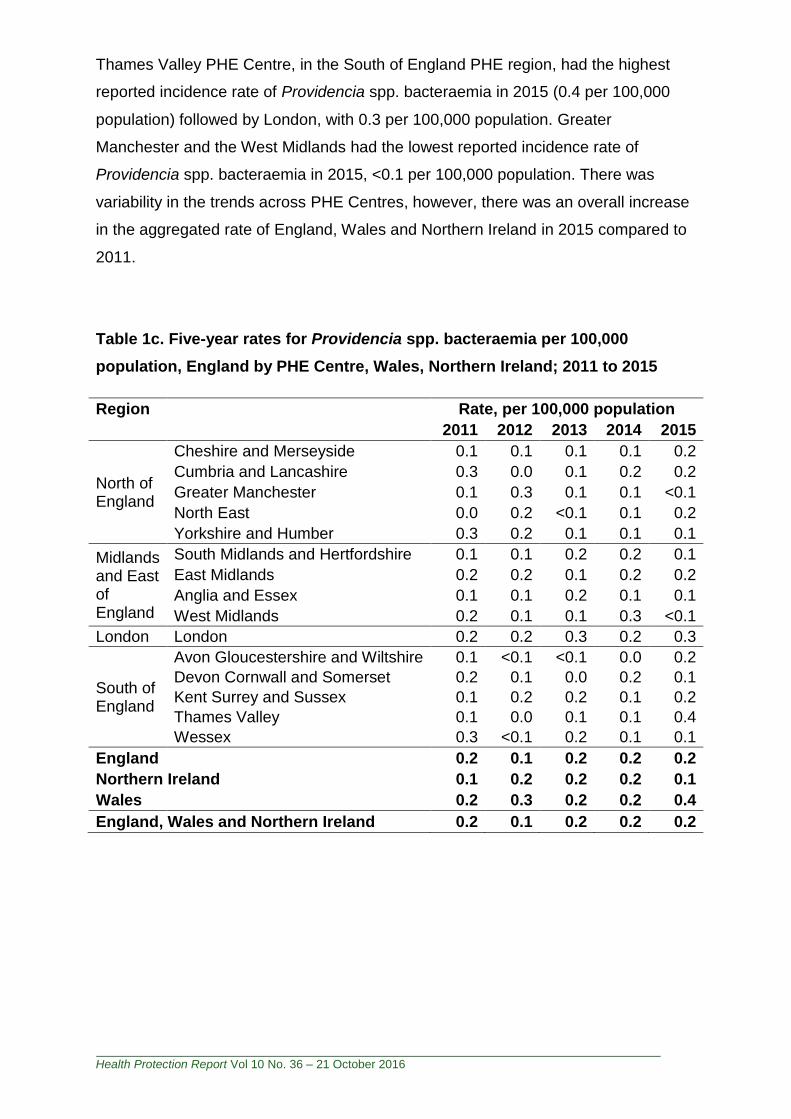
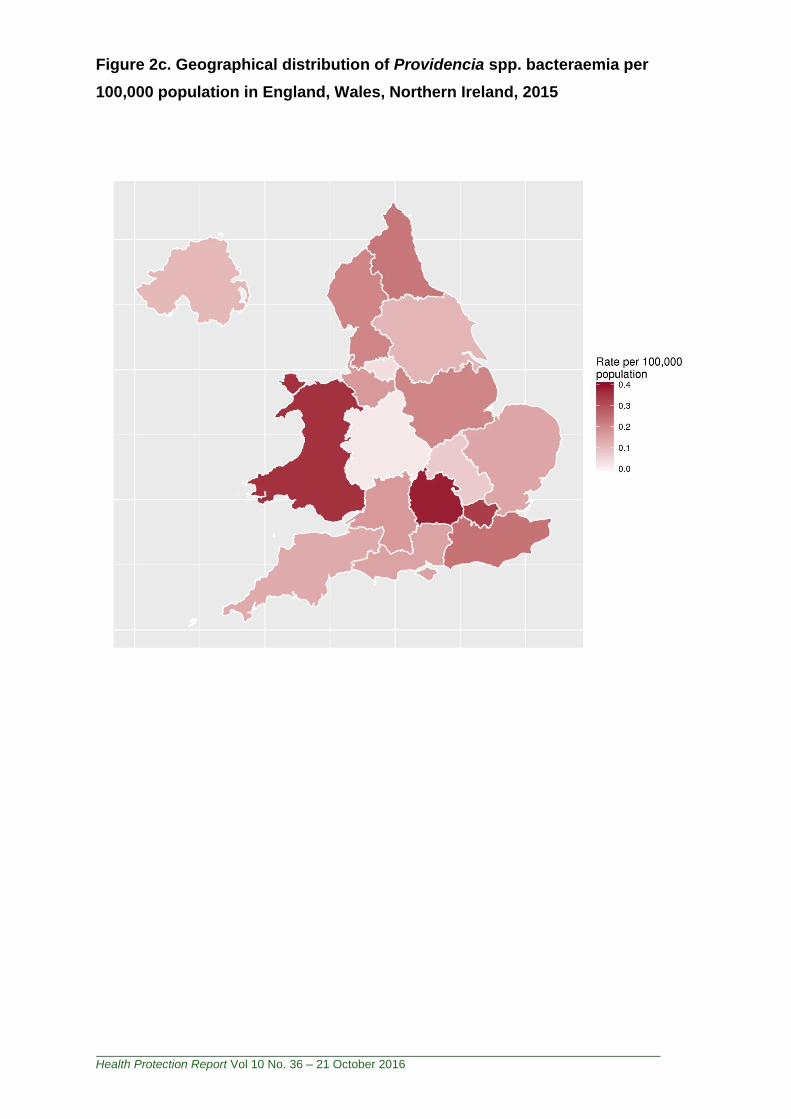
Thames Valley PHE Centre, in the South of England PHE region, had the highest
reported incidence rate of Providencia spp. bacteraemia in 2015 (0.4 per 100,000
population) followed by London, with 0.3 per 100,000 population. Greater
Manchester and the West Midlands had the lowest reported incidence rate of
Providencia spp. bacteraemia in 2015, <0.1 per 100,000 population. There was
variability in the trends across PHE Centres, however, there was an overall increase
in the aggregated rate of England, Wales and Northern Ireland in 2015 compared to
2011.
Table 1c. Five-year rates for Providencia spp. bacteraemia per 100,000
population, England by PHE Centre, Wales, Northern Ireland; 2011 to 2015
Region Rate, per 100,000 population
2011 2012 2013 2014 2015
North of England
Cheshire and Merseyside 0.1 0.1 0.1 0.1 0.2
Cumbria and Lancashire 0.3 0.0 0.1 0.2 0.2
Greater Manchester 0.1 0.3 0.1 0.1 <0.1
North East 0.0 0.2 <0.1 0.1 0.2
Yorkshire and Humber 0.3 0.2 0.1 0.1 0.1
Midlands and East of England
South Midlands and Hertfordshire 0.1 0.1 0.2 0.2 0.1
East Midlands 0.2 0.2 0.1 0.2 0.2
Anglia and Essex 0.1 0.1 0.2 0.1 0.1
West Midlands 0.2 0.1 0.1 0.3 <0.1
London London 0.2 0.2 0.3 0.2 0.3
South of England
Avon Gloucestershire and Wiltshire 0.1 <0.1 <0.1 0.0 0.2
Devon Cornwall and Somerset 0.2 0.1 0.0 0.2 0.1
Kent Surrey and Sussex 0.1 0.2 0.2 0.1 0.2
Thames Valley 0.1 0.0 0.1 0.1 0.4
Wessex 0.3 <0.1 0.2 0.1 0.1
England 0.2 0.1 0.2 0.2 0.2
Northern Ireland 0.1 0.2 0.2 0.2 0.1
Wales 0.2 0.3 0.2 0.2 0.4
England, Wales and Northern Ireland 0.2 0.1 0.2 0.2 0.2
Health Protection Report Vol 10 No. 36 – 21 October 2016
Figure 2c. Geographical distribution of Providencia spp. bacteraemia per
100,000 population in England, Wales, Northern Ireland, 2015
Health Protection Report Vol 10 No. 36 – 21 October 2016
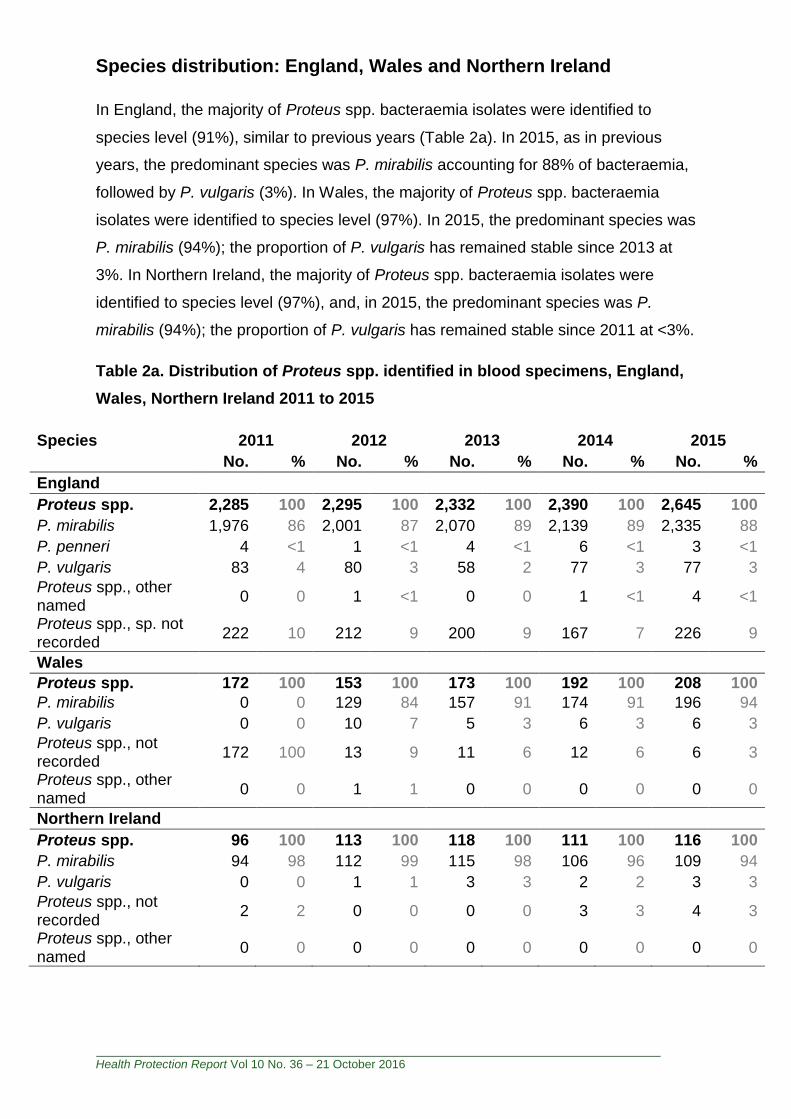
Species distribution: England, Wales and Northern Ireland
In England, the majority of Proteus spp. bacteraemia isolates were identified to
species level (91%), similar to previous years (Table 2a). In 2015, as in previous
years, the predominant species was P. mirabilis accounting for 88% of bacteraemia,
followed by P. vulgaris (3%). In Wales, the majority of Proteus spp. bacteraemia
isolates were identified to species level (97%). In 2015, the predominant species was
P. mirabilis (94%); the proportion of P. vulgaris has remained stable since 2013 at
3%. In Northern Ireland, the majority of Proteus spp. bacteraemia isolates were
identified to species level (97%), and, in 2015, the predominant species was P.
mirabilis (94%); the proportion of P. vulgaris has remained stable since 2011 at <3%.
Table 2a. Distribution of Proteus spp. identified in blood specimens, England,
Wales, Northern Ireland 2011 to 2015
Species 2011 2012 2013 2014 2015
No. % No. % No. % No. % No. %
England
Proteus spp. 2,285 100 2,295 100 2,332 100 2,390 100 2,645 100
P. mirabilis 1,976 86 2,001 87 2,070 89 2,139 89 2,335 88
P. penneri 4 <1 1 <1 4 <1 6 <1 3 <1
P. vulgaris 83 4 80 3 58 2 77 3 77 3
Proteus spp., other named
0 0 1 <1 0 0 1 <1 4 <1
Proteus spp., sp. not recorded
222 10 212 9 200 9 167 7 226 9
Wales
Proteus spp. 172 100 153 100 173 100 192 100 208 100
P. mirabilis 0 0 129 84 157 91 174 91 196 94
P. vulgaris 0 0 10 7 5 3 6 3 6 3
Proteus spp., not recorded
172 100 13 9 11 6 12 6 6 3
Proteus spp., other named
0 0 1 1 0 0 0 0 0 0
Northern Ireland
Proteus spp. 96 100 113 100 118 100 111 100 116 100
P. mirabilis 94 98 112 99 115 98 106 96 109 94
P. vulgaris 0 0 1 1 3 3 2 2 3 3
Proteus spp., not recorded
2 2 0 0 0 0 3 3 4 3
Proteus spp., other named
0 0 0 0 0 0 0 0 0 0
Health Protection Report Vol 10 No. 36 – 21 October 2016
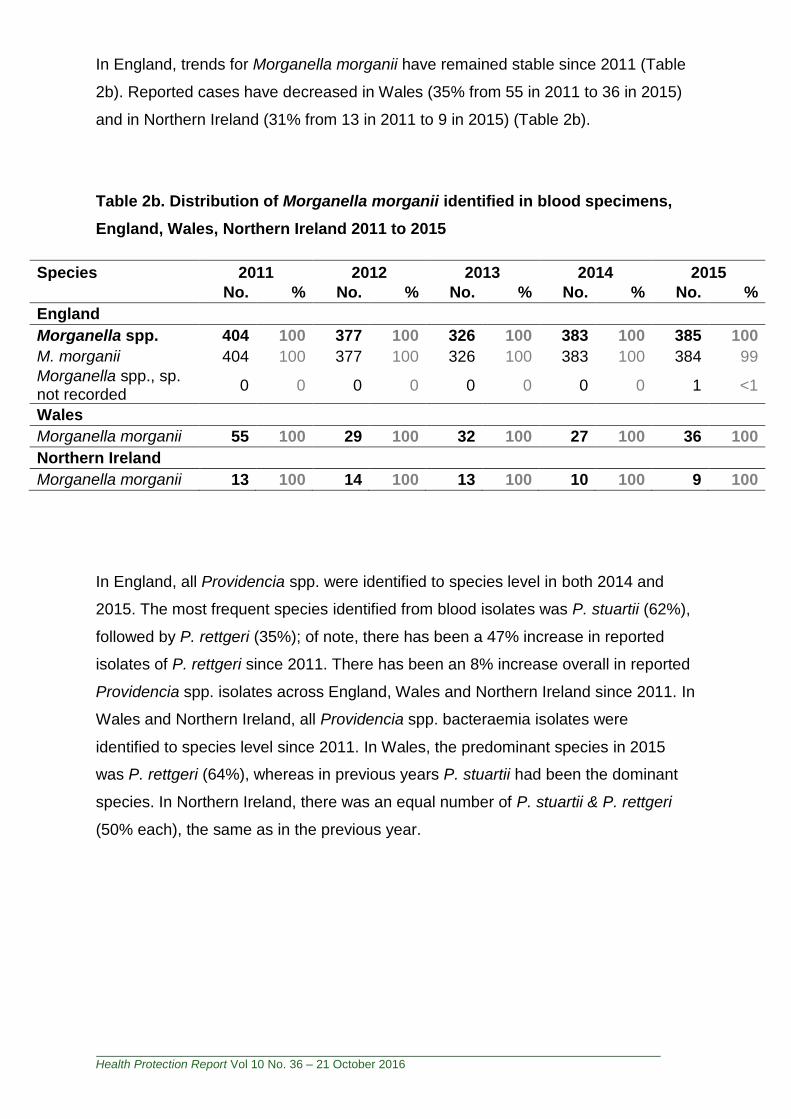
In England, trends for Morganella morganii have remained stable since 2011 (Table
2b). Reported cases have decreased in Wales (35% from 55 in 2011 to 36 in 2015)
and in Northern Ireland (31% from 13 in 2011 to 9 in 2015) (Table 2b).
Table 2b. Distribution of Morganella morganii identified in blood specimens,
England, Wales, Northern Ireland 2011 to 2015
Species 2011 2012 2013 2014 2015
No. % No. % No. % No. % No. %
England
Morganella spp. 404 100 377 100 326 100 383 100 385 100
M. morganii 404 100 377 100 326 100 383 100 384 99
Morganella spp., sp. not recorded
0 0 0 0 0 0 0 0 1 <1
Wales
Morganella morganii 55 100 29 100 32 100 27 100 36 100
Northern Ireland
Morganella morganii 13 100 14 100 13 100 10 100 9 100
In England, all Providencia spp. were identified to species level in both 2014 and
2015. The most frequent species identified from blood isolates was P. stuartii (62%),
followed by P. rettgeri (35%); of note, there has been a 47% increase in reported
isolates of P. rettgeri since 2011. There has been an 8% increase overall in reported
Providencia spp. isolates across England, Wales and Northern Ireland since 2011. In
Wales and Northern Ireland, all Providencia spp. bacteraemia isolates were
identified to species level since 2011. In Wales, the predominant species in 2015
was P. rettgeri (64%), whereas in previous years P. stuartii had been the dominant
species. In Northern Ireland, there was an equal number of P. stuartii & P. rettgeri
(50% each), the same as in the previous year.

Health Protection Report Vol 10 No. 36 – 21 October 2016
Table2c. Distribution of Providencia spp. identified in blood specimens,
England, Wales, Northern Ireland 2011 to 2015
Species 2011 2012 2013 2014 2015
No. % No. % No. % No. % No. %
England
Providencia spp. 94 100 74 100 81 100 88 100 97 100
P. alcalifaciens 10 11 6 8 4 5 0 0 3 3
P. rettgeri 23 24 31 42 29 36 41 47 34 35
P. stuartii 54 57 34 46 45 56 38 43 60 62
Providencia spp., other named
0 0 2 3 3 4 5 6 0 0
Providencia spp., sp. not recorded
7 7 1 1 0 0 4 5 0 0
Wales
Providencia spp. 6 100 8 100 6 100 7 100 11 100
P. rettgeri 3 50 3 38 1 17 2 29 7 64
P. stuartii 3 50 2 25 5 83 3 43 3 27
Providencia spp., other named
0 0 2 25 0 0 1 14 1 9
Providencia spp., sp. not recoded
0 0 1 13 0 0 1 14 0 0
Northern Ireland
Providencia spp. 2 100 3 100 3 100 4 100 2 100
P. rettgeri 1 50 0 0 1 33 2 50 1 50
P. stuartii 1 50 3 100 2 67 2 50 1 50
Providencia spp., other named
0 0 0 0 0 0 0 0 0 0
Providencia spp., sp. not recoded
0 0 0 0 0 0 0 0 0 0
Health Protection Report Vol 10 No. 36 – 21 October 2016
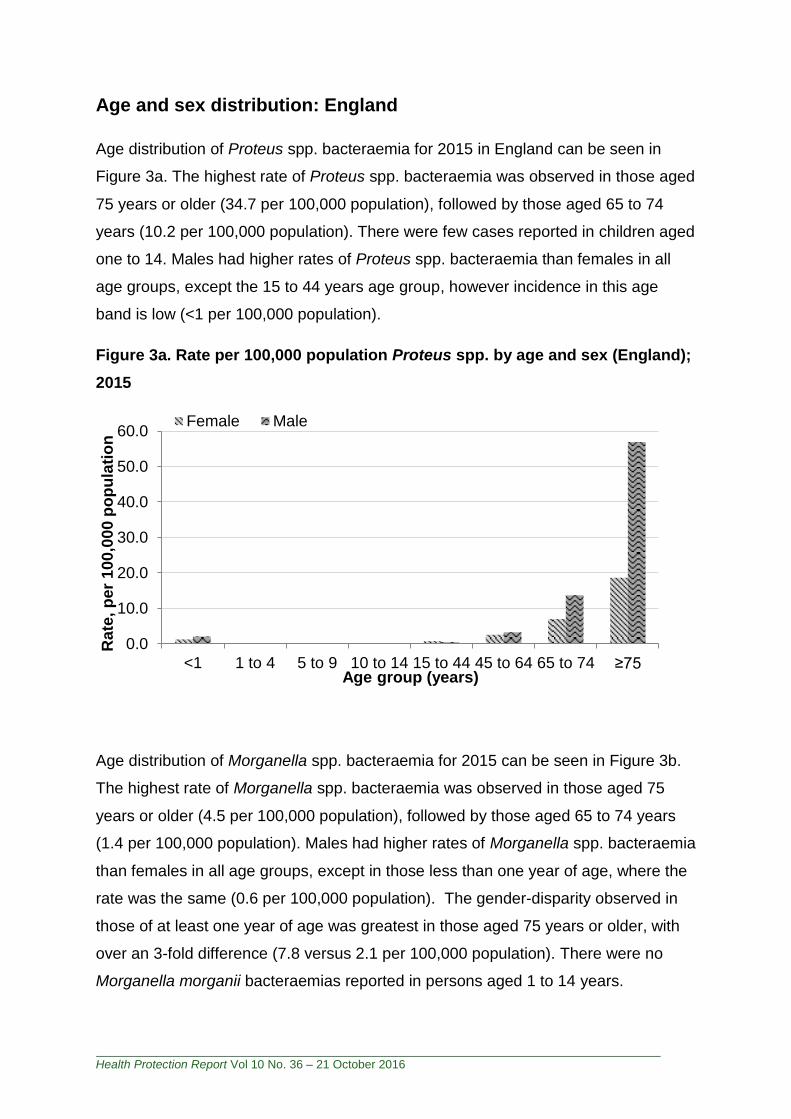
Age and sex distribution: England
Age distribution of Proteus spp. bacteraemia for 2015 in England can be seen in
Figure 3a. The highest rate of Proteus spp. bacteraemia was observed in those aged
75 years or older (34.7 per 100,000 population), followed by those aged 65 to 74
years (10.2 per 100,000 population). There were few cases reported in children aged
one to 14. Males had higher rates of Proteus spp. bacteraemia than females in all
age groups, except the 15 to 44 years age group, however incidence in this age
band is low (<1 per 100,000 population).
Figure 3a. Rate per 100,000 population Proteus spp. by age and sex (England);
2015
Age distribution of Morganella spp. bacteraemia for 2015 can be seen in Figure 3b.
The highest rate of Morganella spp. bacteraemia was observed in those aged 75
years or older (4.5 per 100,000 population), followed by those aged 65 to 74 years
(1.4 per 100,000 population). Males had higher rates of Morganella spp. bacteraemia
than females in all age groups, except in those less than one year of age, where the
rate was the same (0.6 per 100,000 population). The gender-disparity observed in
those of at least one year of age was greatest in those aged 75 years or older, with
over an 3-fold difference (7.8 versus 2.1 per 100,000 population). There were no
Morganella morganii bacteraemias reported in persons aged 1 to 14 years.
0.0
10.0
20.0
30.0
40.0
50.0
60.0
<1 1 to 4 5 to 9 10 to 14 15 to 44 45 to 64 65 to 74 ≥75
Rate
, p
er
10
0,0
00
po
pu
lati
on
Age group (years)
Female Male
Health Protection Report Vol 10 No. 36 – 21 October 2016
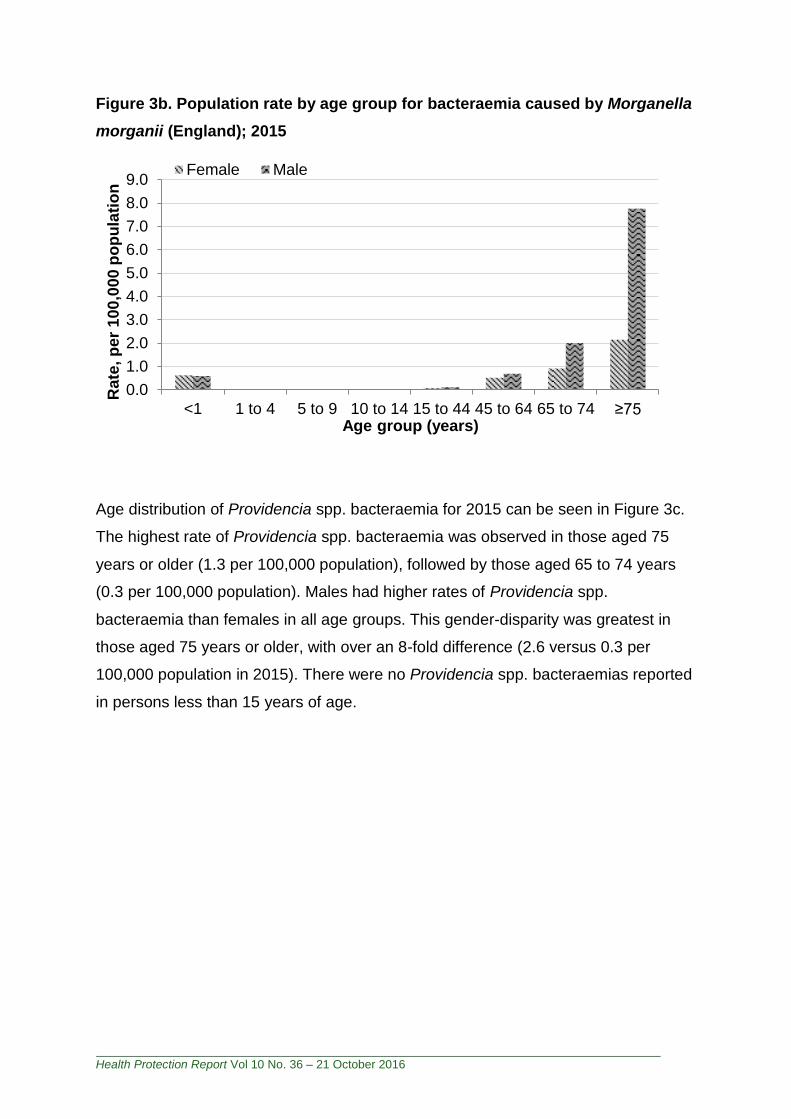
Figure 3b. Population rate by age group for bacteraemia caused by Morganella
morganii (England); 2015
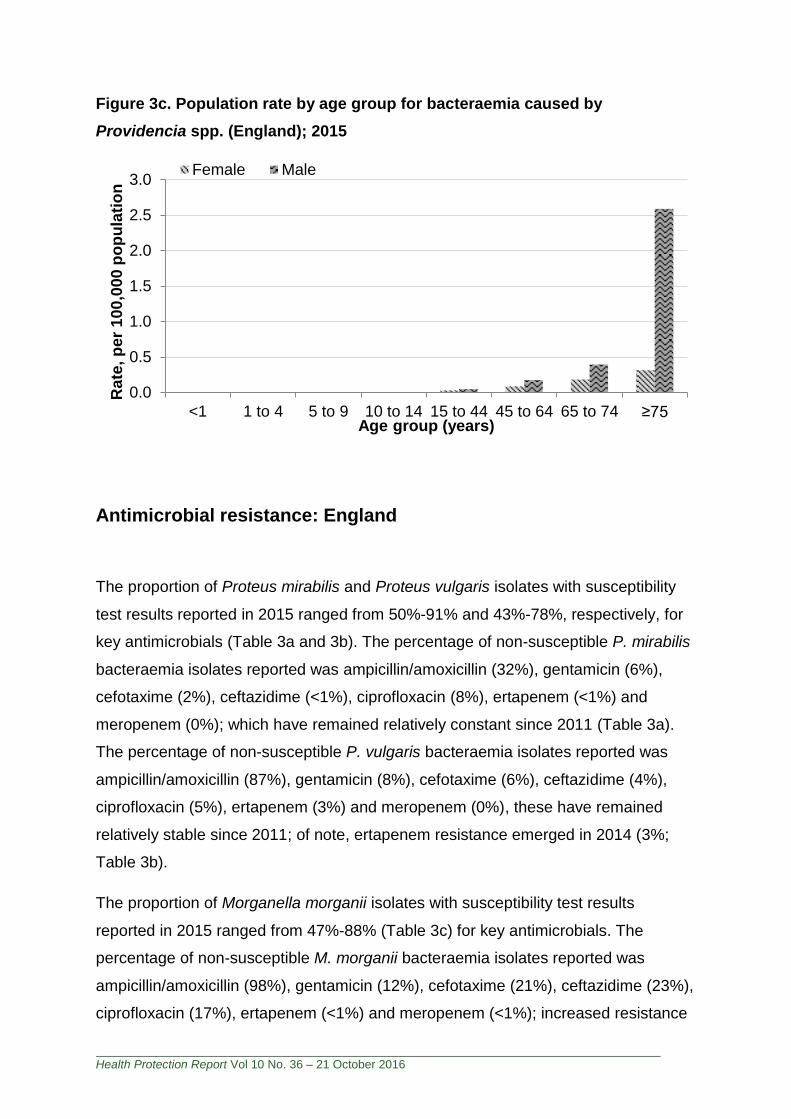
Age distribution of Providencia spp. bacteraemia for 2015 can be seen in Figure 3c.
The highest rate of Providencia spp. bacteraemia was observed in those aged 75
years or older (1.3 per 100,000 population), followed by those aged 65 to 74 years
(0.3 per 100,000 population). Males had higher rates of Providencia spp.
bacteraemia than females in all age groups. This gender-disparity was greatest in
those aged 75 years or older, with over an 8-fold difference (2.6 versus 0.3 per
100,000 population in 2015). There were no Providencia spp. bacteraemias reported
in persons less than 15 years of age.
0.0
1.0
2.0
3.0
4.0
5.0
6.0
7.0
8.0
9.0
<1 1 to 4 5 to 9 10 to 14 15 to 44 45 to 64 65 to 74 ≥75
Rate
, p
er
10
0,0
00
po
pu
lati
on
Age group (years)
Female Male
Health Protection Report Vol 10 No. 36 – 21 October 2016
Figure 3c. Population rate by age group for bacteraemia caused by
Providencia spp. (England); 2015
Antimicrobial resistance: England
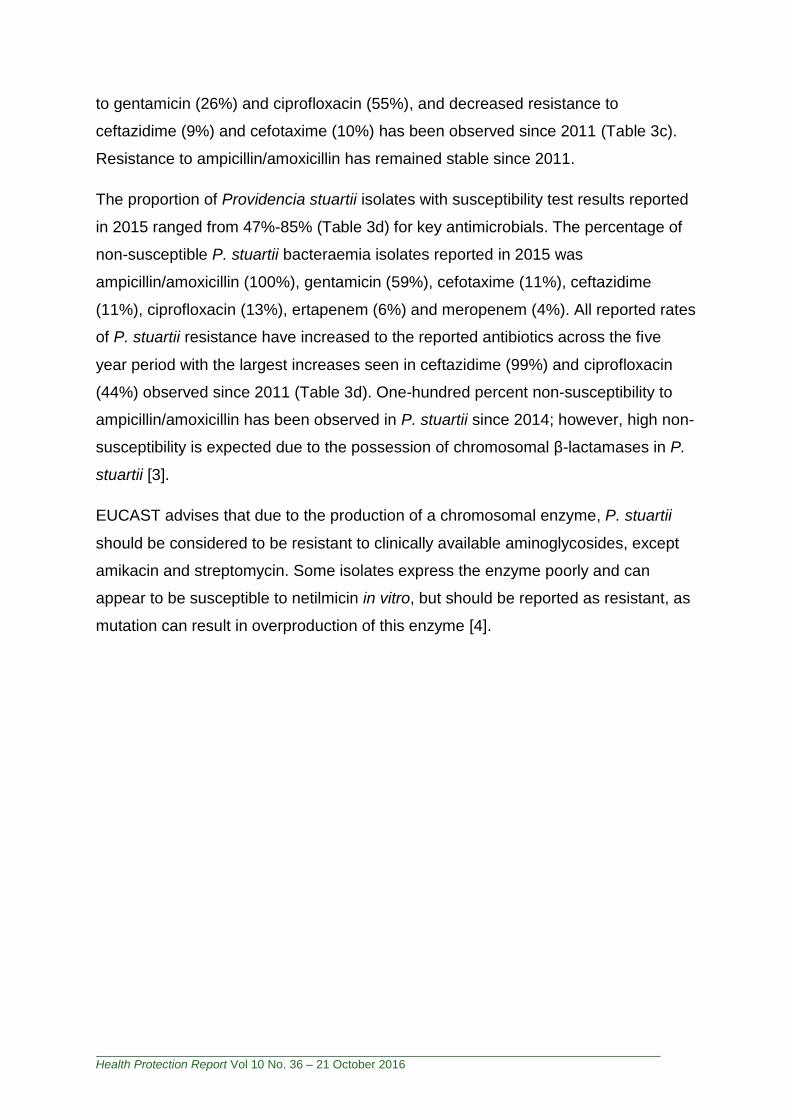
The proportion of Proteus mirabilis and Proteus vulgaris isolates with susceptibility
test results reported in 2015 ranged from 50%-91% and 43%-78%, respectively, for
key antimicrobials (Table 3a and 3b). The percentage of non-susceptible P. mirabilis
bacteraemia isolates reported was ampicillin/amoxicillin (32%), gentamicin (6%),
cefotaxime (2%), ceftazidime (<1%), ciprofloxacin (8%), ertapenem (<1%) and
meropenem (0%); which have remained relatively constant since 2011 (Table 3a).
The percentage of non-susceptible P. vulgaris bacteraemia isolates reported was
ampicillin/amoxicillin (87%), gentamicin (8%), cefotaxime (6%), ceftazidime (4%),
ciprofloxacin (5%), ertapenem (3%) and meropenem (0%), these have remained
relatively stable since 2011; of note, ertapenem resistance emerged in 2014 (3%;
Table 3b).
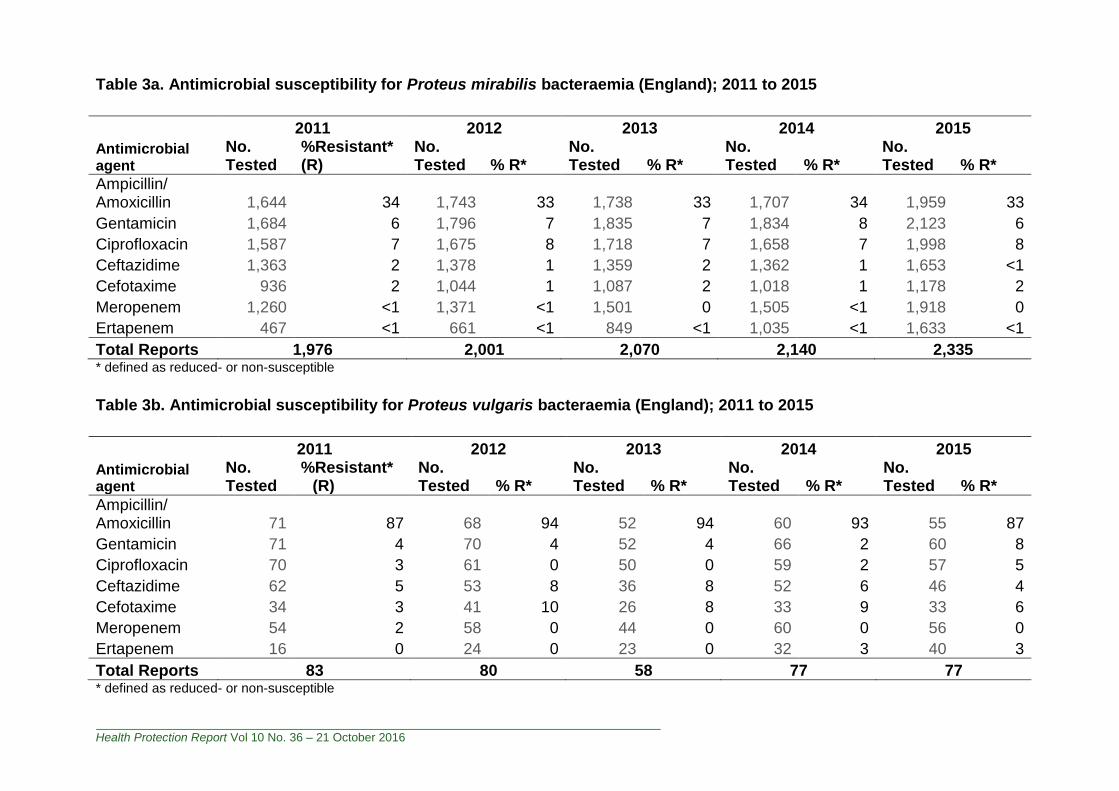
The proportion of Morganella morganii isolates with susceptibility test results
reported in 2015 ranged from 47%-88% (Table 3c) for key antimicrobials. The
percentage of non-susceptible M. morganii bacteraemia isolates reported was
ampicillin/amoxicillin (98%), gentamicin (12%), cefotaxime (21%), ceftazidime (23%),
ciprofloxacin (17%), ertapenem (<1%) and meropenem (<1%); increased resistance
0.0
0.5
1.0
1.5
2.0
2.5
3.0
<1 1 to 4 5 to 9 10 to 14 15 to 44 45 to 64 65 to 74 ≥75
Rate
, p
er
10
0,0
00
po
pu
lati
on
Age group (years)
Female Male
Health Protection Report Vol 10 No. 36 – 21 October 2016
to gentamicin (26%) and ciprofloxacin (55%), and decreased resistance to
ceftazidime (9%) and cefotaxime (10%) has been observed since 2011 (Table 3c).
Resistance to ampicillin/amoxicillin has remained stable since 2011.
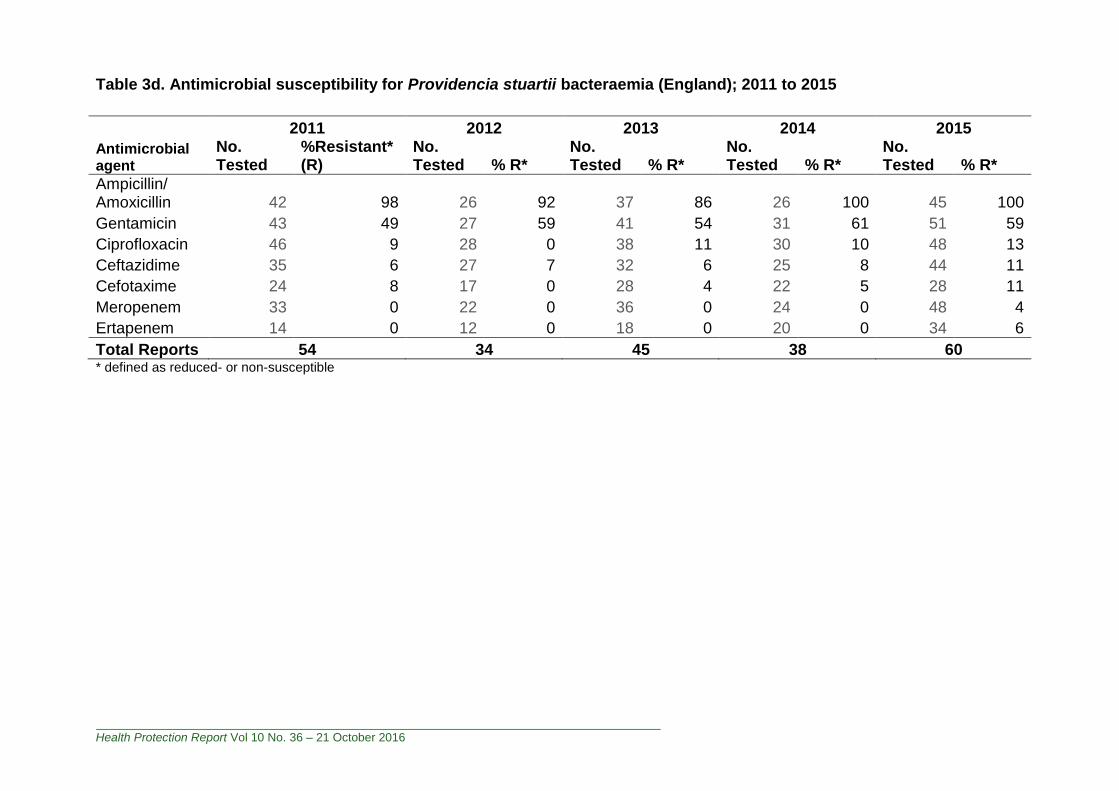
The proportion of Providencia stuartii isolates with susceptibility test results reported
in 2015 ranged from 47%-85% (Table 3d) for key antimicrobials. The percentage of
non-susceptible P. stuartii bacteraemia isolates reported in 2015 was
ampicillin/amoxicillin (100%), gentamicin (59%), cefotaxime (11%), ceftazidime
(11%), ciprofloxacin (13%), ertapenem (6%) and meropenem (4%). All reported rates
of P. stuartii resistance have increased to the reported antibiotics across the five
year period with the largest increases seen in ceftazidime (99%) and ciprofloxacin
(44%) observed since 2011 (Table 3d). One-hundred percent non-susceptibility to
ampicillin/amoxicillin has been observed in P. stuartii since 2014; however, high non-
susceptibility is expected due to the possession of chromosomal β-lactamases in P.
stuartii [3].
EUCAST advises that due to the production of a chromosomal enzyme, P. stuartii
should be considered to be resistant to clinically available aminoglycosides, except
amikacin and streptomycin. Some isolates express the enzyme poorly and can
appear to be susceptible to netilmicin in vitro, but should be reported as resistant, as
mutation can result in overproduction of this enzyme [4].
Health Protection Report Vol 10 No. 36 – 21 October 2016
Table 3a. Antimicrobial susceptibility for Proteus mirabilis bacteraemia (England); 2011 to 2015
2011 2012 2013 2014 2015
Antimicrobial agent
No. Tested
%Resistant* (R)
No. Tested % R*
No. Tested % R*
No. Tested % R*
No. Tested % R*
Ampicillin/ Amoxicillin 1,644 34 1,743 33 1,738 33 1,707 34 1,959 33
Gentamicin 1,684 6 1,796 7 1,835 7 1,834 8 2,123 6
Ciprofloxacin 1,587 7 1,675 8 1,718 7 1,658 7 1,998 8
Ceftazidime 1,363 2 1,378 1 1,359 2 1,362 1 1,653 <1
Cefotaxime 936 2 1,044 1 1,087 2 1,018 1 1,178 2
Meropenem 1,260 <1 1,371 <1 1,501 0 1,505 <1 1,918 0
Ertapenem 467 <1 661 <1 849 <1 1,035 <1 1,633 <1
Total Reports 1,976 2,001 2,070 2,140 2,335 * defined as reduced- or non-susceptible
Table 3b. Antimicrobial susceptibility for Proteus vulgaris bacteraemia (England); 2011 to 2015
2011 2012 2013 2014 2015
Antimicrobial agent
No. Tested
%Resistant* (R)
No. Tested % R*
No. Tested % R*
No. Tested % R*
No. Tested % R*
Ampicillin/ Amoxicillin 71 87 68 94 52 94 60 93 55 87
Gentamicin 71 4 70 4 52 4 66 2 60 8
Ciprofloxacin 70 3 61 0 50 0 59 2 57 5
Ceftazidime 62 5 53 8 36 8 52 6 46 4
Cefotaxime 34 3 41 10 26 8 33 9 33 6
Meropenem 54 2 58 0 44 0 60 0 56 0
Ertapenem 16 0 24 0 23 0 32 3 40 3
Total Reports 83 80 58 77 77 * defined as reduced- or non-susceptible
Health Protection Report Vol 10 No. 36 – 21 October 2016
Table 3c. Antimicrobial susceptibility for Morganella morganii bacteraemia (England); 2011 to 2015
2011 2012 2013 2014 2015
Antimicrobial agent
No. Tested
%Resistant* (R)
No. Tested % R*
No. Tested % R*
No. Tested % R*
No. Tested % R*
Ampicillin/ Amoxicillin 328 96 315 98 265 96 296 98 315 98
Gentamicin 352 10 336 8 288 9 333 8 338 12
Ciprofloxacin 328 11 310 11 267 9 309 11 315 17
Ceftazidime 263 25 256 21 225 18 238 19 268 23
Cefotaxime 201 24 204 18 162 19 175 15 182 21
Meropenem 276 0 251 0 239 <1 280 0 308 <1
Ertapenem 97 0 120 0 135 <1 178 0 253 <1
Total Reports 404 377 326 382 384 * defined as reduced- or non-susceptible
Health Protection Report Vol 10 No. 36 – 21 October 2016
Table 3d. Antimicrobial susceptibility for Providencia stuartii bacteraemia (England); 2011 to 2015
2011 2012 2013 2014 2015
Antimicrobial agent
No. Tested
%Resistant* (R)
No. Tested % R*
No. Tested % R*
No. Tested % R*
No. Tested % R*
Ampicillin/ Amoxicillin 42 98 26 92 37 86 26 100 45 100
Gentamicin 43 49 27 59 41 54 31 61 51 59
Ciprofloxacin 46 9 28 0 38 11 30 10 48 13
Ceftazidime 35 6 27 7 32 6 25 8 44 11
Cefotaxime 24 8 17 0 28 4 22 5 28 11
Meropenem 33 0 22 0 36 0 24 0 48 4
Ertapenem 14 0 12 0 18 0 20 0 34 6
Total Reports 54 34 45 38 60 * defined as reduced- or non-susceptible
Health Protection Report Vol 10 No. 36 – 21 October 2016
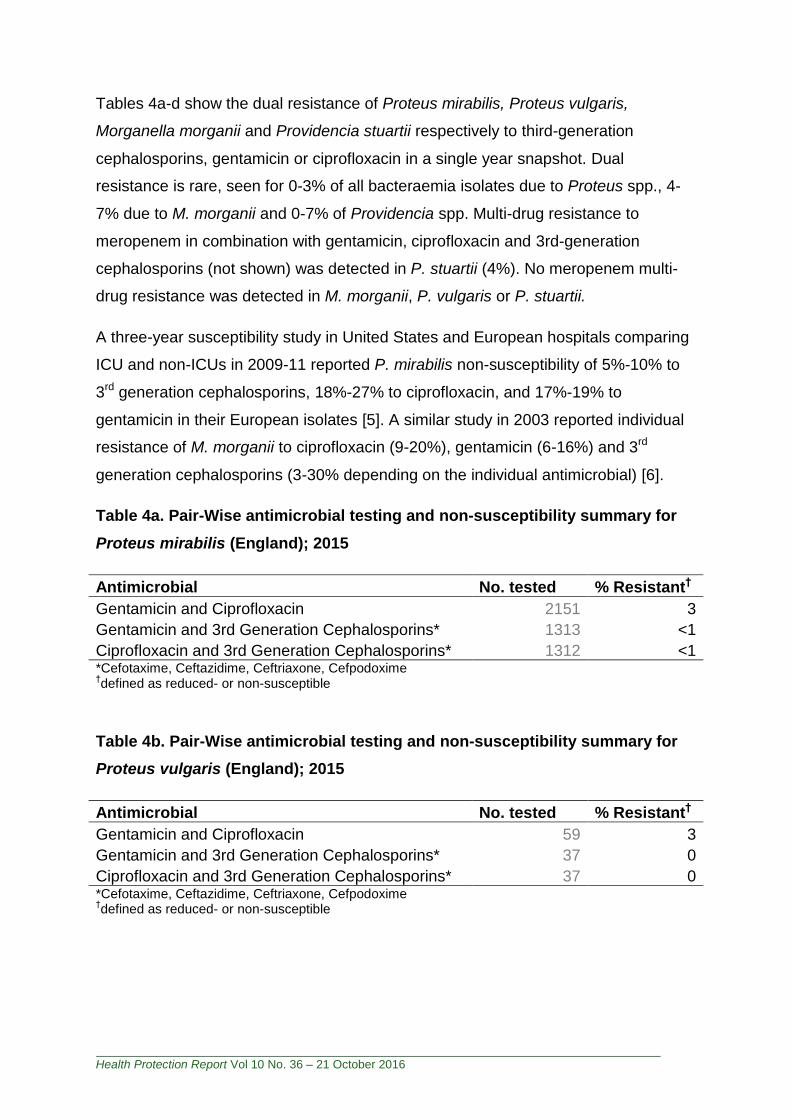
Tables 4a-d show the dual resistance of Proteus mirabilis, Proteus vulgaris,
Morganella morganii and Providencia stuartii respectively to third-generation
cephalosporins, gentamicin or ciprofloxacin in a single year snapshot. Dual
resistance is rare, seen for 0-3% of all bacteraemia isolates due to Proteus spp., 4-
7% due to M. morganii and 0-7% of Providencia spp. Multi-drug resistance to
meropenem in combination with gentamicin, ciprofloxacin and 3rd-generation
cephalosporins (not shown) was detected in P. stuartii (4%). No meropenem multi-
drug resistance was detected in M. morganii, P. vulgaris or P. stuartii.
A three-year susceptibility study in United States and European hospitals comparing
ICU and non-ICUs in 2009-11 reported P. mirabilis non-susceptibility of 5%-10% to
3rd generation cephalosporins, 18%-27% to ciprofloxacin, and 17%-19% to
gentamicin in their European isolates [5]. A similar study in 2003 reported individual
resistance of M. morganii to ciprofloxacin (9-20%), gentamicin (6-16%) and 3rd
generation cephalosporins (3-30% depending on the individual antimicrobial) [6].
Table 4a. Pair-Wise antimicrobial testing and non-susceptibility summary for
Proteus mirabilis (England); 2015
Antimicrobial No. tested % Resistant†
Gentamicin and Ciprofloxacin 2151 3
Gentamicin and 3rd Generation Cephalosporins* 1313 <1
Ciprofloxacin and 3rd Generation Cephalosporins* 1312 <1 *Cefotaxime, Ceftazidime, Ceftriaxone, Cefpodoxime †defined as reduced- or non-susceptible
Table 4b. Pair-Wise antimicrobial testing and non-susceptibility summary for
Proteus vulgaris (England); 2015
Antimicrobial No. tested % Resistant†
Gentamicin and Ciprofloxacin 59 3
Gentamicin and 3rd Generation Cephalosporins* 37 0
Ciprofloxacin and 3rd Generation Cephalosporins* 37 0 *Cefotaxime, Ceftazidime, Ceftriaxone, Cefpodoxime †defined as reduced- or non-susceptible
Health Protection Report Vol 10 No. 36 – 21 October 2016
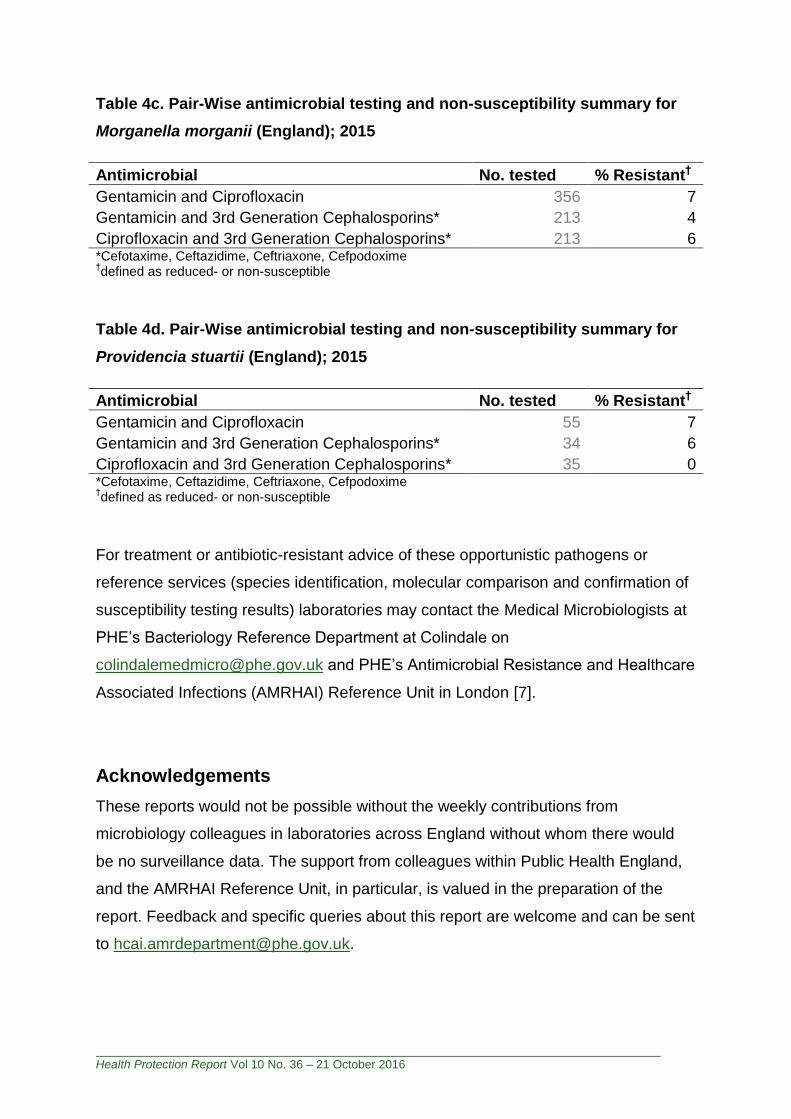
Table 4c. Pair-Wise antimicrobial testing and non-susceptibility summary for
Morganella morganii (England); 2015
Antimicrobial No. tested % Resistant†
Gentamicin and Ciprofloxacin 356 7
Gentamicin and 3rd Generation Cephalosporins* 213 4
Ciprofloxacin and 3rd Generation Cephalosporins* 213 6 *Cefotaxime, Ceftazidime, Ceftriaxone, Cefpodoxime †defined as reduced- or non-susceptible
Table 4d. Pair-Wise antimicrobial testing and non-susceptibility summary for
Providencia stuartii (England); 2015
Antimicrobial No. tested % Resistant†
Gentamicin and Ciprofloxacin 55 7
Gentamicin and 3rd Generation Cephalosporins* 34 6
Ciprofloxacin and 3rd Generation Cephalosporins* 35 0 *Cefotaxime, Ceftazidime, Ceftriaxone, Cefpodoxime †defined as reduced- or non-susceptible
For treatment or antibiotic-resistant advice of these opportunistic pathogens or
reference services (species identification, molecular comparison and confirmation of
susceptibility testing results) laboratories may contact the Medical Microbiologists at
PHE’s Bacteriology Reference Department at Colindale on
[email protected] and PHE’s Antimicrobial Resistance and Healthcare
Associated Infections (AMRHAI) Reference Unit in London [7].
Acknowledgements
These reports would not be possible without the weekly contributions from
microbiology colleagues in laboratories across England without whom there would
be no surveillance data. The support from colleagues within Public Health England,
and the AMRHAI Reference Unit, in particular, is valued in the preparation of the
report. Feedback and specific queries about this report are welcome and can be sent
Health Protection Report Vol 10 No. 36 – 21 October 2016
References
1. Office for National Statistics. Population Estimates for UK, England and Wales, Scotland and Northern Ireland: mid-2015 2015 [cited 2016], http://www.ons.gov.uk/peoplepopulationandcommunity/populationandmigration/populationestimates/bulletins/annualmidyearpopulationestimates/mid2015.
2. Public Health England (2015). Polymicrobial bacteraemia and fungaemia in England, Wales and Northern Ireland, 2014. Health Protection Report 9(21), https://www.gov.uk/government/uploads/system/uploads/attachment_data/file/436558/hpr2115_plmcrbls.pdf.
3. Stock I, Wiedemann B (1998). Natural antibiotic susceptibility of Providencia stuartii, P. rettgeri, P. alcalifaciens and P. rustigianii strains. Journal of Medical Microbiology. 47: 629-42.
4. Leclercq R, Canton R, Brown DFJ, Giske CG, Heisig P, MacGowan A, et al (2011). EUCAST expert rules in antimicrobial susceptibility testing. Clinical Microbiology and Infection. 19(2):141-60.
5. Sader HS, Farrell DJ, Flamm RK, Jones RN (2014). Antimicrobial susceptibility of Gram-negative organisms isolated from patients hospitalized in intensive care units in United States and European hospitals (2009–2011). Diagnostic Microbiology and Infectious Disease 78(4): 443-8.
6. Wenzel RP, Sahm DF, Thornsberry C, Draghi DC, Jones ME, Karlowsky JA (2003). In Vitro Susceptibilities of Gram-Negative Bacteria Isolated from Hospitalized Patients in Four European Countries, Canada, and the United States in 2000-2001 to Expanded-Spectrum Cephalosporins and Comparator Antimicrobials: Implications for Therapy. Antimicrob Agents Chemother. 47(10): 3089-98.
7. Public Health England. Antimicrobial Resistance and Healthcare Associated Infections (AMRHAI) Reference Unit, https://www.gov.uk/amrhai-reference-unit-reference-and-diagnostic-services.