lagos state government - sparc nigeria · hrmis human resource management information system ......
TRANSCRIPT
LAGOS STATE GOVERNMENT
Baseline Report of Workforce Planning in Central MDAs, Lagos State, Nigeria
July 2010

Acknowledgement This Report was made possible with Technical Assistance from United Kingdom Department For International Development (DFID) State Partnership for Accountability Responsiveness and Capability (SPARC) Programme.

Content List
Abbreviations and Acronyms
Executive Summary
1.0 Introduction ..................................................................................................................... 1
2.0 Methodology .................................................................................................................... 4
2.1 Process ........................................................................................................................ 4
2.1.1 Instrument and Data gathering .............................................................................. 4
2.1.2 Scope ................................................................................................................... 4
2.1.3 Limitations ............................................................................................................ 4
3.0 Findings and Discussions ................................................................................................ 5
3.1 Description of “As is” Workforce Planning Practice in Lagos State Public Service ....... 5
3.1.1 Current Recruitment Practices .............................................................................. 5
3.1.2 Retention and Reward .......................................................................................... 5
3.1.3 Knowledge Transfer .............................................................................................. 6
3.1.4 Staff Development ................................................................................................ 6
3.1.5 Job Classification .................................................................................................. 6
3.1.6 Baseline Data – demographic, and workforce profile ............................................ 7
3.1.7 Summary of Demographic Data ...........................................................................11
4.0 Overlaps, duplication and gaps in workforce planning and decision making ...................12
5.0 Design and Models for Workforce Planning in LSG ........................................................13
5.1 Workforce Planning – Concepts and good practice .....................................................13
6.0 Conclusions ....................................................................................................................15
7.0 Recommendations .........................................................................................................17
7.1 Quick Wins (Within 6 months) ........................................................................................17
7.1.1 Medium Term (Within 2 years) .............................................................................17
7.1.2 Long Term (Within 5 years) ..................................................................................18
Appendix 1 MDAs Covered and List of Person ...................................................................19
Interviewed ...............................................................................................................................19
Appendix 2 Tools used to Assess some Workforce Planning Practices ..............................21
Appendix 3 Discussion Guide with Head of Service and other top Ministry of METP Officials 23
Appendix 4 Tools for Workforce Profile Demographics .......................................................25
Appendix 5 Details of Workforce Demographic Data ...........................................................27

Appendix 6 Design and Models for Workforce Planning in LSG ..........................................31

Abbreviations and Acronyms CIPD
CSC
Chartered Institute of Personnel and Development
Civil Service Commission
E Expatriates
ED Executive Director
ED II Education District II
EXCO Executive Council
F&A Finance & Admin
GL Grade Level
HODs Heads of Department
HRMIS Human Resource Management Information System
I Indigenes
IATG Internal Audit Tutor General
PS Permanent Secretaries
LGSC Local Government Service Commission
TEPO
LSG
NI
MD
MDA
MEPB
METP
MOLGCA
MSRD
MTSS
NCE
Nos
Teaching Establishment & Pensions Office
Lagos State Government
Non Indigenes
Managing Director
Ministry Departmental Agency
Ministry of Economic Planning & Budget
Ministry of Establishment, Training & Pensions
Ministry of Local Government & Chieftaincy Affairs
Management Services & Reforms Directorate
(Office of Transformation in the Governor‟s office)
Medium Term Sector Strategy
National Council on Establishment
Numbers

NYSC
OHOS
PRO
PSM
PSO
PSSDC
SA
SMF
SPARC
TOR
TPA
National Youth Service Corps
Office of Head of Service
Public Relation Officer
Public Service Management
Public Service Office (in OHoS)
Public Service Staff Development Centre
Special Adviser
Strategic Management Framework
State Partnership for Accountability, Responsiveness & Capability
Terms of Reference
(Governor‟s) Ten Point Agenda

Executive Summary Lagos State is focused on becoming one of the top mega cities in the world. The State is presently collaborating with various development partners (such as the UK Department for International Development (DFID) States Partnership for Accountability, Responsiveness and Capability (SPARC) programme, the World Bank etc.) in implementing programmes aimed at alleviating poverty, developing infrastructure and growing the economy. By 2015 Lagos State should be a totally urbanized State serving as the nerve centre of national economy and home to about 10% of the total Nigeria (160 million) national population. Part of the strategy to support Lagos State to achieve its vision for desired socioeconomic growth and sustainable transformation is the development of a sound workforce planning mechanism that will ensure effective and efficient utilisation of the State government work force. However, information gathered from the recently concluded mapping of LSG MDA ministerial mandates and responsibilities indicates that workforce planning in the State public service is not based on assigned ministerial mandates, strategic goals of government or projected public service staff planning needs. Instead, it is the annual budget that drives the staff plan. Staff grades and numbers are governed by Schemes of Service that are agreed nationally and have not been reviewed to reflect the current job requirements in the State in the light of its highly welcomed transformation projects. Responsibility for personnel issues is split between central agencies in the Service. The link between staff numbers and grades to work functions and volumes is weak, and deployments are not always based on needs. . All these suggest a risky State of workforce planning practice in the State. Given the above, vis-à-vis SPARC‟s overall goal in the PSM work-stream (to assist Lagos State Government to fulfil its desired overall outcome for the Public Service by building a Public Service that is well-structured, organised and whose staff have the right attitude, skills and motivation to deliver the vision for Lagos State), this study was commissioned to generate baseline data on current demographics and workforce planning practices as well as provide information on overlaps, duplication and gaps in workforce planning and decision making amongst the „central‟ MDAs (Lagos State Judicial Commission, Health Service Commission (HSC), Civil Service Commission (CSC), Local Government Service Commission( LGSC), Teachers Establishment and Pension Office (TEPO), Public Service Office (PSO in OHOS) Ministry of Establishment, Training and Pensions (METP) and Education District II. It was also expected that based on findings, the study will develop a model for workforce profiling methodology or design that will enhance MSRD and MDA staff capability in strategic workforce planning to such an extent that effective workforce planning will become and remain an integral part and parcel of HR management practice in Lagos State Public Service.
Findings from the study show that there are no formalised workforce planning processes in place in the service. Despite the lack of any well articulated retention strategies, state employees tend to stay in the service because of personal decisions and hope of ascending to the legacy grade levels in the future; recruitment is not based on any formal age, gender or diversity analysis of the workforce. There is little or no regular modification to the recruitment process that could enable it to create a better pool of applicants that could increase the quality of entry level hiring of employees into the Service. Although results show that there are opportunities for junior officers to understudy senior officers prior to their retirement, succession

planning, coaching and mentoring practices are not formalised or developed into a programme that could contribute significantly to meaningful workforce planning in the Service. Workload analyses for job groups as well as job analysis for the purpose of assess changes in skills need, education or training are scarcely done in the Service: for instance, no official assessment has been conducted in the State Civil Service to determine the impact of changes in technology and its impact on jobs in the Service. Demographic data are found to be available and well documented, but these appear not to be used for any systematic workforce planning (except at the HSC where there seems to be some elements of this crucial practice). The workforce profile in the central MDAs points to a relatively stable Service with quite a low turnover rate (2%) suggesting a stagnant Service. This may be an unhealthy sign particularly in the current circumstances when the State is pursuing an aggressive and multifaceted public transformation agenda.
The demographic profile of sampled MDAs warns of some dangers in the near future where about 50% of the current workforce might be due to retire from the Service at or around the same time. There is a 7% shortfall between numbers at entry level age 18-29+ years and the exit level age of 50+ years and 65% of the staff in the MDA sample were found to be in the age bracket 40+ years.
Immediate steps should be taken to compile authoritative baseline data on the workforce for all MDAs in the State to have a broader picture of the demographic profile of its workforce. In addition, action is needed to reconstruct all current personnel management organs of government to assume proper HR functions and equip them for effective operations; to train HR and top level staff on workforce methodology, and to review the capability of the current workforce to ensure it has the right mix and quality to deliver its strategic objectives. Lagos State should consider taking calculated steps towards the development of a five year strategic workforce plan that addresses present and future human capital challenges in its Service. This plan should enable government to identify the key actions needed to ensure that it has the right type of workforce in the right place at the right time and for the right purpose such as will guarantee the current and future strategic goals of the State. It should additionally enable State government and Human Resource managers to anticipate and plan for the future workforce that will be needed to drive and maintain the modernised and fundamentally transformed Lagos State as envisaged in the Megacity Project, Ten Point Agenda and Strategic Management Framework (SMF) for the development of the State. In order to take workforce planning to the best practice level for LSG, three models have been designed and evaluated. The third model is recommended for implementation by the Government in the immediate to near term. The recommended model attempts to eliminate guesswork with respect to defining workforce supply and demands. The report recommends actions that Lagos State Government might take in the short, medium and longer term to strengthen workforce forecasting and planning for the public service.

1
1.0 Introduction
At the core of every organization (both private and public) are the people that make it function: the workforce. Workforce planning is the organized process that identifies the number of employees needed and the employee skills and skill sets required to successfully meet set goals and objectives. It is a plan of action developed to ensure that the appropriate workforce is made available to provide quality work and output, leading to progress and success for the organisation.
Essentially it helps organisations to „get the right people in the right job at the right time‟. It allows for a more effective and efficient use of workers and for organisations to prepare for restructuring, reducing or expanding their workforces. In addition to the practical benefits, the process of workforce planning aids organisations by providing overarching objectives which integrate the various divisions and focus employees‟ attention on common goals for the future.
Un-managed, a workforce ages, thus the need for succession plans and workforce plans for human resources. Ethnical differences will arise during the time the workforce is planned to the time the plan is implemented and the workforce is committed to action. Measures to handle and promote gender diversity and social inclusion are constantly needed to maintain harmony in the workplace and to ensure that the public services are representative of the populations that they serve. Highly skilled employees will inevitably compete. How to take advantage of this to work for the organisation‟s benefit needs to be included in an operational workforce plan. Technology‟s steadily progressing march also needs to be taken into account in the workforce plan, as it will play into the jobs of employees. Indeed, useful workforce plans make certain that an organisation has the right number of employees doing the right kinds of jobs at the right time using the right methods and tools to make everything function like clockwork.
A good workforce plan anticipates the supply and demand and the flow of staff into, through and out of an organization. The benefits of proper workforce planning are numerous and varied. The top benefits of a good workforce plan include the following:
Helps prepare for inevitable retirements. In situation where there are high attrition rates, workforce planning also helps prepare for resignations, and how to deal with being understaffed.
Helps identify future skills and competencies needed in the workforce and any gaps between current and future job skills. In doing so, proper measures for training current employees or hiring ones with new skills can be put into place. The concept of talent management has in recent years evolved into a common and essential management practice and what was once solely associated with recruitment now covers a multitude of areas including organisational capability, individual development, performance enhancement, workforce planning and succession planning

2
Helps promote a diverse workforce, not to mention maintain it. The workplace can be a multicultural realm, with employees from different walks of life. Good workforce planning not only handles this but takes advantage of it to boost morale and camaraderie in the workplace.
Provides orderly and proper means to deal with any new internal and external workplace adjustments or wider labour market developments that can affect the workforce. Change is constant, but no matter what influences the organization faces, the workforce plan needs to be flexible enough to accommodate and deal with them properly.
Helps prepare for inevitable restructuring of the workforce. Be it reducing, increasing, or redeploying workforce assets, a workforce plan takes into consideration not only the current workforce structure, but what the structure needs to be like in the future.
Workforce planning is a vital practice for any organization that is proactive about the management of its human resources. In the case of Lagos State Government LSG, it is the actions required to coordinate and harness its human resource so that they effectively support the strategic goals of government to transform the State into a megacity and Africa‟s economic hub. Accurate data is essential for reliable workforce planning. The start point for LSG putting in place a robust workforce plan is to conduct a baseline that will show clearly the current State of workforce planning. The outcomes of an effective baseline or situation analysis of the workforce will reveal areas where there are gaps and actions that need to be taken to address them. The focus of this baseline analysis therefore, is to analyse current and historical LSG employee data to identify key relationships among variables and use this to provide insight into the workforce that LSG needs for the future. This workforce analysis will include reviewing employee recruitment, promotion and turnover patterns. In addition the analysis will also include reviewing the age and gender profiles of the workforce. This analytical approach is important as it will provide a fact based method of understanding LSG workforce planning.
Essentially, this baseline will reveal current LSG staffing issues as well as anticipated future staffing needs. The process involves assessing the current workforce in terms of whether or not its size is adequate and fit to meet current and future organizational demands, whether it is deployed effectively, and whether employees possess the appropriate competencies for high performance that will sustainably produce the desired results in achieving the strategic goals of LSG. It is a process whereby the gaps between the demands and supply of the workforce are identified and the strategic actions to address such gaps are developed for critical areas of the Government business. Key features from current best practice research by CIPD UK into the practical applications of workforce planning include the following:
• Workforce planning is an integral part of people management and provides the context for most other activities concerned with the acquisition, development and deployment of people resources.
3
• Workforce planning flows from organisational strategy and links people management into the operational process.
• The planning process must be organisation-wide and requires effective communication between HR and the operations as well as input from a variety of stakeholders.
• Good-quality information is vital for good planning and this information must flow both from within the organisation and from external sources.
• This information should contain an appropriate mix of „hard‟ metrics-based information to inform in the short term and „soft‟ strategic intelligence to plan for the future.
• Workforce plans should not be overly complicated but they must address both current and future needs.
• Workforce plans need to be robust enough to manage the organisation‟s people in the short term while flexible enough to cope with a range of future scenarios.
• Workforce data and planning can inform action to create the appropriate workforce to deliver future services and products.
• Evaluation and review should be embedded into the process of workforce planning with information on outcomes feeding back into the planning cycle

4
2.0 Methodology
2.1 Process
The task was initiated through a meeting with SPARC Lagos Programme Staff to review the ToR and how consultants intended to approach the assignment. Another meeting was held with top officials of Lagos State Management Service and Reforms Directorate (MSRD) as well as members of the LSG/SPARC PSM Priority 2 Working Sub-Group (P2) to get introduced and establish necessary rapport. A work-plan was developed and available and relevant documents were reviewed. Thereafter, several other meetings were held with the sub-group in the course of the task. SPARC Consultants and Members of the P2 Sub-Group and MSRD carried out workforce baseline interviews in the „Central MDAs‟ (Lagos State Judicial Commission (JSC), Health Service Commission (HSC), Civil Service Commission (CSC), Local Government Service Commission (LGSC), Teachers Establishment and Pension Office (TEPO), Public Service Office (PSO), Ministry of Establishment, Training & Pensions (METP) and Education District II (EDII)). between June and July 2010. Permanent Secretary and senior officers of the selected MDAs took part in the interviews and discussions. The interviews were held at the respective MDA offices. Information was obtained in soft and hard copies backed by official letters from the MDAs. The responses were analysed and formed a significant part of the reports on workforce baseline in the central MDAs. (See appendix 1 for details of persons interviewed and the interviewers.) The results of the data analysis were shared with the sub-group to validate the findings. The final draft was submitted to SPARC for higher level engagements on it with top State government officials.
2.1.1 Instrument and Data gathering
Structured questionnaire and open ended interviews were held with top managers of central MDAs to elicit data on existing workforce practice within them. Please see appendixes 1, 2, 3 and 4 for details
2.1.2 Scope
Following a series of technical inputs, it was agreed that work should focus more on generating baseline data on workforce planning in the „Central MDAs‟ in Lagos State Government Service. Central MDAs are: Lagos State Judicial Commission (JSC), Health Service Commission (HSC), Civil Service Commission (CSC), Local Government Service Commission (LGSC), Teachers Establishment and Pension Office (TEPO), Public Service Office (PSO), Ministry of Establishment, Training & Pensions (METP) and Education District II (EDII).
2.1.3 Limitations
The team‟s work was limited by some delays in getting meeting appointments with key officers of the MDAs due in part to some other commitments. In some other cases, the data asked for arrived very late. Work was slowed down because of lateness in receiving workforce data from MDAs. Some data that could give a general view on the whole workforce could not be authoritatively generated during the period of the assignment.
5
3.0 Findings and Discussions
3.1 Description of “As is” Workforce Planning Practice in Lagos State Public Service
The following description of the workforce planning practices in Lagos State Public Service was captured from data gathered in the course of study being reported upon. It is a representation of the situation on the ground as at July 2010 in the „Central MDAs‟. The data were collected and summarised by gender, age, ethnicity, length of tenure and qualifications in appendix 5. Summary responses to questions about current workforce planning and management practices are also presented at Appendix 5.
3.1.1 Current Recruitment Practices
Current workforce planning is informed by budgetary vacancy demands from the MDAs; executive fiat; and political considerations. Supply of the workforce is done through recruitment and deployment. The Public Service Office (PSO) is responsible for the deployment of the workforce and the recruitment of staff from GL 01-06; The Civil Service Commission (CSC) recruits levels GL 07 and above for the various MDAs. The CSC recruits staff directly with advisory input from the PSO, in the Office of the Head of Service (OHOS), and Ministry of Establishment, Training and Pensions (METP). Statutory agencies with a Board, recruit their own staff subject to approval by the State Governor. Recruitment is not based on formal age, gender or diversity analysis of the workforce, though CSO, PSO and HSC reported that they do analyse workforce data along these lines. There are little or no regular modifications to the recruitment process that could enable the process to create a better applicant pool that could increase the quality of entry level hiring (though CSC, JSC and HSC reported that they modify processes to create a better applicant pool (see Appendix 5). In addition, the public services appear not to have strategic relationships with institutions of higher learning and access to their best graduates. Right now the Service recruits from the open labour market through a process that does not promise the hiring of the best hands.
3.1.2 Retention and Reward
Though State employees tend to stay in the Service because of personal decisions rather than any articulated retention strategies from the of Government, the legacy grade levels in the public sector appear to be something that all career civil servants look up to and thus impact on their willingness to stay on in the Service. For instance, central MDAs hardly conduct any systematic salary analysis to ensure that what is paid as salaries are competitive compared with good practices elsewhere particularly for a workforce that must survive in an environment with the peculiarities of Lagos State. Also, because the MDAs in the sample do not carry out formal exit interviews they are unable to determine why some people leave. This limits the ability of MDAs to forecast how many people are likely to quit the Service due to misconduct, or better opportunities elsewhere or redundancy or domestic reasons etc, and their ability to develop good retention or replacement strategies. The Service generally appears not to have any formal recognition programme for exemplary performance just as there are no employee satisfaction surveys to solicit workforce input into
6
people issues in the State Civil Service. At the moment there appears to be no performance related pay that could incentivise meritorious performance on duty. The 25% of basic salary and double promotion intended to be a cushion for some staff in some „dry‟ MDAs (i.e. MDAs that are working on non-sensitive public matters), is largely seen within the Service as too small and almost of no significant effect. This selective compensation practice may also have some negative effects on the morale of the workforce just as it may enthrone some unwholesome practices in the process of effecting transfers and deployments of staff. Career progression tends to be rather routine and not tied to meritorious performance that could encourage best professionals in various fields to stay on in the Service, for example, the GL14 seal-up limit for some categories of officers who think they should be able to make it to the top.
3.1.3 Knowledge Transfer
Current practice in knowledge transfer in the central MDAs appears to be above average. All of the sample MDAs reported existing policies on job documentation for employees that could create an „experience bank‟ and preserve institutional memory. Opportunities also exist for occupational related technical training programmes that could prop up staff careers and there are job rotation practices that enrich individual staff to gather experiences in a wide variety of public service job operations. Though results show that there are opportunities for junior officers to understudy senior officers prior to their retirement, coaching and mentoring practices are not formalised or developed into a programme that could contribute significantly to meaningful workforce planning in the service. At the moment, the service provides no exchange training for staff and scarcely perform formal job audits to know which jobs are disappearing and which ones emerging or that must emerge in the light of projected future or current strategic goals of the State Government. None of the MDAs in the sample carries out employee satisfaction surveys, now seen as essential practice in other administrations.
3.1.4 Staff Development
Staff development initiatives are driven by key institutions of government like the PSSDC (for GL 1-12) and planned programmes handled by Ministry of Establishment and Training through outside consultants (GL 13 and above). The data show that the evaluation of staff development training integrated into work performance used to exist but currently does not. Though there are training opportunities for employees, it is not clear whether these have been developed into a systematic individual learning and development plan that could be used for workforce planning purposes. Also at the time of the assignment there was no evidence to show that the training curriculum for the State existed or that it was linked to the any identified skills and competencies required for effective performance and leadership in the Public Sector of the State. It will be helpful if this is addressed in any future corporate actions for the State because of its implications for staff development in the State.1
3.1.5 Job Classification
Baseline data shows that workload analyses for job groups as well as job analysis for the purpose of accessing changes in skills need, education or training are scarcely done in the Service. Workload analysis by job group is not routine. No official assessment has been
1 In parallel METP is reviewing how training needs are defined and met in the LSG Civil Service

7
conducted in the State Civil Service to determine the impact of changes in technology and its impact on jobs in the Service. Generally, there appears to be unhelpful and frequent redeployment of some staff within the Service and temporary reassignment based on workload issues. Some officers who have been trained to specialise in some fields up to professional level are suddenly deployed to some other duties that make little or no use of their professional capability. This could constitute a waste of investment, of potential and of individual capacity.
3.1.6 Baseline Data – demographic, and workforce profile
Baseline data shows that workload analyses for job groups as well as job analysis for the purpose of accessing changes in skills need, education or training are scarcely done in the Service. Workload analysis by job group is not routine. No official assessment has been conducted in the State Civil Service to determine the impact of changes in technology and its impact on jobs in the Service. Generally, there appears to be unhelpful and frequent redeployment of some staff within the Service and temporary reassignment based on workload issues. Some officers who have been trained to specialise in some fields up to professional level are suddenly deployed to some other duties that make little or no use of their professional capability. This could constitute a waste of investment, of potential and of individual capacity.
3.1.6.1 Age Distribution
Age Headcount Percentage (rounded)
18+ 104 1%
20+ 1087 8%
30+ 3564 26%
40+ 6781 49%
50+ 2201 16%
total 13737 100
Source: Data generated during this study from the sample of MDAs The average age is 37.3 years; over 35% of sampled MDA staff are between the ages of 18 and 39, while 65% are above age 40. This warns that the workforce may not be as young as one may imagine. There is also a disproportionate tilt in the 40 to 49 age bracket which accounts for almost half (49%) of the workforce in the sampled MDAs. Among others, this warns that at a particular time in the near future, half of the workforce may be due for retirement on age ground within a short period of time. The Service need to prepare ahead of this to mitigate the impact of possible mass disengagement from service on age grounds in the near future. Also, the total number of persons aged between 18 and 29 came to only 9% compared with 16% for those who are 50 and above. This shows a margin of 7% between those in the entry age bracket and those in the exit age bracket. Some long term workforce planning strategies are required to correct the imbalance or to plan for a smaller Civil Service as appropriate to LSG‟s needs. This is further underscored by the fact that the total number of age brackets below this large age group (40 years and above) only constitutes 35% indicative of a possible succession crisis if not proactively managed.

8
3.1.6.1.2 Tenure (Service) Characteristics
Year in service
Headcount Percentage
5- 3813 28%
5+ 1926 14%
10+ 1021 7%
15+ 1993 14%
20+ 2845 21%
25+ 1208 9%
30+ 932 7%
137382 100
Source: Data generated during this study from the sample of MDAs Tenure characteristics show a stable workforce as only 7% of the central MDA workforce have served over 30 years in service (or are advancing towards retirement) compared with over 28% who are just joining the service and have served less than 5 years. 42% of the workforce has an average of 15 years to go in the service. This suggests a relatively matured workforce and steady distribution of tenure in the sampled MDAs. If this applies across the Service, Lagos State Government will want to ensure that the Service continues to renew itself and to watch MDAs like METP that are deficient in this stable or mature distribution. If this is put side by side with the age distribution, proactive actions are required to ensure that the interplay between the two do not catch the Service unaware. Because at the end of the day exit decision is based on which of the two comes first – age or years of service.
3.1.6.3 Ethnic Diversity
Classification Headcount Percentage
Indigene 4979 35.92%
Non-indigene 8746 64%
Expatriate 12 0.08
Total 13737 100%
Source: Data generated during this study from the sample of MDAs The workforce appears to be diverse. This is because many people tend to migrate to the State as a „land of opportunities‟. It also points up the fact that possibly not many indigenes show great interest in working with the Public Sector of the State. Non-indigenes tend to be more in the workforce pointing to the peculiar nature of the population of the State as a melting pot for all Nigerians. One would expect that a State with the sophistication of Lagos should have more expatriates in its service than shown in the above data. It suggests that Lagos State Government needs to take deliberate steps to make its teeming non-indigenous population comfortable and at home to work for the good of the State. It was gathered that the Service has no properly disaggregated ethnic diversity data that will show clearly how many Yoruba, Hausa, Ibo, Tiv Effik, Ijaw, etc are in the State Government Service and therefore how socially inclusive
2 Total taken from 3.7.8.1.Summary of Workforce Demographic Profile, page 14 showing a difference of 1compared
with age distribution total

9
the Service might be. Internally too, HR managers in the service should be able to tell how many people are from Ikorodu, Aja, Island, Mainland, Badagry, etc in the workforce. Information like this could become handy when government needs to respond proactively to social justice issues such as of marginalisation.
3.1.6.4 Educational Qualification
Qualification Headcount Percentage
FSLC/S.75/SC 3936 29%
ND/NCE 1704 12%
HND 2742 20%
Degree 3888 28%
PGD 1468 11%
13738
Source: Data generated during this study from the sample of MDAs Holders of First Leaving Certificate, S.75 and High School Certificate account for 29% of the sampled workforce. While it is understood that workers who fall within this qualification bracket are mainly support staff like cleaners, gardeners and some drivers, government needs to watch this trend to be sure that this class of its workforce does not become an unproductive group in the service. It is also important to take steps to control this trend against the long term workforce strategies of the State in delivering on its mandates. Another issue to address for this category is the skills required to work in the State Public Service. For instance, the State might need to plan in a progressive manner, exit management strategies for this category that will make them useful even after retirement from the Service or as a result of any involuntary exits that the policies and the programmes of the State may bring to bear on them. While the data show that over 70% of workforce have the requisite qualifications to perform their duties and are trainable, it is also clear that only 11% of workforce has postgraduate degrees. This suggests that the bulk of the trainable workforce need to upgrade their skills and qualifications on the job. The Service will need to take calculated steps in the direction of in-service training for its workforce such that all trainable staff have equal opportunities to such training. Otherwise, increasing complexities of the State government programmes and projects may overdraw this apparent advantage.
3.1.6.5 Gender Distribution
Female Male
Headcount Percentage Headcount Percentage
5738 42% 7999 58%
Source: Data generated during this study from the sample of MDAs There are more men than women employed in the central MDAs - 58% and 42% respectively. This suggests a gender balance in the workforce as the distribution also reflect similar balance in male and female dominated positions or roles. It should be noted however that the 12% difference is due largely to the disproportionate dominance of the male gender in the Health Service with over 32% difference. Otherwise, the most likely trend in service-wide statistics may show that the State actually has more women than men in its service. A core issue of concern here is gender differentiation and balance particularly in some jobs or roles especially jobs that tend towards gender dominance if not stereotyping For instance, traditionally male dominance

10
tends to feature in the public safety, transport and security jobs and female dominance in office support and hospitality roles. Human Resource Managers in the State Service should be alert to gender imbalance or stereotyping of roles within the Service. The data in the study exposed the interesting differentiation at Permanent Secretary level as shown on the table below with the ratio of female to male at 79:400 and a reverse at the feeder grade (Directors) below them standing at 373:170. HR managers will want to ask „What does this suggests to the Service in 5-10 years‟ time? „
3.1.6.7 Supervisory Ratio in the Civil Service
Designations Headcount Percentage
Gender
Female Male
Head of Service 1 0% 1
Permanent Secretary 479 22% 79 400
Director General 4 0% 1 3
Director 545 25% 375 170
Deputy Director 1134 53% 500 634
TOTAL 2163 955 1208
Non Supervisor 55679
Supervisory ratio 1:26 approximately Source: Existing data in the Ministry of Establishment Training and Pension, Civil Service Commission and PSO
3.1.6.8 Turnover Rate In the Civil Service
Exit Type
2009 2008 2007
Headcount Headcount Headcount Retirement (Statutory) 679 956 889 Early Retirement (Voluntary) 170 224 63 Death 48 60 78 Termination and Dismissal 105 134 202
TOTAL 1002 (1.7%) 1374 (2.3%) 1232 (2.1%) Turnover Rate Difficult to determine with only 3 years data – not easy to use
for any meaningful forecasting yet. Source: Existing data in the Ministry of Establishment Training and Pension, Civil Service Commission and PSO
Though the turnover statistics shown above appear to be inadequate for defining trends, it appears to suggest a relatively low turnover rate. This however depends on where the bulk of the turnover occurs. It could be dangerous if a particular agency is found to be experiencing

11
high turnover within the service as it is the case in Health Services while others like those in the Career Civil Service does not. HR managers in the service will want to pay attention to specific areas in the Service where turnover rate may have a negative impact on service delivery performance within the Service. However, as found in the HSC, where services rendered are crucial and required skills are relatively scarce, just as competition for the limited available skill is high, turnover is likely to be problematic.
It was gathered that HSC recruits almost on monthly if not weekly basis to stem the tide of high turnover in the sector. The sensitivity of their services to the society has compelled HSC to take some proactive measures that have some elements of workforce planning. For instance, they have a Director of Human Resource recruited from the private sector to perform core HRM functions, and are able to forecast personnel demands upfront for up to 4 years. They have regularly updated records of job groups with high turnover and take pre-emptive steps to limit the impact on the overall performance of the sector. The Health Commission has special dispensation to fill any existing vacancies as they occur without recourse to usual and rather long approval processes and they got a mandate from the Government that enables them make their hiring and retention practices as competitive as government can afford. Although these measures by HSC, do not quite represent what is referred to as workforce planning in this report, they are indicative of emerging change and good practice. They are a pointer towards how crucial and necessary workforce planning is to a public service as huge as that of Lagos State.
3.1.7 Summary of Demographic Data
The foregoing results are deduced largely from demographic data generated during this study. Please see Appendix 5 for detailed presentations of these data.

12
4.0 Overlaps, duplication and gaps in workforce planning and decision making
The Civil Service Commission is the statutory body charged with the responsibility of recruitment at entry point, career management, disciplinary action and exit from the Service (withdraw, retirement, resignation, termination of appointment). In practice however, this mandate is implemented by collaboration among the Commission, the MDA where a vacancy occurs, METP and the Public Service Office. These collaborate to determine the entry point, cadre and grade level of all the Senior Civil Servants in the State which usually start from grade level 07. METP collates all vacancy returns which are forwarded from the MDAs; they then request approval for a dispensation to recruit from HE the State Governor. The approvals for dispensation to recruit are then forwarded to the CS Commission who handle the recruitment exercise. The names of successful recruits and appointed officers are forwarded to the Public Service Office for placement and posting to places of primary assignment in the Service. Apart from the foregoing, there are parallel procedures for recruitment in the case of statutory agencies with a Board and Chairman. These Agencies recruit their own officers and staff directly after obtaining a dispensation from the Governor. Here again, the Commission is represented at critical stages of the recruitment process into these Agencies. The above processes are explained as having no duplications. The report has already noted above that recruitment is not based sufficiently on data and projected need but on the annual budget and filling current vacancies and it is said to be skewed by fiat. The overall scenario does raise questions about the efficacy of the process: its length, the number of steps and players. It merits further investigation and possible streamlining, as HSC has been able to do. If beyond recruitment the roles and accountabilities of the „Central MDAs‟ in workforce planning and deployment are less than clear these too should be examined objectively when adopting workforce planning.

13
5.0 Design and Models for Workforce Planning in LSG
This section provides suggestions on how LSG may approach the issue of workforce planning in the State from practical and theoretical perspectives. Please see appendix 6 for details on this and illustrative examples. We recommend that LSG adopts a „Predictive Workforce Planning‟ model (option 3 in appendix 6)
5.1 Workforce Planning – Concepts and good practice
The primary aim of workforce planning is to have the right people in the right job with the right skills at the right time. Workforce planning is a process to identify workforce needs to deliver strategies and mandates. It identifies the gaps between supply and demand and allows organisations to plan best alternatives to acquire, develop and maintain the right talent and skills needed to deliver its business. As such it requires the mechanisms to forecast the demand for numbers, grades and skills over a given period (usually 5 years) and to do this within the context of a wider labour market and planned changes to workforce productivity. Workforce planning is the means to build capability to meet future performance requirements. A sound workforce plan drives recruitment, resourcing, career development, succession planning, pay plans and training plans.
Workforce resource planning should take into account the following:
Lagos State vision and the public service it will want and need to sustain and support this
The strategy and policies for future public service (including transformation goals)
Demographic changes in the State and the labour market
Technology changes in society and the public service
Financial resources available
Stakeholder expectations
Legal demands
Workforce flows into and through the service
Staff potential and capability (know-how, skills, qualifications and experience, attitudes, values and networks)
The levels of capability needed – from awareness through to expert and the numbers needed at each level
The jobs and trends in ways of working and delivering services
The roles and organisational design principles that will maximise performance
Workforce planning requires information and data about individuals and aggregated at MDA and State level to inform good decisions about the workforce. A „single version of the truth‟ is required or data will be disputed. At present data on staffing in LSG Public Service staffing is distributed between too many Government Agencies

14
Information about individuals may go beyond what is already available to LSG. For example to what extent does each MDA in LSG know:
The age profile of the workforce
The time individuals have served in their jobs
Their earliest date for a move
Staff ambition
Staff potential to rise 1 or 2 levels based on perceived readiness for promotion
Staff potential to reach the top level
How well and objectively potential is assessed
Risk of staff leaving
Staff mobility or constraints
How current staffing is over stocked or under stocked in groups, grades or categories
Gender and social inclusion statistics
A typical workforce planning is a four -step process that involves:
i. Analysing the workforce to isolate the strategic gap between the current workforce and strategic goals for the Public Service in the immediate, short, medium and long terms.
ii. Developing a workforce plan to bridge the gap. iii. Implementing the plan through effective workforce actions such as recruitment,
transfers, secondments, deployments and exits iv. Monitoring, evaluating implementing and revising the plan.
These processes require a great deal of skill in human resources management and planning.
Appendix 6 sets out three options for workforce panning and recommends Option 3 as the most practical one to guide LSG. The process and its elements along with model templates are described in the appendix.

15
6.0 Conclusions
It is surprising to discover that formal workforce planning practice is not in place in Lagos State government personnel management. Lagos State has ambitious plans for its economy which will have an impact on the wider labour market and the competencies required of the public services. Forecasting the supply and demand for future capability will be essential if the public services are to be effective, of the right demographic profile and planned to be the right size for future effective performance. Workforce data are available but not properly coordinated or used to for the purpose of workforce planning. These data are duplicated in some key MDAs and it is difficult to State that the data are coordinated for any effective forecasting or current workforce planning and implementation. For instance METP, PSO and CSC keep personnel data in disparate forms. Effective trend analysis was difficult to establish by the consultants because of this and other
factors. Workforce planning requires information and data about individuals and aggregated to inform good decisions about the workforce. A ‘single version of the truth’ is required or data will be disputed. At present data on staffing in LSG Public Service staffing is distributed between too many Government Agencies The results presented above shows that Lagos State has not undertaken any systematic workforce planning since its creation in 1976. The State currently bases its workforce plan on staff vacancies and the annual budget. The demographic information shows that LSG should be taking steps to identify what actions it should be taking to mitigate any risks in the current demographic profile and to plan its future workforce in a more strategic way to fit it for future responsibilities. The time has come for the State to develop and apply all principles of systematic workforce planning to the management of its human capital. This will involve among others, the generation of authoritative baseline data on the existing workforce, development and adoption of a workforce planning model for the State, reconstruction of current personnel management organs or Agencies of Government to assume proper HR functions. The broader implications of all these is that the State needs to take deliberate steps to ensure that it has professional Human Resource Management functions including HR Management Information Systems (HRMIS) in place. The overall target is for the State to be able to effectively forecast workforce demand and supply in the short, medium and long runs.
Work is in hand in LSG to create a professional HR function in the „central‟ and operational MDAs. The report identified that the current processes for staff recruitment, deployment and succession planning may not be as fit as they could be for future purposes. A professional HR function will require reliable data and staffing projections through a published workforce staffing strategy and plan if it is to be effective. The function will continue to be split between the „central‟ MDAs and operational MDAs but as the report identifies HSC has taken steps to redefine roles and processes. LSG should take the opportunity afforded by this study to enact a review of the roles and responsibilities of those institutional players who are best placed to create and implement a workforce plan for the short, medium and longer term.
Jobs are not audited to make them relevant and responsive to projected future or current strategic policy goals of the State government.The data indicate that workload analyses for job
16
groups as well as job analysis for the purpose of assessing changes in skills need, education or training are scarcely done in the Service. The data also show that little or no official assessment has been undertaken in the Service to determine the impact of changes in technology on jobs and that staff can often be deployed to posts that are at variance with their profession or and specialism. A systematic and thorough establishment planning will address these and some other establishment matters that will further position the State‟s workforce for effective service delivery to the teeming population of the State.
As at the time of this report, the most attractive incentives for most public officers to stay on in the service revolve around their personal decisions and expectations to get to the so called „legacy grade levels‟ in the Service rather than any articulated performance criteria and retention strategies on the part of Government. Systematic salary analyses to ensure that salaries and wages are competitive are rarely done, if done at all. In addition, the service currently does not carry out formal exit interviews of its officials, this limits its ability to determine why people leave. It also inhibits its ability to forecast how many people are likely to quit the service due to misconduct, better opportunities elsewhere, redundancy or domestic reasons among others. A retention strategy should take care of all these issues.
At July 2010 the service had 79 female Permanent Secretaries compared with 400 male with a reversal at the immediate feeder level of Directors 375 women to 170 men. There are implications here for gender equilibrium in the top levels of the service. LSG needs a succession plan is that is audited regularly for gender and ethnic balance to ensure that the senior Service is representative of the population that it serves. 29% of the sampled workforce is classified as „unskilled‟ with educational level at High School Certificate. There are implications of such a high proportion of mainly ancillary roles and „unskilled‟ staff for the current and future workforce composition and performance. It is not clear how systematically LSG ensures that all groups of staff are equipped with the skills and qualifications they need to meet the future performance requirements that Lagos State demands Succession planning is not in place.
Staff ascend in turn to positions whether they can perform in that post or not. Promotion to leadership positions in the Service is based mostly on seniority rather than competence or merit. This appears mundane, antiquated and at odds with aims to deliver the best services to the people of the State. There is no mechanism in place to enable the State to identify talented officials and provide education to develop them for future higher levels and broader responsibilities.

17
7.0 Recommendations
It is important for Lagos State Government puts in place a strategic workforce planning process that will constantly identify the people/human capital needs that are required to drive its vision of becoming Africa economic hub and one of the top mega cities in the world. Therefore, the following action should be taken to entrench an effective workforce planning mechanism for Lagos State public service.
7.1 Quick Wins (Within 6 months)
There is need to urgently:
i. Adopt an appropriate workforce planning model suitable for an organisation the size of Lagos State public service. Model 3 in Appendix 6 is recommended because of its efficiency over the other 2 models analysed. Using this model guesswork can be eliminated by considering first the uncontrollable workforce actions and then determining the mix of controllable workforce actions to eliminate the gaps and surpluses. With respect to the public sector in LSG, the uncontrollable workforce actions are predictable from data kept on the workforce over the years and thus this model should appeal for ease of implementation.
ii. Investigate further the underlying reasons for the low turnover rate of 2% to mitigate the risk of stagnation
iii. Establish an appropriate HR structure that will regularly review, modify recruitment process to meet the specific human capital needs of each MDA within the State public service.
iv. The new HR structure should articulate a retention plan, conduct salary analysis to ensure merit is adequately rewarded and conduct regular review and modification of the recruitment process in LSG public service.
v. Review the Scheme of Service and align with the strategic direction and skills requirements to drive the strategic goals of the State.
vi. Conduct a mapping of recruitment process to make sure it is in line with good practice. vii. Formalise detailed job description for all jobs in the State. viii. Articulate and sensitise the LSG workforce to the strategic direction of the State and the
crucial role of the workforce in arriving at the desired destinations of those goals. ix. Compile authoritative baseline data on the workforce for all MDAs in the State to have a
broader picture of the demographics on staff. x. Initiate moves to reconstruct all current personnel management organs of government to
assume proper HR functions and equip them for effective operations.
7.1.1 Medium Term (Within 2 years)
i. Establish HR structure and profile roles for it in the State, ii. Communicate the new structure to all the MDAs iii. Train HR and top level staff on workforce methodology using a number of examples from
the peculiarities of the MDAs

18
iv. Put in place and train HR officers on the use of HRMIS v. Develop a strategic Workforce Plan for the State in collaboration with HR officers and
associated MDAs; including the medium and longer term implications of 29% of its workforce being „unskilled‟
vi. Develop and communicate workforce actions to address the workforce plans developed for the State
vii. Review current workforce capability in the State through workforce Audit and competency profiling for the workforce.
viii. Establish a robust Human Capacity Development programme for the entire LSG public service.
7.1.2 Long Term (Within 5 years)
LSG should target to develop a five year strategic workforce plan that addresses present and future human capital challenges in its service. This plan should enable government to identify the key actions needed to deal with immediate problems with recruiting and hiring, training, retention, talent management and succession planning in support of strategic goals of the State. It should additionally enable State government and human resource managers to anticipate and plan for the future workforce that will be needed to drive and maintain the modernised and fundamentally transformed Lagos State as envisaged in the Megacity Project, Ten Point Agenda and strategic framework for the development of the State. An appropriate HR Structure when established should:
i. identify key indicators of human capital performance, including recruiting and hiring measures, level of stress in the workplace, training needs, turnover and gender and ethnicity profiles. Establish standards for acceptable performance on these indicators;
ii. routinely collect and analyse data to identify trends, and use this information to guide decisions regarding future workforce needs of the State and the strategies to meet them;
iii. provide necessary tools and technical assistance to MDAs to enable them conduct long-term workforce planning;
iv. work with MDAs to ensure that MDA staff responsible for providing HR functions are well trained in the tenets of workforce planning;
v. require each MDA to develop its own long-term workforce plan that is linked to the State long-term workforce plan;
vi. work in partnership with the MDAs and their parent agencies to develop these plans; work with the State government to establish an on-going program of outreach from a cross section of MDAs‟ to discuss the benefits and challenges workforce planning and encourage them to address human capital challenges identified

19
Appendix 1 MDAs Covered and List of Person Interviewed The Head of Service, Mr Amisu, and Mr Sunny Osuagwu were met separately ahead of the interviews listed below to capture the big picture of the people and establishment issues in the Service.

20
21
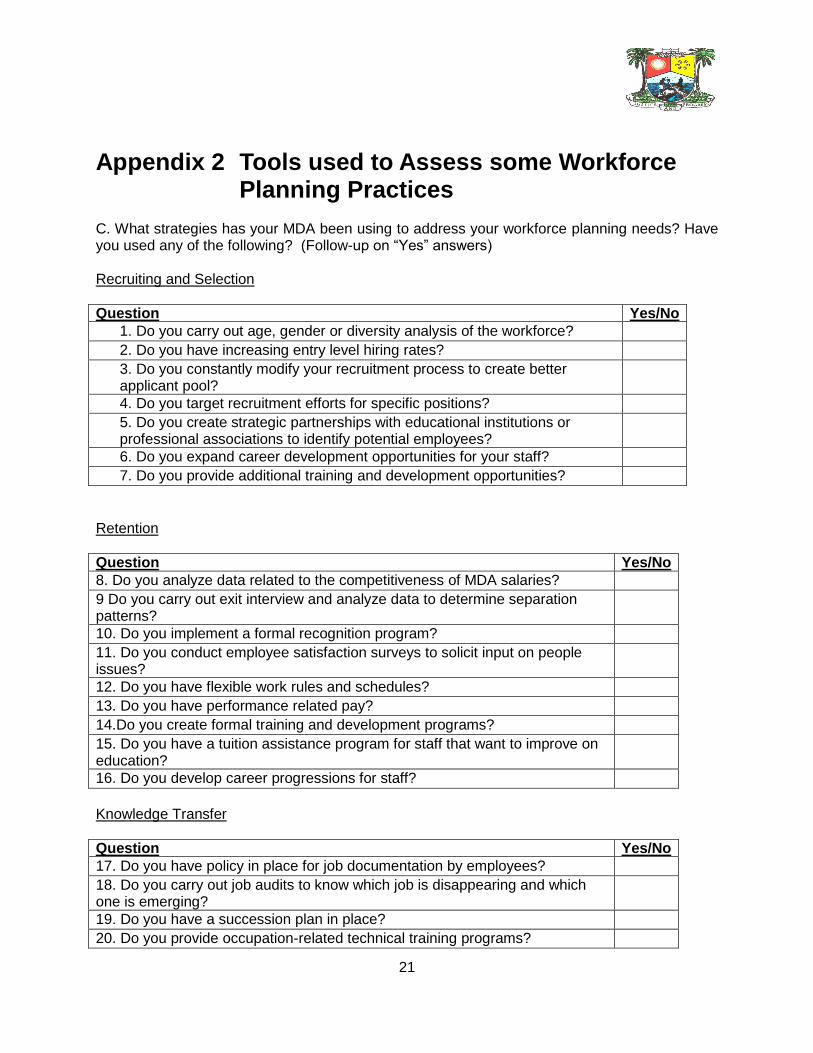
Appendix 2 Tools used to Assess some Workforce Planning Practices
C. What strategies has your MDA been using to address your workforce planning needs? Have you used any of the following? (Follow-up on “Yes” answers) Recruiting and Selection
Question Yes/No 1. Do you carry out age, gender or diversity analysis of the workforce? 2. Do you have increasing entry level hiring rates? 3. Do you constantly modify your recruitment process to create better applicant pool?
4. Do you target recruitment efforts for specific positions? 5. Do you create strategic partnerships with educational institutions or professional associations to identify potential employees?
6. Do you expand career development opportunities for your staff? 7. Do you provide additional training and development opportunities?
Retention
Question Yes/No 8. Do you analyze data related to the competitiveness of MDA salaries? 9 Do you carry out exit interview and analyze data to determine separation patterns?
10. Do you implement a formal recognition program? 11. Do you conduct employee satisfaction surveys to solicit input on people issues?
12. Do you have flexible work rules and schedules? 13. Do you have performance related pay? 14.Do you create formal training and development programs? 15. Do you have a tuition assistance program for staff that want to improve on education?
16. Do you develop career progressions for staff?
Knowledge Transfer
Question Yes/No 17. Do you have policy in place for job documentation by employees? 18. Do you carry out job audits to know which job is disappearing and which one is emerging?
19. Do you have a succession plan in place? 20. Do you provide occupation-related technical training programs?

22
21. Do you provide exchange training for staff? 22. Do you have a system in place for understudying employee prior to retirement?
23. Do you have a formal coaching and mentoring programme for your staff? 24. Do you have job rotation opportunities?
Staff Development
Question Yes/No 25. Do have individual learning or development plans for employees? 26. Do you have management or leadership development programs? 27. Do you have career planning activities to assist employees in identifying career interests and potential for growth?
Job Classification or Organizational Change
Question Yes/No 28. Do you conduct workload analysis for job groups? 29. Do you conduct job analyses for the purpose of assessing changes needed in skills, education or training?
30. Do you create new internal job titles for emerging positions? 31. Do you conduct assessments related to the impact of changes in technology and the impact on jobs?
32. Do you have frequent redeployment of staff? 33 Do you reassign staff on temporary basis based upon workload issues? 34. Do you have a human resources section in the MDA strategic plan? 35. Do you have a regular schedule of workforce planning activities for your MDA?
D. What workforce strategies have been the most helpful to you? Why? E. Have you had any difficulty identifying strategies to address any of your workforce planning needs? Which ones? Is it from the supply and/or demand sides? F. Please State the strategies that you have which you think you need to know more about in planning for your workforce? G. Other Comments or Observations on the workforce planning challenges in your MDA Feedback from the Senior Officers

23
Appendix 3 Discussion Guide with Head of Service and other top Ministry of METP Officials
Anticipated contribution to
LSG PSM longer term Dimension Outcomes:
Possible Questions Line
Work volumes and manpower needs are identified based on mandates, policies and service performance plans for MDAs.
Current methods for workforce planning and forecasting and profiling are captured
Government as a whole and MDAs in particular have clear and comprehensive establishment and workforce plans to guide HR management.
Regular workforce planning and review processes are in place.
Corporate planning mechanism in place (and aligned with MTSS/METF/P and S)
Guidance for Workforce planning, deployment and development available and adopted
Proposals to METP, LSG, and NCE to update rules and regulations
1. Can you give us an idea of the work volume of an
average junior staff? 01-06, Middle Class staff: 07-14, Top senior staff 15-18
2. How is workforce planned in the State public
service?
3. What is the experience of Lagos State in Workforce profiling and forecast?
4. Are there areas of overlaps, duplications, or gaps
known to you in the plan?
5. What establishment plan do you have in place in the State?
6. Other MDAs?
7. How comprehensive is your workforce plan?
8. How is your establishment and workforce plan and HR management?
9. We would like to have an idea of how regularly workforce are planned and/or reviewed in the State service.
10. What corporate planning mechanism do you have in
place?
11. Is this aligned to MTSS/METF/P&S?
12. What type of workforce deployment and development strategy is in use presently?

24
13. What establishment and workforce related rules and regulations would you want updated

25
Appendix 4 Tools for Workforce Profile Demographics
MDA: _______________________________________________
1. Please give us a brief description of your current workforce demographic distribution:
Gender
Age
Origin
Tenure
Qualification
F M 20+
30+
40+
50+
I NI E 5-
5+
10+
15+
20+
25+
30+
SC ND HND
D PGD
Where I = Indigene; NI = Non Indigene; E = Expatriates: SC = School Certificate; ND = National Diploma; HND = Higher Nat. Dip; D = Degree; PGD = Post Graduate Degrees How has this demographic data contributed to your workforce planning? What issues has this data helped you identify as needing attention?
- Segments of the organization workforce with critical needs? - Job Classifications with critical needs?
2. Please give a brief description of the occupational groups that will be vital to current and
future mandate of this MDA?
Work Group Relevance to
Mandate Availability in sufficient quantity
Average exit time
LR MR
HR SA MA AA 2+ 5+ 10+
Permanent Secretary Director Deputy Director Assistant Director Assistant Admin Officer Principal Admin Officer Admin officers

26
Executives Admin officers Clerical Officer Chief Clerical Officer Executive Clerical Officer Secretary Chief Secretarial Officer Assist Clerical Officer Head Cleaner Cleaner Office Assistant
Legend: LR -Less Relevant; MR- Marginally Relevant; HR-Highly Relevant; SA – Sufficiently Available; MA- Marginally Available AA - Averagely Available

27
Appendix 5 Details of Workforce Demographic Data
Summary of Workforce Demographic Profile
MDA
Gender Age Ethnic Tenure Qualification
M F 18+ 20+ 30+ 40+ 50+ I NI E 5- 5+ 10+ 15+ 20+ 25+ 30+
FSLC/ S.75/SC
ND/NCE HND D
PGD
CSC 88 106 16 64 66 48 103 91 0 45 27 33 24 14 22 30 98 7 21 62 7 Pension Office 68 39 5 38 35 29 45 62 0 68 37 2 0 0 0 0 48 9 21 22 7
JSC 20 20 5 15 15 5 14 26 0 19 3 6 2 4 4 2 24 3 4 9 0 ESTB.& TRG 76 109 8 61 60 56 95 90 0 18 49 36 25 8 21 28 89 13 18 48 17
LGSC 35 45 0 9 37 34 45 35 0 1 8 23 18 4 13 13 47 3 11 11 8 Edu.
District 2
2083
2630
76 95 312 3884
346 1475 3230
8 316 208 224 715 2456
624 170 1278 602 149 1520
1164
PSO 187 203 26 112 137 115 188 199 3 53 101 94 44 39 26 33 233 32 33 61 31
TEPO 87 92 4 28 88 59 63 116 0 5 15 22 54 28 30 25 89 10 20 40 20
HSC 535
5 249
4 28 928 292
5 245
9 150
9 2951 489
7 1 328
8 147
8 581 111
1 292 468 631 2030 102
5 2465 211
5 214
799
9 573
8 104
1087
3564
6781
2201 4979
8746
12
3813
1926
1021
1993
2845
1208 932 3936
1704 2742
3888
1468
Where I = Indigene; NI = Non Indigene; E = Expatriates: SC = School Certificate; ND = National Diploma; HND = Higher Nat. Dip; D = Degree; PGD = Post Graduate Degrees

28
Analysis of workforce Planning Interview from MDA3
Questions CS
C
PO
TE
PO
PS
O
JS
C
LG
SC
ME
&T
ED
II
HS
C
Recruitment and Selection
Do you carry out age, gender or diversity analysis of the workforce? yes yes no yes no no no no yes
Do you have increasing entry level hiring rates? yes no no yes yes no no yes yes
Do you constantly modify your recruitment process to create better applicant pool? yes no no yes no no no yes
Do you target recruitment efforts for specific positions? yes yes no yes yes no yes yes
Do you create strategic partnerships with educational institutions or professional associations to identify potential employees? yes yes no yes no no no no no
Do you expand career development opportunities for your staff? yes yes yes yes yes no yes yes no
Do you provide additional training and development opportunities? yes yes yes yes yes yes yes yes no
Retention
Do you analyse data related to the competitiveness of MDA salaries? yes yes yes no no no yes
Do you carry out exit interview and data to determine separation pattern? no no no no no no no no no
Do you implement a formal recognition program? yes no yes no no no yes no
Do you conduct employee satisfaction surveys to solicit input on people issues? no no no no no no no no
Do you have flexible work rules and schedules? yes yes no no yes no yes yes yes
Do you have performance related pay? yes no no no no no no no
3Some responses are blank on this table and we assumed that the expected information is either not applicable to the MDA or non-available as at the time of study.

29
Do you create formal training and development programs? yes yes yes no yes no no yes no
Do you have a tuition assistance program for staff that want to improve on education? yes yes no yes no no no yes no
Do you develop career progressions for staff? yes yes no yes yes yes yes yes no
Knowledge Transfer
Do you have policy in place for job documentation by employees? yes yes yes yes yes yes yes yes
Do you carry out job audits to know which job is disappearing and which one is emerging? yes no no yes no yes no no
Do you have succession plan in place? yes yes yes no yes yes yes yes no
Do you provide occupation-related technical training programs? yes yes yes yes no no yes no
Do you provide exchange training for staff? no no no no no no no no
Do you have a system in place for understudying employee prior to retirement? yes no yes yes yes no yes no no
Do you have a formal coaching and mentoring programme for your staff? yes no no no yes yes yes no no
Do you have job rotation opportunities? yes yes yes yes yes yes yes yes yes
Staff Development
Do you have individual learning or development plans for employees? yes yes no yes no no no yes no
Do you have management or leadership development program? yes yes yes yes no no no yes yes
Do you have career planning activities to assist employees in identifying career interests and potential for growth? yes yes no yes no no no yes no
Job Classification or Organisational Change
Do you conduct workload analysis for job groups? no no no no yes no no
Do you conduct job analysis for the purpose of assessing changes needed in skills, education or training? yes yes no yes no no no no
Do you create new internal job titles for emerging positions? yes yes no no no no yes Do you conduct assessments related to the impact of changes in technology and the impact on jobs? yes no no no no yes no

30
Do you have frequent redeployment of staff? yes yes yes yes no no yes
Do you reassign staff on temporary basis based upon workload issues? yes yes yes yes no yes yes yes
Do you have a human resources section in the MDA strategic plan.? yes yes yes yes yes yes no yes
Do you have a regular schedule of workforce planning activities for your MDA?. yes yes no yes yes no yes

31
Appendix 6 Design and Models for Workforce Planning in LSG
Current Practice Personnel budgeting represent the way the LSG currently plans for its workforce. This entails
making budgetary provisions for staffing needs for the current year and getting dispensation (approval) to fill such vacancies. Our discussion with the MDAs and other Commissions indicate that the system is not very effective in meeting their needs because in many cases, personnel budgets approved may not be adequate, leading to staffing deficits in many of the MDAs and thus inability to effectively and efficiently carry out their mandates. Ideally, a viable workforce plan should take its departure from the strategic intent or mandates of the MDAs, the skills and capabilities of staff required and the number before arriving at the personnel budget. From our interviews and discussions with key Government officials in the State, what is currently done is an establishment plan for offices that is more or less guess work and is hardly linked to any rigorous analysis of needs. In our view, it is important for the government to develop a strategic workforce planning process that will identify the people/human capital needs that are required to meet its mandates. We reviewed the typical ways by which workforce planning is done in focused organisation so as to effectively carry out workforce actions that meet the needs of such organisation. The three models below are adaptations from Strategic Staffing by Thomas P. Bechet (second edition) 2008. A typical workforce planning is a four -step process that involves:
v. Analysing the workforce to isolate strategic gap between current workforce and strategic goals in the immediate, short, medium and long terms.
vi. Developing workforce plan to bridge the gap. vii. Implementing the plan through effective workforce actions such as transfers,
secondments, deployments etc viii. Monitoring, evaluating implementation and revising the plan.
These processes require a great deal of skills in human resources management and planning.
In Lagos State Public Sector at the moment, the government has some strategic directions as contained in key documents such as the Strategic Management Framework; The Ten Point Agenda etc; however, it is not clear how much of these are shared and owned by the entire workforce and to what extent these plans inform the planning for the workforce in the State.
There are several key steps to the workforce analysis phase of the planning model:

32
Supply analysis, which identifies the competencies of the State Public Service, analyses the demographics of the staff and identifies trends such as turnover.
Demand analysis, which measures future activities and workloads. Gap analysis, which compares information from the supply analysis and demand
analysis to identify the gaps between the current Public Service competencies and those needed in the future workforce.
Solution analysis, which involves developing strategies for closing the competency gaps and reducing surplus competencies.
The trend analysis is an essential element of the supply analysis phase. The competency analysis provides baseline data on the existing Public Service and its present staff. Trend information can help predict the supply of skills that may be available in the future and project the future workforce supply needed. Using the example of turnover rates, it is clear to see from the questions below how an analysis of this data can be used to model or predict future workforce staffing needs.
Are there certain groups with increasing worker turnover? What are the factors affecting turnover? Can they be identified? Has turnover reduced the skill set of a certain group?
Defining the critical workforce issues in LSG Workforce issues for LSG could be impacted by such initiatives as the Megacity project, Service delivery standards and the Ten Points Agenda. Insights into these derive from our interview discussions with the Head of Service; The Director of MSRD and the interactions with key staffs in the MDAs covered in this study. It became clear that the staffing issues are informed by:
What categories are critical to the implementation of the mandates of the MDAs and
Central organisation?
Which job categories are expected to experience significant changes in required
capabilities?
Job categories in which staffing levels need to change significantly (for instance,
additions to support growth or reductions due to downsizing).
Which positions are expected to be hard to fill
Emerging skills sets arising from government priorities/projects
Which skills sets will be exposed to intense external competition?
These and other related matters are known as „workforce drivers.
Defining workforce gaps and surpluses
Workforce level relates to number of staff available or not to implement LSG plans and projects effectively. Too many staff is a surplus while too few staff is a deficit. Capabilities refer to the right number of staff with the individuals lacking in particular capabilities that will be needed for effective delivery of the State‟s business. Workforce mix relates to the case of both staffing level and capability. In the course of our work in LSG, we have not been able to establish the degree of workforce capabilities though we have indications in respect of the current number of workforce in the MDAs piloted. The workforce mix could not be established as well because of

33
the capability that was not done. Also it is difficult to determine the level of awareness of the Mandates of these MDAs by its current workforce. A workforce mix problem will mean that the numbers as well as the required capabilities are not adequate for delivery. It is important to understand these concepts and create a workforce model that allows for the definition of key requirements, forecast workforce availability and enable comparison of requirement and availability for the Service.
Structuring the workforce Model - The process In structuring the workforce model, it is important to know the required staffing levels(Demand); identify availability of staffing (Supply) and isolating the gaps between the supply and demand (net needs). It is the net needs that will inform the type of workforce actions to be taken. Workforce actions can be grouped into three broad categories:
Recruiting
Promotions, transfers and other internal movements
Losses
Model 1 – Simple quantitative approach This is a simple process applicable when there are no changes in available workforce between the current (now) staff availability and the point in the future (then) for which demand has been calculated. This approach looks like the figure 1 below:
Figure 1:
Current Supply
Future Demand
Gaps or Surpluses
Workforce/Staffing Actions

34
Limitations
The model is too static and does not allow for effective predictability. It rests on the assumption that the workforce is stable all the time. However, when workforce refers to all the movements into, around and out of the Service through retirements, turnover, promotions and redeployments; the traditional approach breaks down and will not be adequate to do any meaningful and reliable workforce planning for a dynamic and progressive environment like the LSG and in particular the MDAs piloted.
Model 2 – Workforce Analysis Another approach to workforce planning is to first define the gaps and surpluses (through workforce analysis) by knowing how many people the Service has now; that is current workforce level or establishment level by categories. This information is then used as the foundation for projecting the number and types of people that should be available at the point for which requirements have been defined. These call for assumptions with respect to losses, additions and movements that should occur between now and then in terms of supply and demand. The idea is to determine the future requirements for workforce in terms of capabilities and levels/numbers. It is important to State that a number of extraneous factors such as political decisions, geographical balancing etc could affect the proper definition of future requirements. The awareness of these issues and good knowledge of government mandates and Service delivery priorities will be important in defining future requirements adequately for the State.
Figure 2:

35
Supply Now
Gaps/or Surpluses
Demand Then
Workforce Actions
Supply Then
Account for losses Additions & movements
Net Needs
Revised workforce assumptions

36
Applying the Workforce Analysis for Workforce Planning. Key Steps for Model 2: Document workforce assumptions like the number of people that will retire from the service. This requires effective data for all categories of staff in the State. It also assumes the integrity of such data. Apply them to the current population to discover what staff will be available if certain actions take place. Thereafter observe the following:
Subtract from the current population the number of people you think will leave each
of the job category (e.g. through voluntary turnover, retirement and other planned
losses);
Add in the number that will be hired into each job
Take account of promotions and other movements (e.g. redeployment) by subtracting
the number of people from the job they are leaving and adding them to the job they
will be entering.
Next, compare supply at time of need to demand at the point of need and generate
the gaps and surpluses.
Finally, define the staffing actions needed to eliminate the gaps and surpluses The fact that it thrives on guesswork, it is not systematic enough to predict successful workforce planning.
Predictive Workforce Planning Model. Model 3 The sets of assumptions for this model are largely uncontrollable which make the workforce actions very likely as there is little or nothing the workforce planner can do to stop it. These uncontrollable assumptions are along the following lines:
Voluntary turnovers
Normal retirements
Seniority or tenure based promotions as is common in the Public Service
Returns or losses resulting from planned leaves of absence.
This model may apply more to the Public Service of the State given the fact that the
parameters listed above can be established from the baseline data available at Public
Service Office, The Civil Service Commission and the Ministry of Establishment, Training
and Pensions.
The model is shown below:

37
Figure3:
Key Steps for carrying out Predictive Workforce Planning Analyse the current supply of the various categories of the workforce (that is; Levels 1-6; 7-13 and 14-17) and relate it to what the Service can supply at the point of demand taking account of all uncontrollable workforce actions across the MDAs. Do a gap/surplus analysis and derive the net needs for the MDAs. Feed the net needs through controllable workforce actions that are feasible for implementation. These can be through hiring, promotions, transfers, planned reductions and the use of temporary or contract staff among other actions.
Imperatives for Implementing a Predictive Workforce Plan It is important to take into consideration the crucial role of all the HR establishments of the State in getting this done. In our view a professional HR establishment with capability to carry out workforce analysis among other functions will be a base requirement for implementation. There is also the need to have a good understanding of the business of the State (strategic focus) and the ability to define and quantify workforce requirements. For every workforce issue- Supply and or Demand- it is usually best to build a separate model for each issue so that the planning parameters can be varied accordingly. These parameters could be in terms of timeframe/planning horizon, the population and the real
Uncontrollable workforce actions
Supply Now
Gaps & Surpluses
Controllable workforce actions
Supply Then
Demand Then
Net Needs
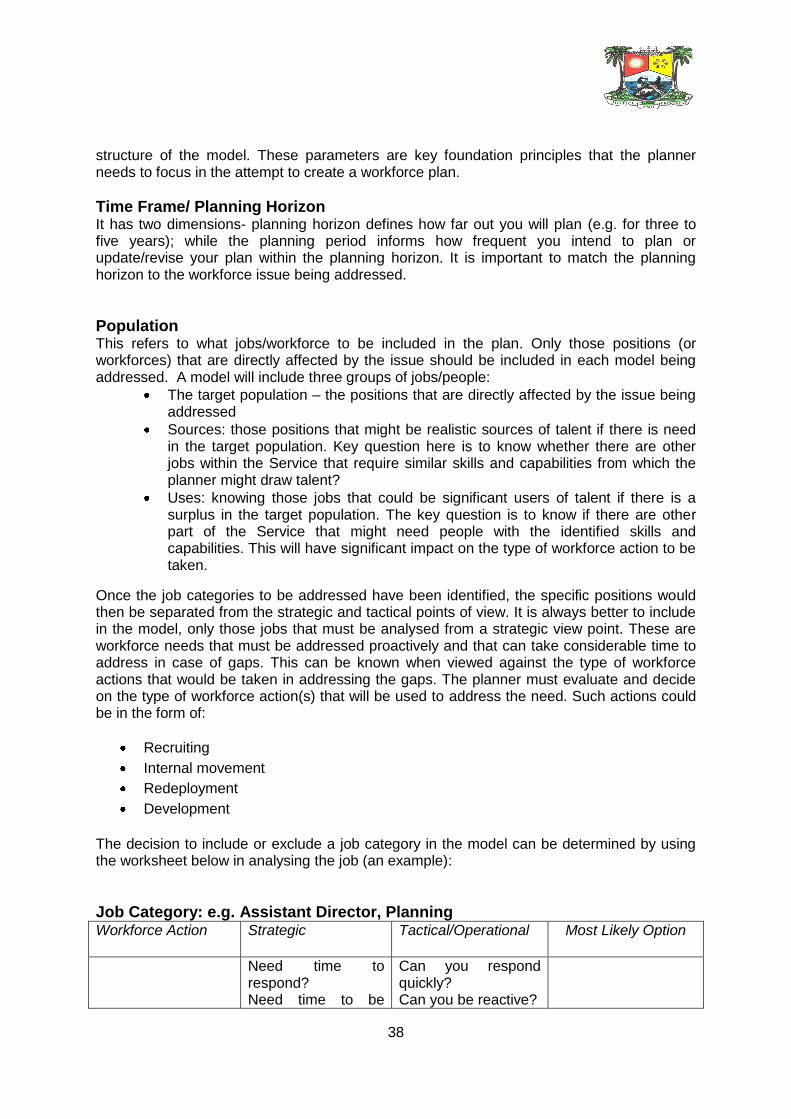
38
structure of the model. These parameters are key foundation principles that the planner needs to focus in the attempt to create a workforce plan.
Time Frame/ Planning Horizon It has two dimensions- planning horizon defines how far out you will plan (e.g. for three to five years); while the planning period informs how frequent you intend to plan or update/revise your plan within the planning horizon. It is important to match the planning horizon to the workforce issue being addressed.
Population This refers to what jobs/workforce to be included in the plan. Only those positions (or workforces) that are directly affected by the issue should be included in each model being addressed. A model will include three groups of jobs/people:
The target population – the positions that are directly affected by the issue being addressed
Sources: those positions that might be realistic sources of talent if there is need in the target population. Key question here is to know whether there are other jobs within the Service that require similar skills and capabilities from which the planner might draw talent?
Uses: knowing those jobs that could be significant users of talent if there is a surplus in the target population. The key question is to know if there are other part of the Service that might need people with the identified skills and capabilities. This will have significant impact on the type of workforce action to be taken.
Once the job categories to be addressed have been identified, the specific positions would then be separated from the strategic and tactical points of view. It is always better to include in the model, only those jobs that must be analysed from a strategic view point. These are workforce needs that must be addressed proactively and that can take considerable time to address in case of gaps. This can be known when viewed against the type of workforce actions that would be taken in addressing the gaps. The planner must evaluate and decide on the type of workforce action(s) that will be used to address the need. Such actions could be in the form of:
Recruiting
Internal movement
Redeployment
Development
The decision to include or exclude a job category in the model can be determined by using the worksheet below in analysing the job (an example):
Job Category: e.g. Assistant Director, Planning Workforce Action Strategic
Tactical/Operational Most Likely Option
Need time to respond? Need time to be
Can you respond quickly? Can you be reactive?

39
proactive? Recruiting o Strategic
o Tactical
Internal Movement o Strategic o Tactical
Redeployment o Strategic o Tactical
Development o Strategic o Tactical
Creating a Workforce Model Framework: In doing this, a two dimensional matrix could be used to keep track of and analyse workforce data. The columns of the matrix will capture big concepts like the Ministry, Departments and Agencies (MDAs) while the rows will be used to differentiate level of experience or accountability. This matrix will be used to structure each of the components of the model that is: required workforce (demand then); current staffing (supply now); losses (voluntary turnover for each category); hiring; transfers in and out and future availability (supply then).The comparison of the supply then and the demand then may give a picture of the gaps, surpluses or zero in each of the cells of the matrix and used in turn to determine the kind of workforce actions to be employed to develop a workforce plan. It is important to State that the matrix need not detail only current realities in terms of jobs and positions in the State Service, it can also identify future needed skills and capabilities and matrixes created for them in the planning framework.
Some Examples of Workforce model framework
a. Supply Now Role MDA1
(Current skills) MDA2 (Current Skills)
MDA1 (Future skills)
MDA2 (Future skills)
Director Number Number Number Number Asst Director Number Number Number Number Entry Level Number Number Number Number
b. Demand Then
Role MDA1 (Current skills)
MDA2 (Current Skills)
MDA1 (Future skills)
MDA2 (Future skills)
Director Number Number Number Number Asst Director Number Number Number Number Entry Level Number Number Number Number The two-dimensional format in the example above can be used to tack three variables as shown below.
Define Workforce requirements

40
The next steps after defining the sets of parameters, is to go on and define workforce requirements. There is the need to define the capabilities and the levels that will be needed in each job category (or the cell of the model/matrix) for the successful implementation of the Service Plan. Workforce levels cannot be defined unless roles and capabilities are known first. In the case of LSG, this calls for the understanding of the roles (mandates of the MDAs) and the „audit‟ of the people performing at the various functional areas. It is important to focus on identified capabilities that are deemed important to performance on the roles. On this note, the planner should be aware of those are especially critical to the role; those that differentiate one job, category or level from another (that is one role of the model from another) and those that are changing due to emerging capabilities that need to be developed quickly possibly in view of the ambition of the State, its current commitments and service delivery priorities. To accomplish this effectively and efficiently, the State Public Service will need to develop a robust skills data base to profile the skills of its workforce from time to time. After this there the staffing levels (number) should be defined, which could be informed by the following staffing ratios; staffing profiles and other forms of statistical techniques. For example in defining the staffing level for the MDAs, the following techniques may apply:
Certain number of Director per MDA might be constant
Number of Director based on staffing profile for the MDA ( may be four Directors to a
large MDA as opposed to two Directors for a small MDA)
The number of Director may be defined by using staffing ratios (e.g. relating the
number of Directorates to the number of service delivery points to the public)
The end result is to be able to come up with the critical capabilities and the required staffing levels for each cell of the matrix developed.
Forecasting Workforce Availability
Once the demand has been forecast the next thing to do is to forecast anticipated supply of workforce. The steps to take are as follow:
Define the number and types of workforce that are currently available in each job category (each cell of the matrix above)
Document overall existing capabilities in each cell or category. (In order to produce this „supply now‟ efficiently, the State may need to rely on a robust human resource information system (HRIS))
Forecast the number of workforce that will be available in the future for which demand had been calculated.
Make assumptions on the workforce actions for current people that will occur between the current time (now) and that point in the future for which demand had been calculated (then). Only those workforce actions that are uncontrollable should be considered. This means those workforce actions that are likely to occur whether the Service creates and implements workforce strategies and plans or not.
Then calculate the number of staff that will be available in each job category if the assumptions on uncontrollable actions actually occur thus: Subtract anticipated turnover, retirements, transfers out and other planned losses; Add anticipated hires and transfers in; Adjust for pre-planned promotions and movement (subtract from the source jobs and add to target jobs); Adjust for additions and losses resulting from planned leaves of absence.
Document changes in capabilities that may result from a major development initiative from the Service.

41
Gaining the understanding of workforce gaps and surpluses. In the model earlier described, workforce requirements (demand) can be compared to workforce availability (supply) and gaps (when demand exceeds supply) and Surplus (when supply exceeds demand). Workforce gaps are negative numbers while workforce surpluses are positive numbers. The illustrations of these scenarios are depicted in the following tables:
Demand Then
MDA 1 MDA 2
Director 10 12 Asst Director 25 40 Supply Then
MDA 1 MDA 2
Director 11 10 Asst Director 23 43
Expected Workforce Gaps/Surpluses
MDA 1 MDA 2
Director 11- 10 = +1 10-12 = -2 Asst Director 23- 25 = - 2 43- 40 = +3
The above could initiate workforce actions depending on the planning horizon being addressed.
Develop Workforce Strategies This is another key step in the entire modelling process. Workforce strategies are longer term and directional plans of action that will State what the Service is going to do to address workforce needs across all the planning periods throughout the planning horizon. Staffing strategies may include:
Meeting needs of certain category of workforce through percentage contributions of promotion within and external recruitment.
Focussing recruitment and development on core positions that generate significant service delivery impacts to the public
Meeting short-term needs for certain technical skills by using contractors
Redeploying individuals who are surplus in one area to a different area and also provide accelerated development as required.
Reorganising work to utilise the available talent
Initiating intern programmes as NYSC or graduate trainees to develop qualified workforce to meet long term future needs.
The effectiveness of any workforce strategy should be aligned with the demands across the planning periods.
Define workforce plans/implementation As a final analysis in the modelling process, the workforce plans should be developed. This is a set of well documented workforce plans that set out all the actions that must be implemented in each planning period if supply is to equal demand for all periods. The

42
workforce plans must detail all actions to be implemented to eliminate workforce gaps and surpluses for a given planning period. When all these are in place, then the workforce plan should be able to drive the necessary changes in the Service and bring about a steady supply of workforce needs for the State.
Differentiating Assumption based Workforce Analysis Model (2) from Predictive based Workforce Planning Model (3) Model 2 is iterative in nature (The Public Sector works are to a large extent routine and predictable): the planner makes assumptions regarding the workforce actions that are needed and test those assumptions to see if in fact the gaps and surpluses are eliminated. If they are, then the planner has arrived at a good solution. In cases where the differences still exist (most likely scenario), then the workforce action assumptions would have to be revisited and then the gaps and surpluses recalculated. This may lead to repeating the processes until an acceptable solution is reached. Thus the workforce assumptions made at the onset could be regarded as mere guesses. So the planner guesses at a solution, try it, and if found not correct, he guesses again. For example, the planner may not know the real number of people that will be promoted from one job to another. So he guesses (assumptions) at a number to check if it was right. If not, the promotion assumption is revised (guess again) until supply equals demand. This may take a while and prone to changes that may not be accurately predicted and so may be very inefficient in initiating viable workforce actions to implement government programmes. However, with a little change to Model 2, the guesswork can be largely eliminated. The difference is in the nature of assumptions that are made. With Model 3, assumptions are made only about workforce actions that the planner can‟t control. These are workforce actions that are likely, even if the planner does nothing. The actions that will happen no matter what the planner does, These uncontrollable actions may include, normal retirements, voluntary turnover, tenure based promotions, political impositions etc. These are the factors that the planner will consider in creating his supply at the point of need matrix. No assumption is made at this point with respect to other workforce actions for example recruitments The planner then compares the supply then to the demand then and takes (controllable) appropriate workforce actions to eliminate the gaps or surpluses. The controllable actions are those workforce actions that happen because the planner makes them happen. Examples are hiring, promotions, transfers and deployments etc. Each of these actions can be deployed in an intentional way to meet a particular need that has been identified. Thus Model 3 completely eliminates the guesswork because it is largely informed by data which was not the case with the assumption based workforce analysis of Model 2. For example, instead of the planner guessing how many promotions to a particular job will be needed, he will first determine how many openings will be created as a result of uncontrollable actions (eg voluntary retirements) and then decide how many of those openings should be filled through promotions, hiring, transfers etc across all levels(1-6; 7-13,14-17). The planner also may not need to estimate the number of new hires first, but figures out how many new openings should be filled with new hires. Model 3 frowns at guessing, testing and guessing again for an acceptable solution. Instead, the solution is derived in a single change.

43
The efficiency of Model 3 over model 2 is that guesswork can be eliminated by considering first the uncontrollable workforce actions and then determining the mix of controllable workforce actions to eliminate the gaps and surpluses. With respect to the Public Sector in LSG, the uncontrollable workforce actions are predictable from data kept on the workforce over the years and thus this model should appeal for ease of implementation .We are of the view that given the level of computerisation of Lagos State Public Service, effective or professionalised HR establishment, appropriate capacity building for all HR practitioners in the State Public Service and effective power to act given to the planner, the application of the predictive workforce model for workforce planning Lagos State Public Service is clearly recommended.

www.lasg.gov.org