laymen saints - the dharmafarers
TRANSCRIPT
R30B27
Coppin State University University System of Maryland
Note: Numbers may not sum to total due to rounding.
For further information contact: Sara J. Baker Phone: (410) 946-5530
Analysis of the FY 2016 Maryland Executive Budget, 2015 1
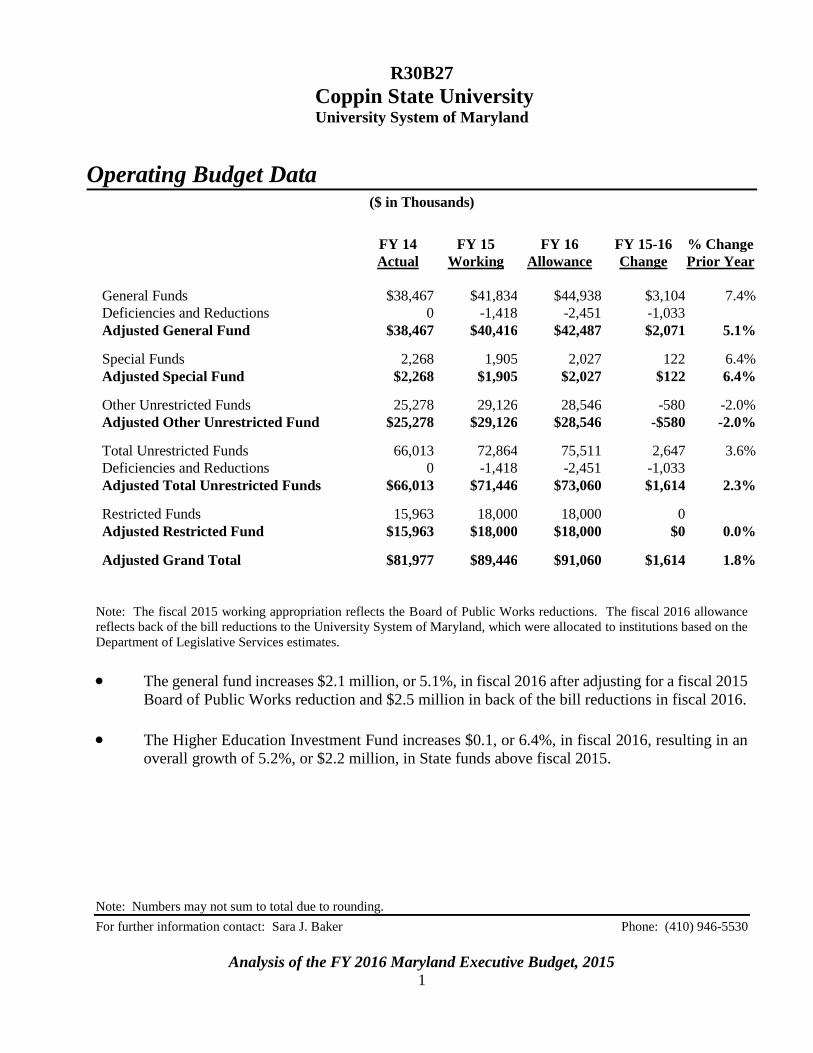
Operating Budget Data
($ in Thousands)
FY 14 FY 15 FY 16 FY 15-16 % Change
Actual Working Allowance Change Prior Year
General Funds $38,467 $41,834 $44,938 $3,104 7.4%
Deficiencies and Reductions 0 -1,418 -2,451 -1,033
Adjusted General Fund $38,467 $40,416 $42,487 $2,071 5.1% Special Funds 2,268 1,905 2,027 122 6.4%
Adjusted Special Fund $2,268 $1,905 $2,027 $122 6.4% Other Unrestricted Funds 25,278 29,126 28,546 -580 -2.0%
Adjusted Other Unrestricted Fund $25,278 $29,126 $28,546 -$580 -2.0% Total Unrestricted Funds 66,013 72,864 75,511 2,647 3.6%
Deficiencies and Reductions 0 -1,418 -2,451 -1,033
Adjusted Total Unrestricted Funds $66,013 $71,446 $73,060 $1,614 2.3% Restricted Funds 15,963 18,000 18,000 0
Adjusted Restricted Fund $15,963 $18,000 $18,000 $0 0.0% Adjusted Grand Total $81,977 $89,446 $91,060 $1,614 1.8%
Note: The fiscal 2015 working appropriation reflects the Board of Public Works reductions. The fiscal 2016 allowance
reflects back of the bill reductions to the University System of Maryland, which were allocated to institutions based on the
Department of Legislative Services estimates.
The general fund increases $2.1 million, or 5.1%, in fiscal 2016 after adjusting for a fiscal 2015
Board of Public Works reduction and $2.5 million in back of the bill reductions in fiscal 2016.
The Higher Education Investment Fund increases $0.1, or 6.4%, in fiscal 2016, resulting in an
overall growth of 5.2%, or $2.2 million, in State funds above fiscal 2015.

R30B27 – USM – Coppin State University
Analysis of the FY 2016 Maryland Executive Budget, 2015 2
Personnel Data
FY 14 FY 15 FY 16 FY 15-16
Actual Working Allowance Change
Regular Positions
458.50
456.50
456.50
0.00
Contractual FTEs
164.33
159.97
159.97
0.00
Total Personnel
622.83
616.47
616.47
0.00
Vacancy Data: Regular Positions
Turnover and Necessary Vacancies, Excluding New
Positions
13.92
3.05%
Positions and Percentage Vacant as of 12/31/14
42.00
9.2%
The allowance does not provide for any new positions.
R30B27 – USM – Coppin State University
Analysis of the FY 2016 Maryland Executive Budget, 2015 3
Analysis in Brief
Major Trends
Enrollment: Undergraduate enrollment declined 8.1% in fall 2014 with continuing students falling
6.2%. Since fall 2012, enrollment declined 14.2% with first-time (full- and part-time) students
dropping 40.5%.
Student Performance: The 2011 cohort second-year retention rate of 65.4% was the highest rate since
the 2002 cohort. However, the 2012 cohort second-year retention rate fell to 61.4%. Overall, transfer
students graduate at a higher rate than the first-time, full-time (FT/FT) students with the two-year
graduation rate for transfers increasing from 2.6% with the 2005 cohort to a high of 17.5% with the
2011 cohort. The six-year graduation rate for FT/FT fell to 16.0% with the 2007 cohort, the lowest rate
since the 1991 cohort.
Degree Production Efficiency: In fiscal 2012, the number of undergraduate degrees per 100 full-time
equivalent students jumped to 16.1 due to falling enrollment coupled with an increase in degrees.
Coppin State University’s (CSU) ratio surpassed the average of its peers but declined the following
year. After declining for two years, education and related expenditures per degree increased to
$147,878 in fiscal 2011.
Issues
Meeting College Expenses: While total expenditures on institutional aid increase $0.4 million in
fiscal 2015, the amount spent on need-based aid decreases 19.9% and scholarships, or merit-based aid,
increases 64.2%. In fiscal 2014, 95.8% of those receiving need-based institutional aid were
Pell-eligible students who received an average award of $1,044.
The Future of CSU: While CSU has received significant State funding in both the operating and
capital budgets and offers some successful academic programs, it continues to struggle with poor
student performance and declining enrollment. With a change in leadership, the University System of
Maryland Board of Regents decided it was an appropriate time to take actions to address the various
issues affecting CSU’s overall performance.
Recommended Actions
1. Add language to restrict general funds for need-based financial aid
R30B27 – USM – Coppin State University
Analysis of the FY 2016 Maryland Executive Budget, 2015 4
R30B27
Coppin State University University System of Maryland
Analysis of the FY 2016 Maryland Executive Budget, 2015 5
Operating Budget Analysis
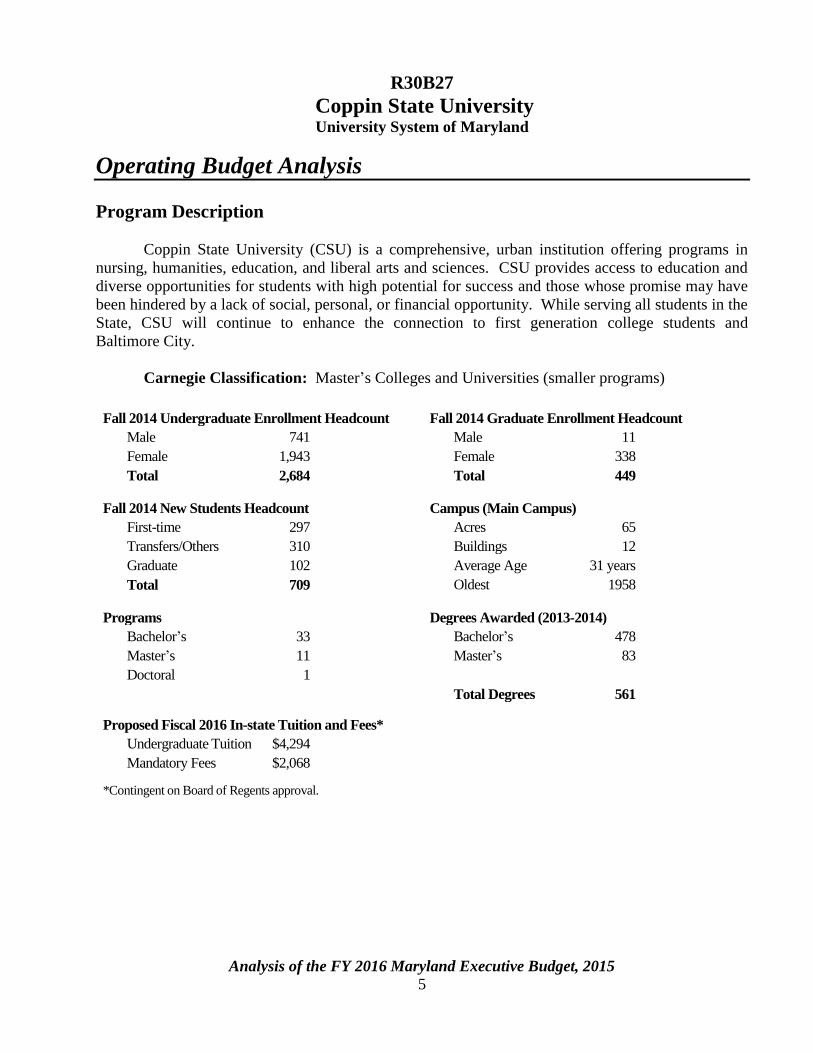
Program Description
Coppin State University (CSU) is a comprehensive, urban institution offering programs in
nursing, humanities, education, and liberal arts and sciences. CSU provides access to education and
diverse opportunities for students with high potential for success and those whose promise may have
been hindered by a lack of social, personal, or financial opportunity. While serving all students in the
State, CSU will continue to enhance the connection to first generation college students and
Baltimore City.
Carnegie Classification: Master’s Colleges and Universities (smaller programs)
Fall 2014 Undergraduate Enrollment Headcount Fall 2014 Graduate Enrollment Headcount
Male 741 Male 11
Female 1,943 Female 338
Total 2,684 Total 449
Fall 2014 New Students Headcount Campus (Main Campus)
First-time 297 Acres 65
Transfers/Others 310 Buildings 12
Graduate 102 Average Age 31 years
Total 709 Oldest 1958
Programs Degrees Awarded (2013-2014)
Bachelor’s 33 Bachelor’s 478
Master’s 11 Master’s 83
Doctoral 1
Total Degrees 561
Proposed Fiscal 2016 In-state Tuition and Fees*
Undergraduate Tuition $4,294
Mandatory Fees $2,068
*Contingent on Board of Regents approval.
R30B27 – USM – Coppin State University
Analysis of the FY 2016 Maryland Executive Budget, 2015 6
Performance Analysis
1. Enrollment
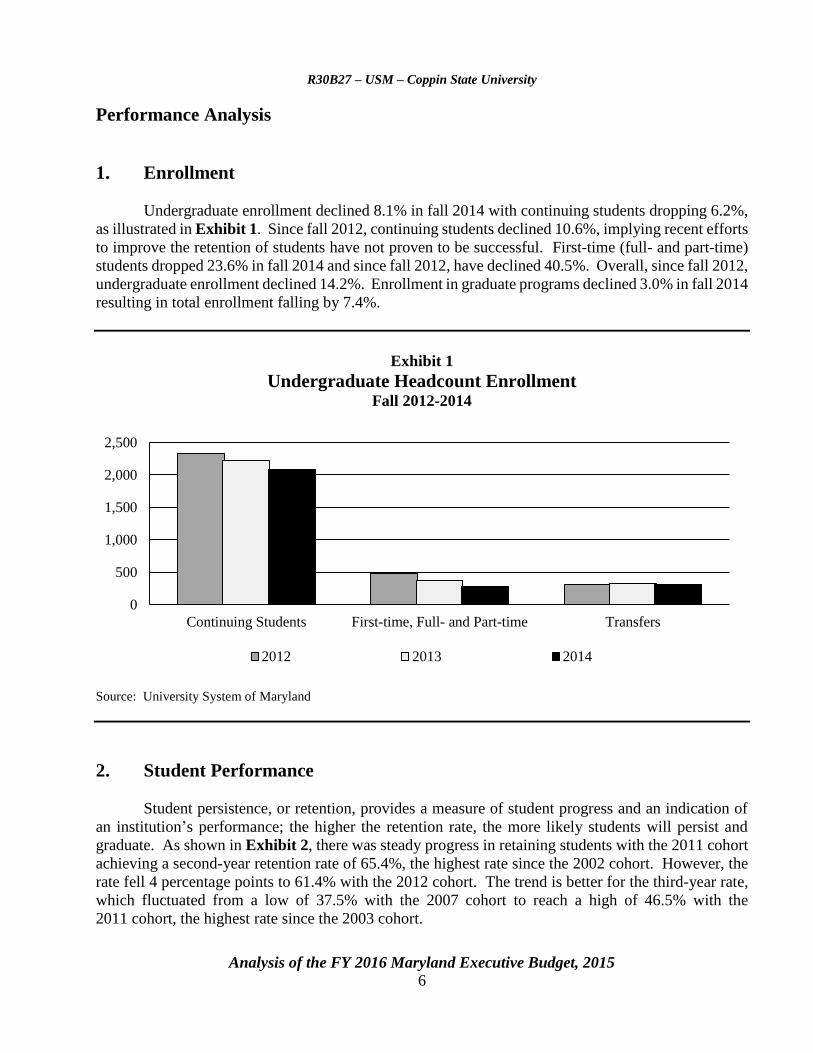
Undergraduate enrollment declined 8.1% in fall 2014 with continuing students dropping 6.2%,
as illustrated in Exhibit 1. Since fall 2012, continuing students declined 10.6%, implying recent efforts
to improve the retention of students have not proven to be successful. First-time (full- and part-time)
students dropped 23.6% in fall 2014 and since fall 2012, have declined 40.5%. Overall, since fall 2012,
undergraduate enrollment declined 14.2%. Enrollment in graduate programs declined 3.0% in fall 2014
resulting in total enrollment falling by 7.4%.
Exhibit 1
Undergraduate Headcount Enrollment Fall 2012-2014
Source: University System of Maryland
2. Student Performance
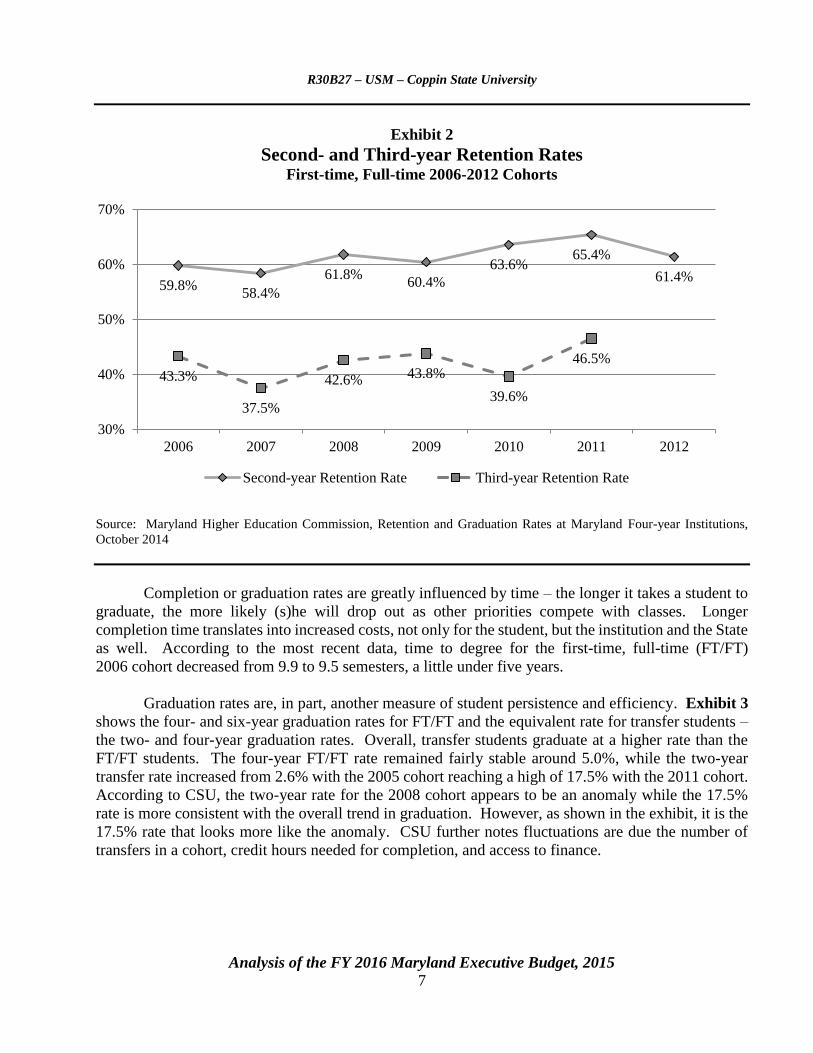
Student persistence, or retention, provides a measure of student progress and an indication of
an institution’s performance; the higher the retention rate, the more likely students will persist and
graduate. As shown in Exhibit 2, there was steady progress in retaining students with the 2011 cohort
achieving a second-year retention rate of 65.4%, the highest rate since the 2002 cohort. However, the
rate fell 4 percentage points to 61.4% with the 2012 cohort. The trend is better for the third-year rate,
which fluctuated from a low of 37.5% with the 2007 cohort to reach a high of 46.5% with the
2011 cohort, the highest rate since the 2003 cohort.
0
500
1,000
1,500
2,000
2,500
Continuing Students First-time, Full- and Part-time Transfers
2012 2013 2014
R30B27 – USM – Coppin State University
Analysis of the FY 2016 Maryland Executive Budget, 2015 7
Exhibit 2
Second- and Third-year Retention Rates First-time, Full-time 2006-2012 Cohorts
Source: Maryland Higher Education Commission, Retention and Graduation Rates at Maryland Four-year Institutions,
October 2014
Completion or graduation rates are greatly influenced by time – the longer it takes a student to
graduate, the more likely (s)he will drop out as other priorities compete with classes. Longer
completion time translates into increased costs, not only for the student, but the institution and the State
as well. According to the most recent data, time to degree for the first-time, full-time (FT/FT)
2006 cohort decreased from 9.9 to 9.5 semesters, a little under five years.
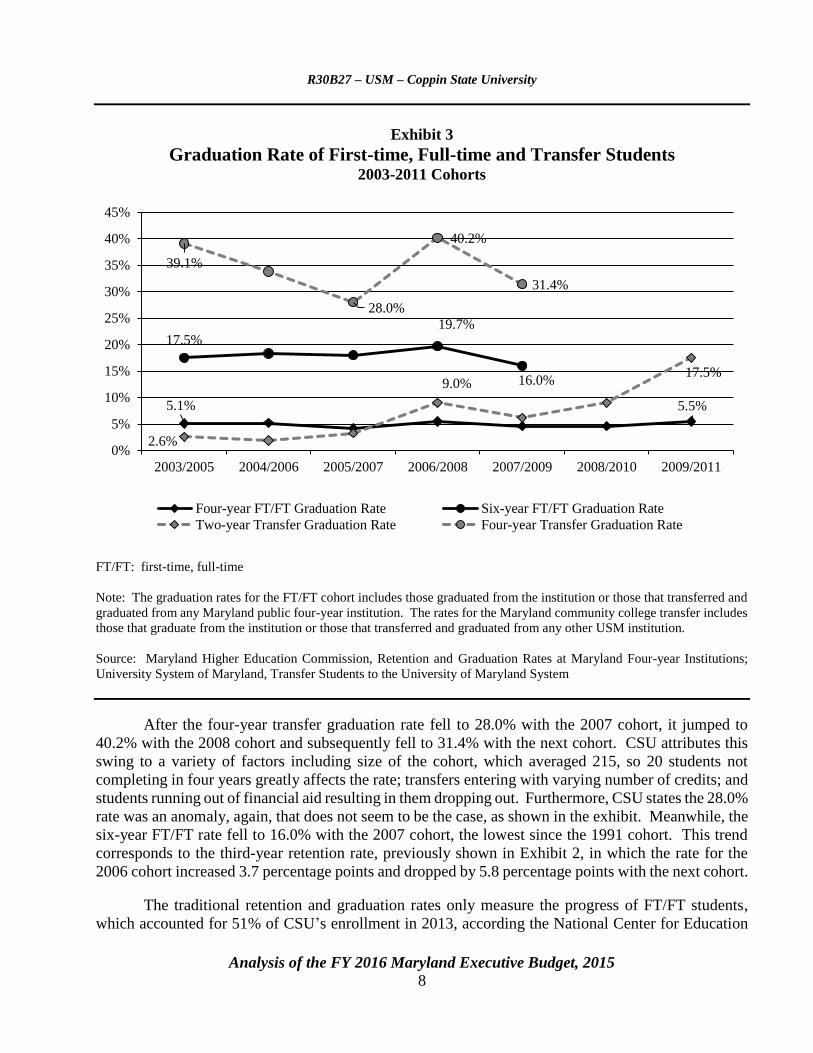
Graduation rates are, in part, another measure of student persistence and efficiency. Exhibit 3
shows the four- and six-year graduation rates for FT/FT and the equivalent rate for transfer students –
the two- and four-year graduation rates. Overall, transfer students graduate at a higher rate than the
FT/FT students. The four-year FT/FT rate remained fairly stable around 5.0%, while the two-year
transfer rate increased from 2.6% with the 2005 cohort reaching a high of 17.5% with the 2011 cohort.
According to CSU, the two-year rate for the 2008 cohort appears to be an anomaly while the 17.5%
rate is more consistent with the overall trend in graduation. However, as shown in the exhibit, it is the
17.5% rate that looks more like the anomaly. CSU further notes fluctuations are due the number of
transfers in a cohort, credit hours needed for completion, and access to finance.
59.8%58.4%
61.8%60.4%
63.6%65.4%
61.4%
43.3%
37.5%
42.6% 43.8%
39.6%
46.5%
30%
40%
50%
60%
70%
2006 2007 2008 2009 2010 2011 2012
Second-year Retention Rate Third-year Retention Rate
R30B27 – USM – Coppin State University
Analysis of the FY 2016 Maryland Executive Budget, 2015 8
Exhibit 3
Graduation Rate of First-time, Full-time and Transfer Students 2003-2011 Cohorts
FT/FT: first-time, full-time
Note: The graduation rates for the FT/FT cohort includes those graduated from the institution or those that transferred and
graduated from any Maryland public four-year institution. The rates for the Maryland community college transfer includes
those that graduate from the institution or those that transferred and graduated from any other USM institution.
Source: Maryland Higher Education Commission, Retention and Graduation Rates at Maryland Four-year Institutions;
University System of Maryland, Transfer Students to the University of Maryland System
After the four-year transfer graduation rate fell to 28.0% with the 2007 cohort, it jumped to
40.2% with the 2008 cohort and subsequently fell to 31.4% with the next cohort. CSU attributes this
swing to a variety of factors including size of the cohort, which averaged 215, so 20 students not
completing in four years greatly affects the rate; transfers entering with varying number of credits; and
students running out of financial aid resulting in them dropping out. Furthermore, CSU states the 28.0%
rate was an anomaly, again, that does not seem to be the case, as shown in the exhibit. Meanwhile, the
six-year FT/FT rate fell to 16.0% with the 2007 cohort, the lowest since the 1991 cohort. This trend
corresponds to the third-year retention rate, previously shown in Exhibit 2, in which the rate for the
2006 cohort increased 3.7 percentage points and dropped by 5.8 percentage points with the next cohort.
The traditional retention and graduation rates only measure the progress of FT/FT students,
which accounted for 51% of CSU’s enrollment in 2013, according the National Center for Education
5.1% 5.5%
17.5%19.7%
16.0%
2.6%
9.0%17.5%
39.1%
28.0%
40.2%
31.4%
0%
5%
10%
15%
20%
25%
30%
35%
40%
45%
2003/2005 2004/2006 2005/2007 2006/2008 2007/2009 2008/2010 2009/2011
Four-year FT/FT Graduation Rate Six-year FT/FT Graduation Rate
Two-year Transfer Graduation Rate Four-year Transfer Graduation Rate
R30B27 – USM – Coppin State University
Analysis of the FY 2016 Maryland Executive Budget, 2015 9
Statistics’ College Navigator. Additionally, these measures do not capture the outcomes of those
students who fall outside the traditional metrics, i.e., students whose enrollment status changes from
full- to part-time and back again (known as mixed enrollment) or transfers to multiple institutions. At
CSU, 26% of the 2007 FT/FT cohort transferred to another institution within six years of enrolling at
the institution, according to College Navigator. In order to provide a more comprehensive picture of
student progress to a degree, higher education organizations developed two voluntary reporting models
– Voluntary Student Assessment (VSA) and Student Achievement Measures (SAM). These are
interrelated reporting systems in which institutions can sync its data from VSA to SAM. According to
CSU, due to staffing limitations in institutional research, they only submit data to VSA; however, the
only information on VSA’s website for CSU is admission’s contact information. CSU reports it will
submit data to SAM during the next reporting cycle. It should be noted that CSU is the only University
System of Maryland (USM) institution that does not submit data to SAM. Given that CSU students
are largely nontraditional, data on these students would provide more insight on their progression and,
therefore, help CSU target or focus resources on those students in which it will have the greatest impact
in helping students earn a degree. The President should comment if CSU currently tracks the
progress of all students, and if so, provide data on the progress of its students and how data is
used to focus its efforts to improve student performance.
3. Degree Production Efficiency
How well an institution meets its mission is ultimately measured by the number of
undergraduate degrees awarded. Trends in the number of undergraduate degrees awarded per
100 undergraduate full-time equivalent students (FTES) shows if an institution is being more or less
productive in graduating students. Ideal performance on this indicator would be 25 completions per
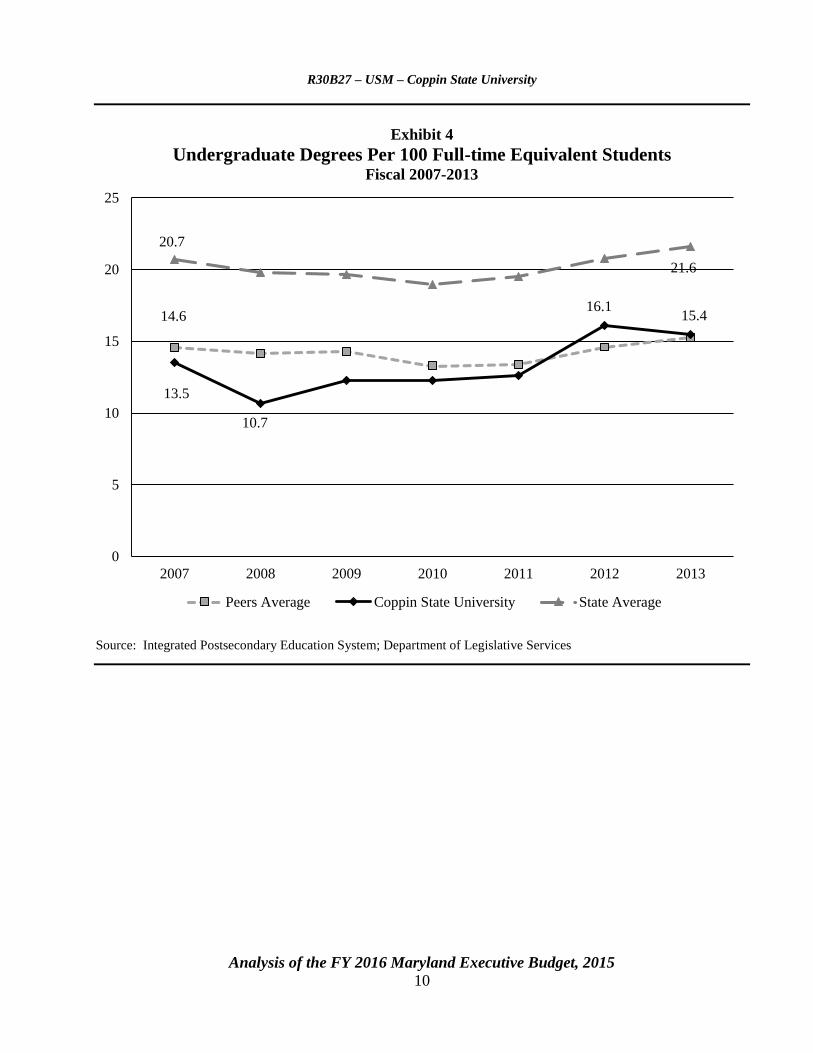
100 FTES since, in general, one-quarter of all students enrolled would graduate each year. Exhibit 4
compares CSU’s ratio to the average of its peers and the State’s public four-year institutions. Peer
institutions are those used to benchmark CSU’s performance in USM Dashboard Indicators. CSU’s
ratio remained fairly stable from fiscal 2009 to 2011 but fell below the average of its peers and the
State. In fiscal 2012, the ratio spiked to 16.1 degrees, which can be attributed to falling enrollment
coupled with an increase in degrees. The ratio fell to 15.4 degrees in fiscal 2013, equaling that of its
peers. The ratio remains well below the State average.
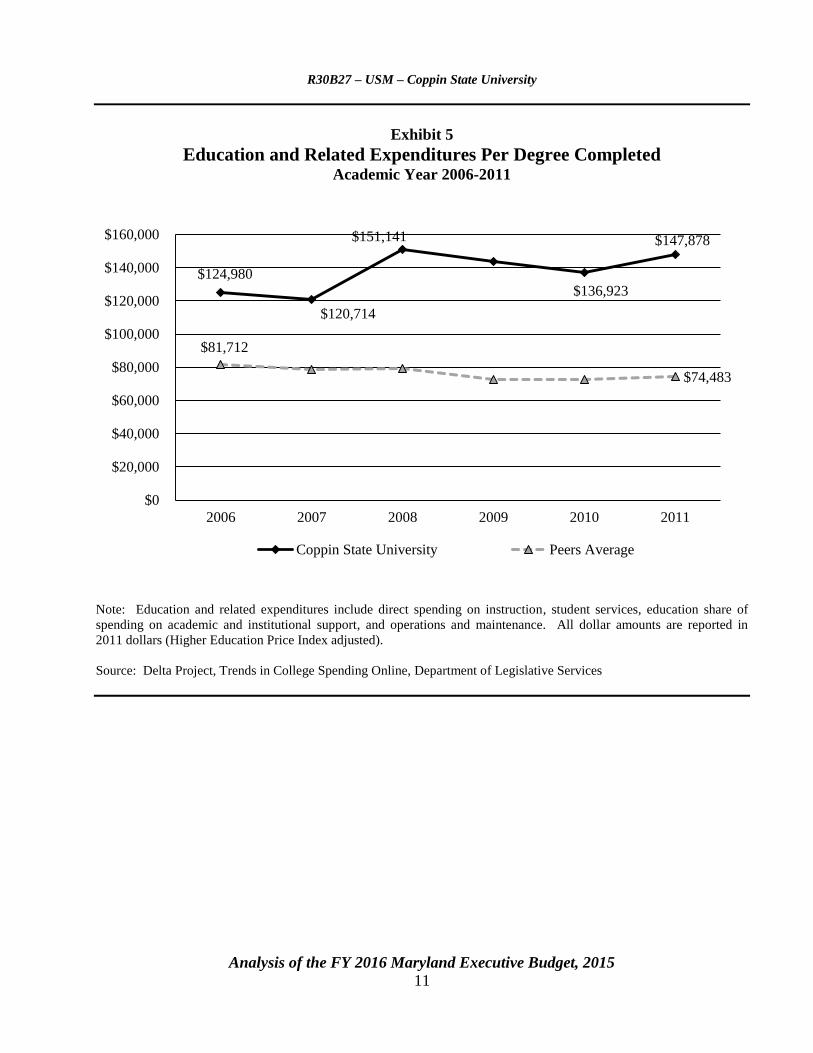
Education and related expenditures per degree measures the cost of producing a degree,
showing if an institution is becoming more or less productive over time in using its resources to produce
degrees. Therefore, the lower the expenditures, the more efficient an institution is in producing degrees.
On average, expenditures per degree at CSU exceeded that of its peers by $61,020, as shown in
Exhibit 5. After dropping to a low of $120,714 in fiscal 2007, expenditures per degree jumped to
$151,141 in fiscal 2008. While expenditures per degree declined over the next two fiscal years, it rose
to $147,878 in fiscal 2011. Meanwhile the expenditures per degree of its peers declined by $7,229 over
the five-year time period. In other words, it takes twice as much to produce a degree at CSU than at its
peer institutions.
R30B27 – USM – Coppin State University
Analysis of the FY 2016 Maryland Executive Budget, 2015 10
Exhibit 4
Undergraduate Degrees Per 100 Full-time Equivalent Students Fiscal 2007-2013
Source: Integrated Postsecondary Education System; Department of Legislative Services
14.6
13.5
10.7
16.115.4
20.7
21.6
0
5
10
15
20
25
2007 2008 2009 2010 2011 2012 2013
Peers Average Coppin State University State Average
R30B27 – USM – Coppin State University
Analysis of the FY 2016 Maryland Executive Budget, 2015 11
Exhibit 5
Education and Related Expenditures Per Degree Completed Academic Year 2006-2011
Note: Education and related expenditures include direct spending on instruction, student services, education share of
spending on academic and institutional support, and operations and maintenance. All dollar amounts are reported in
2011 dollars (Higher Education Price Index adjusted).
Source: Delta Project, Trends in College Spending Online, Department of Legislative Services
$124,980
$120,714
$151,141
$136,923
$147,878
$81,712
$74,483
$0
$20,000
$40,000
$60,000
$80,000
$100,000
$120,000
$140,000
$160,000
2006 2007 2008 2009 2010 2011
Coppin State University Peers Average
R30B27 – USM – Coppin State University
Analysis of the FY 2016 Maryland Executive Budget, 2015 12
Fiscal 2015 Actions
Cost Containment
The Board of Public Works (BPW) approved two rounds of cost containment measures
resulting in a total reduction of $1.6 million to CSU’s State appropriation. The first measure approved
in July 2014 reduced CSU’s State appropriation by $0.2 million, which included the elimination of
1 position and $78,346 in the associated salary and wages and $0.1 million in operating expenses.
The second cost containment measure, approved by BPW in January 2015, resulted in a
$1.4 million reduction of CSU’s State appropriation. CSU plans to meet this reduction through a
combination of reducing expenditures and using fund balance. Operating expenditures will be reduced
by $1.1 million: $0.7 million from the general operating budget through a reduction in expenses and a
spending freeze; $0.3 million from facilities renewal; and $0.1 million from elimination of 1 position
and 1 layoff. In addition, $0.3 million will be transferred from the fund balance to cover operating
expenses. After the transfer, CSU’s balance in the State-supported portion of the fund balance will
total -$17.2 million at the end of fiscal 2015, but the non-State-supported portion will total $19.1 million
after a planned transfer of $0.7 million. According to USM, institutions with negative balances in the
State-supported portion of their fund balance are to have plans to restore the necessary balance to the
State-supported portion of their fund balance.
Proposed Budget
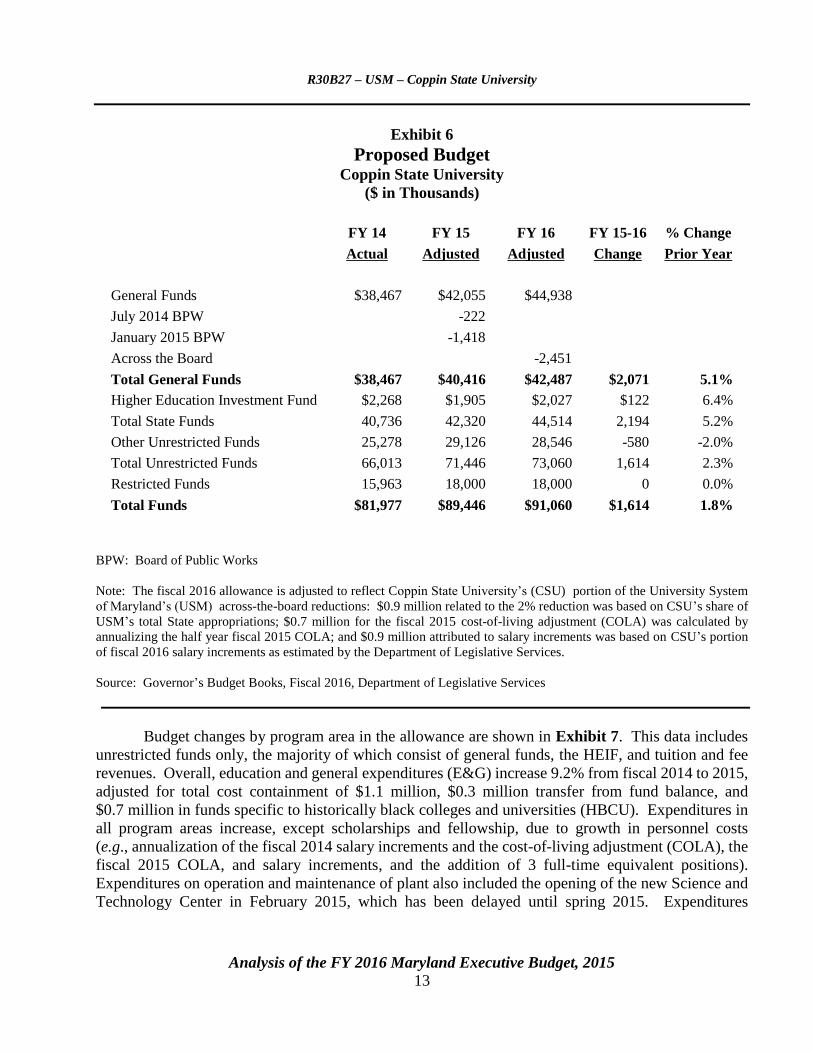
As shown in Exhibit 6, the general fund allowance for fiscal 2016 is 5.1%, or $2.1 million,
higher than fiscal 2015 after including the fiscal 2015 cost containment actions and adjusting for
across-the-board reductions in the fiscal 2016 allowance. This includes a general 2% reduction, the
elimination of employee increments, and a 2% pay reduction. The Department of Legislative Services
(DLS) estimates CSU’s share of these reductions to be $2.5 million. The Higher Education Investment
Fund (HEIF) increases 6.4%, or $0.1 million, over fiscal 2015, resulting in an overall growth in State
funds of 5.2%, or $2.2 million, to $44.5 million. Other unrestricted funds decline 2.0%, or $0.6 million,
due to auxiliary and tuition and fee revenues decreasing $0.5 million and $0.1 million, respectively,
because of a projected enrollment decline.
The allowance also provides $3.1 million in current unrestricted funds for expenses related to:
opening of the New Science and Technology Center ($2.2 million); fuel and utilities ($0.4 million);
facilities renewal ($0.3 million); financial aid ($0.2 million); debt service ($45,351); and costs related
to implementing the sexual misconduct policy ($15,000).
R30B27 – USM – Coppin State University
Analysis of the FY 2016 Maryland Executive Budget, 2015 13
Exhibit 6
Proposed Budget Coppin State University
($ in Thousands)
FY 14 FY 15 FY 16 FY 15-16 % Change
Actual Adjusted Adjusted Change Prior Year
General Funds $38,467 $42,055 $44,938
July 2014 BPW -222
January 2015 BPW -1,418
Across the Board -2,451
Total General Funds $38,467 $40,416 $42,487 $2,071 5.1%
Higher Education Investment Fund $2,268 $1,905 $2,027 $122 6.4%
Total State Funds 40,736 42,320 44,514 2,194 5.2%
Other Unrestricted Funds 25,278 29,126 28,546 -580 -2.0%
Total Unrestricted Funds 66,013 71,446 73,060 1,614 2.3%
Restricted Funds 15,963 18,000 18,000 0 0.0%
Total Funds $81,977 $89,446 $91,060 $1,614 1.8%
BPW: Board of Public Works
Note: The fiscal 2016 allowance is adjusted to reflect Coppin State University’s (CSU) portion of the University System
of Maryland’s (USM) across-the-board reductions: $0.9 million related to the 2% reduction was based on CSU’s share of
USM’s total State appropriations; $0.7 million for the fiscal 2015 cost-of-living adjustment (COLA) was calculated by
annualizing the half year fiscal 2015 COLA; and $0.9 million attributed to salary increments was based on CSU’s portion
of fiscal 2016 salary increments as estimated by the Department of Legislative Services.
Source: Governor’s Budget Books, Fiscal 2016, Department of Legislative Services
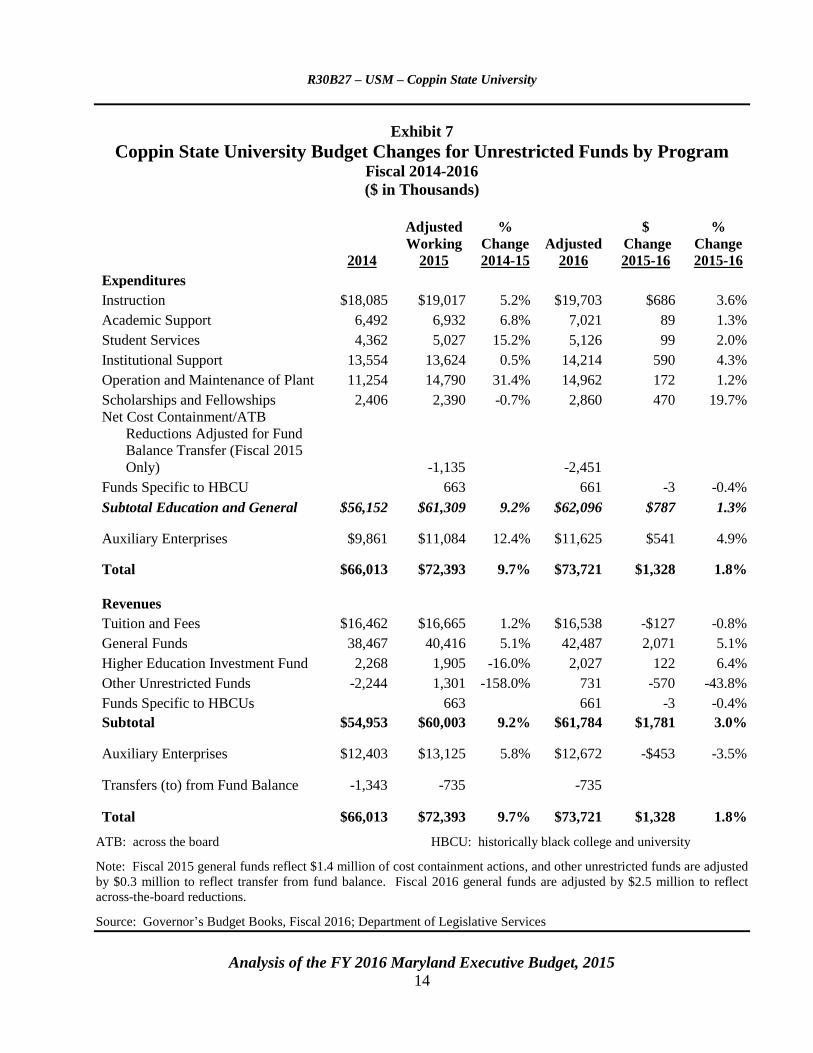
Budget changes by program area in the allowance are shown in Exhibit 7. This data includes
unrestricted funds only, the majority of which consist of general funds, the HEIF, and tuition and fee
revenues. Overall, education and general expenditures (E&G) increase 9.2% from fiscal 2014 to 2015,
adjusted for total cost containment of $1.1 million, $0.3 million transfer from fund balance, and
$0.7 million in funds specific to historically black colleges and universities (HBCU). Expenditures in
all program areas increase, except scholarships and fellowship, due to growth in personnel costs
(e.g., annualization of the fiscal 2014 salary increments and the cost-of-living adjustment (COLA), the
fiscal 2015 COLA, and salary increments, and the addition of 3 full-time equivalent positions).
Expenditures on operation and maintenance of plant also included the opening of the new Science and
Technology Center in February 2015, which has been delayed until spring 2015. Expenditures
R30B27 – USM – Coppin State University
Analysis of the FY 2016 Maryland Executive Budget, 2015 14
Exhibit 7
Coppin State University Budget Changes for Unrestricted Funds by Program Fiscal 2014-2016
($ in Thousands)
2014
Adjusted
Working
2015
%
Change
2014-15
Adjusted
2016
$
Change
2015-16
%
Change
2015-16
Expenditures
Instruction $18,085 $19,017 5.2% $19,703 $686 3.6%
Academic Support 6,492 6,932 6.8% 7,021 89 1.3%
Student Services 4,362 5,027 15.2% 5,126 99 2.0%
Institutional Support 13,554 13,624 0.5% 14,214 590 4.3%
Operation and Maintenance of Plant 11,254 14,790 31.4% 14,962 172 1.2%
Scholarships and Fellowships 2,406 2,390 -0.7% 2,860 470 19.7%
Net Cost Containment/ATB
Reductions Adjusted for Fund
Balance Transfer (Fiscal 2015
Only) -1,135 -2,451
Funds Specific to HBCU 663 661 -3 -0.4%
Subtotal Education and General $56,152 $61,309 9.2% $62,096 $787 1.3%
Auxiliary Enterprises $9,861 $11,084 12.4% $11,625 $541 4.9%
Total $66,013 $72,393 9.7% $73,721 $1,328 1.8%
Revenues
Tuition and Fees $16,462 $16,665 1.2% $16,538 -$127 -0.8%
General Funds 38,467 40,416 5.1% 42,487 2,071 5.1%
Higher Education Investment Fund 2,268 1,905 -16.0% 2,027 122 6.4%
Other Unrestricted Funds -2,244 1,301 -158.0% 731 -570 -43.8%
Funds Specific to HBCUs 663 661 -3 -0.4%
Subtotal $54,953 $60,003 9.2% $61,784 $1,781 3.0%
Auxiliary Enterprises $12,403 $13,125 5.8% $12,672 -$453 -3.5%
Transfers (to) from Fund Balance -1,343 -735 -735
Total $66,013 $72,393 9.7% $73,721 $1,328 1.8%
ATB: across the board HBCU: historically black college and university
Note: Fiscal 2015 general funds reflect $1.4 million of cost containment actions, and other unrestricted funds are adjusted
by $0.3 million to reflect transfer from fund balance. Fiscal 2016 general funds are adjusted by $2.5 million to reflect
across-the-board reductions.
Source: Governor’s Budget Books, Fiscal 2016; Department of Legislative Services
R30B27 – USM – Coppin State University
Analysis of the FY 2016 Maryland Executive Budget, 2015 15
on scholarships and fellowships decrease 0.7%; however, CSU states that it used the working budget
process to add $174,000 to enhance student recruitment efforts by offering scholarships. In regard to
revenues, other unrestricted funds decrease $1.6 million due a transfer of $2.4 million to the plant fund
in fiscal 2014 and a planned transfer of $62,000 in fiscal 2015. Overall, E&G expenditures of
$61.3 million exceed revenues of $60.0 million by $1.3 million, resulting in a continuing reliance on
auxiliary surpluses to cover academic expenses, which will be further discussed in Issue 2.
Total expenditures grow 1.8%, or $1.3 million, in fiscal 2016 after adjusting for across-the-board
reductions of $2.5 million and $0.7 million in funds specific to HBCUs. However, since at this time, it
is not known how CSU will allocate the reduction across the program areas, it is difficult to compare
the difference in expenditures between fiscal 2015 and 2016. The President should comment on the
institutional priorities when determining how the budget reductions will be allocated over the
program areas and in particular minimizing the impact on financial aid.
R30B27 – USM – Coppin State University
Analysis of the FY 2016 Maryland Executive Budget, 2015 16
Issues
1. Meeting College Expenses
The lack of financial resources frequently contributes to a student’s decision to stop or drop out
of college. As the costs of a college education continue to escalate, students and families are relying
more on various types of financial aid, e.g., federal, State, and institutional, to effectively bring down
the cost of college. According to the National Center for Education Statistics’ College Navigator, the
total cost for a FT/FT Maryland undergraduate student at CSU in fiscal 2013 was $18,572 (based on
tuition, mandatory fees, books and supplies, other expenses, and the weighted average of room and
board). However, when accounting for the average amount of federal, State, and institutional aid, the
average cost of attendance was $9,667, a 47.9% reduction in the net cost of attendance.
In fiscal 2014, 72.3% of CSU’s undergraduate students received Pell awards, which are given
to those who otherwise could not afford college and have an expected family contribution (EFC) of
less than a specific amount, which was, $5,081, in fiscal 2014. EFC is an indicator of the amount a
family is required to contribute to pay for a student’s college education; therefore the lower EFC, the
greater the financial aid.
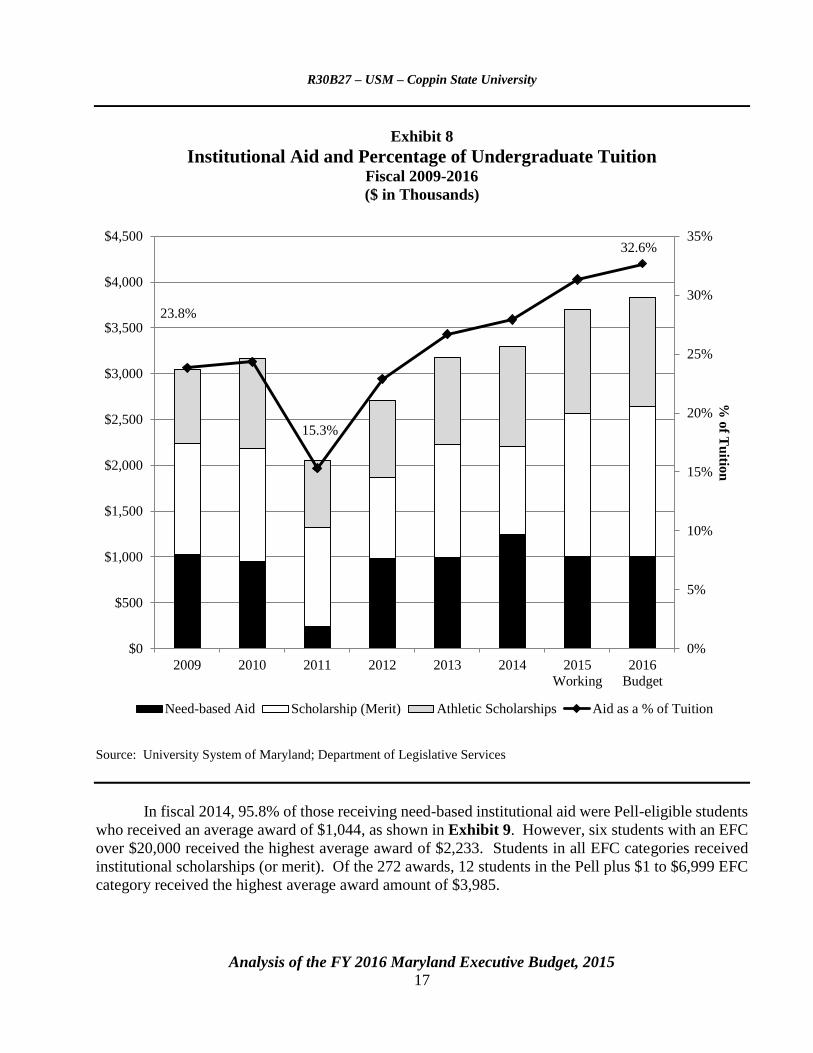
After declining by $1.1 million in fiscal 2011 due to a failure to disburse most of its need-based
aid, expenditures on institutional aid increased to the pre-2011 level of $3.2 million in fiscal 2013, as
shown in Exhibit 8. The fiscal 2014 expenditures on need-based aid increased $254,919; however, the
fiscal 2014 supplemental budget provided $378,000 to be used specifically to increase the amount spent
on need-based aid over fiscal 2013. According to CSU, the remaining $123,081 of the appropriation
went toward other institutional scholarships which includes a waiver for out-of-state tuition differential
for athletes. It should be noted that expenditures on athletic scholarships increased $147,143 while
scholarships, or merit-based aid, declined $284,463. Since CSU did not use its fiscal 2014
appropriation as specified in the supplement budget, DLS recommends restricting the use of
$378,000 of its general fund appropriation to be used only for institutional need-based aid
awards.
While total expenditures on institutional aid increase $0.4 million in fiscal 2015, the amount
spent on need-based aid decreases 19.9% and scholarships, or merit, increases 64.2%. The President
should comment on the decreased spending on need-based aid in fiscal 2015 and on the use of
funds provided specifically for need-based aid being used for athletic scholarships.
The USM Board of Regents (BOR) instructed institutions to use a portion of recent tuition
revenue increases for institutional aid directed toward those undergraduate students with the highest
financial need, offsetting increases in tuition rates, thereby holding harmless those with the greatest
need. Since fiscal 2011, when institutional aid at CSU as a percentage of undergraduate tuition revenue
fell to 15.3%, it has steadily increased and is projected to increase to its highest level of 32.6% in
fiscal 2016.
R30B27 – USM – Coppin State University
Analysis of the FY 2016 Maryland Executive Budget, 2015 17
Exhibit 8
Institutional Aid and Percentage of Undergraduate Tuition Fiscal 2009-2016
($ in Thousands)
Source: University System of Maryland; Department of Legislative Services
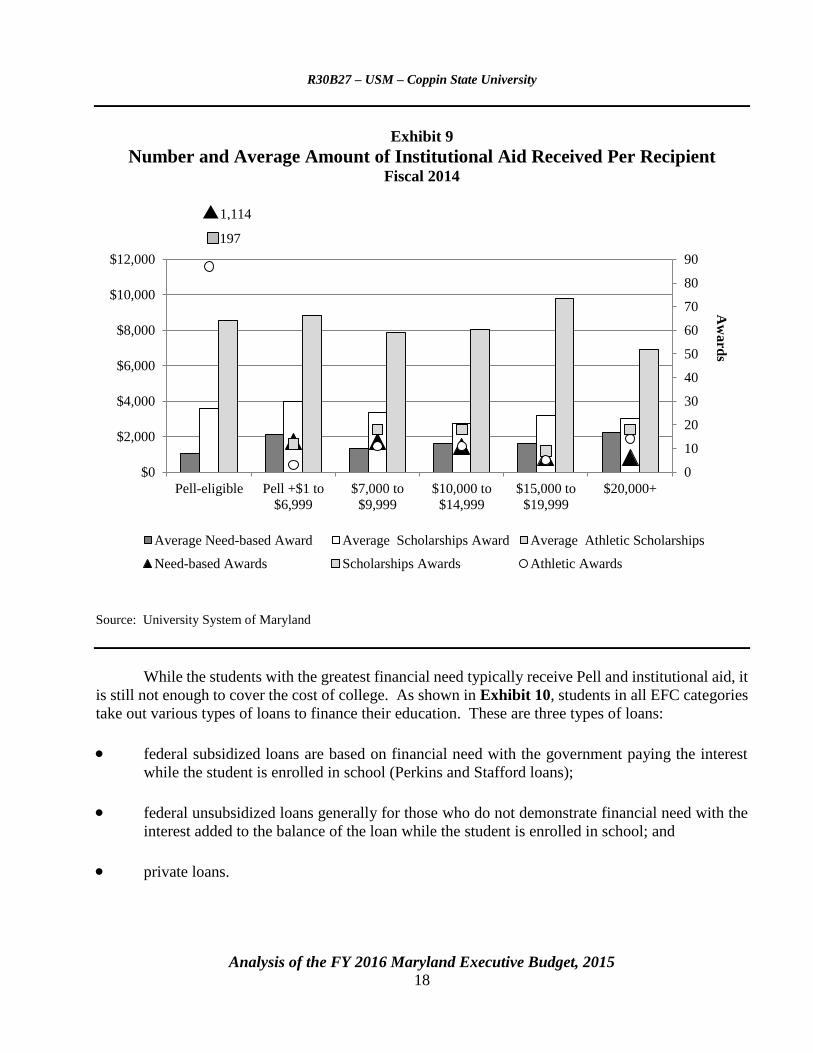
In fiscal 2014, 95.8% of those receiving need-based institutional aid were Pell-eligible students
who received an average award of $1,044, as shown in Exhibit 9. However, six students with an EFC
over $20,000 received the highest average award of $2,233. Students in all EFC categories received
institutional scholarships (or merit). Of the 272 awards, 12 students in the Pell plus $1 to $6,999 EFC
category received the highest average award amount of $3,985.
23.8%
15.3%
32.6%
0%
5%
10%
15%
20%
25%
30%
35%
$0
$500
$1,000
$1,500
$2,000
$2,500
$3,000
$3,500
$4,000
$4,500
2009 2010 2011 2012 2013 2014 2015
Working
2016
Budget
% o
f Tu
ition
Need-based Aid Scholarship (Merit) Athletic Scholarships Aid as a % of Tuition
R30B27 – USM – Coppin State University
Analysis of the FY 2016 Maryland Executive Budget, 2015 18
Exhibit 9
Number and Average Amount of Institutional Aid Received Per Recipient Fiscal 2014
Source: University System of Maryland
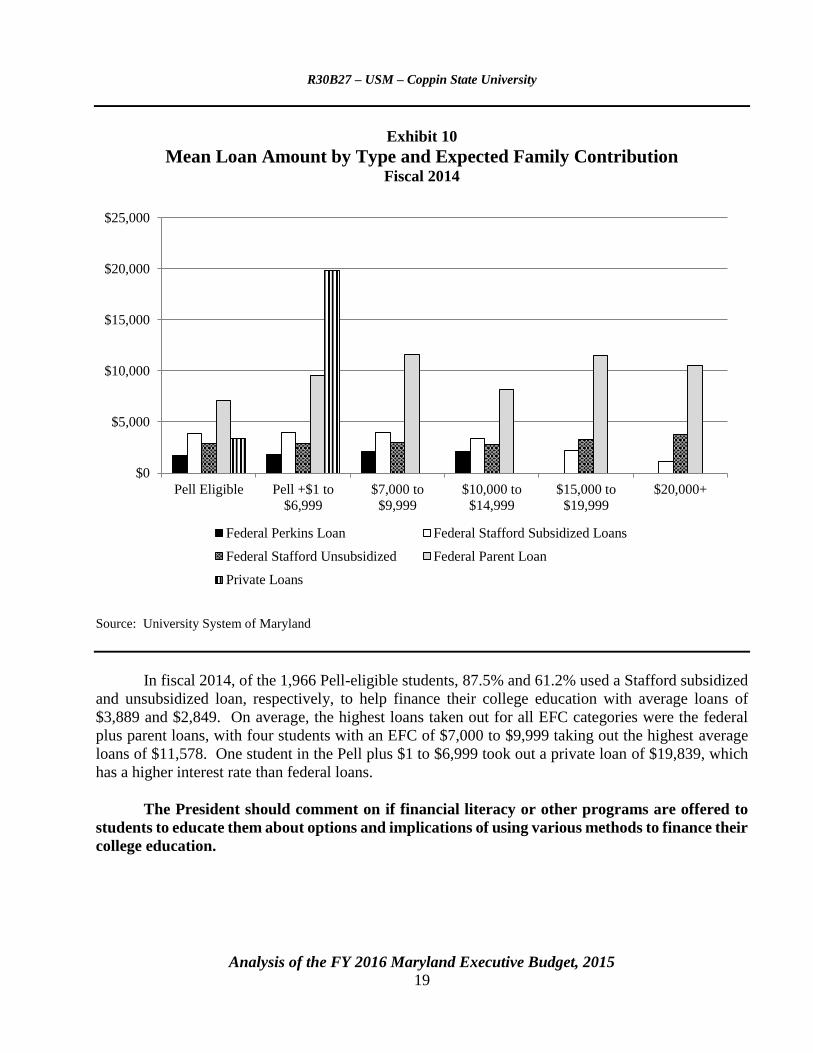
While the students with the greatest financial need typically receive Pell and institutional aid, it
is still not enough to cover the cost of college. As shown in Exhibit 10, students in all EFC categories
take out various types of loans to finance their education. These are three types of loans:
federal subsidized loans are based on financial need with the government paying the interest
while the student is enrolled in school (Perkins and Stafford loans);
federal unsubsidized loans generally for those who do not demonstrate financial need with the
interest added to the balance of the loan while the student is enrolled in school; and
private loans.
0
10
20
30
40
50
60
70
80
90
$0
$2,000
$4,000
$6,000
$8,000
$10,000
$12,000
Pell-eligible Pell +$1 to
$6,999
$7,000 to
$9,999
$10,000 to
$14,999
$15,000 to
$19,999
$20,000+
Aw
ard
s
Average Need-based Award Average Scholarships Award Average Athletic Scholarships
Need-based Awards Scholarships Awards Athletic Awards
1,114
197
R30B27 – USM – Coppin State University
Analysis of the FY 2016 Maryland Executive Budget, 2015 19
Exhibit 10
Mean Loan Amount by Type and Expected Family Contribution Fiscal 2014
Source: University System of Maryland
In fiscal 2014, of the 1,966 Pell-eligible students, 87.5% and 61.2% used a Stafford subsidized
and unsubsidized loan, respectively, to help finance their college education with average loans of
$3,889 and $2,849. On average, the highest loans taken out for all EFC categories were the federal
plus parent loans, with four students with an EFC of $7,000 to $9,999 taking out the highest average
loans of $11,578. One student in the Pell plus $1 to $6,999 took out a private loan of $19,839, which
has a higher interest rate than federal loans.
The President should comment on if financial literacy or other programs are offered to
students to educate them about options and implications of using various methods to finance their
college education.
$0
$5,000
$10,000
$15,000
$20,000
$25,000
Pell Eligible Pell +$1 to
$6,999
$7,000 to
$9,999
$10,000 to
$14,999
$15,000 to
$19,999
$20,000+
Federal Perkins Loan Federal Stafford Subsidized Loans
Federal Stafford Unsubsidized Federal Parent Loan
Private Loans
R30B27 – USM – Coppin State University
Analysis of the FY 2016 Maryland Executive Budget, 2015 20
2. The Future of CSU
While CSU has received significant State funding in both the operating and capital budgets and
offers some successful academic programs such as nursing, criminal justice, and applied psychology,
it continues to struggle with poor student performance and declining enrollment. In addition, from at
least fiscal 2007 to 2014, CSU has been grappling with financial difficulties due to increased spending
during times of falling enrollment. Given these issues, coupled with the president stepping down in
2012, USM BOR appointed a special review committee to conduct a comprehensive review of CSU
and recommend strategies and actions to improve overall performance of the institution. Overall, the
committee found a lack of strong leadership, ineffective and inefficient use of resources, and a lack of
accountability. Other findings included that:
despite an enrollment decline of 3% between 2002 and 2012, 20 new academic programs were
added, and the number of faculty grew 49%, while professional and staff positions increased
92% and 14%, respectively;
student services are not well integrated, timely, or adequately focused to ensure that students
receive needed assistance to maximize academic success;
student center services were inadequate, recreational programs were insufficient, and access to
the new sports complex for recreational use was limited; and
while, on average, the faculty teaching load is the highest among USM’s comprehensive
institutions, CSU faculty generate the lowest number of student credit hours, which is attributed
to a large number of programs being offered to a small number of students.
Budget Shortfall
The committee learned that in spite of its high per-student funding, CSU has been struggling
with an ongoing operating budget deficit and had concerns regarding budget planning, expenditure
controls, implementation of PeopleSoft (a business software program for much of the administrative
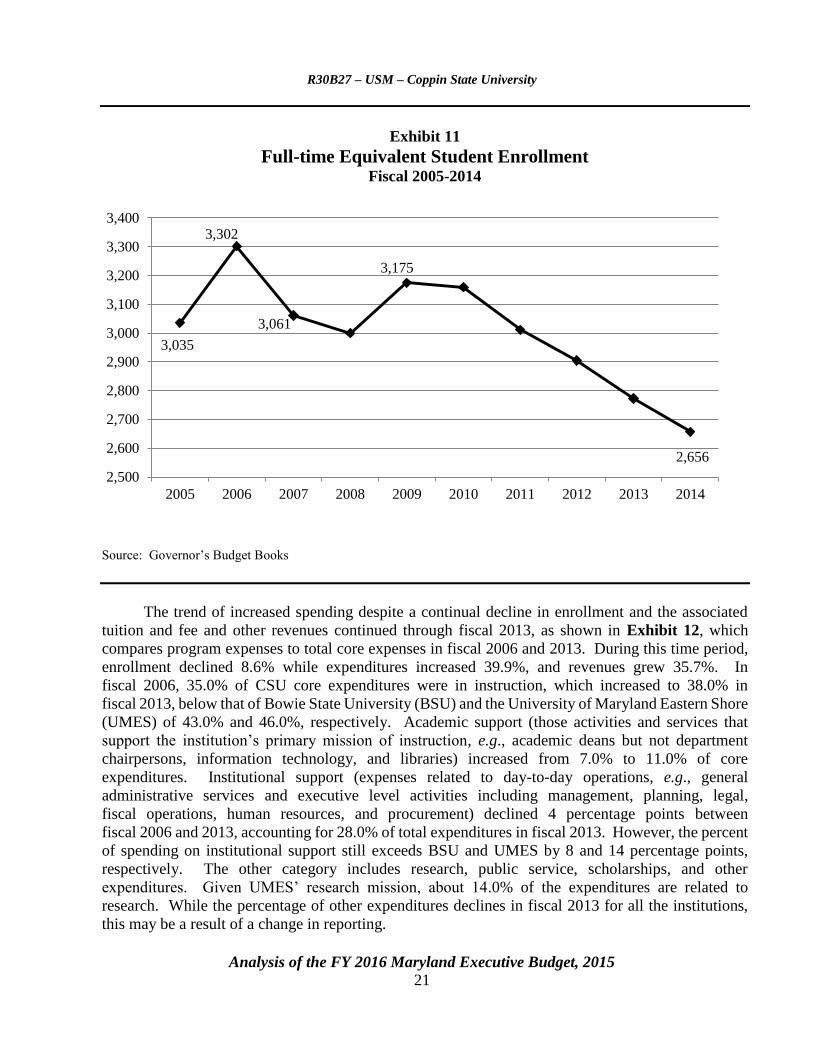
functions), and audit reviews. CSU’s financial difficulties started in fiscal 2007 when enrollment
declined 7.3%, from 3,302 FTES in fiscal 2006 to 3,061 FTES, as shown in Exhibit 11. The resulting
decline in tuition and fee revenues was mitigated by an increase of $9.6 million in State funds; however,
spending exceeded revenues by $1.0 million. Overall, since fiscal 2009 enrollment has fallen 16.3%,
or 519 FTES.
R30B27 – USM – Coppin State University
Analysis of the FY 2016 Maryland Executive Budget, 2015 21
Exhibit 11
Full-time Equivalent Student Enrollment Fiscal 2005-2014
Source: Governor’s Budget Books
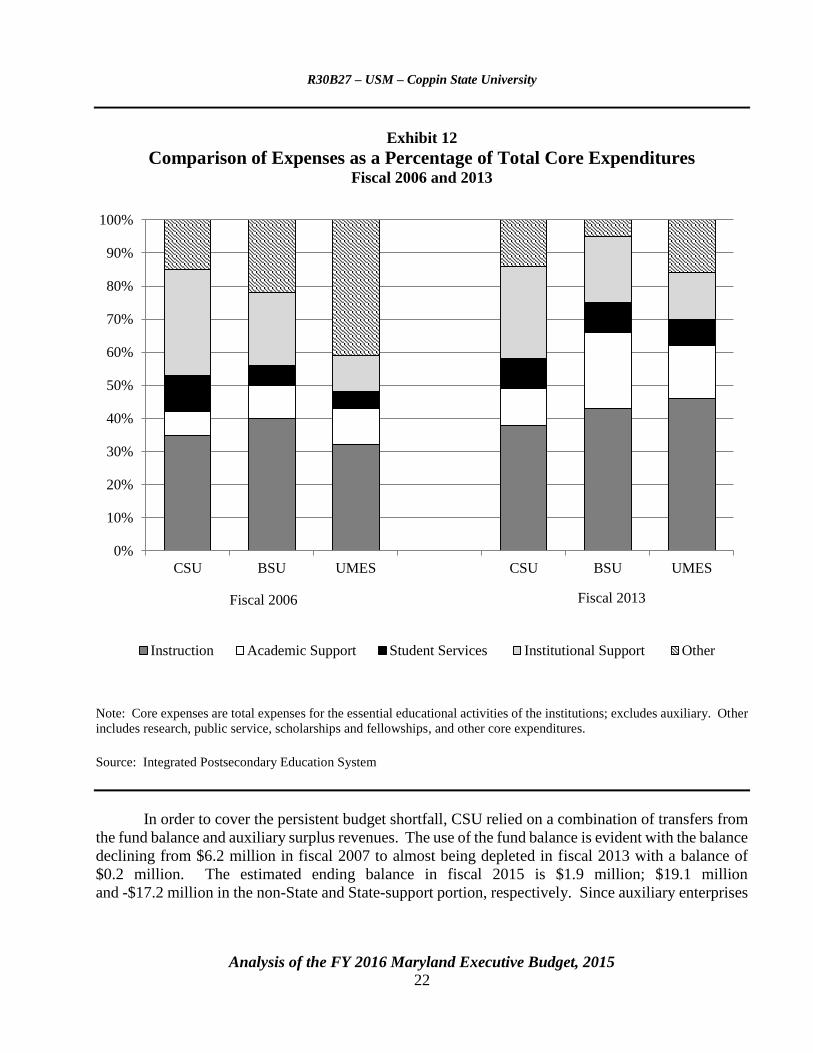
The trend of increased spending despite a continual decline in enrollment and the associated
tuition and fee and other revenues continued through fiscal 2013, as shown in Exhibit 12, which
compares program expenses to total core expenses in fiscal 2006 and 2013. During this time period,
enrollment declined 8.6% while expenditures increased 39.9%, and revenues grew 35.7%. In
fiscal 2006, 35.0% of CSU core expenditures were in instruction, which increased to 38.0% in
fiscal 2013, below that of Bowie State University (BSU) and the University of Maryland Eastern Shore
(UMES) of 43.0% and 46.0%, respectively. Academic support (those activities and services that
support the institution’s primary mission of instruction, e.g., academic deans but not department
chairpersons, information technology, and libraries) increased from 7.0% to 11.0% of core
expenditures. Institutional support (expenses related to day-to-day operations, e.g., general
administrative services and executive level activities including management, planning, legal,
fiscal operations, human resources, and procurement) declined 4 percentage points between
fiscal 2006 and 2013, accounting for 28.0% of total expenditures in fiscal 2013. However, the percent
of spending on institutional support still exceeds BSU and UMES by 8 and 14 percentage points,
respectively. The other category includes research, public service, scholarships, and other
expenditures. Given UMES’ research mission, about 14.0% of the expenditures are related to
research. While the percentage of other expenditures declines in fiscal 2013 for all the institutions,
this may be a result of a change in reporting.
3,035
3,302
3,175
2,656
2,500
2,600
2,700
2,800
2,900
3,000
3,100
3,200
3,300
3,400
2005 2006 2007 2008 2009 2010 2011 2012 2013 2014
3,061
R30B27 – USM – Coppin State University
Analysis of the FY 2016 Maryland Executive Budget, 2015 22
Exhibit 12
Comparison of Expenses as a Percentage of Total Core Expenditures Fiscal 2006 and 2013
Note: Core expenses are total expenses for the essential educational activities of the institutions; excludes auxiliary. Other
includes research, public service, scholarships and fellowships, and other core expenditures.
Source: Integrated Postsecondary Education System
In order to cover the persistent budget shortfall, CSU relied on a combination of transfers from
the fund balance and auxiliary surplus revenues. The use of the fund balance is evident with the balance
declining from $6.2 million in fiscal 2007 to almost being depleted in fiscal 2013 with a balance of
$0.2 million. The estimated ending balance in fiscal 2015 is $1.9 million; $19.1 million
and -$17.2 million in the non-State and State-support portion, respectively. Since auxiliary enterprises
0%
10%
20%
30%
40%
50%
60%
70%
80%
90%
100%
CSU BSU UMES CSU BSU UMES
Instruction Academic Support Student Services Institutional Support Other
Fiscal 2006 Fiscal 2013
R30B27 – USM – Coppin State University
Analysis of the FY 2016 Maryland Executive Budget, 2015 23
are self-supporting, they typically generate a profit, which is generally transferred to the fund balance
or plant fund to be used to fund future projects. In times when E&G revenues may not cover academic
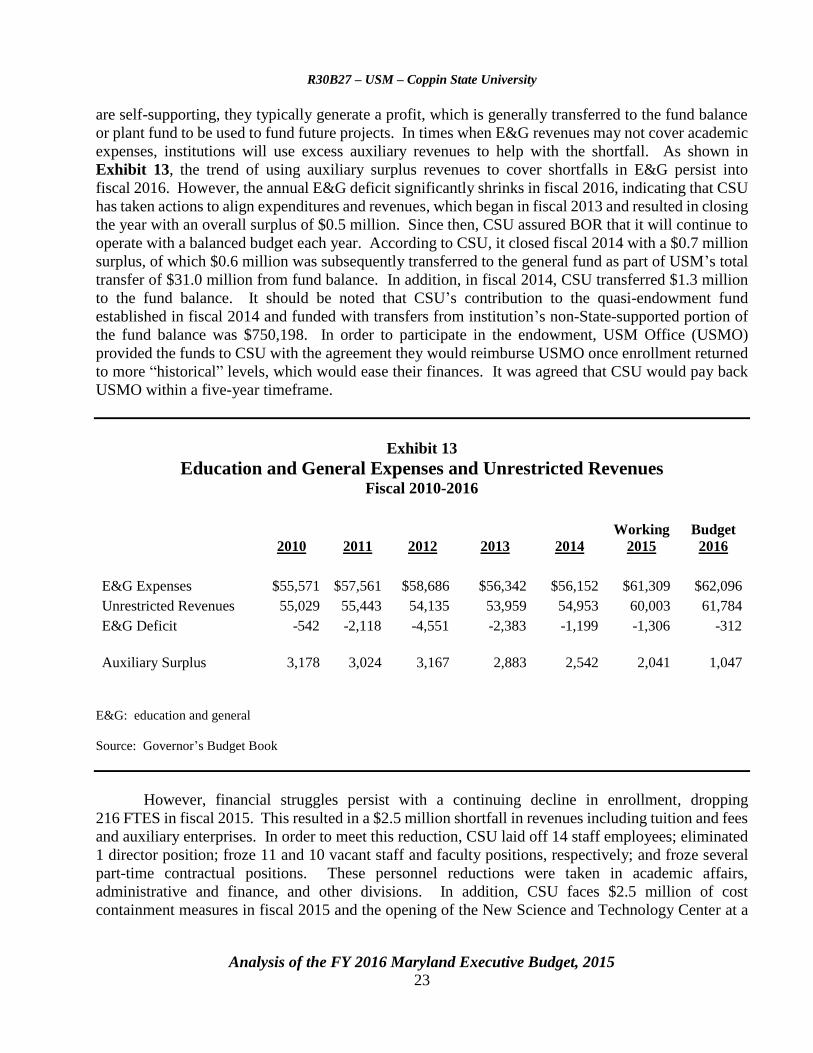
expenses, institutions will use excess auxiliary revenues to help with the shortfall. As shown in
Exhibit 13, the trend of using auxiliary surplus revenues to cover shortfalls in E&G persist into
fiscal 2016. However, the annual E&G deficit significantly shrinks in fiscal 2016, indicating that CSU
has taken actions to align expenditures and revenues, which began in fiscal 2013 and resulted in closing
the year with an overall surplus of $0.5 million. Since then, CSU assured BOR that it will continue to
operate with a balanced budget each year. According to CSU, it closed fiscal 2014 with a $0.7 million
surplus, of which $0.6 million was subsequently transferred to the general fund as part of USM’s total
transfer of $31.0 million from fund balance. In addition, in fiscal 2014, CSU transferred $1.3 million
to the fund balance. It should be noted that CSU’s contribution to the quasi-endowment fund
established in fiscal 2014 and funded with transfers from institution’s non-State-supported portion of
the fund balance was $750,198. In order to participate in the endowment, USM Office (USMO)
provided the funds to CSU with the agreement they would reimburse USMO once enrollment returned
to more “historical” levels, which would ease their finances. It was agreed that CSU would pay back
USMO within a five-year timeframe.
Exhibit 13
Education and General Expenses and Unrestricted Revenues Fiscal 2010-2016
2010 2011 2012 2013 2014
Working
2015
Budget
2016
E&G Expenses $55,571 $57,561 $58,686 $56,342 $56,152 $61,309 $62,096
Unrestricted Revenues 55,029 55,443 54,135 53,959 54,953 60,003 61,784
E&G Deficit -542 -2,118 -4,551 -2,383 -1,199 -1,306 -312
Auxiliary Surplus 3,178 3,024 3,167 2,883 2,542 2,041 1,047
E&G: education and general
Source: Governor’s Budget Book
However, financial struggles persist with a continuing decline in enrollment, dropping
216 FTES in fiscal 2015. This resulted in a $2.5 million shortfall in revenues including tuition and fees
and auxiliary enterprises. In order to meet this reduction, CSU laid off 14 staff employees; eliminated
1 director position; froze 11 and 10 vacant staff and faculty positions, respectively; and froze several
part-time contractual positions. These personnel reductions were taken in academic affairs,
administrative and finance, and other divisions. In addition, CSU faces $2.5 million of cost
containment measures in fiscal 2015 and the opening of the New Science and Technology Center at a
R30B27 – USM – Coppin State University
Analysis of the FY 2016 Maryland Executive Budget, 2015 24
cost of $2.4 million. USM is helping ease some of the financial burden, which is evident with a 5.2%
increase in State funds in fiscal 2016 while, on average, other USM institutions receive an increase of
1.8%.
Progress in Executing the Implementation Plan
The committee emphasized that the overriding priority is the academic success of the students,
and to that end, the recommendations fell under three goals to (1) improve student retention and
graduation rates and increase enrollment; (2) strengthen academic programs and faculty; and
(3) improve administrative operations and shared governance practices. An implementation plan was
developed, establishing a definitive, detailed plan with timelines for the recommended actions to be
completed along with accountability measures. An implementation team was established to provide
oversight, guidance, and feedback on carrying out the recommendations. Overall, 50 targeted
corrective actions were identified to achieve efficiencies in the academic enterprise, improve
operations, and change and improve processes. To date, progress has been made on 49 of the actions,
of which 23 have been completed, including:
6 of the 8 immediate actions (to be completed by August 31, 2013);
9 of the 16 short-term actions (to be completed by December 31, 2013);
0 of the 1 immediate to mid-term actions (to be completed by June 30, 2014);
8 of the 18 mid-term action actions (to be completed by June 30, 2013); and
0 of the 7 long-term actions (to be completed by June 30, 2018).
Some of the completed actions include:
opening a child care development center;
developing a strategic enrollment management plan with a target of growing enrollment to
5,000 by 2020;
implementing intrusive academic advisory intervention which included assigning every student
an advisor; and
identifying the functions and personnel in the Office of Administration and Finance necessary
to accomplish critical components of the institution.
While CSU provided regular reports on the status of the actions identified in the implementation
plan, there are inconsistencies in the reporting on the progress of those actions. While detailed
information was provided for some activities, many lacked details on the outcomes of the actions. For
R30B27 – USM – Coppin State University
Analysis of the FY 2016 Maryland Executive Budget, 2015 25
example, even though CSU opened a child care center, there is no information about whether the
students are using it, and while students have been assigned an advisor, it is not known whether
students are meeting with them.
The Future Remains in Question
While CSU continues to make progress toward completing the actions identified in the
implementation plan, other metrics point in the opposite direction:
enrollment continues to drop;
there has been little, if any, improvement in student performance or success; and
absent disproportionate financial support and forbearance from USM, its financial struggles
would be much more.
Through cost containment measures, CSU has recently been able to stay within its budget, but it is not
clear whether these are short-term actions to balance the current year budget or strategic decisions to
right size the university in the long-term; aligning resources with enrollment. Furthermore, the current
president is set to resign at the end of fiscal 2015.
Recognizing the opportunities that exist with the change of leadership in several Baltimore City
institutions of higher education, the budget committees requested a report in 2014 on not only current
partnerships but also specific plans to increase and enhance collaborations and partnerships between
those institutions. The report, submitted on October 29, 2014, lacked any discussions on unique or
innovative collaborations in which each institution could take advantage of each others strengths and
create a synergy among the campuses. This could not only benefit the students by providing
opportunities that may not exist at their home campus but create efficiencies that would benefit the
institutions as well as the students.
Overall, while the actions completed in the implementation plan purport to be small steps in
moving CSU in the right direction, the hard discussions and decisions have yet to be made such as
eliminating some programs while focusing resources to build up other programs. In addition,
conversations have yet to take place among CSU, the University of Baltimore, and Baltimore City
Community College to explore innovative collaborations. While the institutions state that their unique
missions limit collaborative activities, they should instead view their unique missions as a collective
continuum in the college career of a student.
The Chancellor should comment on the extent to which the implementation plan can truly
be a transformational one and, if so, how and how long the State should tolerate the
underperformance and financial struggles at CSU before USM implements more fundamental
changes.
R30B27 – USM – Coppin State University
Analysis of the FY 2016 Maryland Executive Budget, 2015 26
Recommended Actions
1. Add the following language to the unrestricted fund appropriation:
, provided that $378,000 of this appropriation made for the purpose of increasing expenditures
on institutional need-based financial aid above the fiscal 2015 level may only be expended for
that purpose. Funds not expended for this restricted purpose may not be transferred by budget
amendment or otherwise to any other purpose and shall revert to the General Fund.
Further provided that it is the intent of the General Assembly that spending on institutional
need-based financial aid shall be at least equal to the amount spent in fiscal 2014.
Explanation: This language restricts $0.4 million of the general fund appropriation provided
in the fiscal 2014 supplemental budget to increase expenditures on institutional need-based
financial aid only be expended to increase need-based aid above the fiscal 2015 level and
expresses intent that expenditures on need-based aid should, at a minimum, be equivalent to
expenditures in fiscal 2014.
R30B27 – USM – Coppin State University
Analysis of the FY 2016 Maryland Executive Budget, 2015 27
Appendix 1
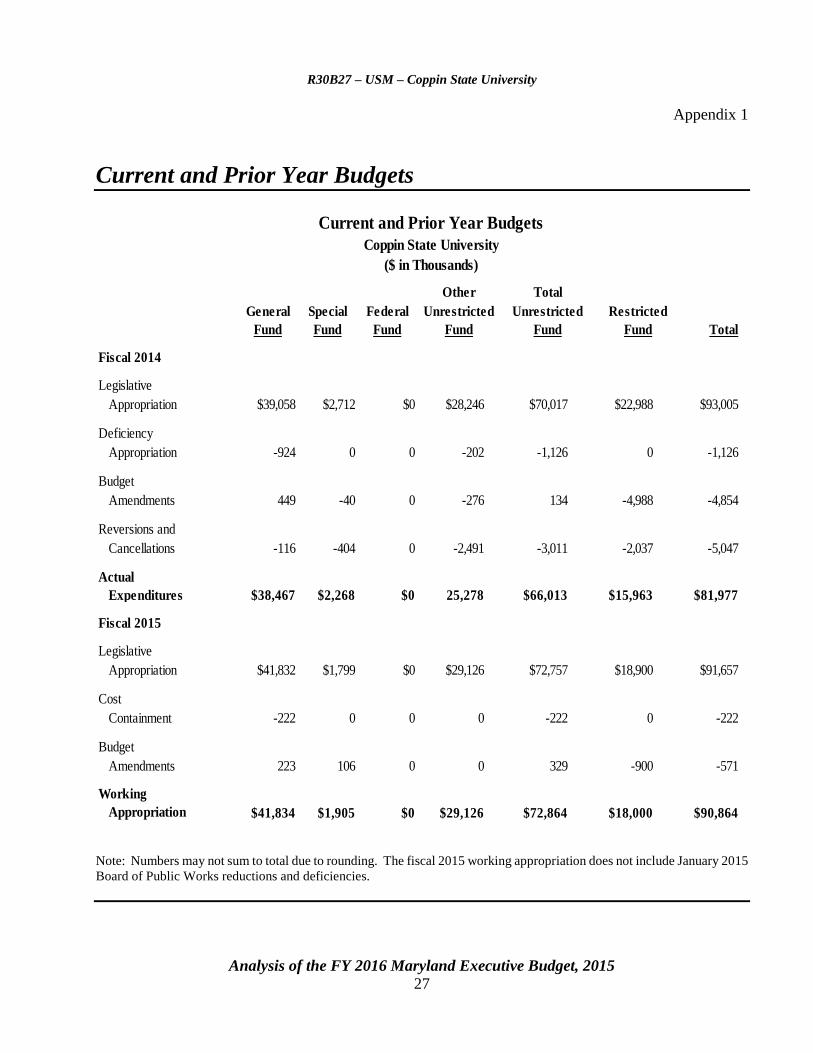
Current and Prior Year Budgets
General Special Federal
Fund Fund Fund
Fiscal 2014
Legislative
Appropriation $39,058 $2,712 $0 $28,246 $70,017 $22,988 $93,005
Deficiency
Appropriation -924 0 0 -202 -1,126 0 -1,126
Budget
Amendments 449 -40 0 -276 134 -4,988 -4,854
Reversions and
Cancellations -116 -404 0 -2,491 -3,011 -2,037 -5,047
Actual
Expenditures $38,467 $2,268 $0 25,278 $66,013 $15,963 $81,977
Fiscal 2015
Legislative
Appropriation $41,832 $1,799 $0 $29,126 $72,757 $18,900 $91,657
Cost
Containment -222 0 0 0 -222 0 -222
Budget
Amendments 223 106 0 0 329 -900 -571
Working
Appropriation $41,834 $1,905 $0 $29,126 $72,864 $18,000 $90,864
Restricted
Current and Prior Year Budgets
Other Total
Fund Fund Fund
($ in Thousands)
Coppin State University
Total
Unrestricted Unrestricted
Note: Numbers may not sum to total due to rounding. The fiscal 2015 working appropriation does not include January 2015
Board of Public Works reductions and deficiencies.
R3
0B
27
– C
op
pin
Sta
te Un
iversity
Appen
dix
1
R30B27 – USM – Coppin State University
Analysis of the FY 2016 Maryland Executive Budget, 2015 28
Fiscal 2014
For fiscal 2014, the general fund decreased $0.6 million, which included $0.9 million in
reductions by deficiency appropriations related to health insurance, retirement, and the State personnel
system. Budget amendments added $0.4 million related to a 3% COLA. Language in the fiscal 2014
budget bill transferred funds to the Maryland Higher Education Commission to provide additional
funding for the Educational Assistance Grants. However, since these funds were not used for this
purpose $0.1 million were reverted to the general fund.
The special fund appropriation decreased $39,788 related to language in the fiscal 2014 budget
bill that transferred a portion of the HEIF to St. Mary’s College of Maryland, and by an additional
$0.4 million due to a cancellation resulting from the underattainment of the HEIF.
Other unrestricted funds decreased $3.0 million, which included a reduction of $0.2 million in
deficiency appropriations related to retirement. Budget amendments reduce a further $0.3 million
including $1.0 million in auxiliary operations to realign expenditures with current projections,
$0.5 million in tuition and fee revenues, and $2,000 in federal indirect cost recovery. These decreases
are offset by an increase of $1.1 million related to reducing the amount of a planned transfer to the fund
balance and $0.1 million in other sources. Cancellations of unrestricted funds amounted to $2.5 million
due to reducing spending in order to meet a balanced budget goal.
Restricted funds decreased $5.0 million through budget amendments primarily due to a
$4.6 million decline in federal grants and contracts related to the loss of several grants and a decline in
Pell awards and a $0.6 million decline in State grants and contracts. This reduction was partially offset
by an increase of $0.2 million in private grants and contracts. Cancellations of restricted funds totaled
$2.0 million due to lower than anticipated expenditures on financial aid related to an enrollment decline.
Fiscal 2015
For fiscal 2015, general funds for CSU increased $1,751. Budget amendments added
$0.2 million related to the fiscal 2015 2% COLA partially offset by $0.2 million in cost containment
measures, and a $0.1 million decrease is offset by a corresponding increase in the HEIF.
Restricted funds declined $0.9 million due to decreases in federal ($0.8 million), State
($88,250), and private ($32,500) grants and contracts.
R30B27 – USM – Coppin State University
Analysis of the FY 2016 Maryland Executive Budget, 2015 29
Appendix 2
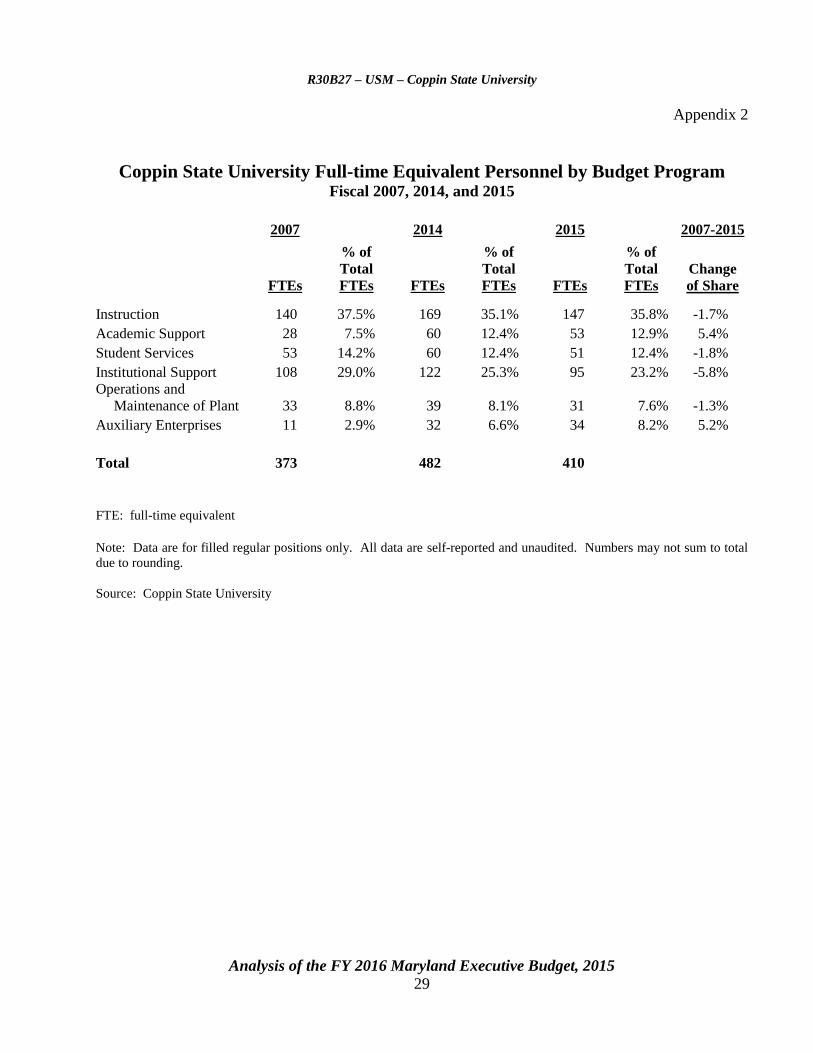
Coppin State University Full-time Equivalent Personnel by Budget Program Fiscal 2007, 2014, and 2015
2007 2014 2015 2007-2015
FTEs
% of
Total
FTEs FTEs
% of
Total
FTEs FTEs
% of
Total
FTEs
Change
of Share
Instruction 140 37.5% 169 35.1% 147 35.8% -1.7%
Academic Support 28 7.5% 60 12.4% 53 12.9% 5.4%
Student Services 53 14.2% 60 12.4% 51 12.4% -1.8%
Institutional Support 108 29.0% 122 25.3% 95 23.2% -5.8%
Operations and
Maintenance of Plant 33 8.8% 39 8.1% 31 7.6% -1.3%
Auxiliary Enterprises 11 2.9% 32 6.6% 34 8.2% 5.2%
Total 373 482 410
FTE: full-time equivalent
Note: Data are for filled regular positions only. All data are self-reported and unaudited. Numbers may not sum to total
due to rounding.
Source: Coppin State University
An
alysis o
f the F
Y 2
016 M
aryla
nd E
xecu
tive Bu
dget, 2
015
30
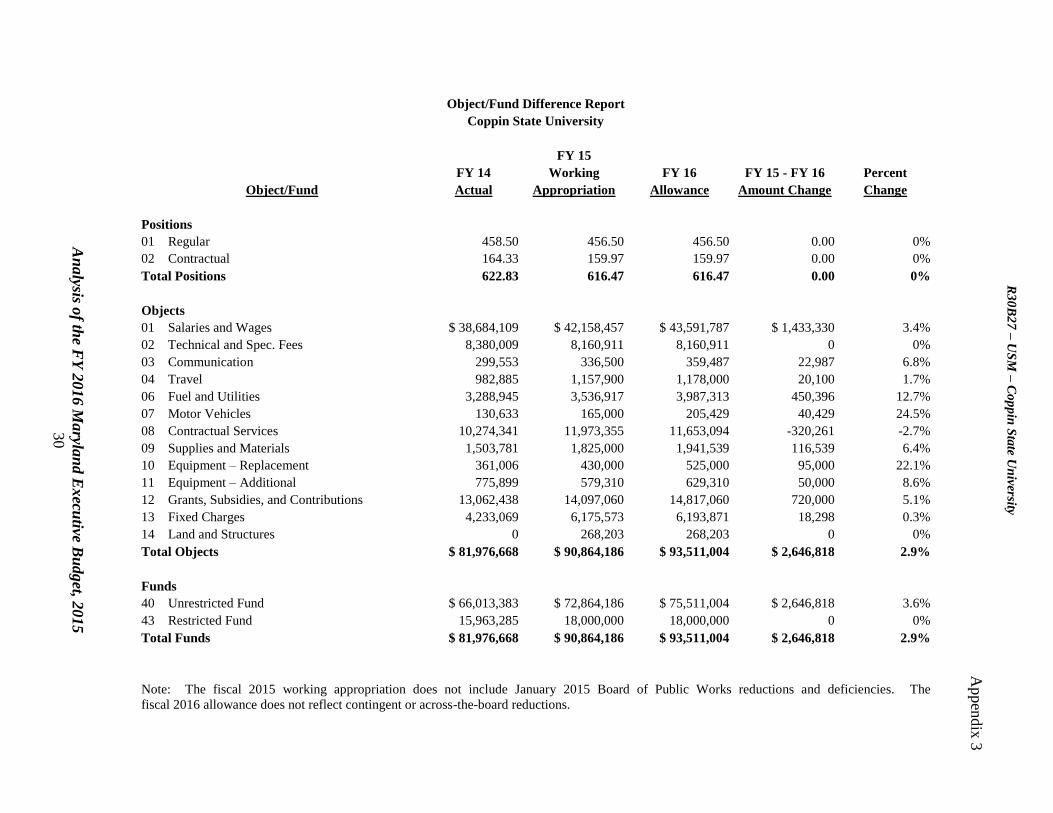
Object/Fund Difference Report
Coppin State University
FY 15
FY 14 Working FY 16 FY 15 - FY 16 Percent
Object/Fund Actual Appropriation Allowance Amount Change Change
Positions
01 Regular 458.50 456.50 456.50 0.00 0%
02 Contractual 164.33 159.97 159.97 0.00 0%
Total Positions 622.83 616.47 616.47 0.00 0%
Objects
01 Salaries and Wages $ 38,684,109 $ 42,158,457 $ 43,591,787 $ 1,433,330 3.4%
02 Technical and Spec. Fees 8,380,009 8,160,911 8,160,911 0 0%
03 Communication 299,553 336,500 359,487 22,987 6.8%
04 Travel 982,885 1,157,900 1,178,000 20,100 1.7%
06 Fuel and Utilities 3,288,945 3,536,917 3,987,313 450,396 12.7%
07 Motor Vehicles 130,633 165,000 205,429 40,429 24.5%
08 Contractual Services 10,274,341 11,973,355 11,653,094 -320,261 -2.7%
09 Supplies and Materials 1,503,781 1,825,000 1,941,539 116,539 6.4%
10 Equipment – Replacement 361,006 430,000 525,000 95,000 22.1%
11 Equipment – Additional 775,899 579,310 629,310 50,000 8.6%
12 Grants, Subsidies, and Contributions 13,062,438 14,097,060 14,817,060 720,000 5.1%
13 Fixed Charges 4,233,069 6,175,573 6,193,871 18,298 0.3%
14 Land and Structures 0 268,203 268,203 0 0%
Total Objects $ 81,976,668 $ 90,864,186 $ 93,511,004 $ 2,646,818 2.9%
Funds
40 Unrestricted Fund $ 66,013,383 $ 72,864,186 $ 75,511,004 $ 2,646,818 3.6%
43 Restricted Fund 15,963,285 18,000,000 18,000,000 0 0%
Total Funds $ 81,976,668 $ 90,864,186 $ 93,511,004 $ 2,646,818 2.9%
Note: The fiscal 2015 working appropriation does not include January 2015 Board of Public Works reductions and deficiencies. The
fiscal 2016 allowance does not reflect contingent or across-the-board reductions.
R3
0B
27
– U
SM
– C
op
pin
Sta
te Un
iversity
Appen
dix
3
An
alysis o
f the F
Y 2
016 M
aryla
nd E
xecu
tive Bu
dget, 2
015
31
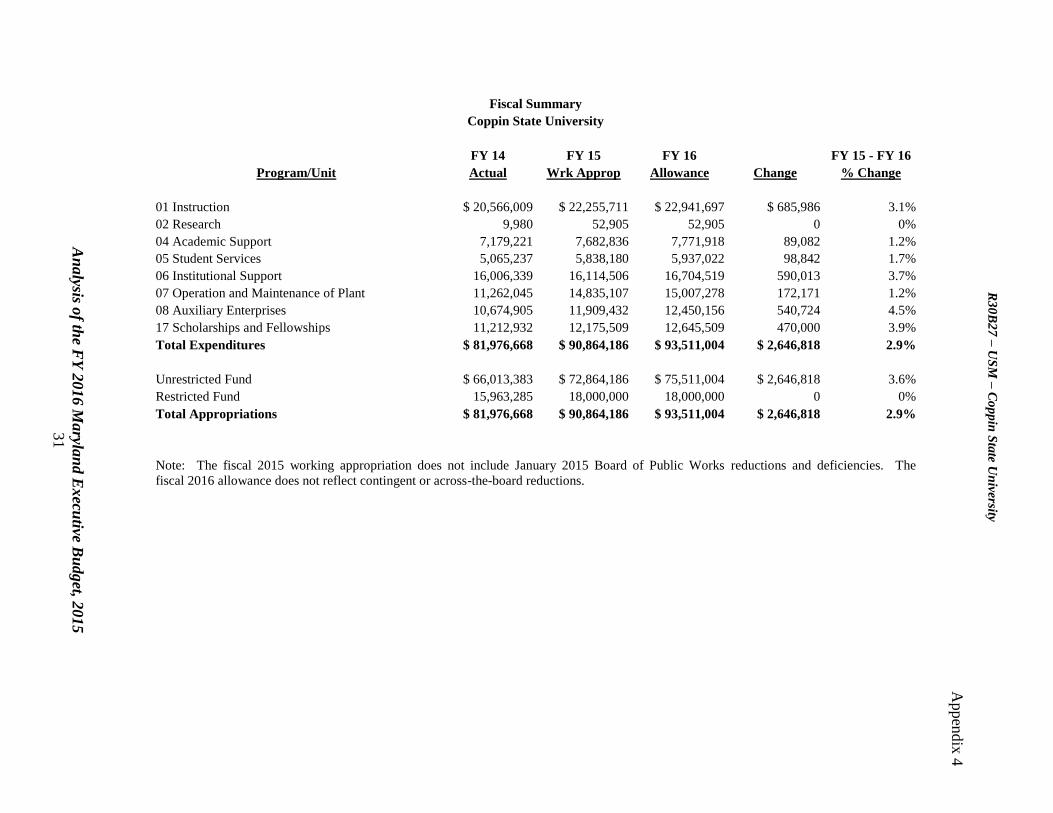
Fiscal Summary
Coppin State University
FY 14 FY 15 FY 16 FY 15 - FY 16
Program/Unit Actual Wrk Approp Allowance Change % Change
01 Instruction $ 20,566,009 $ 22,255,711 $ 22,941,697 $ 685,986 3.1%
02 Research 9,980 52,905 52,905 0 0%
04 Academic Support 7,179,221 7,682,836 7,771,918 89,082 1.2%
05 Student Services 5,065,237 5,838,180 5,937,022 98,842 1.7%
06 Institutional Support 16,006,339 16,114,506 16,704,519 590,013 3.7%
07 Operation and Maintenance of Plant 11,262,045 14,835,107 15,007,278 172,171 1.2%
08 Auxiliary Enterprises 10,674,905 11,909,432 12,450,156 540,724 4.5%
17 Scholarships and Fellowships 11,212,932 12,175,509 12,645,509 470,000 3.9%
Total Expenditures $ 81,976,668 $ 90,864,186 $ 93,511,004 $ 2,646,818 2.9%
Unrestricted Fund $ 66,013,383 $ 72,864,186 $ 75,511,004 $ 2,646,818 3.6%
Restricted Fund 15,963,285 18,000,000 18,000,000 0 0%
Total Appropriations $ 81,976,668 $ 90,864,186 $ 93,511,004 $ 2,646,818 2.9%
Note: The fiscal 2015 working appropriation does not include January 2015 Board of Public Works reductions and deficiencies. The
fiscal 2016 allowance does not reflect contingent or across-the-board reductions.
R3
0B
27
– U
SM
– C
op
pin
Sta
te Un
iversity
Appen
dix
4