lessons learned from cardiovascular risk models: experience from the framingham study lisa m....
TRANSCRIPT
Lessons Learned From Cardiovascular Risk Models:
Experience from the Framingham Study
Lisa M. SullivanBoston University Statistics and
Consulting Unit-Framingham Heart Study
May 20, 2004
Outline Framingham Experience in Risk
Prediction Guidelines for Developing Risk
Prediction Models Example-NCEP ATP III Packaging Risk Models for Clinical
Use Problems/Issues Next Steps
Framingham Experience in Risk Prediction
Risk functions (HRAFs) are multivariable models Predict likelihood that an individual will
have an event (e.g., coronary heart disease) over a specified period of time (e.g., the next 10 years)
Impact of individual and combinations of readily available risk factors
Framingham History Modeling started in 1960’s with discriminant
function analysis and logistic regression analysis -Truett J, Cornfield J, Kannel WB. A Multivariate analysis of
the risk of coronary heart disease in Framingham. J Chronic Dis 1967; 20:511-524.
-Cornfield J, Gordon T, Smith W. Quantal response curves for experimentally uncontrolled variables. Bull of Intl Stat Inst 1961; 28: part 3.
-Walker S, Duncan D. Estimation of the probability of an event as a function of several independent variables. Biometrika 1967;54:167-179.
Framingham History Published Functions
More data, longer follow-up, advances in statistical methods and computing – survival analysis was used
-Kannel WB, McGee D, Gordon T. A general cardiovascular risk profile: the Framingham Study. Am J Cardiol 1976; 38:46-51.
-Anderson KM, Wilson PWF, Odell PM, Kannel WB. An updated coronary risk profile. A statement for health professionals. Circulation 1991; 83:356-362
-Wilson PWF, D’Agostino RB, Levy D, Belanger AM, Silbershatz H, Kannel WB. Prediction of coronary heart disease using risk factor categories. Circulation 1998; 97:1837-1847
Framingham HistoryDisease-Specific Functions
Coronary Heart Disease, Peripheral Artery Disease, Heart Failure, Stroke
-Wolf PA, D’Agostino RB, Belanger AJ, Kannel WB. Probability of stroke: a risk profile from the Framingham Study. Stroke 1991; 3:312-318.
-D’Agostino RB, Wolf PA, Belanger AJ, Kannel WB. Stroke risk profile: Adjustment for antihypertensive medication. Stroke 1994; 25:40-43.
Subsequent Events Functions -D’Agostino RB, Russell MW, Huse DM, et al. Primary and
subsequent coronary risk appraisal: New results from the Framingham Study. Am Heart J. 2000; 139:272-281.
Guidelines for Developing Risk Prediction Models Hypothesizing models that reflect
biological pathways Collecting appropriate data
Identifying subjects (population at risk) Defining and measuring risk factors
and outcomes Deciding on appropriate follow-up time
Fitting and testing appropriate models
Objective To develop model that accurately reflects
patterns in the data that are valid when applied to data in other, comparable settings Based on biological model
Methodologic Challenges Changing definitions (DM) Missing data-imputation techniques Omission of risk factors Incorrect specification of effects
Predictive Accuracy/UtilityComponents of Accuracy Calibration - how closely predicted
probabilities agree numerically with actual outcomes (bias)
Discrimination - ability of a predictive model to separate those who develop event from those who do not (ordering)
Relationship Poor discrimination – can’t recalibrate to
correct Good discrimination – can recalibrate without
losing discrimination
Calibration Dichotomous – form subgroups
(deciles of predicted probabilities) and compare predicted and actual event probabilities
Time to event – similar approach using KM estimates of actual probabilities
Discrimination Dichotomous or Time to Event –
c statistic – proportion of patient pairs in which predictions and actual outcomes are concordant (i.e., predicted survival higher for patient who actually survived longer)
Model Validation External Validation – frozen model applied to new
data Internal Validation
Data Splitting 75% sample: develop & freeze model, apply to remaining
25%, assess calibration and discrimination Cross-Validation
Repeated data splitting (e.g., samples leaving out 50 observations each run, repeat 400 times, average results)
Bootstrapping Large number of samples with replacement from original
sample, estimate generalization error based on resampling
-Harrell F, Lee, Mark. Multivariable Prognostic Models: Issues in Developing Models, Evaluating Assumptions and Adequacy, and Measuring and Reducing Errors. Stat Med 2001; 15: 361-387.
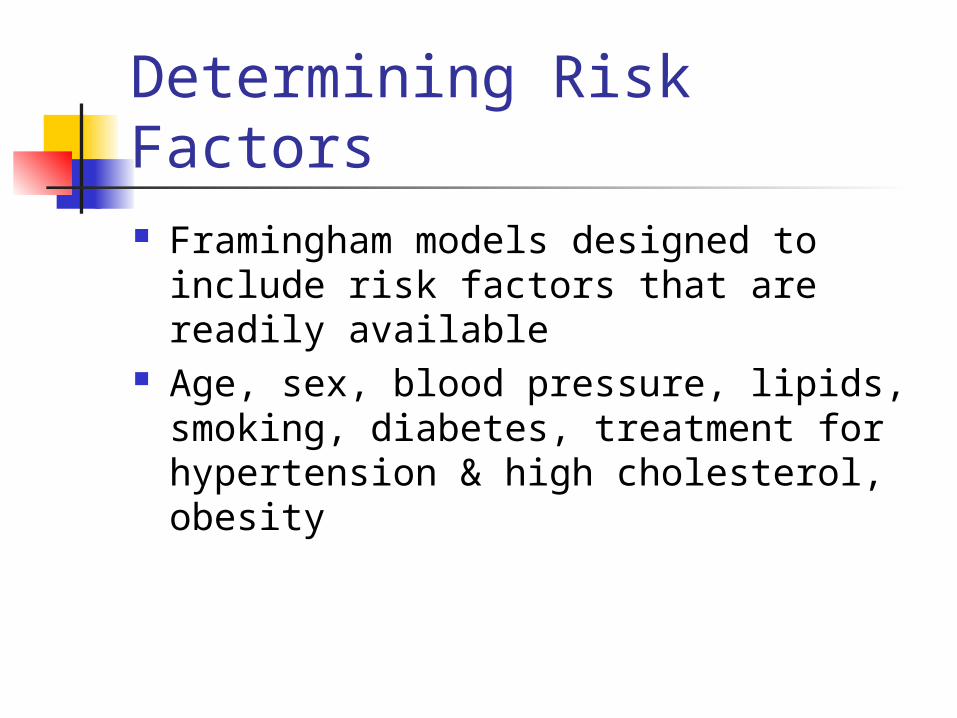
Determining Risk Factors Framingham models designed to
include risk factors that are readily available
Age, sex, blood pressure, lipids, smoking, diabetes, treatment for hypertension & high cholesterol, obesity
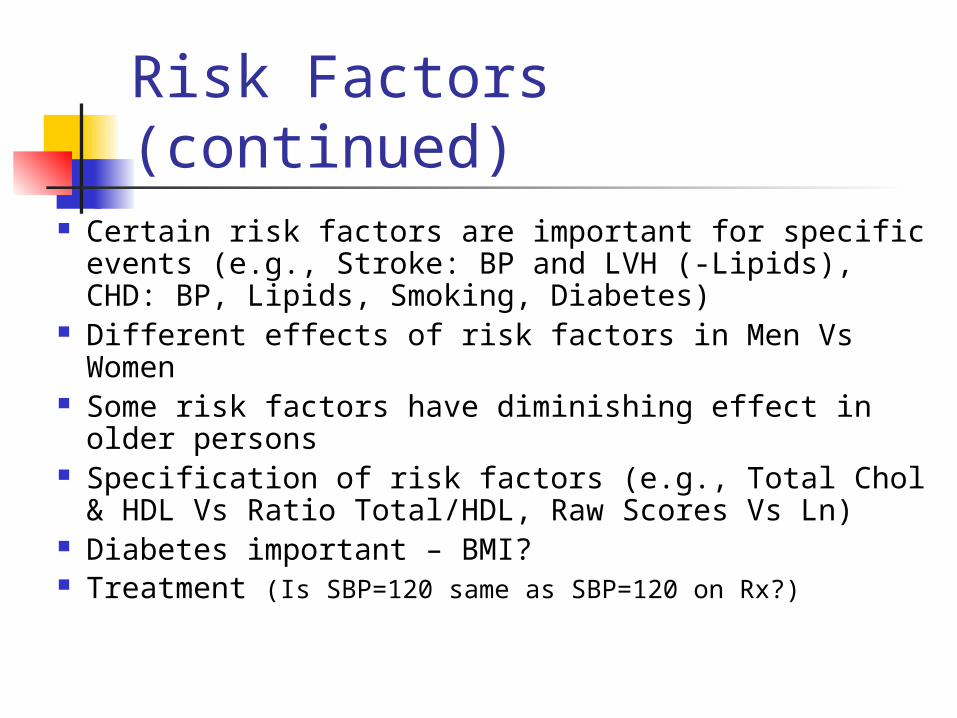
Risk Factors (continued) Certain risk factors are important for specific
events (e.g., Stroke: BP and LVH (-Lipids), CHD: BP, Lipids, Smoking, Diabetes)
Different effects of risk factors in Men Vs Women Some risk factors have diminishing effect in older
persons Specification of risk factors (e.g., Total Chol &
HDL Vs Ratio Total/HDL, Raw Scores Vs Ln) Diabetes important – BMI? Treatment (Is SBP=120 same as SBP=120 on Rx?)
Framingham ExperienceValidation
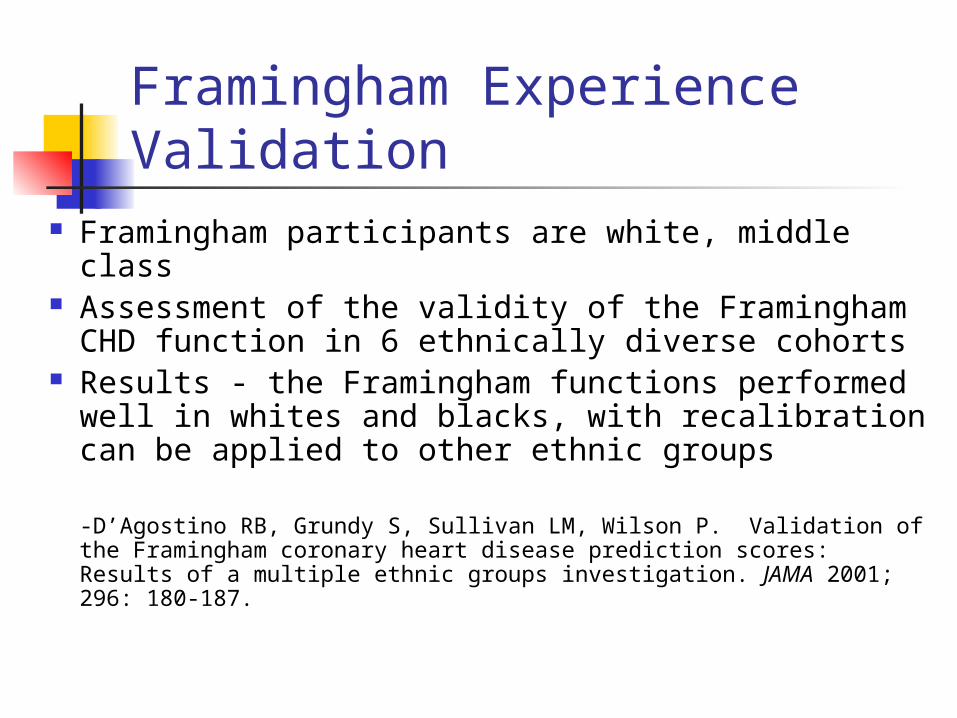
Framingham participants are white, middle class
Assessment of the validity of the Framingham CHD function in 6 ethnically diverse cohorts
Results - the Framingham functions performed well in whites and blacks, with recalibration can be applied to other ethnic groups
-D’Agostino RB, Grundy S, Sullivan LM, Wilson P. Validation of the Framingham coronary heart disease prediction scores: Results of a multiple ethnic groups investigation. JAMA 2001; 296: 180-187.
Framingham ExperienceValidation (continued)
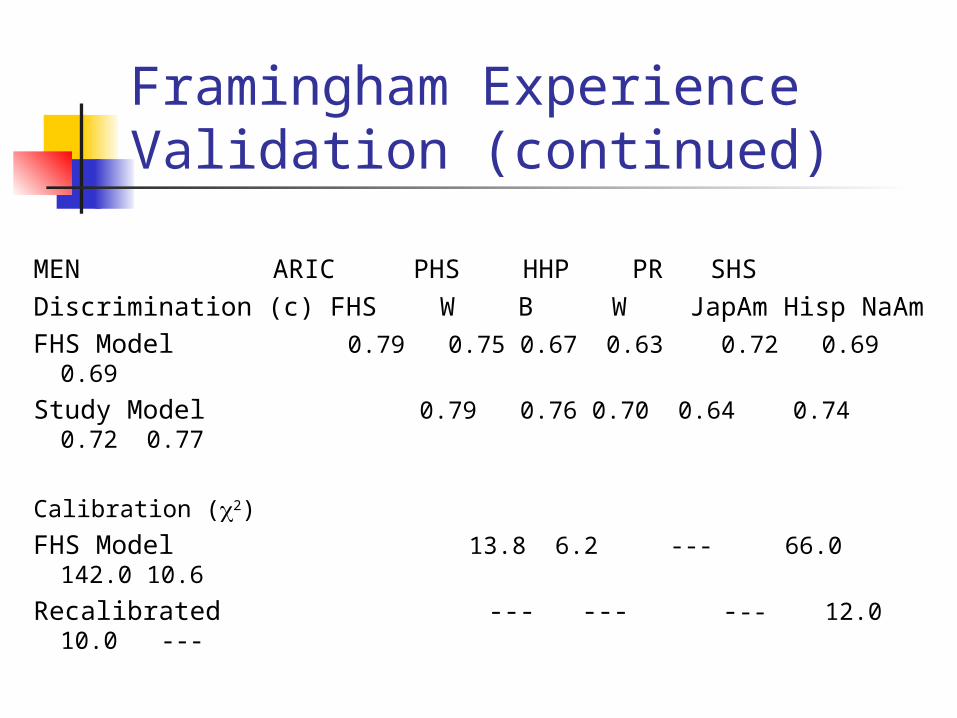
MEN ARIC PHS HHP PR SHSDiscrimination (c) FHS W B W JapAm Hisp NaAmFHS Model 0.79 0.75 0.67 0.63 0.72 0.69 0.69
Study Model 0.79 0.76 0.70 0.64 0.74 0.72 0.77
Calibration (2)
FHS Model 13.8 6.2 --- 66.0 142.0 10.6
Recalibrated --- --- --- 12.0 10.0 ---
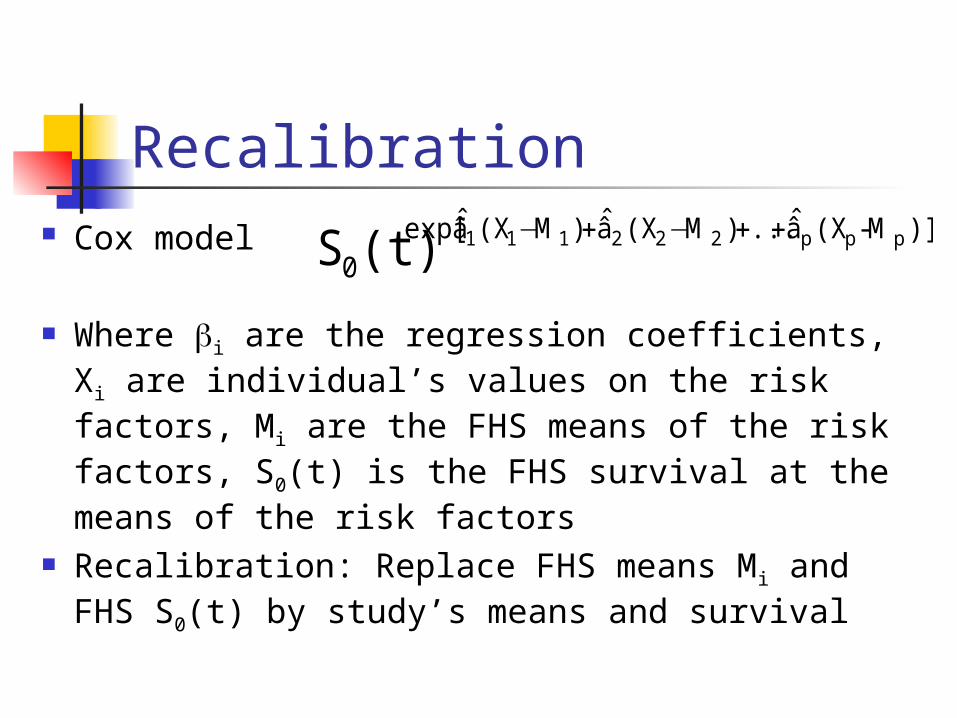
Recalibration Cox model
Where i are the regression coefficients, Xi are individual’s values on the risk factors, Mi are the FHS means of the risk factors, S0(t) is the FHS survival at the means of the risk factors
Recalibration: Replace FHS means Mi and FHS S0(t) by study’s means and survival
)]M-(Xâ̂...)M(Xâ̂)M(Xâ̂exp[0
ppp222111(t)S ++−+−
Packaging Risk Models for Clinical Use
Framingham Experience Have the risk factor data (risk factors
measured serially with extensive QC, new measures continue to be added)
Outcomes assessed comprehensively Validation
How can we make these models useful in clinical practice?
National Cholesterol Education Program Adult Treatment Panel III
Updated clinical guidelines for cholesterol testing and management
Intended to inform but not replace clinical judgment (evidence based)
Major focus on more intensive cholesterol lowering therapy in certain groups of people
NCEP ATP III - Treatment Intensive treatment for persons with CHD Focus on multiple risk factors using
Framingham functions for 10 year absolute CHD risk
Match intensity of treatment to absolute CHD risk If risk estimate > 20% aggressive treatment If risk estimate 10-20% moderated treatment
Executive Summary JAMA 2001; 285(19): 2486-2497.
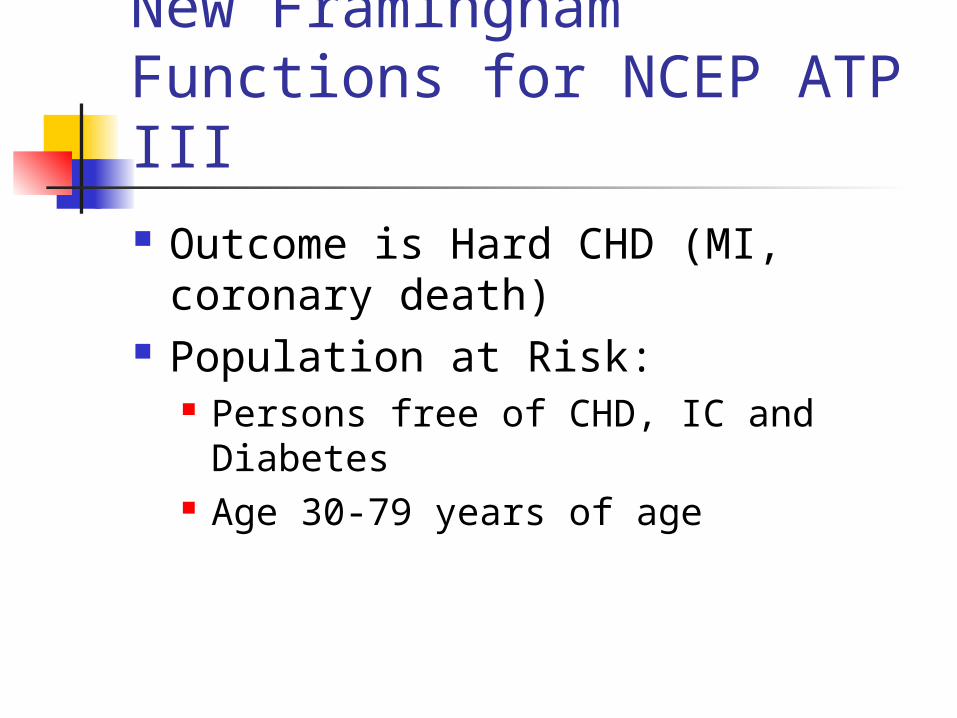
New Framingham Functions for NCEP ATP III Outcome is Hard CHD (MI,
coronary death) Population at Risk:
Persons free of CHD, IC and Diabetes Age 30-79 years of age
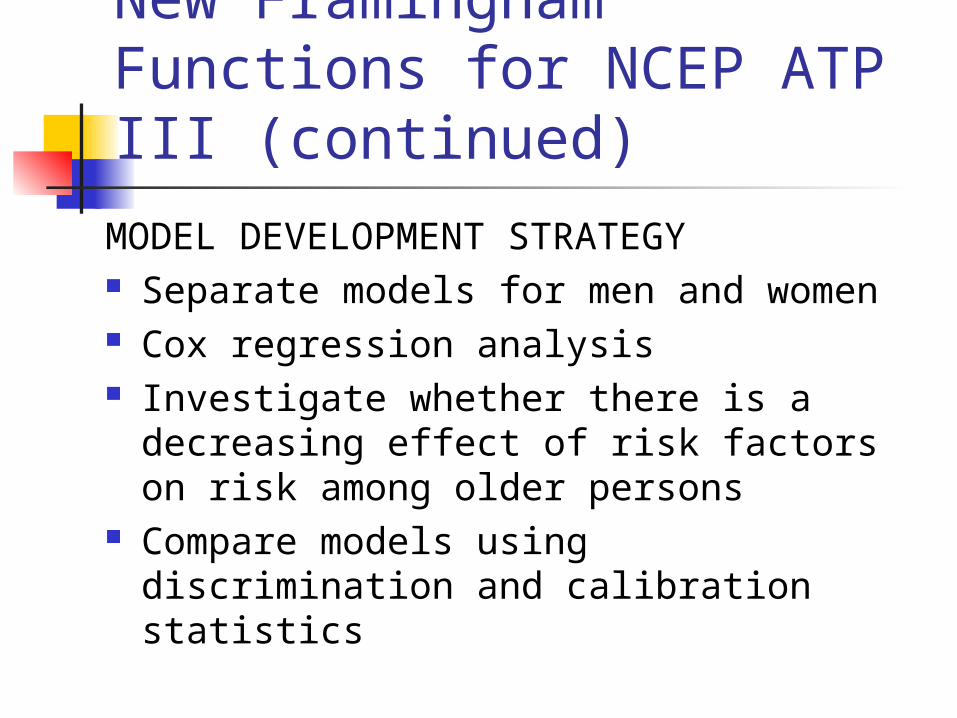
New Framingham Functions for NCEP ATP III (continued)
MODEL DEVELOPMENT STRATEGY Separate models for men and women Cox regression analysis Investigate whether there is a
decreasing effect of risk factors on risk among older persons
Compare models using discrimination and calibration statistics
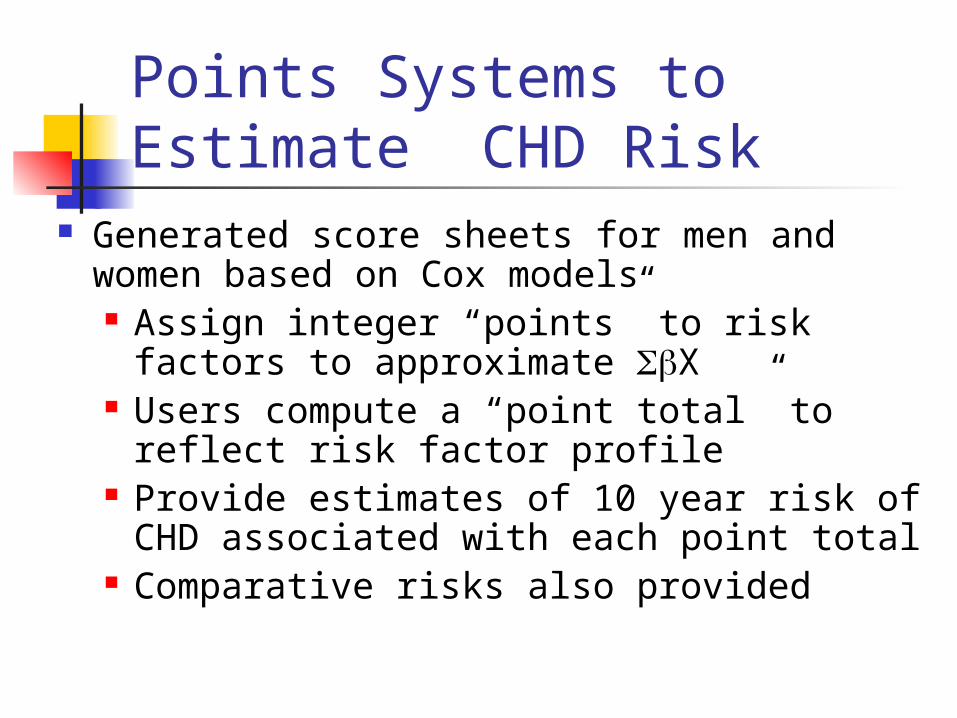
Points Systems to Estimate CHD Risk
Generated score sheets for men and women based on Cox models Assign integer “points” to risk factors to
approximate X Users compute a “point total” to reflect
risk factor profile Provide estimates of 10 year risk of CHD
associated with each point total Comparative risks also provided

ATP III Score Sheets: Men
Age 30-34 35-39 40-44 45-49 50-54 55-59 60-64 65-69 70-74 75-79 -9 -4 0 3 6 8 10 11 12 13
AgeTotal Cholesterol 30-39 40-49 50-59 60-69 70-79<160 0 0 0 0 0160-199 4 3 2 1 0200-239 7 5 3 1 0240-279 9 6 4 2 1> 280 11 8 5 3 1
AgeSmoking 30-39 40-49 50-59 60-69 70-79No 0 0 0 0 0Yes 8 5 3 1 1
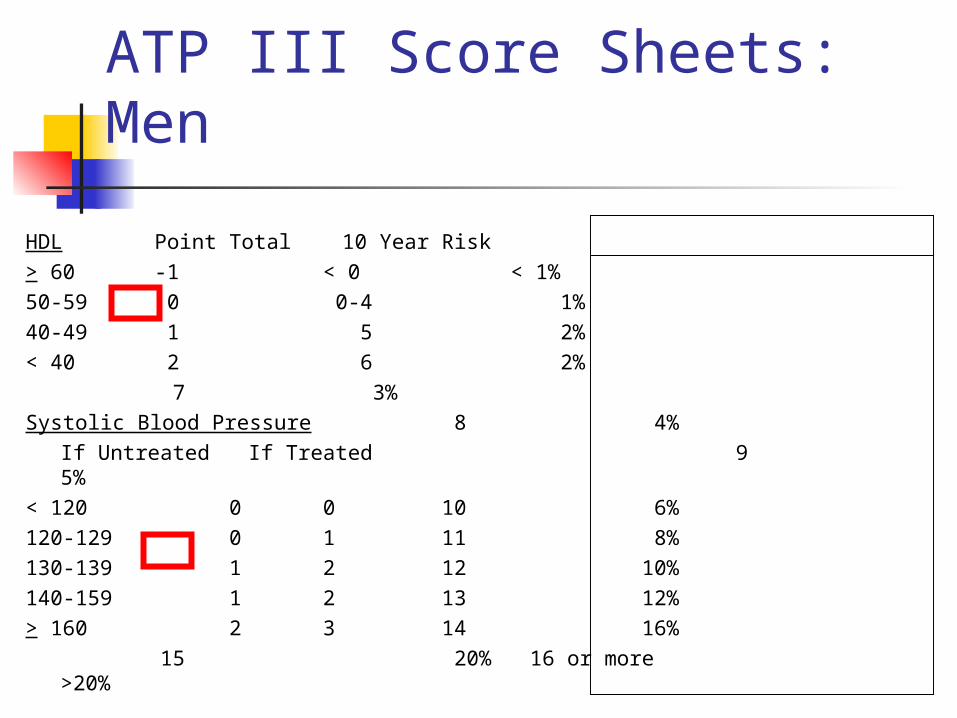
ATP III Score Sheets: Men
HDL Point Total 10 Year Risk> 60 -1 < 0 < 1%50-59 0 0-4 1%40-49 1 5 2% < 40 2 6 2%
7 3%Systolic Blood Pressure 8 4%
If Untreated If Treated 9 5%
< 120 0 0 10 6%120-129 0 1 11 8%130-139 1 2 12 10%140-159 1 2 13 12%> 160 2 3 14 16%
15 20%16 or more >20%
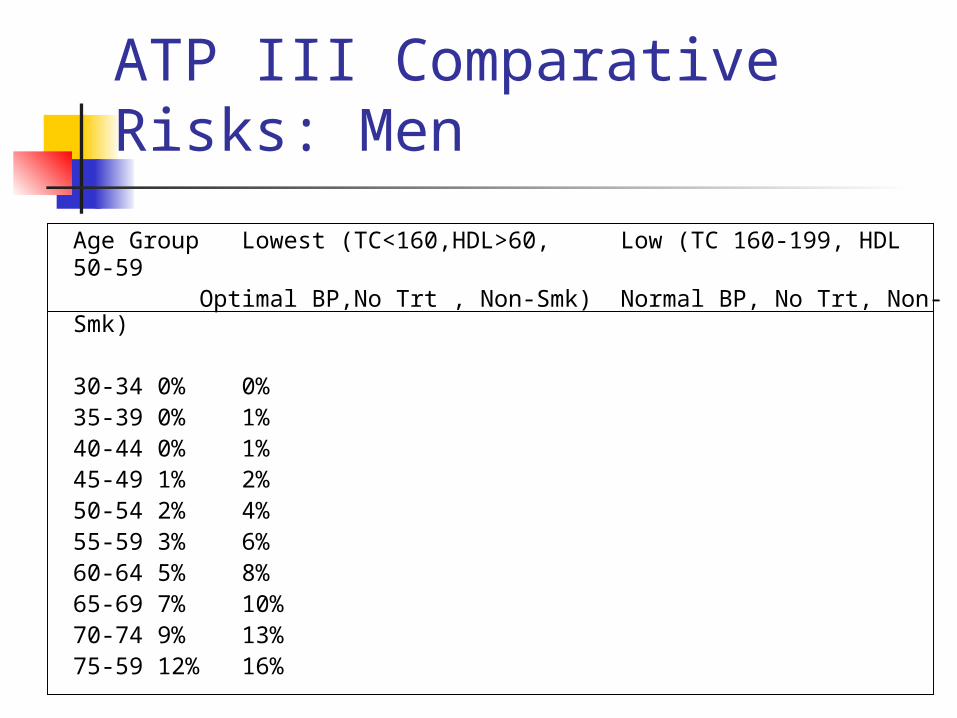
ATP III Comparative Risks: Men
Age Group Lowest (TC<160,HDL>60, Low (TC 160-199, HDL 50-59
Optimal BP,No Trt , Non-Smk) Normal BP, No Trt, Non-Smk)
30-34 0% 0%35-39 0% 1%40-44 0% 1%45-49 1% 2%50-54 2% 4%55-59 3% 6%60-64 5% 8%65-69 7% 10%70-74 9% 13%75-59 12% 16%
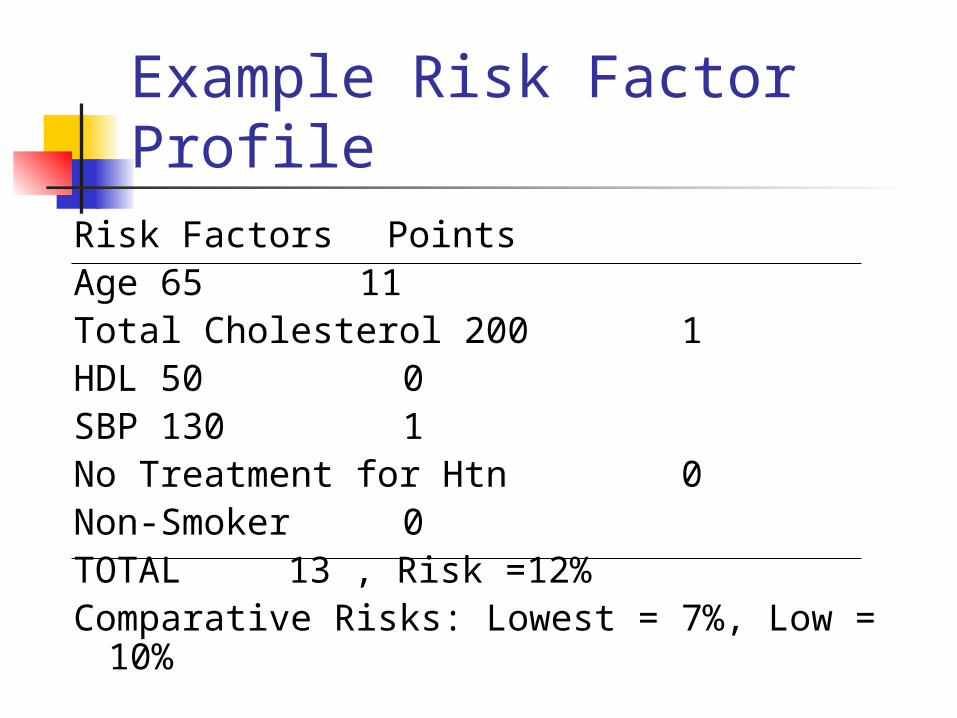
Example Risk Factor Profile
Risk Factors PointsAge 65 11Total Cholesterol 200 1HDL 50 0SBP 130 1No Treatment for Htn 0Non-Smoker 0TOTAL 13 , Risk =12%Comparative Risks: Lowest = 7%, Low = 10%
Score Sheets Provide accurate estimates of CHD
risk Widely disseminated Simple to use
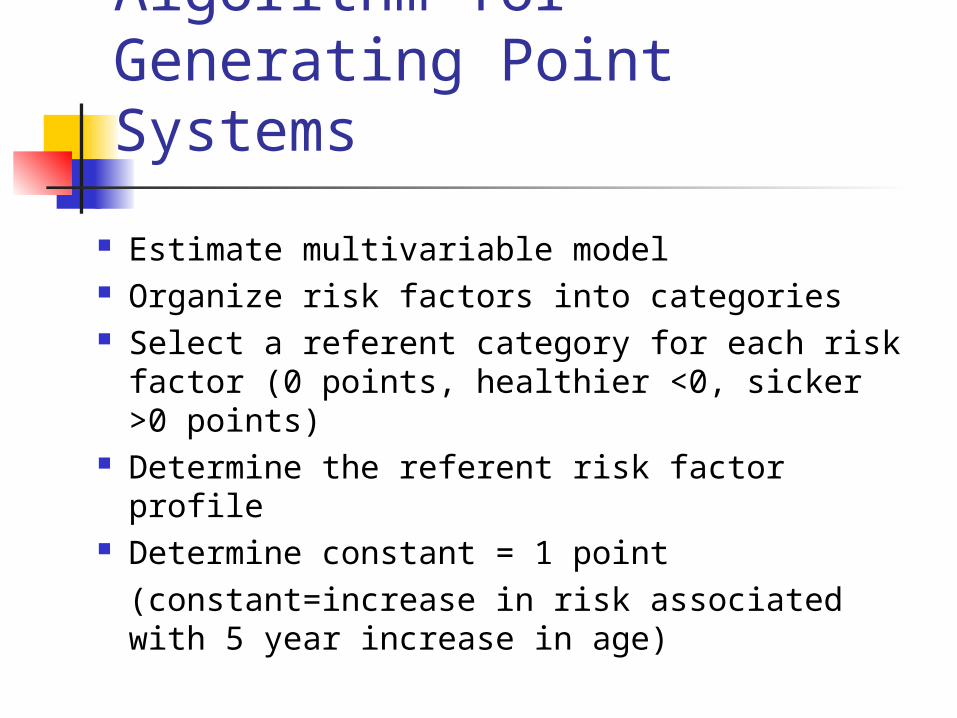
Algorithm for Generating Point Systems
Estimate multivariable model Organize risk factors into categories Select a referent category for each risk
factor (0 points, healthier <0, sicker >0 points)
Determine the referent risk factor profile Determine constant = 1 point
(constant=increase in risk associated with 5 year increase in age)
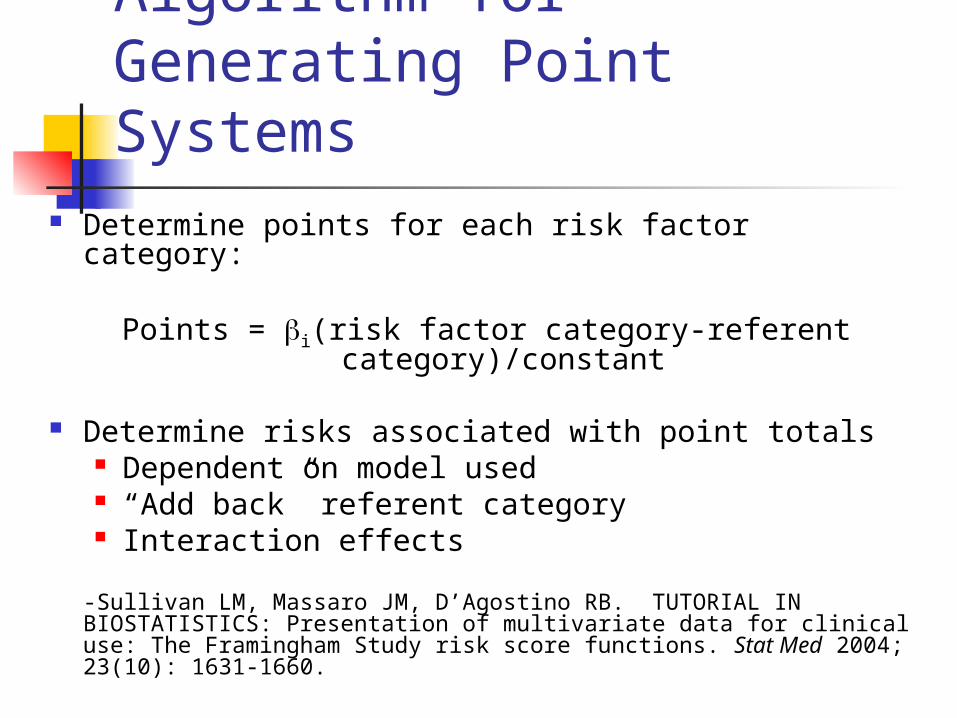
Algorithm for Generating Point Systems
Determine points for each risk factor category:
Points = i(risk factor category-referent category)/constant
Determine risks associated with point totals Dependent on model used “Add back” referent category Interaction effects
-Sullivan LM, Massaro JM, D’Agostino RB. TUTORIAL IN BIOSTATISTICS: Presentation of multivariate data for clinical use: The Framingham Study risk score functions. Stat Med 2004; 23(10): 1631-1660.
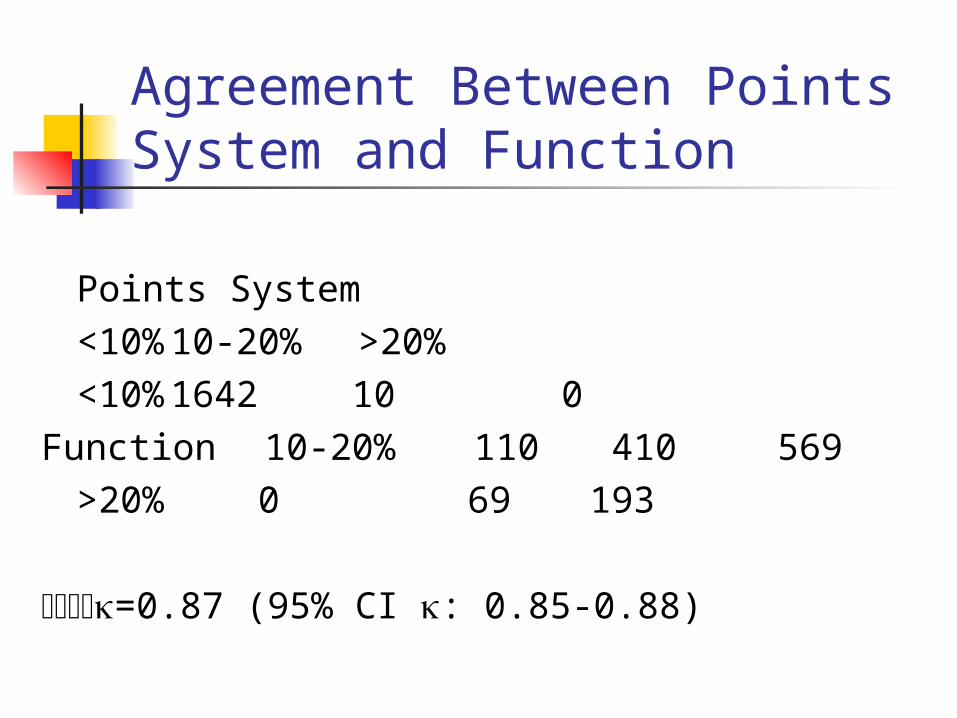
Agreement Between Points System and Function
Points System<10% 10-20% >20%
<10% 1642 10 0Function 10-20% 110 410 569
>20% 0 69 193
=0.87 (95% CI : 0.85-0.88)
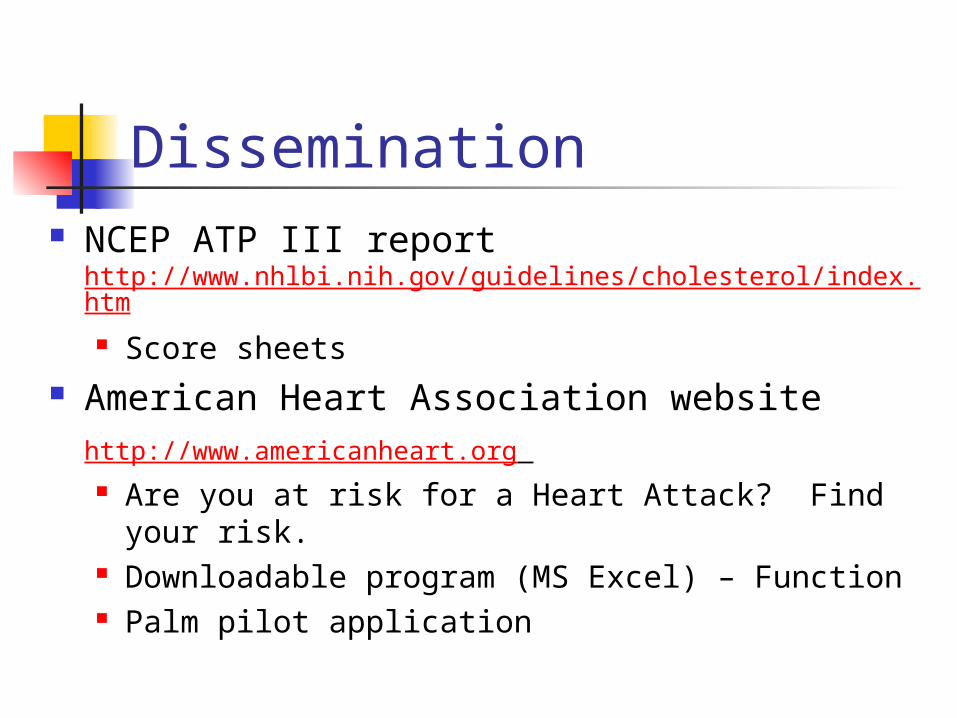
Dissemination NCEP ATP III report
http://www.nhlbi.nih.gov/guidelines/cholesterol/index.htm Score sheets
American Heart Association website http://www.americanheart.org
Are you at risk for a Heart Attack? Find your risk. Downloadable program (MS Excel) – Function Palm pilot application
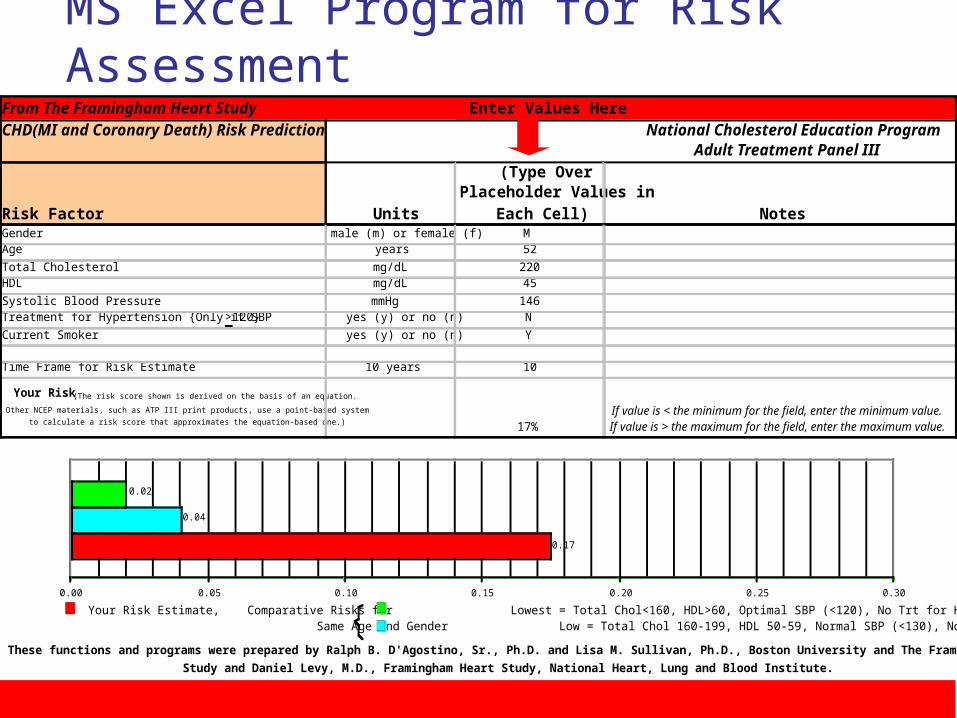
MS Excel Program for Risk Assessment
From The Framingham Heart Study Enter Values HereCHD(MI and Coronary Death) Risk Prediction National Cholesterol Education Program Adult Treatment Panel III
Risk Factor Units
(Type Over Placeholder Values in
Each Cell) NotesGender male (m) or female (f) M Age years 52
Total Cholesterol mg/dL 220 HDL mg/dL 45
Systolic Blood Pressure mmHg 146 Treatment for Hypertension {Only if SBP >120} yes (y) or no (n) N
Current Smoker yes (y) or no (n) Y
Time Frame for Risk Estimate 10 years 10
Your Risk (The risk score shown is derived on the basis of an equation.
Other NCEP materials, such as ATP III print products, use a point-based system
to calculate a risk score that approximates the equation-based one.) 0.17 17%
Tables for Graph
If value is < the minimum for the field, enter the minimum value. If value is > the maximum for the field, enter the maximum value.
These functions and programs were prepared by Ralph B. D'Agostino, Sr., Ph.D. and Lisa M. Sullivan, Ph.D., Boston University and The Framingham Heart
Study and Daniel Levy, M.D., Framingham Heart Study, National Heart, Lung and Blood Institute.
0.17
0.04
0.02
0.00 0.05 0.10 0.15 0.20 0.25 0.30
Your Risk Estimate, Comparative Risks for Lowest = Total Chol<160, HDL>60, Optimal SBP (<120), No Trt for Htn, Non-Smoker Same Age and Gender Low = Total Chol 160-199, HDL 50-59, Normal SBP (<130), No Trt for Htn, Non-Smoker
Summary
Framingham has been a leader in the development and dissemination of multivariable models to estimate CHD risk
Points system makes complex models useful in practice
Patients can also assess CHD risk over time
Problems/Issues “Points” system Vs. Function Comparing Functions
Population at risk Outcome (CHD, HCHD, Coronary
Death) Risk Factors Parameterization of Risk Factors
(categories, continuous)
Next Steps Adding novel risk factors (e.g., CRP,
Nutrition, Family History) Statistical Significance Vs. Improving
Prediction Measurement Issues (missing/incomplete data)
CI around risk estimates How to add CI to guidelines? Treatment depends on absolute risk
< 10%, 10-20%, >20%
Continuing validation work