life-cycle energy and emissions for municipal water and
TRANSCRIPT

Life-Cycle Energy and Emissions for Municipal Water and Wastewater Services:
Case-Studies of Treatment Plants in US
Malavika Tripathi
Report No. CSS07-06April 17, 2007


Life-Cycle Energy and Emissions for Municipal Water and Wastewater Services:
Case-Studies of Treatment Plants in US
By:
Malavika Tripathi
A project submitted in partial fulfillment of requirements for the degree of Master of Science
(Natural Resources and Environment)
University of Michigan Ann Arbor
April 17, 2007
A report of the Center for Sustainable Systems Report No. CSS07-06
Faculty Advisors: Professor Jonathan W. Bulkley Associate Professor Gregory A. Keoleian

Document Description
LIFE-CYCLE ENERGY AND IMPACT ASSESSMENT FOR WATER AND WASTEWATER SYSTEMS: CASE STUDIES IN US Malavika Tripathi Center for Sustainable Systems, Report No. CSS07-06 University of Michigan, Ann Arbor, Michigan April 17, 2007 122 pp., 24 tables, 104 figures, 10 appendices This document is available online at: http://css.snre.umich.edu
Center for Sustainable Systems School of Natural Resources and Environment University of Michigan 440 Church Street, Dana Building Ann Arbor, MI 48109-1041 Phone: 734-764-1412 Fax: 734-647-5841 Email: [email protected] Web: http://css.snre.umich.edu
© Copyright 2007 by the Regents of the University of Michigan


ii
Acknowledgments
I would like to express my sincere gratitude towards my thesis co-chairs- Professor
Jonathan Bulkley and Professor Gregory Keoleian for their patience, support and
guidance throughout the course of this research. The work would not have been
satisfactory without their constant feedback and thought-provoking discussions after each
stage.
It would have been extremely difficult if not impossible to pursue this study without the
support and cooperation of the authorities managing the treatment plants selected for
case-studies. I am thankful to Ms. Sue McCormick, Public Services Area Administrator,
City of Ann Arbor for being supportive of this study. I am very grateful for the
information provided by Mr. Sumedh Bahl, Ann Arbor Water Treatment Plant; and
Jeffrey Zabel and Charles Vogel, Ann Arbor Wastewater Treatment Plant. I would also
like to acknowledge the support of Mr. David Konkle and Mr. Andrew Brix, City of Ann
Arbor, Energy Office towards this study.
I am thankful to Mr. Joseph Schwall, City of Santa Rosa, Laguna Wastewater Treatment
Plant for sharing valuable information and addressing the questions and doubts with
patience. I am also grateful to Mike Jesse and Kurian Joychan, Ypsilanti Community
Utility Authority Wastewater Treatment Plant, for the information provided for this
research. My sincere thanks to Sarah Deslauriers for her guidance and encouragement at
the initial stages of the analysis. I am most grateful to Helaine Hunscher, Center for
Sustainable Systems, for taking care of all technicalities, ensuring that working at the
center is comfortable and encouraging at every step.
Lastly, I would like to express my gratitude to my family and loved-ones, for inspiring
me to do better each day. The last couple of years would have been extremely difficult to
survive without their love and support.
iii
Abstract
This study documents the energy intensity and environmental impacts from operation of
water and wastewater treatment systems through case-studies in US. Life-cycle energy
and impact assessments were conducted for the Ann Arbor Water Treatment Plant (WTP)
and Ann Arbor Wastewater Treatment Plant (WWTP) in Michigan. The framework for
assessment was modified to assess the environmental burdens from Laguna WWTP in
California and Ypsilanti Community Utility Authority (YCUA) WWTP in Michigan.
From the comparative assessment of the three WWTPs, it is found that the life-cycle
energy for the YCUA WWTP is the highest- 21 GJ/MG; out of which, 46% is from
electricity used for operation, 44% from natural gas used for the sludge incinerator and
10% from production of chemicals used for treatment. For Ann Arbor WWTP, electricity
utilized accounts for 50%, natural gas use for 25%, sludge-hauling for 16% and
chemicals used for 9% of the total life-cycle energy of 16 GJ/MG. The life-cycle energy
for the Laguna WWTP is the lowest - 11 GJ/MG, as it meets the total requirement for
natural gas and 40% of the electricity required from methane produced upon anaerobic
sludge digestion. Hence, 91% of the life-cycle energy for Laguna WWTP is from
electricity, 8% from chemicals and a mere 1% from sludge-disposal.
From the assessment of the Ann Arbor ‘water and wastewater’ system, it is found that the
Ann Arbor ‘water and wastewater’ treatment system accounts for 54% of the total
electricity required by the Ann Arbor municipal government sector. Further, the life-
cycle energy required for the system is 40 GJ/MG of clean water, out of which 60% is
from the operation of the Ann Arbor WTP. The system also generates 5,230 kg CO2 eq.
/MG clean water or 3.57 million kg CO2 eq. per year. Electricity required for operation of
the Ann Arbor WTP and WWTP contributes significantly to the total life-cycle energy
and emissions. Thus, energy conservation at the plants, adoption of renewable energy and
an anaerobic sludge digestion system coupled with co-generation unit would prove to be
useful for reducing the total life-cycle energy and environmental burdens from the
system.

iv
Contents
Acknowledgments............................................................................................................... ii Abstract .............................................................................................................................. iii Contents ............................................................................................................................. iv List of Tables .................................................................................................................... vii List of Figures ................................................................................................................... vii Summary ............................................................................................................................. 1 Chapter 1 Introduction................................................................................................. 6
1.1 Background......................................................................................................... 6 1.2 Rationale ............................................................................................................. 7 1.3 Thesis Statement ................................................................................................. 8 1.4 Scope of Study .................................................................................................... 9 1.5 Methodology..................................................................................................... 10
1.5.1 Life-cycle Energy and Impact Assessment............................................... 11 1.5.2 LCEIA Modeling and Key Parameters for Assessment ........................... 12 1.5.3 Functional Unit ......................................................................................... 16 1.5.4 Data Quality and Key Assumptions.......................................................... 17
1.6 Literature Overview and Previous Studies ....................................................... 18 Chapter 2 Ann Arbor Water Treatment Plant ......................................................... 21
2.1 Background....................................................................................................... 21 2.2 Water Treatment ............................................................................................... 21 2.3 Total Flow......................................................................................................... 23 2.4 Electricity Consumption ................................................................................... 26 2.5 Natural Gas Utilization ..................................................................................... 28 2.6 Chemicals Utilized for Treatment..................................................................... 29 2.7 Life-Cycle Energy Consumption for Operation of Ann Arbor WTP ............... 41 2.8 Life-Cycle Impacts from Operation of Ann Arbor WTP.................................. 43
Chapter 3 Ann Arbor Wastewater Treatment Plant................................................ 52
3.1 Background....................................................................................................... 52 3.2 Wastewater Treatment ...................................................................................... 52 3.3 Total Flow......................................................................................................... 53 3.3 Electricity Utilization........................................................................................ 54 3.4 Natural Gas Utilization ..................................................................................... 56 3.4 Chemicals Utilized for Treatment..................................................................... 57 3.5 Sludge Disposal ................................................................................................ 59 3.6 Life-cycle Energy Consumption for Operation of Ann Arbor WWTP ............ 65 3.7 Life-cycle Emissions from Operation of Ann Arbor WWTP........................... 67
Chapter 4 Laguna Wastewater Treatment Plant ..................................................... 76
4.1 Background....................................................................................................... 76 4.2 Wastewater Treatment ...................................................................................... 76

v
4.3 Total Flow......................................................................................................... 78 4.4 Electricity Utilization........................................................................................ 79 4.4 Natural Gas Utilization ..................................................................................... 81 4.5 Chemicals Utilized for Treatment..................................................................... 83 4.6 Sludge Disposal ................................................................................................ 84 4.7 Life-cycle Energy for Operation of the Laguna WWTP .................................. 85 4.8 Life-Cycle Emissions from Operation of Laguna WWTP ............................... 86
Chapter 5 Comparative Assessment for Wastewater Treatment Plants ................ 93
5.1 Background....................................................................................................... 93 5.2 Total Flow......................................................................................................... 93 5.2 Electricity Utilization........................................................................................ 94 5.3 Natural Gas Utilization ..................................................................................... 96 5.4 Energy Required for Production of Chemicals Utilized ................................... 98 5.4 Energy Required for Sludge Disposal............................................................. 100 5.5 Total Life-cycle Energy for Operation of the WWTPs .................................. 104 5.6 Conclusions and Recommendations ............................................................... 106
Chapter 6 Ann Arbor Water and Wastewater Treatment System ....................... 109
6.1 Background..................................................................................................... 109 6.2 Total Flow....................................................................................................... 109 6.3 Water Quality.................................................................................................. 113 6.4 Electricity Utilization...................................................................................... 114 6.4 Life-cycle Energy for the Ann Arbor Water and Wastewater System ........... 116 6.5 Life-cycle Emissions from Ann Arbor Water and Wastewater System ......... 118 6.6 Conclusions..................................................................................................... 120 6.7 Recommendations and Future Directions....................................................... 121
Appendix A-I Ann Arbor WTP - Energy Consumption ........................................ 123
b. Ann Arbor Water Treatment Plant – Electrical Consumption........................ 126 c. Ann Arbor Water Treatment Plant – Chemicals Utilized for Treatment ........ 129
Appendix A-II Ann Arbor WTP – Emissions Analysis.......................................... 132
a. Global Warming Potential............................................................................... 132 b. Eutrophication Potential.................................................................................. 135 c. Acidification Potential .................................................................................... 139
Appendix B-I Ann Arbor WWTP – Energy Consumption.................................... 142
a. Ann Arbor Wastewater Treatment Plant - Total Flow.................................... 142 b. Ann Arbor Wastewater Treatment Plant – Electricity Consumption ............. 144 c. Ann Arbor Wastewater Treatment Plant – Natural Gas Consumption ........... 147 d. Ann Arbor Wastewater Treatment Plant – Chemicals Utilized...................... 149 e. Ann Arbor Wastewater Treatment Plant – Sludge Disposal........................... 152
Appendix B-II Ann Arbor WWTP –Emissions Analysis ....................................... 157
a. Ann Arbor Wastewater Treatment Plant – Global Warming Potential........... 157

vi
b. Ann Arbor Wastewater Treatment Plant – Eutrophication Potential.............. 159 Appendix C-I Laguna WWTP – Energy Consumption ......................................... 163
a. Details of the Subregional Recycling System................................................. 163 b. Details of the Geysers Recharge Project......................................................... 164 c. Total flow at Laguna WWTP.......................................................................... 165 d. Electricity Consumption at the Laguna WWTP ............................................. 167 e. Natural Gas Consumption at the Laguna WWTP........................................... 170 f. Chemicals Utilized for Treatment at the Laguna WWTP ............................... 173
Appendix C-II Laguna WWTP – Emissions Analysis............................................ 178
a. Global Warming Potential....................................................................................... 178 b. Eutrophication Potential.......................................................................................... 181 c. Acidification Potential ............................................................................................ 182
Appendix D Details of YCUA WWTP ..................................................................... 183
a. Background ............................................................................................................. 183 b. Plant Influent........................................................................................................... 183 c. Electricity Consumption.......................................................................................... 184 d. Chemicals Utilized for Treatment........................................................................... 185 e. Sludge Handling...................................................................................................... 187 f. Life-cycle Energy for Operation of YCUA WWTP................................................ 190 g. Life-cycle Impacts from Operation of YCUA WWTP........................................... 191
Appendix E Water Quality Information on Ann Arbor WWTP .......................... 193 Appendix F-I Energy Calculations for Chemicals .................................................. 196
a. Energy Factors and Values for Chemicals .............................................................. 196 b. Energy Calculation for Fluoride ............................................................................. 197 c. Energy Calculation for Sodium Hexametaphosphate ............................................. 197
Appendix F-II Emisions Calculations ...................................................................... 198
a. Emissions from Electricity...................................................................................... 198 b. Emissions from Natural Gas ................................................................................... 199 c. Emissions from Diesel ............................................................................................ 200
Bibliography .................................................................................................................. 201

vii
List of Tables
TABLE 1-1 MATERIAL PRODUCTION ENERGY FOR CHEMICALS UTILIZED ...............................................13
TABLE 1-2 ENVIRONMENTAL IMPACTS FROM PRODUCTION OF CHEMICALS ............................................15
TABLE 1-2 ENVIRONMENTAL IMPACT FACTORS BASED ON 100-YEAR TIME HORIZON ............................16
TABLE 2-1 LIFE-CYCLE ENERGY FOR OPERATION OF ANN ARBOR WATER TREATMENT PLANT .............42
TABLE 2-2 GLOBAL WARMING POTENTIAL FOR THE ANN ARBOR WTP (KG CO2 EQUIV. /MG)...............44
TABLE 2-3 EUTROPHICATION POTENTIAL FOR ANN ARBOR WTP............................................................49
TABLE 2-5 ACIDIFICATION POTENTIAL FOR ANN ARBOR WTP................................................................49
TABLE 3-1 SLUDGE DISPOSAL FOR ANN ARBOR WWTP..........................................................................64
TABLE 3-2 LIFE-CYCLE ENERGY CONSUMED FOR OPERATION OF ANN ARBOR WWTP ..........................65
TABLE 3-3 GLOBAL WARMING POTENTIAL FROM ANN ARBOR WWTP (KG CO2 EQ. /MG).....................69
TABLE 3-4 EUTROPHICATION POTENTIAL FOR OF ANN ARBOR WWTP (G N EQ. /MG)............................73
TABLE 3-5 ACIDIFICATION POTENTIAL FOR ANN ARBOR WWTP (KMOLES OF H+ EQ. /MG) ...................75
TABLE 4-1 ENERGY CONSUMPTION FOR SLUDGE HAULING FROM LAGUNA WWTP................................85
TABLE 5-1 SLUDGE DISPOSAL FOR YCUA WWTP FOR 2001 TO 2004..................................................100
TABLE 5-2 LIFE-CYCLE ENERGY AND IMPACTS - ANN ARBOR, YCUA & LAGUNA WWTPS ................106
TABLE 5-3 METHANE EMISSIONS FROM PROPOSED SLUDGE TREATMENT FOR THE WWTPS ................107
TABLE 6-1 ANN ARBOR WATER AND WASTEWATER SYSTEM –FLOW TO AND FROM HURON ...............112
TABLE 6-2 QUALITY OF WATER WITHDRAWN FROM HURON & WATER DISCHARGED TO HURON…… 114
TABLE 6-3 ELECTRICITY CONSUMPTION FOR ANN ARBOR MUNICIPAL GOVERNMENT SECTOR ............116
TABLE 6-4 LIFE-CYCLE ENERGY FOR THE ANN ARBOR WATER AND WASTEWATER SYSTEM ...............117
TABLE 6-5 GLOBAL WARMING POTENTIAL FOR ANN ARBOR WATER AND WASTEWATER SYSTEM…. 118
TABLE 6-6 EUTROPHICATION POTENTIAL FOR ANN ARBOR WATER AND WASTEWATER SYSTEM ........119
TABLE 6-7 ACIDIFICATION POTENTIAL FOR ANN ARBOR WATER AND WASTEWATER SYSTEM ............119
TABLE 6-8 ENERGY AND ENVIRONMENTAL IMPACTS FOR ANN ARBOR WATER & WASTEWATER
SYSTEM………. .................................................................................................................................120

viii
List of Figures
FIGURE 1-1. SCOPE OF STUDY FOR ANN ARBOR ‘WATER AND WASTEWATER’ SYSTEM..................................9 FIGURE 1-2. SCOPE OF STUDY FOR WASTEWATER TREATMENT PLANTS .......................................................10 FIGURE 1-3. LIFE-CYCLE ENERGY AND IMPACTS ASSESSMENT METHODOLOGY ...........................................11 FIGURE 2-1. PROCESS FLOW CHART FOR ANN ARBOR WATER TREATMENT PLANT (SOURCE: INFORMATION
PROVIDED BY THE ANN ARBOR WTP)..................................................................................................22 FIGURE 2-2. WATER ACQUISITION FOR ANN ARBOR WTP FROM HURON RIVER AND WELLS (MGD)...........23 FIGURE 2-3. WATER ACQUISITION FROM HURON RIVER AND WELLS FOR ANN ARBOR WTP (MG/MONTH).24 FIGURE 2-4. QUANTITY OF WATER DELIVERED FROM THE ANN ARBOR WTP TO THE CITY (MGD) .............24 FIGURE 2-5. QUANTITY OF WATER DELIVERED FROM THE ANN ARBOR WTP TO THE CITY (MG/MONTH) ...25 FIGURE 2-6. DIFFERENCE IN TOTAL QUANTITY WITHDRAWN AND DELIVERED AT ANN ARBOR WTP (MGD)
.............................................................................................................................................................26 FIGURE 2-7. ELECTRICITY UTILIZATION FOR ANN ARBOR WATER TREATMENT AND DISTRIBUTION SYSTEM
(KWH/MONTH) .....................................................................................................................................27 FIGURE 2-8. ELECTRICITY UTILIZATION FOR ANN ARBOR WATER TREATMENT AND DISTRIBUTION SYSTEM
(KWH/MG)...........................................................................................................................................27 FIGURE 2-9. NATURAL GAS UTILIZATION FOR THE ANN ARBOR WATER TREATMENT AND DISTRIBUTION
SYSTEM (CCF/YEAR) ...........................................................................................................................28 FIGURE 2-10. NATURAL GAS UTILIZATION FOR THE ANN ARBOR WATER TREATMENT AND DISTRIBUTION
SYSTEM (CCF/MG)..............................................................................................................................29 FIGURE 2-11. LIME UTILIZED FOR TREATMENT AT ANN ARBOR WTP (METRIC TONS/MONTH) .....................30 FIGURE 2-12. ENERGY CONSUMED FOR PRODUCTION OF LIME UTILIZED AT ANN ARBOR WTP (GJ/MONTH)
.............................................................................................................................................................30 FIGURE 2-13. CO2 UTILIZED FOR TREATMENT AT ANN ARBOR WTP (METRIC TONS/MONTH).......................31 FIGURE 2-14. TOTAL ENERGY CONSUMED FOR PRODUCTION OF CO2 UTILIZED AT ANN ARBOR WTP (GJ PER
MONTH) ................................................................................................................................................32 FIGURE 2-15. POLYMERS UTILIZED AS COAGULANTS FOR TREATMENT AT THE ANN ARBOR WTP (METRIC
TONS/MONTH).......................................................................................................................................33 FIGURE 2-16. ENERGY USED FOR PRODUCTION OF POLYMERS UTILIZED AT ANN ARBOR WTP (GJ/MONTH)
.............................................................................................................................................................33 FIGURE 2-17. OXYGEN UTILIZED FOR OZONE PRODUCTION AT ANN ARBOR WTP (METRIC TONS/MONTH) ..34 FIGURE 2-18. ENERGY REQUIRED FOR PRODUCTION OF OXYGEN UTILIZED AT ANN ARBOR WTP
(GJ/MONTH) .........................................................................................................................................35 FIGURE 2-19. SODIUM HYDROXIDE UTILIZED FOR TREATMENT AT ANN ARBOR WTP (METRIC TONS/MONTH)
.............................................................................................................................................................36 FIGURE 2-20. ENERGY REQUIRED FOR SODIUM HYDROXIDE UTILIZED AT ANN ARBOR WTP (GJ/MONTH) ..36

ix
FIGURE 2-21. SODIUM HEXAMETAPHOSPHATE UTILIZED FOR TREATMENT AT ANN ARBOR WTP (METRIC
TONS/MONTH).......................................................................................................................................37 FIGURE 2-22. ENERGY REQUIRED FOR PRODUCING SODIUM HEXAMETAPHOSPHATE UTILIZED AT ANN
ARBOR WTP (GJ/MONTH)....................................................................................................................38 FIGURE 2-23. AMMONIA AND HYPOCHLORITE USED AT ANN ARBOR WTP (METRIC TONS/MONTH) .............39 FIGURE 2-24. ENERGY REQUIRED FOR PRODUCING AMMONIA AND HYPOCHLORITE UTILIZED AT ANN ARBOR
WTP (GJ/MONTH) ................................................................................................................................39 FIGURE 2-25. FLUORIDE UTILIZED FOR TREATMENT AT ANN ARBOR WTP (METRIC TONS/MONTH) .............40 FIGURE 2-26. ENERGY CONSUMED FOR PRODUCING FLUORIDE UTILIZED AT ANN ARBOR WTP (GJ/MONTH)
.............................................................................................................................................................41 FIGURE 2-27. TOTAL LIFE-CYCLE ENERGY FOR OPERATION OF ANN ARBOR WTP (GJ/YEAR) .....................42 FIGURE 2-28. TOTAL LIFE-CYCLE ENERGY FOR OPERATION OF ANN ARBOR WTP (GJ/MG)........................43 FIGURE 2-29. LIFE-CYCLE GLOBAL WARMING POTENTIAL FROM THE ELECTRICITY, NATURAL GAS AND
CHEMICALS UTILIZED AT THE ANN ARBOR WTP (KG CO2 EQ. /MG)...................................................45 FIGURE 2-30. LIFE-CYCLE GLOBAL WARMING POTENTIAL DUE TO CARBON DIOXIDE, METHANE AND
NITROUS OXIDE EMISSIONS (KG CO2 EQ. /MG)....................................................................................46 FIGURE 2-31. ATMOSPHERIC EUTROPHICATION POTENTIAL FROM ELECTRICITY, CHEMICALS AND NATURAL
GAS UTILIZATION (G N EQ. /MG)..........................................................................................................47 FIGURE 2-32. ATMOSPHERIC EUTROPHICATION POTENTIAL OWING TO AMMONIA AND NOX EMISSIONS FROM
OPERATION OF ANN ARBOR WATER TREATMENT PLANT (G N EQ. /MG).............................................47 FIGURE 2-33. AQUATIC EUTROPHICATION POTENTIAL FROM ELECTRICITY, CHEMICALS AND NATURAL GAS
UTILIZATION AT THE ANN ARBOR WTP (G N EQ. /MG) .......................................................................48 FIGURE 2-34. AQUATIC EUTROPHICATION POTENTIAL FROM EMISSIONS (G N EQ. /MG)...............................48 FIGURE 2-35. ACIDIFICATION POTENTIAL FOR ANN ARBOR WTP FROM ELECTRICITY, CHEMICALS AND
NATURAL GAS UTILIZATION (KMOLES OF H+ EQ. /MG) .......................................................................50 FIGURE 2-36. ACIDIFICATION POTENTIAL DUE TO NH3, NOX, HCL AND SO2 EMISSIONS FROM OPERATION OF
ANN ARBOR WTP (KMOLES OF H+ EQ. /MG) .......................................................................................50 FIGURE 3-1. TREATMENT PROCESS FLOW FOR ANN ARBOR WWTP..............................................................52 FIGURE 3-2. TOTAL INFLUENT AT THE ANN ARBOR WASTEWATER TREATMENT PLANT (MGD) ..................53 FIGURE 3-3. TOTAL FLOW AT THE ANN ARBOR WASTEWATER TREATMENT PLANT (MG/MONTH) ...............54 FIGURE 3-4. TOTAL ELECTRICITY UTILIZATION FOR ANN ARBOR WWTP (KWH/MONTH)............................55 FIGURE 3-5. TOTAL ELECTRICITY UTILIZATION (KWH/MG)..........................................................................55 FIGURE 3-6. NATURAL GAS CONSUMPTION FOR ANN ARBOR WWTP (CCF/MONTH) ...................................56 FIGURE 3-7. NATURAL GAS UTILIZATION AT THE ANN ARBOR WWTP (CCF/MG) ......................................57 FIGURE 3-8. CHEMICALS UTILIZED AT THE ANN ARBOR WWTP (METRIC TONS/MONTH) .............................58 FIGURE 3-9. ENERGY REQUIRED FOR PRODUCTION OF CHEMICALS UTILIZED FOR TREATMENT AT THE ANN
ARBOR WWTP (GJ/MONTH) ................................................................................................................58

x
FIGURE 3-10. TOTAL VOLUME OF SLUDGE PRODUCED AT THE ANN ARBOR WWTP (KGAL/MONTH) ...........59 FIGURE 3-11. SLUDGE DISPOSAL AT LANDFILL AND LAND-APPLICATION SITES FOR ANN ARBOR WWTP
(KGAL/MONTH) ....................................................................................................................................60 FIGURE 3-12. WET WEIGHT OF SLUDGE TRANSPORTED FROM ANN ARBOR WWTP TO THE LANDFILL
(METRIC TONS/MONTH).........................................................................................................................60 FIGURE 3-13. DRY WEIGHT OF SLUDGE TRANSPORTED FROM ANN ARBOR WWTP TO THE LANDFILL
(METRIC TONS/MONTH).........................................................................................................................61 FIGURE 3-14. WET WEIGHT OF WATER AND SLUDGE TRANSPORTED FOR LAND-APPLICATION FROM ANN
ARBOR WWTP (METRIC TONS/MONTH) ...............................................................................................62 FIGURE 3-15. DRY WEIGHT OF SLUDGE TRANSPORTED FROM ANN ARBOR WWTP TO THE LAND-
APPLICATION SITES (METRIC TONS/MONTH) .........................................................................................62 FIGURE 3-16. WET WEIGHT OF SLUDGE TRANSPORTED FROM ANN ARBOR WWTP TO THE LANDFILL AND
LAND APPLICATION SITES (METRIC TONS/MONTH)...............................................................................63 FIGURE 3-17. DIESEL FUEL CONSUMPTION FOR SLUDGE HAULING (GALLONS/MONTH).................................64 FIGURE 3-18. TOTAL LIFE-CYCLE ENERGY FOR OPERATION OF ANN ARBOR WASTEWATER TREATMENT
PLANT (GJ/YEAR) ................................................................................................................................66 FIGURE 3-17. TOTAL LIFE-CYCLE ENERGY FOR OPERATION OF ANN ARBOR WWTP (GJ/MG) ....................67 FIGURE 3-20. LIFE-CYCLE GLOBAL WARMING POTENTIAL FROM ELECTRICITY, CHEMICALS, NATURAL GAS
AND DIESEL FUEL UTILIZED AT ANN ARBOR WWTP (KG CO2 EQ. /MG) .............................................68 FIGURE 3-21. LIFE-CYCLE GLOBAL WARMING POTENTIAL FROM CARBON DIOXIDE, NITROUS OXIDE AND
METHANE EMISSIONS AT THE ANN ARBOR WWTP (KG CO2 EQ./MG).................................................69 FIGURE 3-22. ATMOSPHERIC EUTROPHICATION POTENTIAL FROM ELECTRICITY, CHEMICALS, NATURAL GAS
AND DIESEL FUEL USED AT ANN ARBOR WWTP (G N EQ. /MG) .........................................................70 FIGURE 3-23. ATMOSPHERIC EUTROPHICATION POTENTIAL FROM AMMONIA AND NITROGEN OXIDE
EMISSIONS AT ANN ARBOR WWTP (G N EQ. /MG)..............................................................................71 FIGURE 3-24. AQUATIC EUTROPHICATION POTENTIAL FROM ELECTRICITY, NATURAL GAS AND DIESEL FUEL
UTILIZED AT ANN ARBOR WWTP (G N EQ. /MG)................................................................................71 FIGURE 3-25. AQUATIC EUTROPHICATION POTENTIAL FROM ELECTRICITY, NATURAL GAS AND DIESEL FUEL
CONSUMPTION FOR ANN ARBOR WWTP (G N EQ. /MG)......................................................................72 FIGURE 3-24. ACIDIFICATION POTENTIAL FROM ELECTRICITY, CHEMICALS, NATURAL GAS AND DIESEL FUEL
USED AT ANN ARBOR WWTP (KMOLES H+ EQ. /MG)..........................................................................73 FIGURE 3-25. ACIDIFICATION POTENTIAL FOR ANN ARBOR WWTP (KMOLES H+ EQ. /MG TREATED) ..........74 FIGURE 4-1. FLOW DIAGRAM OF THE TREATMENT PROCESS AT THE LAGUNA WWTP..................................77 FIGURE 4-2. TOTAL PLANT INFLUENT RECEIVED AT LAGUNA WWTP (MGD)..............................................78 FIGURE 4-3. TOTAL PLANT INFLUENT RECEIVED AT LAGUNA WWTP (MG/MONTH)....................................79 FIGURE 4-4. ELECTRICITY UTILIZATION FOR OPERATION OF LAGUNA WWTP (KWH/MONTH) .....................80

xi
FIGURE 4-5. ELECTRICITY SUPPLIED FROM THE GRID AND CO-GENERATORS AT THE PLANT FOR OPERATION
OF LAGUNA WWTP (KWH/MONTH) .....................................................................................................80 FIGURE 4-6. ELECTRICITY UTILIZED FROM THE GRID FOR OPERATION OF LAGUNA WWTP (KWH/MG) ......81 FIGURE 4-7. NATURAL GAS UTILIZATION AT THE LAGUNA WWTP (CCF/MONTH).......................................82 FIGURE 4-8. NATURAL GAS UTILIZATION AT THE LAGUNA WWTP (CCF/MG)............................................82 FIGURE 4-9. CHEMICALS UTILIZED FOR TREATMENT AT THE LAGUNA WWTP (METRIC TONS/MONTH)........83 FIGURE 4-10. TOTAL ENERGY REQUIRED FOR PRODUCTION OF CHEMICALS UTILIZED FOR TREATMENT AT
THE LAGUNA WWTP (GJ/MONTH).......................................................................................................84 FIGURE 4-11. TOTAL LIFE-CYCLE ENERGY FOR OPERATION OF LAGUNA WWTP (GJ/YR) ............................85 FIGURE 4-12. TOTAL LIFE-CYCLE ENERGY FOR OPERATION OF THE LAGUNA WWTP (GJ/MG) ...................86 FIGURE 4-13. GLOBAL WARMING POTENTIAL FOR LAGUNA WWTP (KG CO2 EQ. /MG)...............................87 FIGURE 4-14. ATMOSPHERIC EUTROPHICATION POTENTIAL FROM ELECTRICITY, NATURAL GAS
COMBUSTION, CHEMICALS AND DIESEL FUEL USE AT THE LAGUNA WWTP (G N EQ. /MG)................88 FIGURE 4-15. ATMOSPHERIC EUTROPHICATION POTENTIAL FROM AMMONIA AND NITROGEN OXIDE
EMISSIONS AT THE LAGUNA WWTP (G N EQ. /MG).............................................................................89 FIGURE 4-16. AQUATIC EUTROPHICATION POTENTIAL FOR LAGUNA WWTP (G N EQ. /MG) ........................90 FIGURE 4-17. AQUATIC EUTROPHICATION POTENTIAL FROM EMISSIONS AT THE LAGUNA WWTP (G N EQ.
/MG) ....................................................................................................................................................90 FIGURE 4-18. ACIDIFICATION POTENTIAL FROM ELECTRICITY, NATURAL GAS, CHEMICALS AND DIESEL FUEL
FOR LAGUNA WWTP (KMOLES OF H+ EQ. / MG)..................................................................................91 FIGURE 4-19. ACIDIFICATION POTENTIAL FROM NH3, NOX, HCL AND SO2 EMISSIONS AT LAGUNA WWTP
(KMOLES OF H+ EQ. / MG) ....................................................................................................................92 FIGURE 5-1. TOTAL PLANT INFLUENT FOR ANN ARBOR, LAGUNA AND YCUA WASTEWATER TREATMENT
PLANTS (MG/MONTH) ..........................................................................................................................94 FIGURE 5-2. ELECTRICITY UTILIZATION FOR OPERATION OF ANN ARBOR, YCUA AND LAGUNA WWTP
(KWH/MONTH) .....................................................................................................................................95 FIGURE 5-3. ELECTRICITY UTILIZATION FOR OPERATION OF ANN ARBOR, YCUA AND LAGUNA WWTP
(GJ/MG)...............................................................................................................................................95 FIGURE 5-4. NATURAL GAS UTILIZATION AT ANN ARBOR, YCUA AND LAGUNA WWTP (CCF/MONTH) ....97 FIGURE 5-5. NATURAL GAS UTILIZATION AT ANN ARBOR, YCUA AND LAGUNA WWTP (GJ/MG).............97 FIGURE 5-6. ENERGY REQUIRED FOR PRODUCTION OF CHEMICALS UTILIZED AT ANN ARBOR, YCUA AND
LAGUNA WWTPS (GJ/MONTH) ............................................................................................................99 FIGURE 5-7. ENERGY REQUIRED FOR PRODUCTION OF CHEMICALS UTILIZED AT ANN ARBOR, YCUA AND
LAGUNA WWTPS (GJ/MG) .................................................................................................................99 FIGURE 5-8. TOTAL VOLUME OF SLUDGE GENERATED IN AT THE ANN ARBOR AND YCUA WWTPS
(KGAL/MONTH) ..................................................................................................................................101

xii
FIGURE 5-9. ENERGY REQUIRED FOR SLUDGE DISPOSAL FOR ANN ARBOR AND YCUA WWTP (GJ/MONTH)
...........................................................................................................................................................102 FIGURE 5-10. ENERGY REQUIRED FOR SLUDGE DISPOSAL FOR ANN ARBOR AND YCUA WWTP (GJ/MG)103 FIGURE 5-11. LIFE-CYCLE ENERGY FOR ANN ARBOR AND YCUA WWTPS IN 2003 (GJ/MG)....................104 FIGURE 5-11. LIFE-CYCLE ENERGY FOR ANN ARBOR AND YCUA WWTPS IN 2004 (GJ/MG)....................105 FIGURE 6-1. ANN ARBOR WATER AND WASTEWATER SYSTEM – DRINKING WATER DELIVERED FROM THE
ANN ARBOR WTP VS. WASTEWATER TREATED AT THE ANN ARBOR WWTP (MG/MONTH).............110 FIGURE 6-2. ANN ARBOR WATER AND WASTEWATER SYSTEM – DIFFERENCE IN WASTEWATER COLLECTED
AT THE WWTP AND DRINKING WATER DELIVERED FROM THE WTP (MG/MONTH)...........................110 FIGURE 6-3. ANN ARBOR WATER AND WASTEWATER SYSTEM – RAW WATER OBTAINED FROM HURON BY
THE WTP VS. TREATED WASTEWATER DISCHARGED FROM THE WWTP (MG/MONTH)....................111 FIGURE 6-4. ANN ARBOR WATER AND WASTEWATER SYSTEM – DIFFERENCE IN TREATED EFFLUENT
DISCHARGED FROM WWTP AND RAW WATER OBTAINED AT WTP FROM HURON (MG/MONTH) .....112 FIGURE 6-5. ANN ARBOR WATER AND WASTEWATER SYSTEM – ELECTRICITY UTILIZATION (KWH/MONTH)
...........................................................................................................................................................115 FIGURE 6-6. ANN ARBOR WATER AND WASTEWATER SYSTEM – ELECTRICITY UTILIZATION (GJ/MG)......115 FIGURE 6-6. TOTAL LIFE-CYCLE ENERGY FOR THE ANN ARBOR WATER AND WASTEWATER SYSTEM (GJ/YR)
...........................................................................................................................................................117

1
Summary
Water utilities and wastewater facilities require significant amounts of energy to collect,
treat and deliver drinking water as well as collect, treat and discharge treated wastewater.
Consequently, these systems are pivotal for any municipality in terms of direct costs and
indirect costs such as environmental impacts associated with high energy consumption.
Hence, in-depth research analyzing energy consumption at all stages in water and
wastewater systems is vital for identifying and mitigating inefficiencies in the system
consequently reducing energy consumption. This study carries forth the initiative taken
by the Center for Sustainable Systems, at the University of Michigan, through -
‘Preliminary Application of Life-cycle Assessment to U.S. Water and Wastewater
Treatment Facilities’, developing an initial framework to evaluate life-cycle
environmental performance of water and wastewater treatment plants in US.
This study employs life-cycle assessments for analyzing the sustainability of four case-
studies in the US using total life-cycle energy and impacts as indicators. The treatment
plants analyzed as part of this research are- Ann Arbor Water Treatment Plant (WTP),
Ann Arbor Wastewater Treatment Plant (WWTP), Laguna WWTP and Ypsilanti
Community Utility Authority WWTP. The analysis is based on data collected from each
plant for six years from 2000 to 2005. The total life-cycle energy, in Giga Joules per
million gallons (GJ/MG) required for operation of each plant, is calculated based on the
utilization of electricity, natural gas, chemicals and diesel fuel. Further, emissions
generated due to the operation of these plants have been categorized into global warming
potential (kg CO2 eq. /MG), eutrophication potential (g N eq. /MG) and acidification
potential (kmoles of H+ eq. /MG).
The life-cycle energy for operation of the Ann Arbor WTP is 24 GJ/MG of drinking
water delivered to the customers in Ann Arbor. Electricity required for operation
accounts for 36%, energy required for production of chemicals accounts for 35% and
natural gas used for heating contributes 28% of the total life-cycle energy for the plant.
Further, the global warming potential from operation of the Ann Arbor WTP is 3,300 kg

2
CO2 eq. /MG, out of which emissions from electricity contribute 56% and emissions from
production of chemicals used for treatment, contribute 34%.
Presently, the operation of Ann Arbor Wastewater Treatment Plant (WWTP) requires
life-cycle energy of 16 GJ/MG wastewater treated at the plant. Electricity utilization
accounts for 50%, natural gas use for 26%, diesel fuel used for sludge hauling for 16%
and energy consumed for production of chemicals for 9% of the total life-cycle energy
for the plant. The total global warming potential from operation of the plant is 1,984 kg
CO2 eq. /MG, out of which emissions from electricity contribute 87%, emissions from
sludge-hauling contribute 9% and emissions from production of chemicals required for
treatment contribute 5%.
The results obtained from the assessment of Ann Arbor WWTP were compared with the
assessments of Laguna WWTP and YCUA WWTP. A summary of the results is provided
below-
Life-cycle
Energy
Global Warming Potential
Atmospheric Eutrophication
Potential
Aquatic Eutrophication
Potential Acidification
Potential Wastewater Treatment Plant
GJ/MG kg CO2 eq./MG g N eq./MG g N eq./MG kmoles H+
eq./MG Ann Arbor WWTP 16 1,984 291 3 673Laguna WWTP 11 2,192 204 4 629YCUA WWTP 21 2,747 222 4 1094
The total life cycle energy for the Laguna WWTP is the lowest of the three WWTPs despite
the fact that its electricity utilization is higher than that of the Ann Arbor WWTP and the
YCUA WWTP. This is due to the adoption of an anaerobic digestion system coupled with a
co-generation facility at the plant. The methane emissions from sludge treatment are utilized
for meeting the total natural gas requirement for the plant and 40% of the electricity
requirement for operation. As a result, the life-cycle energy and emissions from the plant are
reduced. Electricity imported from the grid accounts for 91%, production of chemicals used
for treatment for 8% and sludge disposal accounts for 1% of the total life-cycle energy for the
plant. Further, emissions from electricity imported from the grid are responsible for 99% of
the total global warming potential from the plant.

3
On the other hand, the life-cycle energy for YCUA WWTP is the highest of the three
WWTPs analyzed. YCUA WWTP employs a sludge incineration unit for management of
sludge produced upon treatment, due to which the natural gas consumption is four times
higher than the Ann Arbor WWTP. Further, the energy for production of chemicals used at
the plant is also higher than that of the chemicals used at the Ann Arbor and Laguna
WWTPs. Electricity utilization and natural gas use dominate the total life-cycle energy for
operation of the plant contributing 46% and 44% respectively. Greenhouse gas emissions
from electricity used contribute 79% and emissions from natural gas use contribute 20% of
the total life cycle global warming potential.
The main factor distinguishing YCUA WWTP from the other two facilities is the
adoption of incineration for sludge disposal which increases the natural gas use at the
plant significantly leading to high life-cycle energy and emissions from operation of the
plant. Similarly, a major drawback of the method of sludge disposal for Ann Arbor
WWTP was a long one-way distance to the landfill, which increases the diesel fuel
consumption and consequently the total life-cycle energy and emissions from operation
of the plant. The life-cycle energy for both Ann Arbor and YCUA WWTPs could be
reduced by adoption of a closed anaerobic sludge treatment system. A comparison of the
methane produced from such a system and natural gas requirement for both facilities is
shown below-
Natural Gas Requirement per month (Average)
Methane Production from Sludge Treatment per month (Average) Wastewater
Treatment Plant CCF CCF Ann Arbor WWTP 17,706 24,439,602YCUA WWTP 58,438 23,298,000
Hence, the methane produced at YCUA and Ann Arbor WWTP can be utilized for
meeting the respective natural gas requirements at the plant completely and generating
part of the electricity required for operation.
Reduction of energy consumption through such changes in the process or technology
would eventually reduce the environmental burdens for the city or town governments
responsible for operation of these plants. For instance, the Ann Arbor WTP and Ann

4
Arbor WWTP together utilize 54% of the total direct electrical energy requirement of the
Ann Arbor municipal government sector.
Year Ann Arbor WTP Ann Arbor WWTP Ann Arbor WTP and
WWTP
Ann Arbor Municipal Govt. Sector
kWh % of Total
kWh % of Total
kWh % of Total
kWh 2000
11,631,010 25 13,726,765 29 25,357,775 54 46,681,772
Electricity for operation, natural gas for heating and chemicals required for treatment
comprise of a large percentage of the total life-cycle energy of 216,000 GJ/year for the
system. This energy is equivalent to the life-cycle energy for 2160 passenger cars and
685 residential homes. Further, the emissions from the operation of the WTP and the
WWTP lead to a global warming potential of 5,230 kg CO2 eq. /MG clean water or 3.57
million kgs CO2 eq. /year. The key findings for the Ann Arbor ‘water and wastewater’
treatment system based on an analysis of 1 million gallons of clean water are compiled
below-
Year Life-cycle Energy for Operation
Total Global Warming Potential
Atmospheric Eutrophication
Potential
Aquatic Eutrophication
Potential Acidification
Potential
GJ/MG kg CO2 eq./MG g N eq./ MG G N eq./ MG kmoles H+
eq./MG 2003 40 5213 534 14 12402004 40 5250 505 13 1174
While the operation of water and wastewater treatment plants is essential for public
health and environmental management, in light of the increasing global demands for
energy, it is imperative to reduce the energy used at these facilities. In general, adoption
of renewable energy for meeting part of the energy requirement would reduce the
burdens from these facilities greatly. Also, case-specific and innovative solutions may be
required for different treatment plants. For example, although sludge disposal at landfill
and land-application sites for the Ann Arbor WWTP is less energy expensive than the
energy required for sludge incineration at the YCUA, further improvement would lead to
reduced energy consumption for the Ann Arbor WWTP if nearer disposal sites are used.

5
While this study has prepared a detailed framework for life-cycle energy and impacts
assessment for water and wastewater treatment plants, further research is needed in this
field. For example, it would be very useful if further studies employ separate meters for
gauging the energy consumption at each stage of treatment. Also, incorporation of the
initial construction and decommissioning of these plants would provide a more
comprehensive assessment for water and wastewater treatment plants. Further, economic
modeling coupled with life-cycle energy assessment would provide clearer picture of the
feasibility of the opportunities identified for improvement. The basic framework
developed for this study can be utilized for treatment plants similar to the ones studied for
this research or after case-specific modifications for other facilities. Finally, the findings
of this study are useful for life-cycle energy studies requiring the primary energy for
drinking water or service provided in terms of wastewater treated.

6
Chapter 1
Introduction
1.1 Background
Water is indispensable for human health and well being, and crucial for Sustainable
Development. Hence, water and wastewater infrastructure is fundamental for protecting
the human population and environment. During the 20th century global water use
increased six-fold, more than twice the rate of population growth.1 Further, it has been
predicted that the growth in world requirements for development of additional water
supplies will range from 25% to 57% by the year 20252. Thus, the rapid rate of increase
in population creates challenges in terms of constant technological improvement and
higher efficiencies through innovation in treatment processes for water and wastewater as
well as supply of drinking water. Such innovations require significant developments in
research in the field of water and wastewater treatment.
It is well known fact that only 2.5% of the Earth’s total water resources comprise of
freshwater, out of which only 0.5% is directly usable3. Thus, efficient use of water and
reduction of losses are vital for water supply systems. Furthermore, the wastewater
discharged, if untreated or treated below standards, invariably deteriorates the
environment it is discharged in. This creates the need for efficient treatment of
wastewater before it is discharged. As a result, since the 1700s when the first water filters
for domestic water treatment were applied4, significant efforts have been made towards
advancements achieving higher quality of drinking water and lower level of pollutants in
the wastewater discharged to the environment. However, the sustainability of water and
wastewater systems is not limited to the quality of service provided. A sustainability
assessment should also incorporate resource and energy consumption and the positive
and negative environmental impacts on the environment from these systems.
In light of a growing awareness towards depletion of sources of energy and adverse
impacts of fossil fuels on the environment, there is a much stronger need for energy
efficiency in all sectors. Operation of water and wastewater treatment facilities consumes

7
a large part of the total electricity required at the city/town government level. Reduced
electricity consumption at these facilities would mean lower costs for municipalities or
agencies responsible for their operation. At the same time the ecological footprint†
associated with the per capita energy consumption would be reduced. However, energy
efficiency at water and wastewater treatment facilities is difficult to achieve unless the
current patterns of energy consumption are assessed and sources of loss or inefficiency
are identified in the system.
1.2 Rationale
Globally, commercial energy consumed for delivering water is more than 26 Quads
which accounts for 7% of the total world consumption.5 Since this figure does not include
the energy consumed for treatment of wastewater, the energy consumed by water and
wastewater systems together would account for a larger percentage. Water and
wastewater treatment plants require considerably large amounts of energy to acquire,
treat, deliver drinking water as well as collect, treat and discharge treated effluent. Energy
is required to lift water from depths in aquifers, pump water through canals and pipes,
control water flow, collect and treat waste water, and desalinate brackish water or sea
water.
In US, 4% of the nation’s annual electricity is utilized for the treatment of water and
wastewater, including the electricity required for acquiring water and discharging
wastewater.6 Unit electricity consumption for ‘surface water supply’ and ‘groundwater
supply’ systems in the US is estimated to be 1,400 kWh/MG and 1,800 kWh/MG
respectively.7 Further, Publicly Operated Treatment Works (POTW) for wastewater
treatment alone accounted for 21 million MWh of electricity in the year 20008, out of a
total U.S. electricity consumption of approximately 3.8 billion MWh9. Since privately
operated wastewater treatment facilities are estimated to consume more energy‡ than the
† "Ecological Footprint" is a term used to depict the amount of land and water area a human population would hypothetically need to provide the resources required to support it and to absorb its wastes, given prevailing technology. The term was first coined in 1992 by Canadian ecologist and professor at the University of British Columbia, William Rees. ‡ Because of their smaller size and potentially higher loading when compared with POTWs since these facilities are generally industrial or commercial

8
energy required for POTWs 8, the overall electrical consumption for treatment facilities
in the U.S. is even higher. With these significant amounts of electrical energy
consumption figures for water treatment plants, it is not surprising that approximately
80% of municipal water processing and distribution costs are for electricity.9
The water and wastewater systems are also central for any municipality in terms of
environmental impacts owing to the different processes involved. While there are obvious
benefits from water and wastewater treatment plants, there are negative environmental
impacts in the form of greenhouse gas emissions. For example, in the year 2004,
emissions resulting from domestic wastewater treatment resulted into an estimated 20
million metric tons CO2 equivalence global warming potential, and emissions from
industrial wastewater treatment resulted into 17 million metric tons of CO2 equivalence
global warming potential.10 The environmental emissions from water treatment plants
further increase the global warming potential from water and wastewater treatment
systems.
One of the most serious forms of environmental pollution threatening both human health
and sustainable development can be a result of uncontrolled municipal sewage discharge.
Further inefficiencies at various stages in water and wastewater sector can contribute
significantly towards high energy consumption due to energy losses and consequently
increased greenhouse gas emissions resulting from energy generation. Thus, energy
savings are crucial to both water and wastewater sectors to meet national and
international targets for reducing greenhouse gas emissions (GHG) and to decrease
dependence on imported energy sources. In order to meet the growing water and energy
demands, priority should be given to wise and efficient use of existing water and energy
supplies. Transformation is needed at all levels- from the national policy level to
innovations and efficient practices at very small scales such as the city level.
1.3 Thesis Statement
This study contributes to sustainable water and waste water treatment systems for cities
in the US through an in-depth energy and emissions analysis using life-cycle assessment

9
methods for four different case-studies. These analyses will quantify burdens and
highlight the opportunities for improvement. Reporting energy consumption patterns for
water and wastewater systems enable energy efficient technological advancements and
reduction of losses in the system. While the framework for assessment is based on data
from specific facilities for this study, it can be replicated for similar facilities and
modified for dissimilar facilities within the US as well as internationally.
1.4 Scope of Study
This research is restricted to an assessment of water and wastewater treatment facilities in
the US in terms of total energy consumed at the various stages of operation and emissions
from these stages. Four case-studies, three wastewater treatment plants (WWTPs) and
one water treatment plant (WTP), have been used for characterizing the amounts of
energy and emissions from such facilities. The data obtained from the Ann Arbor Water
Treatment Plant and the Ann Arbor Wastewater Treatment Plant have been analyzed for
energy consumption and emissions from different treatment stages with an aim to
ascertain the total energy consumed by the ‘water and wastewater’ system.
Figure 1-1. Scope of Study for Ann Arbor ‘Water and Wastewater’ System
This study does not discuss the energy consumed and emissions from the initial
construction of these facilities. The scope is restricted to operation of the treatment plant
and pumping stations, production of chemicals required for treatment, fuels used at the
plants, and fuels used for disposal of sludge from each facility. For example, the
Ann Arbor Water and Wastewater System
Ann Arbor WTP Ann Arbor WWTP
Energy and Emissions Assessment
Energy and Emissions Assessment
Implications for the Ann Arbor Municipality from the combined system

10
electricity consumed for operating the Ann Arbor WTP and the pumping stations has
been included for the assessment along with the total natural gas consumption at the plant
and the energy required for producing the chemicals used for water treatment.
Further, this research analyzes two additional wastewater treatment plants in US. The
Ypsilanti Community Utility Authority (YCUA) in Southeast Michigan and Laguna
Treatment Plant in Santa Rosa, California were included in this research. The assessment
for the wastewater treatment plants includes electricity required for operation of the plant
and pumping stations, energy required for production of chemicals utilized for treatment,
energy in the form of natural gas used at each plant and energy for sludge disposal at
landfills or land-application sites.
Figure 1-2. Scope of Study for Wastewater Treatment Plants
All three wastewater treatment plants under consideration are tertiary treatment facilities,
with approximately equal treatment capacities, however, the variation in operation
processes used at these systems make them unique. Lastly, although different
methodologies can be adopted for energy assessment for water and wastewater systems,
this study relies on life-cycle energy and emissions assessment.
1.5 Methodology
This study follows a life-cycle approach for assessment of energy consumption and
environmental impacts related with operation of water and wastewater treatment plants.
Wastewater Treatment Plants in U.S.
Ann Arbor WWTP YCUA WWTP Laguna Treatment Plant
Energy and Emissions Assessment
Energy and Emissions Assessment
Energy and Emissions Assessment
Comparative Assessment for Different Stages of Energy Consumption and Emissions
11
Although the energy and impact assessment has been presented separately for each
facility, together it has been referred to as ‘Life-cycle Energy and Impact Assessment’ or
LCEIA in this report.
1.5.1 Life-cycle Energy and Impact Assessment
Life-cycle Energy Analysis (LCEA) is an approach in which all energy inputs to a
product are accounted for, not only the direct energy inputs during production or
manufacturing, but also all energy inputs needed to produce components, materials and
services needed for the product or process. The procedures of life-cycle analysis are a
part of ISO 14000. The ISO 14040- “Environmental Management- Life-cycle
Assessment – Principles and Framework” - defines11 Life-cycle Assessment (LCA) as a
technique for assessing the environmental aspects and potential impacts associated with a
product, by-
Compiling an inventory of relevant inputs and outputs of a product system ;
Evaluating potential environmental impacts associated with the inputs and outputs
Interpreting the results of the inventory analysis and impact assessment phases in
relation to the objectives of the study.
Following the principles above, this study identifies the key stages of energy
consumption for operating water and wastewater treatment plants.
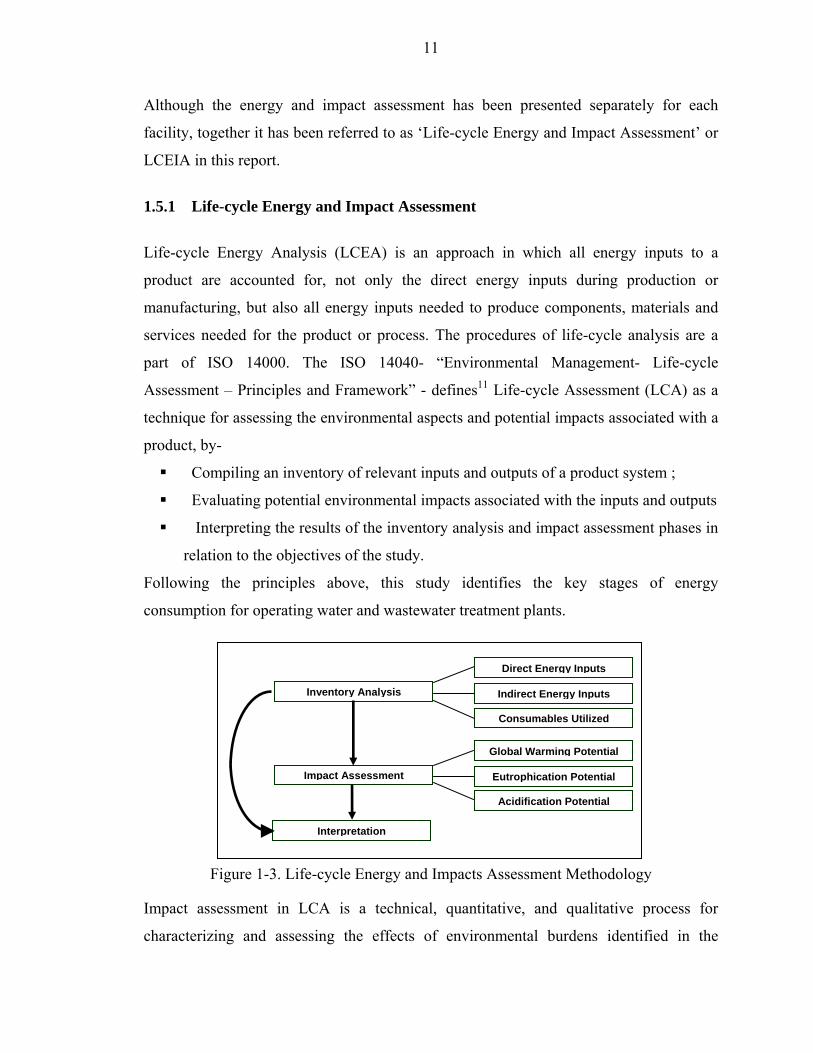
Figure 1-3. Life-cycle Energy and Impacts Assessment Methodology
Impact assessment in LCA is a technical, quantitative, and qualitative process for
characterizing and assessing the effects of environmental burdens identified in the
Inventory Analysis
Direct Energy Inputs
Indirect Energy Inputs
Consumables Utilized
Global Warming Potential
Eutrophication Potential
Acidification Potential
Impact Assessment
Interpretation

12
inventory component. The impact assessment consists of three components12 –
classification, characterization and valuation-
Classification, where the data from the inventory is grouped into a number of
impact categories.
Characterization, in which impacts are analyzed/quantified and aggregated within
identified impact categories.
Valuation, in which the contributions from the different specific impact categories
are weighted so that they can be compared among themselves.
1.5.2 LCEIA Modeling and Key Parameters for Assessment
The model for LCEIA was created in Microsoft Excel and modified for individual case-
studies. The framework for analyzing energy consumption and environmental impacts is
explicated in this section.
Total Life-Cycle Energy
The life-cycle energy for operation of each of the treatment facilities includes energy
consumption in the form of energy sources such as electricity, natural gas and diesel
fuel, as well as energy in form of chemicals consumed for treatment.
i. Electricity consumption
The electricity consumption for each case-study is reported in terms of kWh per
month as the total electrical consumption for plant operations including the electricity
consumed at administrative buildings, pumping stations, UV disinfection and
ozonation.
ii. Natural Gas consumption
The natural gas consumption for heating in buildings, or plant operations such as
sludge incineration at YCUA WWTP are reported in terms of cubic feet (cuft) or
hundred cubic feet (CCF) per month for plant operations as well as heating in
buildings. The calculation for conversion from CCF of natural gas to Giga Joules

13
included pre-combustion and combustion energy for natural gas which is equal to
1.16 million BTU† per 1000 cuft of natural gas.13
iii. Energy consumed in the form of chemicals utilized for treatment at the plant
The chemicals consumed for treatment at each facility are reported in terms of metric
tons per month. The material production energy for chemicals used for water and
wastewater treatment is calculated based on figures from Table 1-1. Some of the
energy consumption figures adopted from Owen (1982) were updated to include the
primary energy consumed. The material production energy for the rest of the
chemicals has been adopted from APME database on life-cycle energy for production
of chemicals and SimaPro 6.0 life-cycle assessment database.
Table 1-1 Material Production Energy for Chemicals Utilized Material Production Energy for Chemicals Chemical MJ/metric ton Source
Aluminum Sulfate (Alum) 6290 (a) Ferric Chloride 1200 (b) Ferrous Chloride 1200 (b) Chlorine 20130 (c) Sodium Hypochlorite 59525 (b) Lime 6500 (a) Polymers 44682 (b) Carbon Dioxide 12900 (a) Oxygen 5590 (a) Sodium Hydroxide 22040 (c) Sodium Hexametaphosphate 12800 (d) Ammonia 35760 (c) Sodium Silico Fluoride 12800 (d)
Sources: (a) Semipro 6.0 - BUWAL250, Eco-indicator 95 (b) Owen William F. ‘Energy in Wastewater Treatment’. 1982 (upgraded) (c) APME, Ecoprofiles of the European Plastic Industry (d) NREL, ‘Life-cycle Inventory of Biodiesel fuel and Petroleum Diesel fuel’.
1998
The energy for production of chemicals used presented in Table 1-1 above has been
calculated based on secondary information and processes involved in production for the
† 1 BTU = 3412 kWh = 3.412 * 3.6 GJ

14
specific chemicals. The detailed calculations and sources of secondary data on energy
consumed in production of these chemicals are included in Appendix F-I.
iv. Energy consumed for disposal of sludge after treatment
The energy consumed for disposal of sludge produced at wastewater treatment plants is
calculated based on the specific method of disposal used at the plant. The energy is
calculated based on the quantity of diesel fuel consumed for transporting the sludge to
landfill or land application sites and natural gas consumed for incineration. The inherent
energy of diesel fuel includes the pre-combustion and combustion energy, which is equal
to 158 million BTU per 1000 gallons of diesel fuel consumed.14
Total Life-Cycle Emissions
The life-cycle impact assessment included atmospheric and aquatic emissions from
consumption of electricity, natural gas and diesel fuel at each facility. The sources for
each and details are presented in this section.
i. Emissions from Electricity
This study utilizes the information provided in a recent study by Kim and Dale -
‘Life-cycle Inventory Information of the United States Electricity System’14- which
compiles the emissions from one Mega Joule of electricity based on the average US
grid. Thus, the calculation of emissions from electricity consumption for each case-
study is based on the emissions factors provided by Kim and Dale (Appendix F-II-a).
ii. Emissions from Natural Gas
The total pre-combustion and combustion emissions from natural gas consumption
per 1000 cuft of natural gas have been adopted from information compiled in
Franklin’s Appendix A, Table A-2015 (Appendix F-II-b).

15
iii. Emissions from Chemicals Utilized
The impact assessment includes emissions from production of chemicals utilized for
treatment at each treatment facility. The emission factors used have been summarized in
Table 1-2.
Table 1-2 Environmental Impacts from Production of Chemicals Used for Treatment Environmental Impacts from Production of Chemicals Utilized for Treatment
Global
Warming Atmospheric
Eutrophication Aquatic
Eutrophication Acidification
Potential
Chemical kg CO2 eq./MT g N eq./MT g N eq./MT
kmoles H+ eq./MT
Aluminum Sulfate (a) 276 0.04 0.02 753Ferric Chloride (b) 77 8 0 24Ferrous Chloride(b) 77 8 0.09 24Chlorine (f) 780 0.06 0.01 121Sodium Hypochlorite(b) 1065 105 1.31 333Lime (a) 1264 0.03 0.003 47Polymers (b) 2082 0.0004 0.01 191Carbon Dioxide (a) 346 0.01 0 0.3Oxygen (a) 226 0.02 0.02 79Sodium Hydroxide (c) 1376 0.12 0.000002 369Ammonia (c) 2400 90 34 182
Sources: (a) SimaPro 6.0 - BUWAL250, Eco-indicator 95 (b) Owen William F. ‘Energy in Wastewater Treatment’. 1982 (upgraded) (c) APME, Ecoprofiles of the European Plastic Industry
iv. Emissions from Diesel fuel
The total pre-combustion and combustion emissions from diesel fuel consumption per
1000 gallons of diesel fuel have been adopted from information compiled in Franklin’s
Appendix A, Table A-2016 (Appendix F-II-c).
The emissions from each of the source above have been aggregated within three different
impact categories- global warming potential, eutrophication potential and acidification
potential. The environmental impact factors used are presented in Table 1-2.

16
Table 1-2 Environmental Impact Factors based on a 100-year Time Horizon
Environmental Impact Factors Over a 100-year horizon Global Warming
Potential Eutrophication - (kg N equivalent/kg) Acidification
(CO2 equivalence/kg) Atmospheric Aquatic (kmoles of H+ equivalent/kg)
CO2 1.00 NOx 0.04 N 1.00 SO2 50.79CH4 23.00 NH3 0.12 NH4+ 0.78 HCl 81.26N2O 300.00 NO3
- 0.24 COD† 0.05 NOx 40.04 P 1.12 NO3
- 0.10 NH3 95.49 PO4
3- 2.38 P 7.29
Source: US EPA. TRACI Characterization Factors. US Average 2006.
Further, methane emissions from the anaerobic sludge treatment‡ process were computed.
The emission factor adopted from ‘IPCC Good Practice Guidance’ study for calculating
CH4 emissions from a closed anaerobic sludge treatment process is as below-
0.6 grams CH4 per gram BOD17
Since the energy consumption figures as well as the emissions were derived in different
units a common functional unit for the total life-cycle energy and life-cycle impact from
operation of each treatment plant is necessary for ease in making comparisons.
1.5.3 Functional Unit
The life-cycle energy consumption for operation of water treatment plant and wastewater
treatment plants has been reported in terms of Giga Joulesψ per million gallons of water
delivered or wastewater treated respectively. Since emissions have been categorized in
terms of total global warming, eutrophication and acidification potential, the units for
each is in terms of kilograms of carbon dioxide equivalent per million gallons, grams of
nitrogen equivalent per million gallons and kilogram moles (kmoles) of hydrogen ion
equivalent per million gallons respectively. It is to be noted that all results presented in † Organic Carbon shown in terms of COD (Chemical Oxygen Demand) ‡ Although both Ann Arbor WWTP and YCUA WWTP employ activated sludge treatment (aerobic), this calculation was required a proposed closed anaerobic treatment method for utilizing the sludge for production of energy at the plant ψ One GJ is equal to 3600 kWh

17
terms of per million gallons are on the basis of million gallons of drinking water
delivered in case of the water treatment plant and million gallons of wastewater treated in
case of the wastewater treatment plant.
1.5.4 Data Quality and Key Assumptions
Most of the information on the four case studies presented in this report is primary
information collected from the treatment facilities in a standard format. The consumption
of electricity is either calculated from monthly electric bills or monthly reports.
Consumption of natural gas and chemicals is also recorded on a monthly basis for each
plant except for the Ann Arbor water treatment plant. The diesel fuel consumption is
calculated based on the total quantity of sludge produced per month and the distance to
the landfills or land application sites. Although the data is collected on a monthly basis
for a period of six years from the year 2000 to 2005 some of the information is
unavailable or incomplete. Hence, the results presented in this study are only for the years
for which the information is complete for each category and month. Also, certain
assumptions are made for computations where exact information is unavailable. The key
factors adopted and assumptions made for the purpose of homogeneity in calculations for
this study are listed below.
The average tare weight† of the truck used for sludge disposal to landfill and land
application sites was reported to be approximately 16 metric tons‡ for the Ann
Arbor Wastewater Treatment Plant. It was assumed that the trucks used for sludge
disposal at other facilities weighed the same for the purpose of consistency.
Although the electric grid for the state of California is different from that of
Michigan, the emissions from electricity were calculated based the composition of
the average US grid for both states. A more accurate method would be to compute
calculations based on the individual grids, however, this would have been a
lengthy procedure and the difference in emissions are not considered to be
significant in the context of this research effort. † Tare weight is the weight of a vehicles when it is empty ‡ Source: phone conversation with Don Popma, Director of Operations, Synagro Tech Inc., responsible for sludge disposal for the Ann Arbor Wastewater Treatment Plant

18
1.6 Literature Overview and Previous Studies
The necessity of safe and reliable water treatment systems was recognized in US during
late 19th century to early 20th century18. Methods such as sedimentation, filtration and
disinfection processes were combined to provide these systems before the water was sent
to storage and distribution. The plant locations for these early systems were chosen so
that water flowed by gravity. Simpler methods and location of these early systems
required less energy. Compared to those simpler methods the existing treatment plants
employing modern technologies such microfiltration, ultrafiltration, ozone disinfection
and ultraviolet disinfection require more energy. Also, meeting present water standards
requires usage of more chemicals for treatment. Hence, water treatment plants currently
in operation in the US require greater amount of energy to operate.
Wastewater treatment systems in the US also date from the late 19th century when septic
systems were developed and became popular in rural and urban settings. The federal funding
for construction of municipal wastewater treatment plants by the US government began in the
year 1948 and State Revolving Funds (SRF)† were introduced in the 1987 amendments to the
Clean Water Act‡. To meet the more stringent discharge limits as per the Clean Water Act of
1977 more sophisticated and advanced treatment technologies such as biological nutrient
removal and ultraviolet disinfection were adopted. Water and wastewater treatment plants
require significant energy for operation. The provision of drinking water and collection and
treatment of wastewater contribute considerably to the energy requirement for municipal
governments. Research and development contributing to energy conservation in the water
and wastewater treatment sector is needed.
A pioneer study contributing to energy accounting in the field of wastewater treatment is
“Energy in Wastewater Treatment”19 by William F. Owen, published in 1982. The study is
significant not only in terms of an effort for accounting electricity consumption at various
stages in the treatment process at wastewater treatment plants but also a detailed description
of energy consumption for production of chemicals consumed for treatment. Most studies
† Loans to local governments for specific water-pollution-control purposes ‡ Growing public awareness and concern for controlling water pollution led to enactment of the Federal Water Pollution Control Act Amendments of 1972. As amended in 1977, this law became commonly known as the Clean Water Act.

19
focusing on energy consumption for operation of water and wastewater treatment facilities
ignore the consumption of energy in the form of chemicals utilized for treatment. Owen in his
book provides detailed information on energy consumed for production of consumables or
chemicals, based on secondary information and primary data from the industries
manufacturing these chemicals. Hence, even though this study does not assess wastewater
treatment systems using LCEA as method of assessment, it proves to be very useful for
studies assessing energy consumption at wastewater treatment plants.
More recently, there have been additional studies analyzing the energy consumption patterns,
comparing alternative treatment processes in terms of energy consumption or discussing the
different stages of energy consumption at water and wastewater treatment plants. A study
conducted in 2002- “Energy Efficient Technologies for the Fortuna Wastewater Treatment
Facility”20- by Jennifer Fuller for ‘The Community Clean Water Institute Fortuna water
Quality Institute’ studied energy consumption patterns at Fortuna Wastewater Treatment
Facility in California. Since the study focused on electrical consumption at the plant, the
method of assessment was not LCEA. However, there is a good discussion on the prospects
for alternative energy-efficient options for operation and management of the Fortuna
wastewater treatment plant. Such alternatives can be employed at other facilities in the US
for achieving energy efficiency in operation of wastewater treatment plants.
Life-cycle energy is increasingly becoming a popular indicator of overall sustainability for
water and wastewater treatment systems. For example, “Life-cycle Assessment of Water
Production Technologies”21 by Raluy et al assesses life-cycle energy for three different
desalination technologies currently used on a commercial scale for producing clean water.
Based on modeling and analysis using LCA software SimaPro 5.0 the study concluded that
Reverse Osmosis was environmentally more sustainable than the other two technologies in
question- Multi Effect Desalination and Multi Stage Flash.
Another such study- “Life-cycle Energy Assessment of Alternative Water Supply Systems”22
by Stokes et al., assessed three water supply alternatives (Importing, recycling and
desalination) for the state of California. Interestingly, the study employed a hybrid LCA
approach, combining elements of economic input-output method with process-based LCA.
The authors created a Microsoft Excel based model, named Water-Energy Sustainability Tool

20
(WEST), which quantifies material and energy inputs into water systems as well as
environmental outputs.
A similar approach has been used for “Preliminary Application of Life-cycle Assessment to
US Water and Wastewater Treatment Facilities” a working paper for the Center for
Sustainable Systems at the University of Michigan, Ann Arbor. Although similar in regard
that MS Excel based models have been developed for assessing water and wastewater
treatment plants for typical treatment processes and plant capacities, the CSS study does not
incorporate economic modeling. The generic models have been modified for assessing
individual case studies in the state of New York and Southeast Michigan.
This study analyzes individual case-studies on the City of Ann Arbor’s Water Treatment
Plant, City of Ann Arbor’s Wastewater Treatment Plant, Ypsilanti Community Utility
Authority Wastewater Treatment Plant and City of Santa Rosa’s Laguna Wastewater
Treatment Plant.

21
Chapter 2
Ann Arbor Water Treatment Plant
2.1 Background
The City of Ann Arbor Water Treatment Plant (WTP) supplies water to 120,000
customers in the City of Ann Arbor. The treatment system consists of two separate water
treatment plants that have a combined total capacity of 50 million gallons per day
(MGD). Most of the water supplied to the city comes from the Huron River.
The WTP also manages the City’s water distribution system comprising of five pressure
districts within the city. The main reservoir, three outlying reservoirs, four remote
pumping stations and two elevated tanks supply these districts. The distribution system
also consists of 439 miles of water mains, 3646 fire hydrants, and 5635 water main
valves.20
2.2 Water Treatment
The Ann Arbor WTP has two stages of treatment- primary treatment and secondary
treatment. The water is softened in the primary stage and recarbonated in the secondary
stage. Each stage has three steps explained below-
Rapid Mixing for quick dispersion of the chemicals being added
Flocculation or slow mixing, for providing the chemical reaction time
Settling for removal of solids from the water by gravity.
After the settling stages the water is sent to the primary disinfection stage. Finally,
the water is filtered and disinfected once again.

22
Figure 2-1. Process Flow Chart for Ann Arbor Water Treatment Plant (Source: Information provided by the Ann Arbor WTP)
Huron River
Wells
Primary Rapid Mix
Addition of Lime (CaO) as a softening agent
Flocculator
Primary Clarifier
Addition of Water from Wells and Carbon Dioxide (CO2) for recarbonation and pH adjustment
Secondary Rapid Mix
Flocculator
Secondary Clarifier
Addition of polymer as a settling aid for solid’s removal
Addition of CO2 for pH adjustment before Ozonation
CO2 Contactor
Ozone Contactor
Addition of Sodium Hydroxide (NaOH) and Sodium Hexametaphosphate
Filtration
Addition of Chloramine (NH2Cl) and Fluoride
Clear Wells
Transfer Pumps Reservoir
Transfer Pumps Distribution
PumpinPumpin

23
Figure 2-1 provides an overview of treatment process at the Ann arbor WTP along with
each treatment stage and the key chemical inputs. The Barton pumping station located on
the Huron River has a capacity of 40 MGD; the wells can provide upto 10 MGD. The
water from the wells is used in the primary rapid mix or diverted to the primary clarifier
effluent for pH adjustment. Further details on the total flow at the Ann Arbor Water
Treatment Plant are presented in the following section.
2.3 Total Flow
The Ann Arbor WTP on an average withdraws approximately 14 MGD from the Huron
River and around 3 MGD from the wells. The maximum quantity of water withdrawn
during the period of six years being studied was 23 MGD from the river in July 2002 and
approximately 5 MGD from the wells in February 2004. The lowest during the same
period was found to be 9 MGD from the river in March 2005 and 2 MGD from wells in
May 2005. Figure 2-2 illustrates the pattern of water acquisition at the Ann Arbor WTP
in terms of MGD.
Figure 2-2. Water Acquisition for Ann Arbor WTP from Huron River and Wells (MGD)
Ann Arbor Water Treatment Plant - Water Acquisition (MGD)
0
5
10
15
20
25
30
Jan-
00
Jul-0
0
Jan-
01
Jul-0
1
Jan-
02
Jul-0
2
Jan-
03
Jul-0
3
Jan-
04
Jul-0
4
Jan-
05
Jul-0
5
MG
D Total Qty.Drawn
FromHuron River
From Wells

24
The average withdrawal of water for the six year period from 2000 to 2005 is 14 MGD
from the Huron River and 3 MGD from wells.
Figure 2-3. Water Acquisition from Huron River and Wells for Ann Arbor WTP (MG/month)
Figure 2-4. Quantity of Water Delivered from the Ann Arbor WTP to the City (MGD)
Ann Arbor Water Treatment Plant - Water Acquisition (MG/month)
0
100
200
300
400
500
600
700
800
900Ja
n-00
Jul-0
0
Jan-
01
Jul-0
1
Jan-
02
Jul-0
2
Jan-
03
Jul-0
3
Jan-
04
Jul-0
4
Jan-
05
Jul-0
5
MG
per
mon
th
Total Qty.Drawn
FromHuron River
From Wells
Ann Arbor Water Treatment Plant - Clean Water Delivered (MGD)
0
5
10
15
20
25
30
Jan-
00
Jul-0
0
Jan-
01
Jul-0
1
Jan-
02
Jul-0
2
Jan-
03
Jul-0
3
Jan-
04
Jul-0
4
Jan-
05
Jul-0
5
MG
D
Total Qty.Drawn
Total Qty.Delivered

25
The water intake is generally high during the period of April to October with the highest
consumption being generally in the month of July due to a higher demand of water for
gardening, irrigation and recreation etc., during spring and summer months. The water
intake from the wells is generally high during the winter months when the low
temperature water from the Huron needs to be moderated with the groundwater (Figure
2-3). Figure 2-4 illustrates the quantity of water delivered to the City of Ann Arbor by the
Ann Arbor WTP in MGD. The average quantity of water delivered by the Ann Arbor
WTP was found to be 14 MGD (Figure 2-4).
Figure 2-5 illustrates the relationship of the volume of water withdrawn from the Huron
River and groundwater wells with the total volume of water delivered on a monthly basis.
The average volume of water delivered to the customers from the Ann Arbor WTP is 440
MG per month (Figure 2-5).
Figure 2-5. Quantity of Water Delivered from the Ann Arbor WTP to the City (MG/month)
Ann Arbor Water Treatment Plant - Water Delivered (MG/month)
300350400
450500550600650700
750800850
Jan-
00
Jul-0
0
Jan-
01
Jul-0
1
Jan-
02
Jul-0
2
Jan-
03
Jul-0
3
Jan-
04
Jul-0
4
Jan-
05
Jul-0
5
MG
per
mon
th
Total Qty.Drawn
Total Qty.Delivered

26
Figure 2-6. Difference in Total Quantity Withdrawn and Delivered at Ann Arbor WTP (MGD)
The difference in total quantity of water withdrawn from the Huron River and
groundwater wells to the quantity of water delivered to the city of Ann Arbor ranges from
less than 1 MGD to 6 MGD (Figure 2-6). The difference is generally higher during spring
and summer months and less in winter months since the total quantity of water consumed
is higher in summer months. Further details on the information on plant influent and flow
for the Ann Arbor Water Treatment Plant have been attached in Appendix A-I-a.
2.4 Electricity Consumption
The electricity utilization for the Ann Arbor water treatment plant includes electricity
consumed for pumping water from the Barton ponds and the groundwater wells,
operation of the treatment plant, administrative buildings and the distribution pumping
stations. The electricity utilization for the Ann Arbor WTP for the period of six years
from 2000 to 2005 averaged 1,039,895 kWh per month. Operation of the water treatment
plant alone consumes more than 60% of the total electrical consumption for the water
treatment and supply system (Figure 2-7).
Ann Arbor Water Treatment Plant - Difference in Total Water Drawn from the River and Wells to Total Water Delivered (MGD)
0
1
2
3
4
5
6
7
8
9
10
Jan-
00
Jul-0
0
Jan-
01
Jul-0
1
Jan-
02
Jul-0
2
Jan-
03
Jul-0
3
Jan-
04
Jul-0
4
Jan-
05
Jul-0
5
MG
D Differencein WaterIntake andSupply

27
Figure 2-7. Electricity Utilization for Ann Arbor Water Treatment and Distribution System (kWh/month)
Figure 2-8. Electricity Utilization for Ann Arbor Water Treatment and Distribution System (kWh/MG)
Ann Arbor WTP- Electricity Utilization (kWh/MG Clean Water)
0
500
1000
1500
2000
2500
3000
3500
Jan-
00
May
-00
Sep-
00
Jan-
01
May
-01
Sep-
01
Jan-
02
May
-02
Sep-
02
Jan-
03
May
-03
Sep-
03
Jan-
04
May
-04
Sep-
04
kWh
/ MG
Electricity
Ann Arbor WTP- Electricity Utilization (kWh/month)
-
200,000
400,000
600,000
800,000
1,000,000
1,200,000
1,400,000
1,600,000
1,800,000
Jan-
00
May
-00
Sep-
00
Jan-
01
May
-01
Sep-
01
Jan-
02
May
-02
Sep-
02
Jan-
03
May
-03
Sep-
03
Jan-
04
May
-04
Sep-
04
kWh
per m
onth
Total
Raw WaterPumping &TreatmentDistribution

28
The electricity utilized for treating and supplying 1 million gallons of drinking water to
the customers in the City of Ann Arbor ranges from 1,960 kWh/MG to 2,900 kWh/MG
(Figure 2-8). The average consumption for the six year period is 2,390 kWh/MG. Further
details of electricity consumption for Ann Arbor WTP are attached in Appendix A-I-b.
2.5 Natural Gas Utilization
The natural gas utilization for Ann Arbor Water Treatment Plant includes the quantity
required for heating and pumping at the treatment plant, as well as natural gas used at
Barton pumping station and Steere Farm wells pumping station for operating the pumps.
It is reported in terms of the annual consumption for five years from 2001 to 2005. The
average consumption for the five year period is found to be 29,685 CCF per year. Figure
2-9 illustrates the total natural gas consumption at the Ann Arbor WTP in CCF per year.
Figure 2-9. Natural Gas Utilization for the Ann Arbor Water Treatment and Distribution System (CCF/year)
Ann Arbor Water Treatment Plant - Natural Gas Utilization (CCF/year)
050,000
100,000150,000200,000250,000300,000350,000400,000450,000
2001 2002 2003 2004 2005
ccf p
er y
ear
Nat. Gas

29
Figure 2-10. Natural Gas Utilization for the Ann Arbor Water Treatment and Distribution System (CCF/MG)
Based on the total quantity of water delivered to the City of Ann Arbor for the years from
2000 to 2005, natural gas consumption per million gallons of drinking water delivered is
calculated (Figure 2-10).
2.6 Chemicals Utilized for Treatment
The Ann Arbor Water treatment Plant uses lime, phosphate, sodium silico fluoride,
carbon dioxide, liquid oxygen, sodium hypochlorite, polymers, ammonia, and sodium
hydroxide for the treatment process for water withdrawn from the river and the wells
before supplying water to the city.
i. Lime
Lime is added to the water withdrawn from the Huron River and the wells in the primary
rapid mix. Lime softens hard water by removing calcium and magnesium. The quantity
of lime consumed ranges from 219 metric tons per month to 544 metric tons per month.
Ann Arbor Water Treatment Plant - Natural Gas Utilization (CCF/MG Clean Water)
0
10
20
30
40
50
60
70
80
2001 2002 2003 2004 2005
ccf/
MG
Nat. Gas

30
Figure 2-11. Lime Utilized for Treatment at Ann Arbor WTP (metric tons/month)
Figure 2-12. Energy Consumed for Production of Lime Utilized at Ann Arbor WTP (GJ/month)
Ann Arbor Water Treatment Plant- Lime Utilization (metric tons per month)
-
100
200
300
400
500
600
Jan-
00
Jul-0
0
Jan-
01
Jul-0
1
Jan-
02
Jul-0
2
Jan-
03
Jul-0
3
Jan-
04
Jul-0
4
Jan-
05
Jul-0
5
met
ric to
ns p
er m
onth
Lime
Ann Arbor WTP- Energy Required for Production of Lime (GJ/month)
0
1000
2000
3000
4000
5000
6000
7000
8000
Jan-
00
Jul-0
0
Jan-
01
Jul-0
1
Jan-
02
Jul-0
2
Jan-
03
Jul-0
3
Jan-
04
Jul-0
4
Jan-
05
Jul-0
5
GJ
per m
onth
Energy forLimeProduction

31
Lime consumption is the highest in the month of July corresponding to the high quantity
of water delivered in this month each year. The energy required for production of lime
has been calculated using the energy factors in Section 1.5.2- iii. Although production
process for Lime is not very energy intensive the energy related to lime use at the Ann
Arbor WTP is quite high since the amount of lime consumed per month is significantly
high. The average monthly energy consumption related with lime utilized for treatment at
the Ann Arbor WTP is 2,163 GJ per month.
ii. Carbon Dioxide
Carbon Dioxide (CO2) is added to the water prior to primary disinfection for the purpose
of recarbonation and pH adjustment. Carbon dioxide is also added in the CO2 contactor
after the water has passed through the secondary clarifiers for lowering and adjusting the
pH in order to enable effective and efficient ozonation to occur. The quantities of CO2
reported in Figure 2-13 includes the quantity consumed at both the stages discussed
above.
Figure 2-13. CO2 Utilized for Treatment at Ann Arbor WTP (metric tons/month)
Ann Arbor Water Treatment Plant- CO2 Utilization (metric tons per month)
0
10
20
30
40
50
60
Jan-
00
Jul-0
0
Jan-
01
Jul-0
1
Jan-
02
Jul-0
2
Jan-
03
Jul-0
3
Jan-
04
Jul-0
4
Jan-
05
Jul-0
5
met
ric to
ns p
er m
onth
CO2 forTreatmentat Plant
CO2 forEffectiveOzonation

32
Figure 2-14. Total Energy Consumed for Production of CO2 Utilized at Ann Arbor WTP (GJ per month)
Compared to lime production, CO2 production is more energy intensive- 12,900
MJ/metric ton as opposed to 6500 MJ/metric ton (Table 1.1); however, since the quantity
of CO2 utilized per month is ten times less than the quantity of lime utilized at the plant
per month, the energy related to CO2 is lower at an average of 140 GJ per month.
iii. Polymers
Cationic polymer NALCO's CatFloc TL is added during the treatment process to enhance
coagulation in the secondary rapid mix for removal of solids in the secondary clarifier.
The quantity of this polymer used ranges from 0.88 metric tons per month to 1.70 metric
tons per month. However, during the months of high consumption of water in Ann Arbor
(between May to October), this polymer is also added at the Barton pumping station for
controlling Zebra mussels. Figure 2-15 illustrates the use of polymers for coagulation at
the Ann Arbor WTP. The energy required to produce both of the polymers has been
combined and the result is presented in Figure 2-16.
Ann Arbor WTP- Energy Required for CO2 Production (GJ/month)
0
400
800
1200
1600
Jan-
00
Jul-0
0
Jan-
01
Jul-0
1
Jan-
02
Jul-0
2
Jan-
03
Jul-0
3
Jan-
04
Jul-0
4
Jan-
05
Jul-0
5
GJ
per m
onth
Energy forCO2Production

33
Figure 2-15. Polymer Utilized at the Ann Arbor WTP and Barton Pumping Station (metric tons/month)
Figure 2-16. Energy Used for Production of Polymers Utilized at Ann Arbor WTP and Barton Pumping Station (GJ/month)
Ann Arbor Water Treatment Plant- Polymers' Utilization (metric tons per month)
0
0.5
1
1.5
2
2.5Ja
n-00
Jul-0
0
Jan-
01
Jul-0
1
Jan-
02
Jul-0
2
Jan-
03
Jul-0
3
Jan-
04
Jul-0
4
Jan-
05
Jul-0
5
met
ric to
ns p
er m
onth
Ann ArborWTP
BartonPumpingStation
Ann Arbor WTP- Energy Required for Production of Polymers (GJ per month)
0
100
200
300
400
500
600
700
800
Jan-
00
Jul-0
0
Jan-
01
Jul-0
1
Jan-
02
Jul-0
2
Jan-
03
Jul-0
3
Jan-
04
Jul-0
4
Jan-
05
Jul-0
5
GJ
per m
onth Energy for
ProductionofPolymers

34
The unit production of polymers is an energy intensive process- 44,682 MJ/metric ton
(Table 1-1), however, since the amounts of these polymers consumed is not as high as
some of the other chemicals used at the plant, the energy required for producing polymers
utilized at the WTP averages 304 GJ/month.
iv. Liquid Oxygen
Liquid oxygen is required for the production of ozone. Ozone is applied to the water for
disinfection since it kills harmful microorganisms such as bacteria viruses and protozoa.
Additionally it also reduces taste, odor and potentially harmful chlorinated byproducts.
The quantity of liquid oxygen consumed at the plant from the year 2000 to 2005 ranges
from 1 metric ton per month to 11 metric tons per month (Figure 2-17).
Figure 2-17. Oxygen Utilized for Ozone Production at Ann Arbor WTP (metric tons/month)
The use of liquid oxygen is high during summer months and low during winter months
since the demand for water is higher during the summer months. Also, fecal coliform
count is higher in the water being treated during the summer months; hence more liquid
Ann Arbor WTP - Liquid Oxygen Utilization (metric tons/month)
-
4
8
12
16
20
Jan-
00
Jul-0
0
Jan-
01
Jul-0
1
Jan-
02
Jul-0
2
Jan-
03
Jul-0
3
Jan-
04
Jul-0
4
Jan-
05
Jul-0
5
met
ric to
ns p
er m
onth
Oxygen

35
oxygen is required for production of ozone for disinfection. The energy required to
produce liquid oxygen ranges from 7 GJ/month to 61 GJ/month. The average energy
consumption for production of oxygen required for ozone production in the ozone
contactor is 29 GJ/month (Figure 2-18).
Figure 2-18. Energy Required for Production of Oxygen Utilized at Ann Arbor WTP (GJ/month)
v. Sodium Hydroxide
Sodium Hydroxide (NaOH) is added to raise the pH of water. The quantity of NaOH
added ranges from 1 metric ton/month to 54 metric tons/month. The energy required for
unit production of NaOH is 22,040 MJ/metric ton (Table 1-1). Correspondingly, the
energy required to produce NaOH ranges from 24 GJ per month to 1,190 GJ per month.
Based on the information available, the average energy required to produce NaOH
utilized at the plant is 600 GJ/month. Figure 2-19 presents the monthly use of NaOH and
Figure 2-20 presents the calculated energy required to produce the NaOH utilized at the
Ann Arbor Water Treatment Plant in GJ per month.
Ann Arbor WTP- Energy Required for Liquid Oxygen Production (GJ per month)
0
15
30
45
60
75
Jan-
00
Jul-0
0
Jan-
01
Jul-0
1
Jan-
02
Jul-0
2
Jan-
03
Jul-0
3
Jan-
04
Jul-0
4
Jan-
05
Jul-0
5
GJ
per m
onth Energy for
Productionof Oxygen

36
Figure 2-19. Sodium Hydroxide Utilized for Treatment at Ann Arbor WTP (metric tons/month)
Figure 2-20. Energy Required for Sodium Hydroxide Utilized at Ann Arbor WTP (GJ/month)
Ann Arbor WTP- Sodium Hydroxide Utilization (metric tons/month)
-
10
20
30
40
50
60
Jan-
00
Jul-0
0
Jan-
01
Jul-0
1
Jan-
02
Jul-0
2
Jan-
03
Jul-0
3
Jan-
04
Jul-0
4
Jan-
05
Jul-0
5
met
ric to
ns p
er m
onth
SodiumHydroxide
Ann Arbor WTP- Energy Required for Sodium Hydroxide Production (GJ per month)
0
200
400
600
800
1000
1200
1400
Jan-
00
Jul-0
0
Jan-
01
Jul-0
1
Jan-
02
Jul-0
2
Jan-
03
Jul-0
3
Jan-
04
Jul-0
4
Jan-
05
Jul-0
5
GJ
per m
onth
EnergyforProductionof NaOH

37
vi. Sodium Hexametaphosphate
Sodium hexametaphosphate is added after ozonation to stop the softening reaction and
prevent precipitation of calcium on the filter media. The quantity of the phosphate used
per month for treatment ranges from 1 metric ton to 3 metric tons.
Figure 2-21. Sodium Hexametaphosphate Utilized for Treatment at Ann Arbor WTP (metric tons/month)
The corresponding energy required to produce sodium hexametaphosphate ranges from
16 GJ/month to 39 GJ/ month (energy required for unit production of sodium
hexametaphosphate is 12,800 MJ/metric23 – Table 1.1). The average energy utilization
related with sodium hexametaphosphate consumption at the plant is 23 GJ/month. Figure
2-22 presents the energy required for production of the sodium hexametaphosphate
required for treatment at the Ann Arbor WTP calculated on a monthly basis.
Ann Arbor Water Treatment Plant- Phosphate Utilization (metric tons/month)
0
1
2
3
4
5
6
Jan-
00
Jul-0
0
Jan-
01
Jul-0
1
Jan-
02
Jul-0
2
Jan-
03
Jul-0
3
Jan-
04
Jul-0
4
Jan-
05
Jul-0
5
met
ric to
ns p
er m
onth
Phosphate

38
Figure 2-22. Energy Required for Producing Sodium Hexametaphosphate Utilized at Ann Arbor WTP (GJ/month)
vii. Mono Chloramine
Ammonia (NH3) and sodium hypochlorite are added together to form mono-chloramine
(NH2Cl) to provide disinfection for water in the city’s distribution system. Since the
quantities of these two components consumed per month were available from the
monthly operation reports (MORs) at the Ann Arbor WTP, the quantities of ammonia and
sodium hypochlorite are plotted separately (Figure 2-23).
The quantity of ammonia utilized ranges from 1 metric ton to 3 metric tons per month
and hypochlorite from 4 metric tons/month to 10 metric tons/month. The quantities
utilized reflect the quantity of influent treated at the plant; hence a greater amount of both
chemicals is required during spring and summer months when the demand for water is
higher.
Ann Arbor WTP- Energy Required for Phosphate Production (GJ per month)
0
10
20
30
40
50
60
70
Jan-
00
Jul-0
0
Jan-
01
Jul-0
1
Jan-
02
Jul-0
2
Jan-
03
Jul-0
3
Jan-
04
Jul-0
4
Jan-
05
Jul-0
5
GJ
per m
onth
Energy forProductionofPhosphate

39
Figure 2-23. Ammonia and Hypochlorite Used at Ann Arbor WTP (metric tons/month)
Figure 2-24. Energy Required for Producing Ammonia and Hypochlorite Utilized at Ann Arbor WTP (GJ/month)
Ann Arbor WTP- Ammonia and Hypochlorite Utilization (metric tons per month)
-
4
8
12
16
20
Jan-
00
Jul-0
0
Jan-
01
Jul-0
1
Jan-
02
Jul-0
2
Jan-
03
Jul-0
3
Jan-
04
Jul-0
4
Jan-
05
Jul-0
5
met
ric
tons
per
mon
th
Ammonia
Hypochlorite
Ann Arbor WTP- Energy Required for Production of Ammonia and Hypochlorite (GJ/month)
0
100
200
300
400
500
600
700
Jan-
00
Jul-0
0
Jan-
01
Jul-0
1
Jan-
02
Jul-0
2
Jan-
03
Jul-0
3
Jan-
04
Jul-0
4
Jan-
05
Jul-0
5
GJ
per
mon
th Energy forNH3Energy forHypochlorite

40
The production process for hypochlorite is more energy intensive than ammonia – 60 GJ
per month as opposed to 36 GJ per month (refer Section 1.5.2- iii). Further, the quantity
of hypochlorite consumed per month is also higher than that of Ammonia. Consequently
energy associated with production of hypochlorite consumed at the plant is magnitudes
higher than the energy associated with ammonia. The average energy consumption
related to utilization of ammonia is 97 GJ per month and related to the utilization of
hypochlorite is 595 GJ per month.
viii. Fluoride
Sodium silico fluoride is added to the water after treatment for dental protection. The
quantity of fluoride added reflects the volume of water treated per month, ranging from 1
metric ton per month to 3 metric tons per month during the six year period. The material
production energy for fluoride calculated based on the process used for its production is
12,800 MJ/metric (Table 1.1).
Figure 2-25. Fluoride Utilized for Treatment at Ann Arbor WTP (metric tons/month)
Ann Arbor WTP - Fluoride Utilization (metric tons per month)
-
1
2
3
4
5
6
Jan-
00
Jul-0
0
Jan-
01
Jul-0
1
Jan-
02
Jul-0
2
Jan-
03
Jul-0
3
Jan-
04
Jul-0
4
Jan-
05
Jul-0
5
met
ric to
ns p
er m
onth
Fluoride

41
Figure 2-25 presents the total quantity of fluoride utilized per month at the Ann Arbor
WTP and Figure 2-26 presents the total energy required for producing the fluoride
utilized at the plant in GJ per month.
Figure 2-26. Energy Consumed for Producing Fluoride Utilized at Ann Arbor WTP (GJ/month)
2.7 Life-Cycle Energy Consumption for Operation of Ann Arbor WTP
The total energy consumed per month for operating the plant includes energy utilized for
generating electricity for operating the plant and pumping stations; generating natural gas
for heating and pumping at the plant and pumping stations; and, producing the chemicals
required for treatment of water at the plant. This section presents the contribution of each
of these energy consuming activities to the total life-cycle energy for operating the Ann
Arbor WTP. Table 2-1 below summarizes the findings on a yearly basis for five years
from 2001 to 2005.
Ann Arbor WTP- Energy Required for Fluoride Production (GJ per month)
0
20
40
60
80
100
120
140
160
180
200
Jan-
00
Jul-0
0
Jan-
01
Jul-0
1
Jan-
02
Jul-0
2
Jan-
03
Jul-0
3
Jan-
04
Jul-0
4
Jan-
05
Jul-0
5
GJ
per m
onth
Energy forFluorideProduction

42
Table 2-1 Life-cycle Energy for Operation of Ann Arbor Water Treatment Plant
Year Electricity Natural Gas Chemicals Total GJ GJ/MG % GJ GJ/MG % GJ GJ/MG % GJ GJ/MG
2001 45129 9 38 24462 5 20 49867 10 42 119459 232002 44778 9 37 24462 6 24 47891 9 39 117131 242003 44500 8 33 24462 9 35 42120 8 32 111083 252004 46224 9 36 24462 8 33 39451 7 31 110138 242005 47038 9 38 24462 7 28 41820 8 34 113320 24
The total life-cycle energy consumed per year for operation of Ann Arbor WTP ranges
from 110,138 GJ per year to 119,459 GJ per year. Based on this yearly consumption, the
life-cycle energy per million gallons of drinking water delivered to the city of Ann Arbor
is calculated. The life-cycle energy for operation of the plant per million gallons drinking
water delivered to the city is 24 GJ/MG.
Figure 2-27 below, illustrates the contribution of electricity, natural gas and chemicals to
the total life-cycle energy consumption for operation of the Ann Arbor WTP and Figure
2-28 illustrates the contribution per million gallons of drinking water delivered to the
city.
Figure 2-27. Total Life-cycle Energy for Operation of Ann Arbor WTP (GJ/Year)
Ann Arbor Water treatment Plant - Total Life-cycle Energy (GJ per Year)
0
20000
40000
60000
80000
100000
120000
140000
2001 2002 2003 2004 2005
GJ
/ Yr Chemicals
Natural gasElectricity

43
Figure 2-28. Total Life-cycle Energy for Operation of Ann Arbor WTP (GJ/MG)
The energy for production of chemicals utilized at the plant contributes 35% of the total
life-cycle energy for operation. Electricity required for operating the treatment plant and
pumping stations contributes 36% and natural gas consumption accounts for 28% of the
total life-cycle energy consumed for operation of the Ann Arbor WTP. Based on the total
energy consumed for operating the plant the life-cycle emissions per year for operating
the Ann Arbor WTP were calculated.
2.8 Life-Cycle Impacts from Operation of Ann Arbor WTP
The life-cycle emissions from production of unit electricity and natural gas were used to
calculate the total life-cycle emissions for operating the Ann Arbor Water Treatment
Plant. These emissions were then characterized into predefined categories of global
warming potential, eutrophication potential and acidification potential. The emissions
analysis is conducted for five years from 2001 to 2005 on a yearly basis as opposed to
monthly emissions since the reported natural gas use is on an annual basis.
Ann Arbor Water treatment Plant - Total Life-cycle Energy Consumed (GJ per MG Clean Water Delivered)
0
5
10
15
20
25
30
2001 2002 2003 2004 2005
GJ
/ MG
-yr Chemicals
Natural gasElectricity

44
i. Global Warming Potential
The total GWP for the plant ranges from 3,206 kg CO2 equivalent to 3,362 kg CO2
equivalent per MG of drinking water delivered. Table 2-2 summarizes the results
obtained for the total global warming potential for the plant.
Table 2-2 Global Warming Potential for the Ann Arbor WTP (kg CO2 eq. /MG)
Global Warming Potential for Ann Arbor WTP in terms of kilograms of CO2 equiv./MG
2001 Electricity Nat. Gas Chemicals Total Carbon Dioxide 1732 239 1076 3047 Methane CH4 68 15 42 126 Nitrogen Oxide 29 0 5 34 Total GWP/MG 1829 254 1123 3206 % of total 57 8 35
2002 Electricity Nat. Gas Chemicals Total Carbon Dioxide 1771 301 1109 3181 Methane CH4 70 19 43 132 Nitrous Oxide 30 0 5 34 Total GWP/MG 1870 320 1158 3348 % of total 56 10 35
2003 Electricity Nat. Gas Chemicals Total Carbon Dioxide 1649 442 1040 3131 Methane CH4 65 28 41 134 Nitrous Oxide 28 0 4 32 Total GWP/MG 1742 470 1085 3297 % of total 53 14 33
2004 Electricity Nat. Gas Chemicals Total Carbon Dioxide 1696 397 1029 3123 Methane CH4 67 25 40 132 Nitrous Oxide 28 0 4 33 Total GWP/MG 1791 423 1074 3288 % of total 54 13 33
2005 Electricity Nat. Gas Chemicals Total Carbon Dioxide 1786 342 1065 3194 Methane CH4 70 22 42 134 Nitrous Oxide 30 0 5 34 Total GWP/MG 1886 364 1112 3362 % of total 56 11 33

45
It is evident from the figures presented in Table 2-2 above that electricity utilization
accounts for 55%, chemicals for 34%, and natural gas utilization for 11% of the total
global warming potential for the plant. Figure 2-29 presents the total global warming
potential from the use of electricity, natural gas and chemicals at the Ann Arbor WTP.
Emissions from use of electricity account for 1,824 kg CO2 eq. / MG, emissions from
production of chemicals emit 1,110 kg CO2 eq. / MG and emissions from Natural Gas
account for 366 kg CO2 equivalent per MG of the drinking water delivered for the five
years under consideration.
Figure 2-29. Life-Cycle Global Warming Potential from the Electricity, Natural Gas and Chemicals Utilized at the Ann Arbor WTP (kg CO2 eq. /MG)
Carbon dioxide emissions from electricity, production of chemicals and natural gas are
the single largest contributing factor to the total global warming potential for the Ann
Arbor WTP (Figure 2-30).
Ann Arbor WTP - Global Warming Potential from Electricity, Natural gas and Chemicals (kg CO2 eq./MG Clean Water Delivered)
1829 1870 1742 1791 1886
254 320 470 423 364
11231158 1085 1074 1112
0
500
1000
1500
2000
2500
3000
3500
2001 2002 2003 2004 2005
kg C
O2
eq./M
G
ChemicalsNat. GasElectricity

46
Figure 2-30. Life-Cycle Global Warming Potential due to Carbon Dioxide, Methane and Nitrous Oxide Emissions (kg CO2 eq. /MG)
Further details of calculations and results on the analysis for global warming potential for
Ann Arbor WTP can be found in Appendix A-II-a.
ii. Eutrophication Potential
Eutrophication potential in terms of grams of Nitrogen (N) equivalence is calculated
separately for atmospheric and aquatic emissions for the five year period. The total
atmospheric eutrophication potential for the five year period ranges from 221 g N
equivalent to 243 g N equivalent per MG of drinking water delivered to the city. The total
aquatic eutrophication was much less since aquatic emissions are significantly lower than
the atmospheric emissions.
It is found that the single largest sources of atmospheric eutrophication potential for the
plant are NOx emissions from electricity utilization. Also, the major sources of aquatic
eutrophication Potential are NH3 and organic emissions in terms COD from electricity
consumption.
Ann Arbor WTP - Global Warming Potential due to CO2, CH4 and N2O Emissions (kg CO2 eq./MG Clean Water Delivered)
3047 3181 3131 3123 3194
126132 134 132 1343434 32 33 34
0
500
1000
1500
2000
2500
3000
3500
2001 2002 2003 2004 2005
kg C
O2
eq./M
G
Nitrous OxideMethaneCarbon Dioxide

47
Figure 2-31. Atmospheric Eutrophication Potential from Electricity, Chemicals and Natural gas Utilization (g N eq. /MG)
Figure 2-32. Atmospheric Eutrophication Potential Owing to Ammonia and NOx emissions from Operation of Ann Arbor Water Treatment Plant (g N eq. /MG)
Ann Arbor WTP- Atmospheric Eutrophication Potential from Electricity, Natural Gas and Chemicals Utilized (g N eq./MG )
180 184 172 162 171
3646 67
60 52
55 5
5 5
0
50
100
150
200
250
300
2001 2002 2003 2004 2005
g N
eq./M
G
Chemicals
Natural GasElectricity
Ann Arbor WTP- Atmospheric Eutrophication Potential due to NH3 and NOx emissions (g N eq./MG Clean Water Delivered)
220 224241
225 226
1 12
2 1
0
50
100
150
200
250
300
2001 2002 2003 2004 2005
g N
eq.
/MG Ammonia
NitrogenOxides

48
Figure 2-33. Aquatic Eutrophication Potential from Electricity, Chemicals and Natural Gas Utilization at the Ann Arbor WTP (g N eq. /MG)
Figure 2-34. Aquatic Eutrophication Potential from Emissions (g N eq. /MG)
Ann Arbor WTP- Aquatic Eutrophication Potential from Electricity, Chemicals and Natural Gas Utilization (g N eq./MG)
3 3 3 3 3
45
76
6
0.20
0.19
0.19
0.190.19
0
2
4
6
8
10
12
2001 2002 2003 2004 2005
g N
eq./M
G
Chemicals
Natural GasElectricity
Ann Arbor WTP- Aquatic Eutrophication Potential due to Emissions (g N eq./MG Clean Water Delivered)
1 1 1 1 1
6 6
98
8
0.06
0.06
0.06
0.060.06
0.07
0.080.09
0.050.05
0
2
4
6
8
10
12
2001 2002 2003 2004 2005
g N
eq./M
G PhosphatesNitratesCODAmmonia

49
Table 2-3 summarizes these results categorized into total atmospheric eutrophication
potential and aquatic eutrophication potential per year.
Table 2-3 Eutrophication Potential for Ann Arbor WTP Eutrophication Potential for Ann Arbor WTP
(grams of Nitrogen eq./MG) Year Atmospheric Aquatic
2001 221 7 2002 225 7 2003 243 11 2004 227 10 2005 227 9
Further results can be found in Appendix A-II-b, which illustrate the key findings
presented in Table 2-3 and Table 2-4 in a more detailed form.
iii. Acidification Potential
The acidification potential is calculated in terms of kmoles of H+ equivalence per million
gallons of drinking water delivered. The Acidification Potential for the Ann Arbor WTP
ranges from 517 kmoles of H+ eq. / MG to 666 kmoles of H+ eq. / MG of drinking water
delivered for the period of 2001 to 2005.
Table 2-5 Acidification Potential for Ann Arbor WTP Acidification Potential for Ann Arbor WTP (kmoles of H+ eq./MG)
SO2 HCl NOx NH3 Total/MG 2001 410 39 218 0.3 6662002 420 40 223 0.3 5882003 393 37 208 0.3 5492004 373 35 198 0.3 5172005 391 37 208 0.3 544
Table 2-5 summarizes the emissions accounting for the total acidification potential for the
Ann Arbor Water WTP. Figure 2-29 illustrates the contribution of electricity, chemicals
and natural gas consumption towards the total acidification potential.
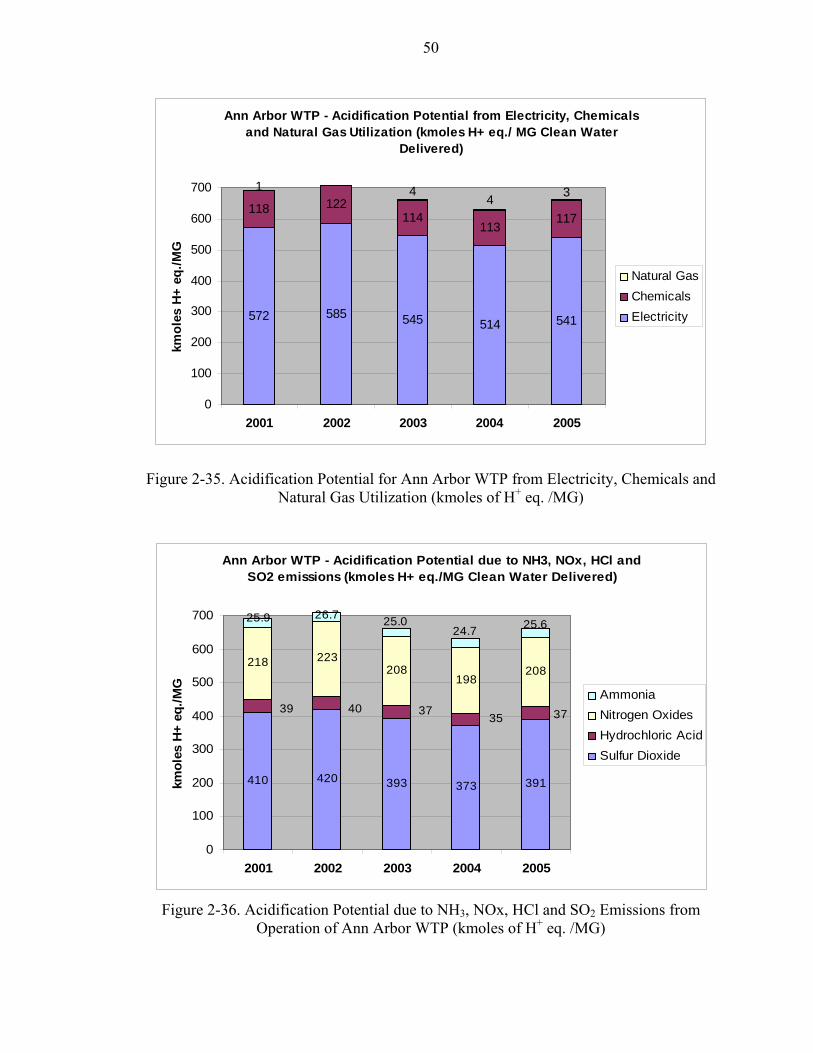
50
Figure 2-35. Acidification Potential for Ann Arbor WTP from Electricity, Chemicals and Natural Gas Utilization (kmoles of H+ eq. /MG)
Figure 2-36. Acidification Potential due to NH3, NOx, HCl and SO2 Emissions from Operation of Ann Arbor WTP (kmoles of H+ eq. /MG)
Ann Arbor WTP - Acidification Potential from Electricity, Chemicals and Natural Gas Utilization (kmoles H+ eq./ MG Clean Water
Delivered)
572 585 545 514 541
118 122114
113117
1 44 3
0
100
200
300
400
500
600
700
2001 2002 2003 2004 2005
kmol
es H
+ eq
./MG
Natural GasChemicalsElectricity
Ann Arbor WTP - Acidification Potential due to NH3, NOx, HCl and SO2 emissions (kmoles H+ eq./MG Clean Water Delivered)
410 420 393 373 391
218 223208
198208
39 40 3735 37
25.625.9 26.7 25.024.7
0
100
200
300
400
500
600
700
2001 2002 2003 2004 2005
kmol
es H
+ eq
./MG
AmmoniaNitrogen OxidesHydrochloric AcidSulfur Dioxide

51
Electricity utilization accounts for 85% of the total acidification potential for the Ann
Arbor WTP for the five year period. Production processes of the chemicals utilized for
treatment account for 14% of the total acidification potential. The SO2 and NOx
emissions from electricity were major contributors to the total Acidification potential for
the plant (Appendix A-II-c).
This chapter has presented the total life-cycle environmental impacts from operation of
the Ann Arbor Water Treatment Plant. The findings discussed in this chapter and the
findings from the analysis of the Ann Arbor WWTP will be discussed together in chapter
6 for a combined assessment of the Ann Arbor ‘water and wastewater’ treatment system.
The next chapter presents an assessment of the total life-cycle environmental impacts
resulting from operation of the Ann Arbor Wastewater Treatment Plant.

52
Chapter 3
Ann Arbor Wastewater Treatment Plant
3.1 Background
The Ann Arbor Wastewater Treatment Plant is responsible for the collection, tertiary
treatment and discharge of wastewater in accordance with the NPDES† permits issued
under the provision of CWA‡. The service area includes the City of Ann Arbor and parts
of Pittsfield, and Scio townships. The plant constructed in 1937 and upgraded in 1977
comprises of two independent and similar plants - ‘East Plant’ and ‘West Plant’- together
designed to treat an average of 29.5 MGD and up to 48 MGD. Eight sewage lift stations
located around the city are operated and maintained for effective collection of
wastewater. The Ann Arbor Wastewater Treatment Plant (WWTP) provides Primary,
Secondary and Tertiary treatment to the influent.
3.2 Wastewater Treatment
Preliminary treatment is provided to the influent by three climbing bar screens and grit
chambers before the flow is diverted to the East or West plants.
Figure 3-1. Treatment Process Flow for Ann Arbor WWTP
† National Pollutant Discharge Elimination System ‡ Clean Water Act
Wastewater Collected
Bar Screens
Grit Removal
Primary Clarifier
Activated Sludge
Secondary Clarifier
Landfill
Filtration Ultraviolet Disinfection
Sludge Dewatering
Landfill / Land Application
Effluent
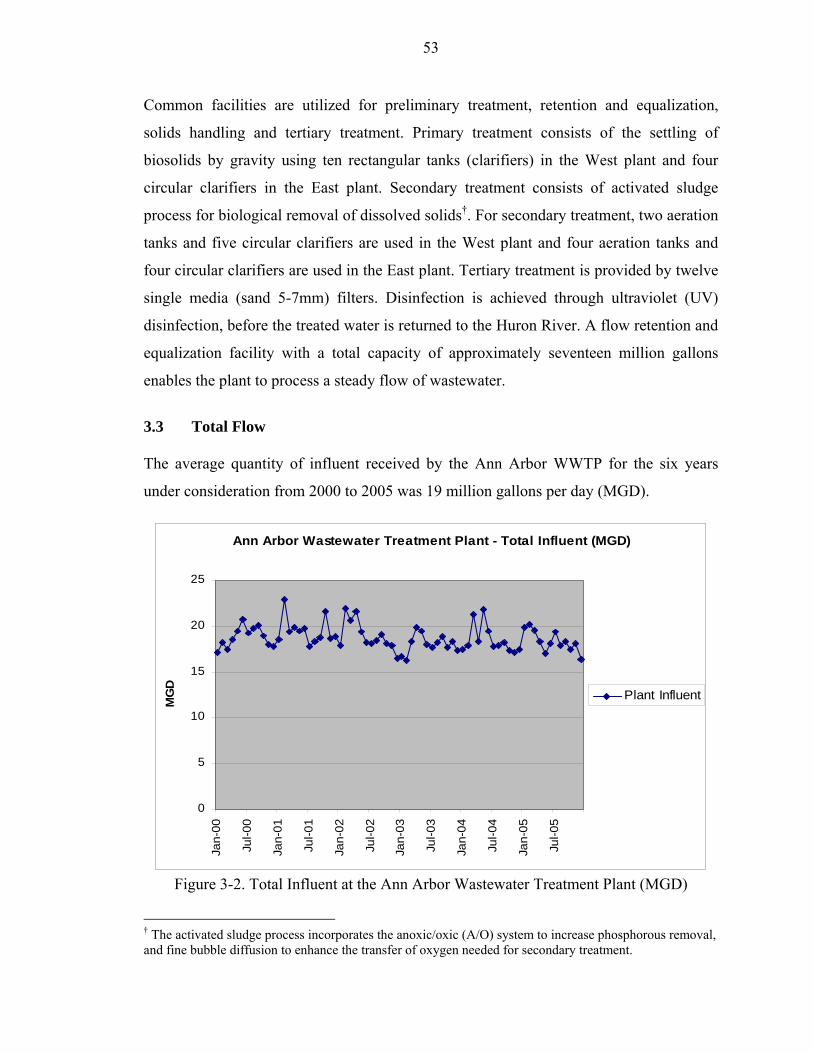
53
Common facilities are utilized for preliminary treatment, retention and equalization,
solids handling and tertiary treatment. Primary treatment consists of the settling of
biosolids by gravity using ten rectangular tanks (clarifiers) in the West plant and four
circular clarifiers in the East plant. Secondary treatment consists of activated sludge
process for biological removal of dissolved solids†. For secondary treatment, two aeration
tanks and five circular clarifiers are used in the West plant and four aeration tanks and
four circular clarifiers are used in the East plant. Tertiary treatment is provided by twelve
single media (sand 5-7mm) filters. Disinfection is achieved through ultraviolet (UV)
disinfection, before the treated water is returned to the Huron River. A flow retention and
equalization facility with a total capacity of approximately seventeen million gallons
enables the plant to process a steady flow of wastewater.
3.3 Total Flow
The average quantity of influent received by the Ann Arbor WWTP for the six years
under consideration from 2000 to 2005 was 19 million gallons per day (MGD).
Figure 3-2. Total Influent at the Ann Arbor Wastewater Treatment Plant (MGD)
† The activated sludge process incorporates the anoxic/oxic (A/O) system to increase phosphorous removal, and fine bubble diffusion to enhance the transfer of oxygen needed for secondary treatment.
Ann Arbor Wastewater Treatment Plant - Total Influent (MGD)
0
5
10
15
20
25
Jan-
00
Jul-0
0
Jan-
01
Jul-0
1
Jan-
02
Jul-0
2
Jan-
03
Jul-0
3
Jan-
04
Jul-0
4
Jan-
05
Jul-0
5
MG
D
Plant Influent

54
The maximum quantity treated during this period is 23 MGD in the month of February in
2001. The lowest influent flow recorded during the same period is 17 MGD in January
2000. Figure 3-2 illustrates the quantity of wastewater treated at the plant in terms of
million gallons per day (MGD) based on the monthly data obtained from the plant. The
influent quantity was generally low during winter months and high during summer
months ranging from 450 MG per month to 675 MG per month. The average quantity of
influent treated at the plant was 568 MG per month for the duration of six years. Figure
3-3 presents the quantity of influent received and treated at the plant in MG/month.
Figure 3-3. Total Flow at the Ann Arbor Wastewater Treatment Plant (MG/month)
Further details of the plant influent received by the Ann Arbor WWTP are located in
Appendix B-I-a.
3.3 Electricity Utilization
The electricity utilized by the Ann Arbor Wastewater treatment plant includes the
electricity consumed for operation of both treatment plants and administrative buildings.
The average electricity utilized by the Ann Arbor WWTP for the period of six years is
Ann Arbor Wastewater Treatment Plant - Total Influent (MG/month)
0
100
200
300
400
500
600
700
800
Jan-
00
Jul-0
0
Jan-
01
Jul-0
1
Jan-
02
Jul-0
2
Jan-
03
Jul-0
3
Jan-
04
Jul-0
4
Jan-
05
Jul-0
5
MG
per
mon
th
Plant Influent

55
1,103,685 kWh per month. The maximum monthly electricity utilization during the six
year period from 2000 to 2005 is 1,354,608 kWh in March 2003.
Figure 3-4. Total Electricity Utilization for Ann Arbor WWTP (kWh/month)
Figure 3-5. Total Electricity Utilization (kWh/MG)
Ann Arbor WWTP- Electricity Utilization (kWh/month)
-
200,000
400,000
600,000
800,000
1,000,000
1,200,000
1,400,000
1,600,000
Jan-
00
Jul-0
0
Jan-
01
Jul-0
1
Jan-
02
Jul-0
2
Jan-
03
Jul-0
3
Jan-
04
Jul-0
4
Jan-
05
Jul-0
5
kWh
per m
onth
Electricity
Ann Arbor WWTP - Electricity Utilization (kWh/MG Wastewater Treated)
0
1000
2000
3000
4000
5000
6000
Jan-
00
Jul-0
0
Jan-
01
Jul-0
1
Jan-
02
Jul-0
2
Jan-
03
Jul-0
3
Jan-
04
Jul-0
4
Jan-
05
Jul-0
5
kWh
/ MG
Electricity

56
The electricity utilization gets reduced in 2005 (Figure 3-4 and Figure 3-5) when
compared with the recorded consumption in previous years. The details of the electricity
utilization per month at the East Plant and the West Plant have been included in
Appendix B-I-b.
3.4 Natural Gas Utilization
The natural gas utilization at the Ann Arbor Wastewater Treatment Plant is reported as
CCF per month. The consumption figures were available from July 2002 to December
2005; hence, the analysis is based on only data available for this period. Average
consumption for the six year period is 17,706 CCF per month. This figure includes the
consumption in the boilers, retention building and administrative building. Figure 3-6
illustrates the total natural gas consumption at the Ann Arbor WWTP per month in terms
of CCF/month.
Figure 3-6. Natural Gas Consumption for Ann Arbor WWTP (CCF/month)
The consumption of natural gas is high during the winter months for heating. The
quantity of natural gas consumed per million gallons of wastewater treated at the Ann
Arbor WWTP is also high during the winter months. Figure 3-7, presents the natural gas
Ann Arbor WWTP- Natural Gas Utilization (CCF/month)
-
5,000
10,000
15,000
20,000
25,000
30,000
35,000
40,000
45,000
50,000
Jul-0
2
Oct
-02
Jan-
03
Apr
-03
Jul-0
3
Oct
-03
Jan-
04
Apr
-04
Jul-0
4
Oct
-04
Jan-
05
Apr
-05
Jul-0
5
Oct
-05
CC
F pe
r m
onth
Naturalgas

57
consumption for treating one million gallons of wastewater at the plant during the winter
months over the entire year.
Figure 3-7. Natural Gas Utilization at the Ann Arbor WWTP (CCF/MG)
The natural gas utilization per million gallons of wastewater treated at the plant ranges
from less than 1 CCF/MG to 74 CCF/MG. The average consumption from July 2002 to
December 2005 is 32 CCF/MG wastewater treated at the plant.
3.4 Chemicals Utilized for Treatment
The Ann Arbor WWTP uses only two chemicals for treatment of wastewater - ferric
chloride and lime. The quantity of ferric chloride utilized per month from January 2000
to December 2005 ranges from 3 metric tons in June 2001 to 120 metric tons in
December 2000. The average utilization of ferric chloride for the six year period is 31
metric tons per month. Lime utilization for the same period ranges from 55 metric tons in
November 2004 to 336 metric tons in November 2000. The average utilization of lime
during this period is 120 metric tons per month. The quantity of lime utilized is
exceptionally high for November 2000 and October 2005 (Figure 3-8).
Ann Arbor WWTP- Natural Gas Utilization (CCF/MG Wastewater Treated)
-
10
20
30
40
50
60
70
80
90
100Ju
l-02
Oct
-02
Jan-
03
Apr
-03
Jul-0
3
Oct
-03
Jan-
04
Apr
-04
Jul-0
4
Oct
-04
Jan-
05
Apr
-05
Jul-0
5
Oct
-05
CC
F/M
G
Naturalgas

58
Figure 3-8. Chemicals Utilized at the Ann Arbor WWTP (metric tons/month)
Figure 3-9. Energy required for Production of Chemicals Utilized for Treatment at the Ann Arbor WWTP (GJ/month)
Energy required for producing Ferric Chloride and Lime each was computed based on the
assumptions and figures in section 1.5.2. The average energy consumption for production
Ann Arbor WWTP- Chemicals Utilized for Treatment (metric tons/month)
-
50
100
150
200
250
300
Jan-
00
Jul-0
0
Jan-
01
Jul-0
1
Jan-
02
Jul-0
2
Jan-
03
Jul-0
3
Jan-
04
Jul-0
4
Jan-
05
Jul-0
5
met
ric to
ns p
er m
onth
FerricChlorideLime
Ann Arbor WWTP- Total Energy Required for Production of Chemicals Utilized for Treatment (GJ/month)
-
500
1,000
1,500
2,000
2,500
3,000
Jan-
00
Jul-0
0
Jan-
01
Jul-0
1
Jan-
02
Jul-0
2
Jan-
03
Jul-0
3
Jan-
04
Jul-0
4
Jan-
05
Jul-0
5
GJ
per m
onth
TotalEnergy forChemicals

59
of chemicals used at the plant during 2000 to 2005 is 829 GJ per month. Details of the
data used for these calculations are included in Appendix B-I-d.
3.5 Sludge Disposal
The Ann Arbor WWTP uses landfill and land-application sites for disposal of sludge
produced upon treatment of wastewater at the plant. The total volume of sludge produced
prior to dewatering for the six-year period ranges from 2,121 kGal per month to 4,250
kGal per month (Figure 3-10).
Figure 3-10. Total Volume of Sludge Produced at the Ann Arbor WWTP (kGal/month)
More than 50% of the total sludge is sent to land-application sites every year. Land-
application does not usually take place from January to March and is usually low in
November, December and April. Figure 3-11, shows the quantities of sludge transported
to landfill and land-application sites.
Ann Arbor WWTP- Total Volume of Sludge Produced (kGal/month)
0
500
1000
1500
2000
2500
3000
3500
4000
4500
Jan-
00
Jul-0
0
Jan-
01
Jul-0
1
Jan-
02
Jul-0
2
Jan-
03
Jul-0
3
Jan-
04
Jul-0
4
Jan-
05
Jul-0
5
kGal
per
mon
th
TotalSludge

60
Figure 3-11. Sludge Disposal at Landfill and Land-application Sites for Ann Arbor WWTP (kGal/month)
Figure 3-12. Wet Weight of Sludge Transported from Ann Arbor WWTP to the Landfill (metric tons/month)
Ann Arbor WWTP- Sludge Disposal at the Landfill and Land-application Sites (kGal/month)
0
500
1000
1500
2000
2500
3000
3500
4000
4500
Jan-
00
Jul-0
0
Jan-
01
Jul-0
1
Jan-
02
Jul-0
2
Jan-
03
Jul-0
3
Jan-
04
Jul-0
4
Jan-
05
Jul-0
5
kGal
per
mon
th
Landfill
Land-application
Ann Arbor WWTP - Wet Weight of Sludge Transported to the Landfill (metric tons per month)
0
2000
4000
6000
8000
10000
12000
14000
16000
Jan-
00
Jul-0
0
Jan-
01
Jul-0
1
Jan-
02
Jul-0
2
Jan-
03
Jul-0
3
Jan-
04
Jul-0
4
Jan-
05
Jul-0
5
met
ric
tons
per
mon
th
Sludgefor landfill

61
The average quantity of sludge transported to the landfill is 902 metric tons per month
based on information available for 2000 to 2005 (Figure 3-12). Further, the quantity of
dry solids transported to the landfill has been plotted in Figure 3-13. The average quantity
of dry solids disposed at the landfill is 222 metric tons per month.
Figure 3-13. Dry Weight of Sludge Transported from Ann Arbor WWTP to the Landfill (metric tons/month)
Since the sludge transported to landfill is dewatered and compressed into wet-cakes with
25% solids, the average weight of the sludge transported to the land-fill is less than the
weight of liquid transported for land-application (Figure 3-13).
Figure 3-14 illustrates the wet weight of the sludge transported to the land-application
sites. The average quantity of sludge transported to the land-application sites during
January 2000 to December 2005 is 6,764 metric tons per month. The percentage of solids
in the liquid used for land-application is less than 5%. Figure 3-15 presents the dry
weight of sludge transported for land-application. The dry weight is nearly the same as
the dry weight of sludge transported to landfill, however, the wet weight is significantly
higher because of the water being transported with the sludge.
Ann Arbor WWTP- Dry Weight of Sludge Transported to the Landfill (metric tons per month)
0
100
200
300
400
500
600
700
800
900
Jan-
00
Jul-0
0
Jan-
01
Jul-0
1
Jan-
02
Jul-0
2
Jan-
03
Jul-0
3
Jan-
04
Jul-0
4
Jan-
05
Jul-0
5
met
ric
tons
per
mon
th
DrySolids
y

62
Figure 3-14. Wet Weight of Water and Sludge Transported for Land-application from Ann Arbor WWTP (metric tons/month)
Figure 3-15. Dry Weight of Sludge Transported from Ann Arbor WWTP to the Land-application Sites (metric tons/month)
Ann Arbor WWTP - Wet Weight of Sludge Transportd to the Land Application Sites (metric tons per month)
0
2000
4000
6000
8000
10000
12000
14000
16000
Jan-
00
Jul-0
0
Jan-
01
Jul-0
1
Jan-
02
Jul-0
2
Jan-
03
Jul-0
3
Jan-
04
Jul-0
4
Jan-
05
Jul-0
5
met
ric
tons
per
mon
th
Sludge forlandapplication
Ann Arbor WWTP- Dry Weight of Sludge Transported to the Land Application Sites (metric tons per month)
0
100
200
300
400
500
600
700
800
900
Jan-
00
Jul-0
0
Jan-
01
Jul-0
1
Jan-
02
Jul-0
2
Jan-
03
Jul-0
3
Jan-
04
Jul-0
4
Jan-
05
Jul-0
5
met
ric
tons
per
mon
th
DrySolids

63
The quantity of diesel fuel required for transporting sludge to land-application sites and
to the landfill is calculated on a monthly basis (Section 1.5.4). The average one-way
distance to the land-application sites was 32 miles and the average one-way distance to
the landfill was 80 miles. Figure 3-16 presents a comparison of the total wet weight of the
sludge transported for landfill and land-application per month. It is clear in this figure
that the weight of the sludge transported for land-application is much higher than that for
landfill.
Figure 3-16. Wet Weight of Sludge Transported from Ann Arbor WWTP to the Landfill and Land Application Sites (metric tons/month)
However, even though a large difference is observed in the wet weights for landfill and
land-application the quantity of diesel fuel consumed per month for transporting sludge to
landfill and land-application does not differ in the same proportion as the wet weight.
This is because the distance to the landfill is much more than the distance to the land-
application sites. Figure 3-17 illustrates the amount of diesel fuel consumed for
transporting sludge.
Ann Arbor WWTP- Wet Weight of Sludge Transported to the Landfill and Land Application Sites (metric tons per month)
0
2000
4000
6000
8000
10000
12000
14000
16000
18000
Jan-
00
Jul-0
0
Jan-
01
Jul-0
1
Jan-
02
Jul-0
2
Jan-
03
Jul-0
3
Jan-
04
Jul-0
4
Jan-
05
Jul-0
5
met
ric to
ns p
er m
onth
Landfill
Land-application

64
Figure 3-17. Diesel fuel Consumption for Sludge Hauling (gallons/month)
The data presented in Table 3-1 summarizes the annual consumption of diesel fuel for
sludge hauling based on the total weight of sludge transported to land-fill and land-
application sites.
Table 3-1 Sludge Disposal at Landfill and Land-application sites for Ann Arbor WWTP
Year Total
Sludge Sludge for Land filling Sludge for Land
application
Diesel fuel Consumed for Sludge Hauling
Landfill and land-appli.
(wet cake and dry solids)
(sludge and water) Landfill Land-applicati-
on
metric tons
metric tons
metric ton-miles
metric tons
metric ton-miles Gallons Gallons
2000 111,534 11,636 930,841 100,059 3,178,654 24,667 84,234 2001 100,943 12,332 986,596 88,770 2,820,184 26,145 74,735 2002 98,489 13,499 1,079,919 85,182 2,706,546 30,164 71,723 2003 94,632 14,228 1,138,246 80,596 2,560,321 30,164 67,849 2004 92,353 12,386 990,903 80,190 2,548,480 26,259 67,535 2005 91,779 18,183 1,454,677 73,980 2,350,807 38,549 62,296
Since the one-way distance to the landfill is 80miles which is much more than the
average distance to the land-application sites, the diesel fuel consumed per metric-ton of
Ann Arbor WWTP- Diesel Fuel Consumption for Transporting Sludge to the Landfill and Land Application Sites (Gallons/month)
0
2000
4000
6000
8000
10000
12000
14000
Jan-
00
Jul-0
0
Jan-
01
Jul-0
1
Jan-
02
Jul-0
2
Jan-
03
Jul-0
3
Jan-
04
Jul-0
4
Jan-
05
Jul-0
5
Gal
lons
per
mon
th
Landfill
Land-application

65
sludge disposed at the landfill is certainly higher (2.12 gallons/metric ton as opposed to
0.84 gallons/metric ton for land-application). However, the weight of the sludge
transported in liquid form† for land-application is much more than the weight of the
sludge transported in the form of wet cakes‡. Hence, disposal at landfill could be more
energy efficient in terms of sludge disposal if the distance to the landfill is reduced.
Further, since the sludge disposal at land-application site replaces the fertilizer at these
sites, the primary energy for fertilizers is saved. Although the system boundary for this
study does not include an analysis on the energy saved due to replacement of fertilizers,
an analysis can be conducted to determine the more energy-efficient option between land-
fill and land-application. However, land-application sites cannot be used for sludge-
disposal during the winter months, thus both options are required for sludge disposal over
a year. Further details of data and calculations are included in Appendix B-I (e).
3.6 Life-cycle Energy Consumption for Operation of Ann Arbor WWTP
The total life-cycle energy consumed per month for operating the Ann Arbor WWTP
includes energy consumed for generating electricity for operating the plant; using natural
gas for heating purposes; producing the chemicals required for treatment at the plant; and,
transporting the sludge produced to the disposal sites. The total life –cycle energy is not
computed for all the six years since some of the data on electricity consumption is
missing for the year 2005. Also, the natural gas consumption figures are unavailable or
partially available from 2000 to 2002. As a result, Table 3-2 presents the findings of the
life-cycle analysis for two years- 2003 and 2004.
Table 3-2 Life-cycle Energy Consumed for Operation of Ann Arbor WWTP
Year Electricity Natural Gas Chemicals Disposal Total
GJ GJ/MG % GJ
GJ/MG % GJ
GJ/MG % GJ
GJ/ MG % GJ
GJ/MG
2003 53229 8 51 24660 4 24 9167 1 9 16339 2 16 103,396 16 2004 52096 8 48 30803 5 29 9037 1 8 15636 2 15 107,571 16
† with less than 5% solids ‡ with approximately 25% solids

66
The total life-cycle energy for operation of Ann Arbor WWTP is 103,396 GJ for 2003
and 107,571 GJ for the year 2004. Based on this total life-cycle energy per year, the life-
cycle energy per million gallons of wastewater treated at the plant is calculated. The life-
cycle energy for operation of the plant per million gallons wastewater treated is 16
GJ/MG. Figure 3-18 shows the contribution of electricity, natural gas, chemicals and
diesel fuel consumption to the total life-cycle energy for operation of the Ann Arbor
WWTP in 2003 and 2004.
Figure 3-18. Total Life-cycle Energy for Operation of Ann Arbor Wastewater Treatment Plant (GJ/Year)
Direct electricity utilization for plant operation is 50% of the total life-cycle energy for
the plant. Natural gas consumption represents 26% of the total life-cycle energy. The
production of chemicals utilized for treatment constitutes 9% of the total life-cycle
energy for operation of the plant. Surprisingly, Sludge Disposal phase was quite energy
expensive, accounting for 16% of the total life-cycle energy calculated for this study.
While energy can be conserved in each of the categories, sludge disposal is one phase in
which energy consumption can be reduced by getting access to closer sites for sludge
disposal. The total life-cycle energy figures are normalized to report the total life-cycle
Ann Arbor WWTP - Total Life Cycle Energy (GJ/Yr)
53229 52096
24660 30803
91679037
1633915636
0
20000
40000
60000
80000
100000
120000
2003 2004
GJ
/ Yr Disposal
ChemicalsNatural gasElectricity

67
energy per million gallons of the wastewater treated. These results are presented in Figure
3-19.
Figure 3-17. Total Life-cycle Energy for Operation of Ann Arbor WWTP (GJ/MG)
The life-cycle energy consumed for treating one million gallons of wastewater at the Ann
Arbor WWTP is 16 GJ. The energy associated with direct electricity for plant operation
is 8 GJ/MG and the energy for natural gas required at the plant is 5 GJ/MG. Production of
chemicals utilized for treatment at the plant and sludge disposal accounted for
approximately 1 GJ/MG and 2 GJ/MG respectively.
3.7 Life-cycle Emissions from Operation of Ann Arbor WWTP
The total life-cycle emissions for the Ann Arbor WWTP are computed for 2003 and 2004
based on the energy consumed for each year. The detailed calculations for this section are
located in Appendix B-II. The results obtained from the annual figures have been
categorized into Global Warming Potential, Eutrophication Potential and Acidification
Potential in this section.
Ann Arbor WWTP - Total Life Cycle Energy (GJ per MG Wastewater Treated)
8 8
4 5
1 12 2
02
468
101214
1618
2003 2004
GJ
/ MG
-Yr Disposal
ChemicalsNatural gasElectricity

68
i. Global Warming Potential
The contribution of electricity utilization, natural gas utilization, diesel fuel consumption
and sludge hauling towards the total global warming potential from operation of the Ann
Arbor WWTP is shown in Figure 3-20.
Figure 3-20. Life-Cycle Global Warming Potential from Electricity, Chemicals, Natural Gas and Diesel fuel Utilized at Ann Arbor WWTP (kg CO2 eq. /MG)
The total global warming potential from operation of the plant is 1,980 kg CO2 equivalent
per MG. Emissions from electricity account for 1,725 kg CO2 equivalent per MG for each
year, emissions from diesel fuel consumption account for 166 kg CO2 equivalent per MG
and 89 kg CO2 equivalent per MG from chemicals per year for 2003 and 2004. Thus,
electricity utilized accounts for 87% of the total GWP, diesel fuel used for sludge hauling
for 9% and production of chemicals used for treatment results into 5% of the total GWP.
Figure 3-21 illustrates the results upon emissions analysis categorized into key
greenhouse gases- carbon dioxide, methane and nitrous oxide.
Ann Arbor WWTP- Global Warming Potential from Electricity, Chemicals, Natural Gas and Diesel Fuel (kg CO2 eq./MG)
1703 1746
174 16290 882 2
0
500
1000
1500
2000
2500
2003 2004
kg C
O2
eq. /
MG Natural Gas
ChemicalsDieselElectricity

69
Figure 3-21. Life-Cycle Global Warming Potential from Carbon Dioxide, Nitrous Oxide and Methane emissions at the Ann Arbor WWTP (kg CO2 eq./MG)
Table 3-3 Global Warming Potential from the Ann Arbor WWTP (kg CO2 eq. /MG)
Global Warming Potential for Ann Arbor WWTP (kgs of CO2 eq./MG) 2003
Electricity Nat. Gas Diesel fuel Chemicals Total/MGCarbon Dioxide 1613 2 173 88 1876Methane CH4 63 0 1 2 66Nitrous Oxide 27 0 0 0 27Total GWP/MG 1703 2 174 90 1970% of Total GWP/MG 86 0.1 9 5
2004 Electricity Nat. Gas Diesel fuel Chemicals Total/MGCarbon Dioxide 1653 2 162 86 1903Methane CH4 65 0 1 2 68Nitrous Oxide 28 0 0 0 28Total GWP/MG 1746 2 162 88 1999% of Total GWP/MG 87 0.1 8 4
A summary of the results obtained upon emissions analysis for determining the total
global warming potential from operating the Ann Arbor WWTP is compiled in Table 3-3
above. It is evident from the figures presented in Table 3-3 that CO2 emissions from
Ann Arbor WWTP- Global Warming Potential from N2O, CH4 and CO2 Emissions (kg CO2 eq./MG)
1876 1903
66 682827
0
500
1000
1500
2000
2500
2003 2004
kg C
O2
eq. /
MG
Nitrous Oxide Methane Carbon Dioxide

70
electricity utilization represent a significantly high percentage of the total global warming
potential for the plant. Further details can be found in Appendix B-II-a.
ii. Eutrophication Potential
Eutrophication potential in terms of grams of Nitrogen (N) equivalence is computed
separately for atmospheric and aquatic emissions for the two year period. The total
atmospheric eutrophication potential for 2003 and 2004 is 650 g N equivalent per MG of
treated wastewater. Figure 3-22, shows the atmospheric emissions in terms of
eutrophication potential from electricity, natural gas and diesel fuel consumption.
Figure 3-22. Atmospheric Eutrophication Potential from Electricity, Chemicals, Natural Gas and Diesel fuel Used at Ann Arbor WWTP (g N eq. /MG)
Electricity utilization accounts for 56% of the total atmospheric eutrophication potential.
Further, diesel fuel consumption contributes 43% the total atmospheric eutrophication
potential. High NOx emissions from electricity and diesel fuel are greatly responsible for
the total atmospheric eutrophication potential. Figure 3-23, presents the atmospheric
eutrophication potential resulting from nitrogen oxides and ammonia emissions due to
electricity, natural gas and diesel fuel utilization.
Ann Arbor WWTP - Atmospheric Eutrophication Potential from Electricity, Chemicals, Natural Gas and Diesel Fuel (g N eq./MG)
167 160
129121
22
0.40.3
0
50
100
150
200
250
300
350
2003 2004
g N
eq.
/MG
Natural GasChemicalsDieselElectricity

71
Figure 3-23. Atmospheric Eutrophication Potential from Ammonia and Nitrogen Oxide Emissions at Ann Arbor WWTP (g N eq. /MG)
Figure 3-24. Aquatic Eutrophication Potential from Electricity, Natural Gas and Diesel fuel Utilized at Ann Arbor WWTP (g N eq. /MG)
Ann Arbor WWTP - Aquatic Eutrophication Potential from Electricity, Natural Gas, Chemicals and Diesel Fuel (g N eq./MG)
3.13 2.99
0.160.15
0.03 0.03
0.030.04
0
0.5
1
1.5
2
2.5
3
3.5
4
2003 2004
g N
eq.
/MG
Natural GasChemicalsDieselElectricity
Ann Arbor WWTP - Atmospheric Eutrophication Potential from NH3 and NOx Emissions (g N eq./MG)
299 283
0.420.04
0
50
100
150
200
250
300
350
2003 2004
g N
eq.
/MG Ammonia
NitrogenOxides
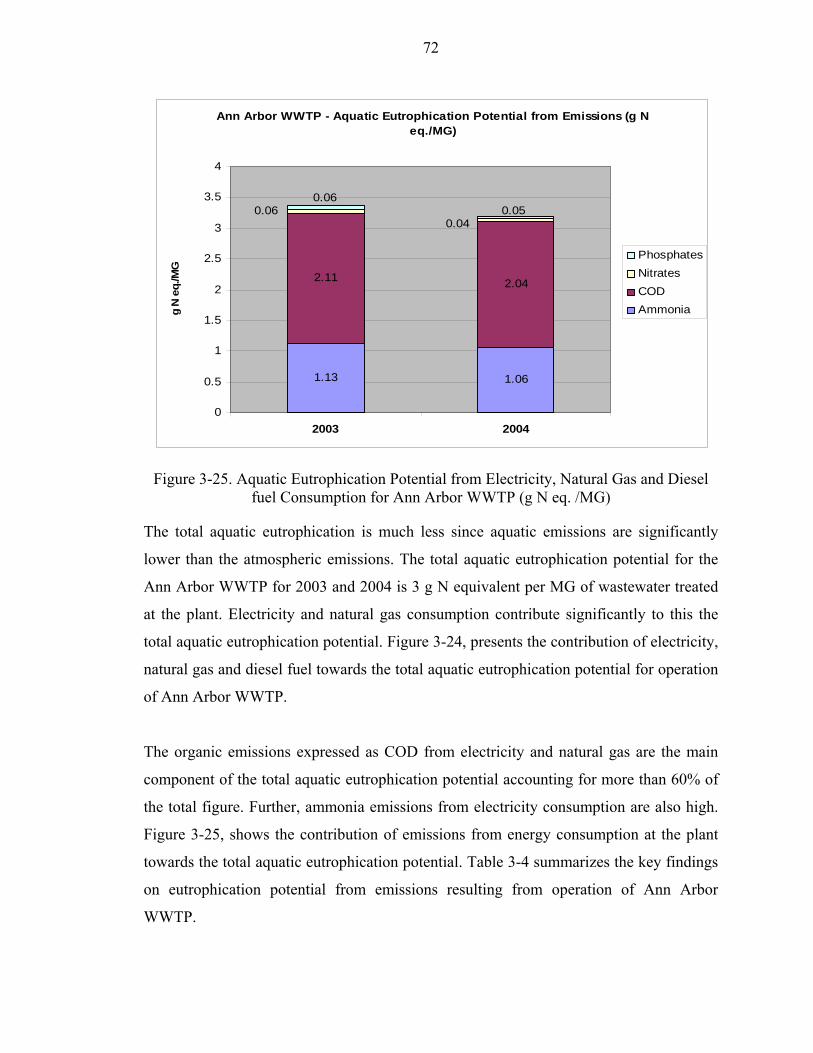
72
Figure 3-25. Aquatic Eutrophication Potential from Electricity, Natural Gas and Diesel fuel Consumption for Ann Arbor WWTP (g N eq. /MG)
The total aquatic eutrophication is much less since aquatic emissions are significantly
lower than the atmospheric emissions. The total aquatic eutrophication potential for the
Ann Arbor WWTP for 2003 and 2004 is 3 g N equivalent per MG of wastewater treated
at the plant. Electricity and natural gas consumption contribute significantly to this the
total aquatic eutrophication potential. Figure 3-24, presents the contribution of electricity,
natural gas and diesel fuel towards the total aquatic eutrophication potential for operation
of Ann Arbor WWTP.
The organic emissions expressed as COD from electricity and natural gas are the main
component of the total aquatic eutrophication potential accounting for more than 60% of
the total figure. Further, ammonia emissions from electricity consumption are also high.
Figure 3-25, shows the contribution of emissions from energy consumption at the plant
towards the total aquatic eutrophication potential. Table 3-4 summarizes the key findings
on eutrophication potential from emissions resulting from operation of Ann Arbor
WWTP.
Ann Arbor WWTP - Aquatic Eutrophication Potential from Emissions (g N eq./MG)
1.13 1.06
2.11 2.04
0.040.06 0.05
0.06
0
0.5
1
1.5
2
2.5
3
3.5
4
2003 2004
g N
eq.
/MG
PhosphatesNitratesCODAmmonia

73
Table 3-4 Eutrophication Potential for of Ann Arbor WWTP (g N eq. /MG) Eutrophication Potential for Ann Arbor WWTP
2003 2004 Atmospheric Aquatic Atmospheric Aquatic
g Nitrogen eq. /MG g Nitrogen eq. /MG g Nitrogen eq. /MG g Nitrogen eq. /MG NOx 299 N NOx 283 N NH3 0.04 NH3 1 NH3 0.4 NH3 1
NH4+ COD 2 NH4+ COD 2NO3
- NO3- 0.06 NO3
- NO3- 0.04
PO43- PO4
3- 0.06 PO43- PO4
3- 0.05P P P P
Total 299 3 Total 283 3
Further details on calculations and results are included in Appendix B-II-b.
iii. Acidification Potential
The total acidification potential in terms of kmoles of H+ equivalent per million gallons
of wastewater treated at the Ann Arbor WWTP is 667 kmoles of H+ equivalent/MG.
Figure 3-24. Acidification Potential from Electricity, Chemicals, Natural Gas and Diesel Fuel Used at Ann Arbor WWTP (kmoles H+ eq. /MG)
Ann Arbor WWTP- Acidification Potential from Electricity, Chemicals, Natural Gas and Diesel Fuel (kmoles H+ eq./MG)
533 509
149139
88
22
0
100
200
300
400
500
600
700
800
2003 2004
kmol
es H
+ eq
./MG Natural Gas
ChemicalsDieselElectricity

74
More than 78% of the total acidification potential is a result of emissions from electricity
utilization.
Figure 3-25. Acidification Potential for Ann Arbor WWTP (kmoles H+ eq. /MG Treated)
Figure 3-24 shows the acidification potential from electricity, chemicals, natural gas and
diesel fuel used at the plant. High sulfur dioxide emissions and nitrogen oxide emissions
from electricity utilized for operation of the Ann Arbor WWTP contribute significantly to
the total acidification potential.
Further, high nitrogen oxide emissions from diesel fuel used to transport sludge to
disposal sites also account towards the total acidification potential. Figure 3-25 presents
the contribution of ammonia, nitrogen oxides, hydrochloric acid and sulfur dioxide
towards the total acidification potential from operation of the plant. These results are
summarized in Table 3-5.
Ann Arbor WWTP- Acidification Potential from Emissions (kmoles H+ eq./MG)
360 344
301281
3029
0.330.31
0
100
200
300
400
500
600
700
800
2003 2004
kmol
es H
+ eq
./MG Ammonia
HydrochloricAcidNitrogen Oxides
Sulfur Dioxide

75
Table 3-5 Acidification Potential for Ann Arbor WWTP (kmoles of H+ eq. /MG)
Acidification Potential for Ann Arbor WWTP 2003 2004 Kmoles of H+ eq./MG Kmoles of H+ eq./MG
SO2 360 344 HCl 30 29 NOx 301 281 NH3 0.3 0.3 Total 691 654
The total life-cycle energy and emissions from operation of the Ann Arbor WWTP are
further discussed for a comparative assessment with other wastewater treatment plants
studied as part of this research effort in Chapter 5. Further the results obtained from the
analyses of the Ann Arbor WWTP are combined for an assessment of the Ann Arbor
‘water and wastewater’ treatment system in Chapter 6.

Chapter 4
Laguna Wastewater Treatment Plant
4.1 Background
The Laguna Wastewater Treatment Plant is a tertiary-level treatment facility that has an
average daily dry weather flow of 17.5 million gallons per day (MGD). Constructed in
1968 it serves the Cities of Santa Rosa, Rohnert Park, Sebastopol and Cotati. The plant
has many unique environmentally beneficial characteristics. Firstly, it is a part of the
Subregional System in California, which is one of the largest recyclers in the world. The
system irrigates around 6,400 acres of farmlands, vineyards and public and private
landscaping. 24 More detailed information has been provided in Appendix C-I-a.
Secondly, the plant is connected to the Geysers Recharge system, a geothermal operation
which generates around 85 megawatts per day using the treated water from the Laguna
Treatment Plant. The geysers steam fields are a rare geothermal occurrence in which
natural steam is produced when underground water comes into contact with the rocks that
have been heated by underlying magma†. The steam thus generated, escapes from the
ground in the form of hot springs or fumaroles because the magma in the geysers area is
relatively close to the Earth’s surface. When the steam reaches the surface in production
wells that have been drilled by energy companies, it travels through insulated pipelines to
a generator unit where it spins turbines to create electricity. Further details of the geysers
recharge system are included in Appendix C-I-b. Further, the plant utilizes co-generators
with three 900 KW Waukesha lean-burn engines reducing the burden of electricity
imported from the grid.
4.2 Wastewater Treatment
Large bar screens remove wood, paper, and plastics from the sewage collected from
homes, businesses, and industries before the wastewater reaches the treatment plant. Sand
and gravel then settle out in the grit tank and are removed. After this preliminary
† Magma is molten rock

77
treatment the sewage undergoes primary treatment. Figure 4-1, shows the treatment
process at the Plant.
Figure 4-1. Flow Diagram of the Treatment Process at the Laguna WWTP
Primary clarification tanks allow lighter materials to float to the surface, which is then
skimmed off. Biosolids, which are heavier, fall to the bottom and get pumped to
anaerobic digesters. Bacteria in the digesters break solids down, creating methane gas.
Methane powered generators serve as the source of energy for one-sixth of the treatment
process. Solids are digested for up to thirty days, reducing their volume by 50%.
Biosolids are blended with green waste material to create compost after dewatering, or
they are applied directly to agricultural fields as fertilizer. A very small quantity of the
sludge is sent to the landfill.
Secondary treatment at the plant utilizes aeration basins†, where microorganisms modify
pollutants to reduce their impact on the environment. The microorganisms get removed in
clarification tanks before the next treatment phase. As they settle to the bottom of the
† The aeration basins are tanks injected with oxygen to stimulate the growth of microorganisms and their consumption of dissolved wastes.
Wastewater Collected
Screens Grit
Removal Primary Clarifier
Activated Sludge
Secondary Clarifier
Landfill
Filtration
Ultraviolet Disinfection
Anaerobic Digester
Sludge Dewatering
Landfill / Land Application / Compost
Co-generators
Reuse Geysers Recharge
Electricity

78
clarifiers, they are returned to the aeration basins to re-supply the self-sustaining
population of microorganisms. For tertiary treatment, water flows through a four-foot bed
of coal. This small, black, granular coal acts as a filter to trap fine suspended solids and
some potential pathogens, or disease causing organisms. Finally, ultraviolet light (UV)
removes bacteria and viruses by destroying their DNA, the genetic material needed to
reproduce. The reclaimed water then leaves the plant, and is utilized for many reuse
purposes.
4.3 Total Flow
The average quantity of plant influent received by the Laguna WWTP for the six year
period from 2000 to 2005 is 21 MGD. The influent quantity is significantly high during
the winter months due to infiltration of water from winter storms (Figure 4-2).
Figure 4-2. Total Plant Influent Received at Laguna WWTP (MGD)
Figure 4-3, illustrates the monthly flow at the plant in terms of millions of gallons per
month. The total quantity of influent treated per month ranged from 494 MG in
September 2001 to 997 MG in December 2001. The average volume of the influent
received during this period is 629 MG per month. Further details can be found in
Appendix C-I-c.
Laguna WWT P - T o tal P lant Inf luent (M GD )
0
5
10
15
20
25
30
35
40
Jan-
00
Jul-0
0
Jan-
01
Jul-0
1
Jan-
02
Jul-0
2
Jan-
03
Jul-0
3
Jan-
04
Jul-0
4
Jan-
05
Jul-0
5
MG
D
PlantInfluent

79
Figure 4-3. Total Plant Influent Received at Laguna WWTP (MG/month)
4.4 Electricity Utilization
The electricity utilization for the Laguna Wastewater treatment plant includes the
electricity used for operation of treatment plant and administrative buildings.
Additionally it also includes part of the electricity consumed for pumping stations used
for recycling and geysers recharge systems. The average electricity consumption for the
Laguna WWTP for the period of six years is 2,848,891 kWh per month. Electricity
imported from the grid contributes around 60% of the total electricity consumption. The
remaining 40% is generated at the co-generation facility at the plant which uses methane
gas produced from anaerobic digestion at the plant for generating electricity. This reduces
the burden of electricity from the grid significantly. Figure 4-4, presents the total
electricity consumption and Figure 4-5 shows the electricity segregated into electricity
from the grid and electricity from the co-generators.
Laguna WWT P - T o tal P lant Inf luent (M G/ mo nth)
0
200
400
600
800
1000
1200
Jan-
00
Jul-0
0
Jan-
01
Jul-0
1
Jan-
02
Jul-0
2
Jan-
03
Jul-0
3
Jan-
04
Jul-0
4
Jan-
05
Jul-0
5
MG
per
mon
th
PlantInfluent

80
Figure 4-4. Electricity Utilization for Operation of Laguna WWTP (kWh/month)
Figure 4-5. Electricity Supplied from the Grid and Co-generators at the Plant for Operation of Laguna WWTP (kWh/month)
Laguna WWTP - Total Electricity Utilization (kWh/month)
-
500,000
1,000,000
1,500,000
2,000,000
2,500,000
3,000,000
3,500,000
4,000,000
Jan-
00
Jul-0
0
Jan-
01
Jul-0
1
Jan-
02
Jul-0
2
Jan-
03
Jul-0
3
Jan-
04
Jul-0
4
Jan-
05
Jul-0
5
kWh
per m
onth
TotalElectricity
Laguna WWTP - Electricity from the Grid and the Co-genertors (kWh/month)
-
500,000
1,000,000
1,500,000
2,000,000
2,500,000
3,000,000
Jan-
00
Jul-0
0
Jan-
01
Jul-0
1
Jan-
02
Jul-0
2
Jan-
03
Jul-0
3
Jan-
04
Jul-0
4
Jan-
05
Jul-0
5
kWh
per m
onth
Grid
Co-generator

81
Figure 4-6. Electricity Utilized from the Grid for Operation of Laguna WWTP (kWh/MG)
The calculations for total life-cycle energy and impacts were based on the actual
electricity consumption from the grid as opposed to the total requirement for operating
the plant. The average consumption of electricity from the grid for the six year period is
1,724,506 kWh per month. The average electricity obtained from the grid for operation of
the Laguna WWTP is 2773 kWh/MG wastewater treated at the plant. Further data,
calculations and results relevant to electricity consumption at the plant are located in
Appendix C-II-a.
4.4 Natural Gas Utilization
The natural gas utilized for the purpose of heating at the plant is produced at the plant’s
cogeneration facility using the gas discharged upon anaerobic digestion of the sludge.
The natural gas use at the Laguna WWTP ranges from 45 CCF/month to 2,890
CCF/month. The average consumption for the six year period is 2,170 CCF/month.
Figure 4-7 shows the consumption of natural gas in terms of CCF/month. The average
consumption of natural gas per million gallons of wastewater treated at the plant is 4
Laguna WWTP - Electricity Utilized from the Grid (kWh/MG)
-
500
1,000
1,500
2,000
2,500
3,000
3,500
4,000
4,500
Jan-
00
Jul-0
0
Jan-
01
Jul-0
1
Jan-
02
Jul-0
2
Jan-
03
Jul-0
3
Jan-
04
Jul-0
4
Jan-
05
Jul-0
5
kWh
per M
G
Electricityfrom Grid

82
CCF/MG. Figure 4-8 presents the consumption of natural gas per million gallons of
wastewater treated. Further details are included in Appendix C-I (e).
Figure 4-7. Natural Gas Utilization at the Laguna WWTP (CCF/month)
Figure 4-8. Natural Gas Utilization at the Laguna WWTP (CCF/MG)
Laguna WWTP - Natural Gas Utilization (CCF/month)
-
500
1,000
1,500
2,000
2,500
3,000
3,500
Jan-
00
Jul-0
0
Jan-
01
Jul-0
1
Jan-
02
Jul-0
2
Jan-
03
Jul-0
3
Jan-
04
Jul-0
4
Jan-
05
Jul-0
5
CC
F pe
r mon
th
NaturalGas
Laguna WWTP - Natural Gas Utilization (CCF/MG)
-
1
2
3
4
5
6
Jan-
00
Jul-0
0
Jan-
01
Jul-0
1
Jan-
02
Jul-0
2
Jan-
03
Jul-0
3
Jan-
04
Jul-0
4
Jan-
05
Jul-0
5
CC
F pe
r MG
NaturalGas

83
4.5 Chemicals Utilized for Treatment
The Laguna WWTP utilizes ferric chloride, aluminum sulfate (alum) and sodium
hypochlorite for treatment. The quantities of ferric chloride and alum were reported in
metric tons per month, whereas the quantity of the hypochlorite used was reported as the
total volume in gallons per year. Hence, Figure 4-9 that shows the consumption of
chemicals per month, comprises of only ferric chloride and alum.
Figure 4-9. Chemicals Utilized for Treatment at the Laguna WWTP (metric tons/month)
The average consumption of ferric chloride for the six year period is 30 metric tons per
month. Consumption of ferric chloride for the plant ranges from 15 metric tons/month to
352 metric tons/month. The consumption in November 2001 was exceptionally high. The
consumption of alum on the other hand was significantly high in April 2004. The average
consumption of alum for the six-year period is 16 metric tons/month, ranging from 10
metric tons/month to 50 metric tons/month.
The energy calculation for production of chemicals includes the average monthly
consumption calculated from the annual consumption figures of hypochlorite in addition
Laguna WWTP - Chemicals Utilized for Treatment (metric tons per month)
-
10
20
30
40
50
60
70
80
Jan-
00
Jul-0
0
Jan-
01
Jul-0
1
Jan-
02
Jul-0
2
Jan-
03
Jul-0
3
Jan-
04
Jul-0
4
Jan-
05
Jul-0
5
met
ric to
ns p
er m
onth
FerricChlorideAlum

84
to the monthly consumption of ferric chloride and alum. Figure 4-10, shows the total
energy required for production these chemicals per month.
Figure 4-10. Total Energy Required for Production of Chemicals Utilized for Treatment at the Laguna WWTP (GJ/month)
The average energy required for production of all the three chemicals utilized for
treatment at the plant is 805 GJ per month. Further details of the calculations involved are
attached in Appendix C-I-f.
4.6 Sludge Disposal
The sludge generated at the Laguna WWTP is either disposed at the landfill or land
application sites or it is composted very near to the plant. The energy required for sludge
hauling was therefore calculated based on the total quantity of sludge transported to the
landfill or the land application sites. Further, the energy consumption was calculated only
for the year 2005 since the required information was unavailable for all previous years.
Laguna WWTP - Total Energy Required for Production of Chemicals Utilized for Treatment (GJ/month)
-
500
1,000
1,500
2,000Ja
n-00
Jul-0
0
Jan-
01
Jul-0
1
Jan-
02
Jul-0
2
Jan-
03
Jul-0
3
Jan-
04
Jul-0
4
Jan-
05
Jul-0
5
GJ
per m
onth
Energy forChemicals

85
Table 4-1 Energy Consumption for Sludge Hauling from Laguna WWTP
Date Total
Sludge Land
application I Land
application II Landfill Total Hauled Diesel Fuel Consumed
Wt. Dist. Wt. Dist. Wt. Dist. Month/Year
metric tons
metric tons Miles
metric tons Miles
Metric tons Miles
metric ton-miles Gallons GJ
GJ/ MG
Year 2005
25,398 6898 18 5693 5 6300 7
196,729 5213 869 0.11
Table 4-1, summarizes the energy consumption for sludge hauling at the Laguna WWTP.
Around 25% of the sludge produced upon treatment is composted; the energy estimate
for composting is not included in this analysis. The diesel fuel consumption was
calculated based on the total distance to the disposal sites and the total wet weight of the
sludge transported for disposal (Section 1.5.4). The energy calculated in terms of gallons
of diesel fuel is converted to GJ for calculation of the total life-cycle energy.
4.7 Life-cycle Energy for Operation of the Laguna WWTP
The life-cycle energy required for operation of the Laguna WWTP is computed for a
single year due to lack of data on sludge hauling for rest of the years. The total life-cycle
energy for operation of the plant for the year 2005 is 91,068 GJ.
Figure 4-11. Total Life-cycle Energy for operation of Laguna WWTP (GJ/Yr)
Laguna WWTP - Total Life-Cycle Energy (GJ/Yr)
7468869
82730
0
10000
20000
30000
40000
50000
60000
70000
80000
90000
2005
GJ
/ Yr Electricity
Chemicals
Disposal
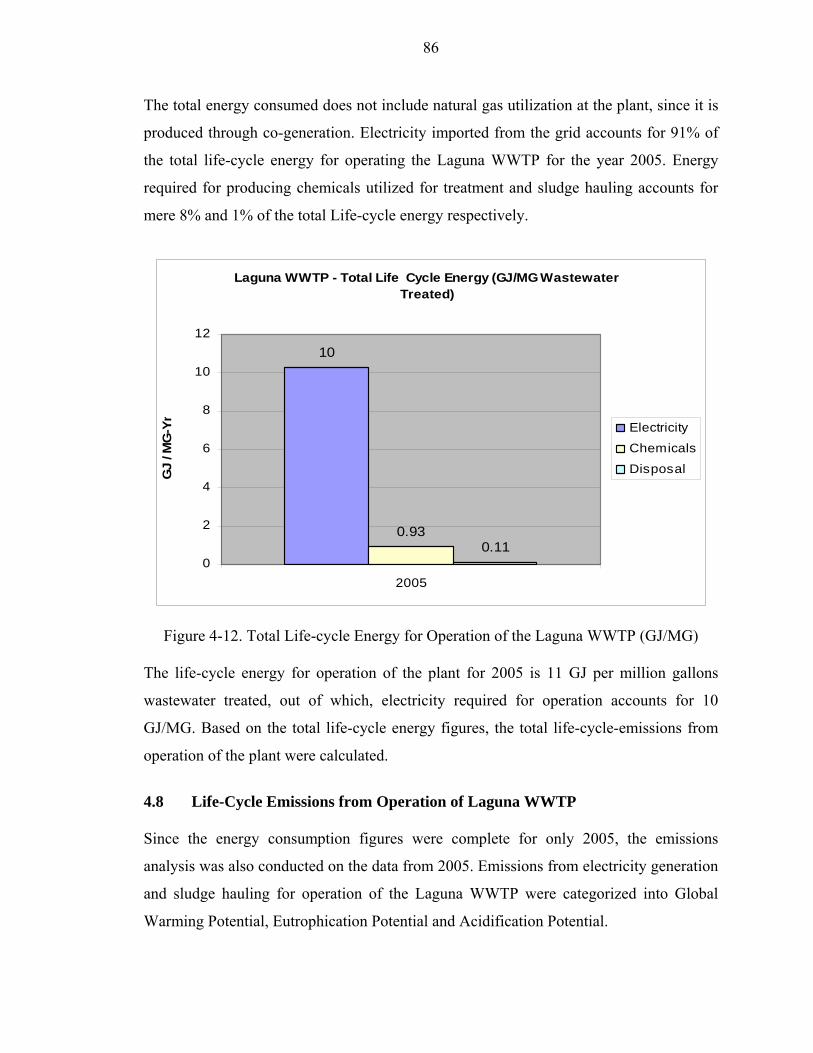
86
The total energy consumed does not include natural gas utilization at the plant, since it is
produced through co-generation. Electricity imported from the grid accounts for 91% of
the total life-cycle energy for operating the Laguna WWTP for the year 2005. Energy
required for producing chemicals utilized for treatment and sludge hauling accounts for
mere 8% and 1% of the total Life-cycle energy respectively.
Figure 4-12. Total Life-cycle Energy for Operation of the Laguna WWTP (GJ/MG)
The life-cycle energy for operation of the plant for 2005 is 11 GJ per million gallons
wastewater treated, out of which, electricity required for operation accounts for 10
GJ/MG. Based on the total life-cycle energy figures, the total life-cycle-emissions from
operation of the plant were calculated.
4.8 Life-Cycle Emissions from Operation of Laguna WWTP
Since the energy consumption figures were complete for only 2005, the emissions
analysis was also conducted on the data from 2005. Emissions from electricity generation
and sludge hauling for operation of the Laguna WWTP were categorized into Global
Warming Potential, Eutrophication Potential and Acidification Potential.
Laguna WWTP - Total Life Cycle Energy (GJ/MG Wastewater Treated)
10
0.930.11
0
2
4
6
8
10
12
2005
GJ
/ MG
-Yr
Electricity Chemicals
Disposal

87
i. Global Warming Potential
The total global warming potential for the plant is 2,171 kg CO2 equivalent per million
gallons of wastewater treated over a hundred year time horizon.
Figure 4-13. Global Warming Potential for Laguna WWTP (kg CO2 eq. /MG)
Figure 4-13. Global Warming Potential for Laguna WWTP (kg CO2 eq. /MG)
Laguna WWTP - Total Global Warming Potential from Electricity, Natural Gas Combustion, Chemicals and Diesel Fuel (kg CO2
eq./MG)
2163
8 19 2.30
500
1000
1500
2000
2500
2005
kg C
O2
eq./M
G
Electricity
Diesel
Nat.gascombustionChemicals
Laguna WWTP - Total Global Warming Potential from CO2, CH4 and N2O Emissions (kg CO2 eq./MG)
2077
81 350
500
1000
1500
2000
2500
2005
kg C
O2
eq./M
G
Carbon Dioxide MethaneNitrous Oxide

88
Emissions from electricity imported from the grid account for 99% of the total global
warming potential. Since methane produced upon sludge treatment is utilized for heating
as well as electricity generation at the plant, the plant saves on emissions from production
of natural gas and 40% of the total electricity required for operation.
ii. Eutrophication Potential
The total atmospheric eutrophication potential for the plant is 204 g N equivalent per
million gallons of wastewater treated over a hundred year time horizon. Emissions from
electricity imported from the grid account for more than 96% of the total atmospheric
eutrophication potential. Diesel fuel consumed for sludge hauling to the disposal sites
accounts for 3% and very small quantities of emissions from natural gas combustion and
production of chemicals constitute the rest of the atmospheric eutrophication potential.
Figure 4-14 shows the g N eq. /MG atmospheric eutrophication potential from electricity,
chemicals, natural gas and diesel fuel consumption at the Laguna WWTP.
Figure 4-14. Atmospheric Eutrophication Potential from Electricity, Natural Gas Combustion, Chemicals and Diesel fuel Use at the Laguna WWTP (g N eq. /MG)
Laguna WWTP - Atmospheric Eutrophication Potential from Electricity, Natural Gas Combustion, Chemicals and Diesel Fuel (g N
eq./MG)
2.517 0.174
196
60
50
100
150
200
250
2005
g N
eq./M
G
Electricity
Diesel
Nat.gascombustionChemicals
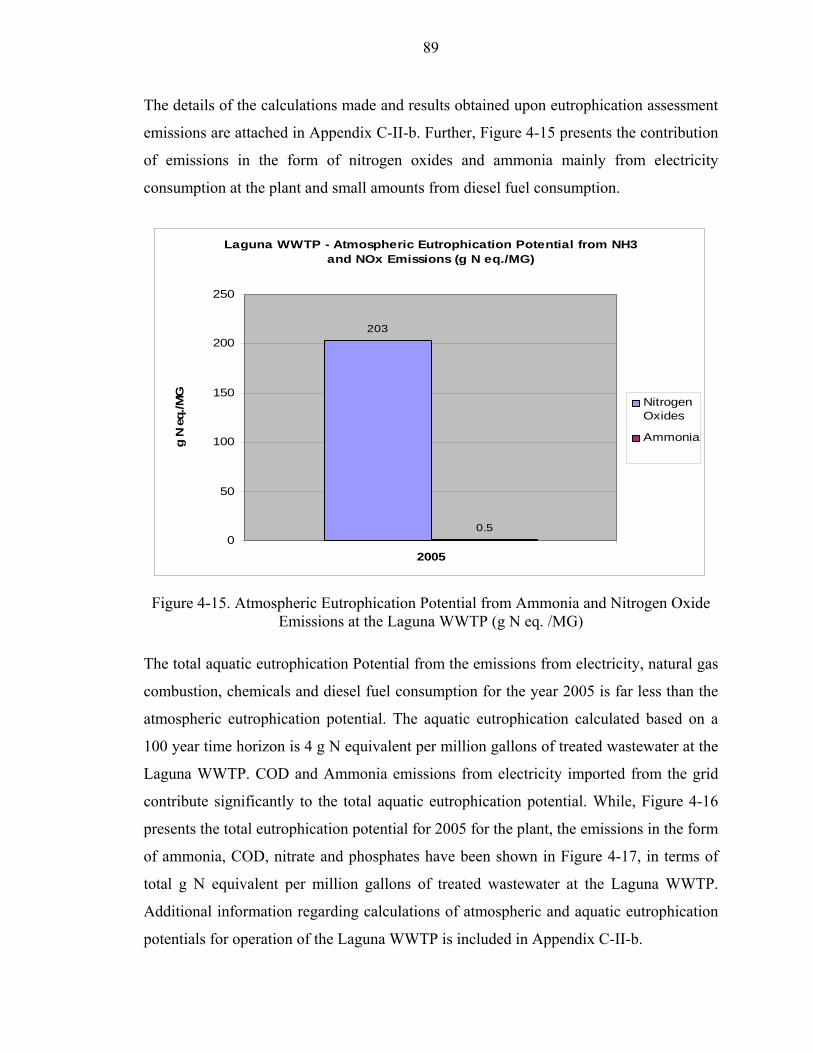
89
The details of the calculations made and results obtained upon eutrophication assessment
emissions are attached in Appendix C-II-b. Further, Figure 4-15 presents the contribution
of emissions in the form of nitrogen oxides and ammonia mainly from electricity
consumption at the plant and small amounts from diesel fuel consumption.
Figure 4-15. Atmospheric Eutrophication Potential from Ammonia and Nitrogen Oxide Emissions at the Laguna WWTP (g N eq. /MG)
The total aquatic eutrophication Potential from the emissions from electricity, natural gas
combustion, chemicals and diesel fuel consumption for the year 2005 is far less than the
atmospheric eutrophication potential. The aquatic eutrophication calculated based on a
100 year time horizon is 4 g N equivalent per million gallons of treated wastewater at the
Laguna WWTP. COD and Ammonia emissions from electricity imported from the grid
contribute significantly to the total aquatic eutrophication potential. While, Figure 4-16
presents the total eutrophication potential for 2005 for the plant, the emissions in the form
of ammonia, COD, nitrate and phosphates have been shown in Figure 4-17, in terms of
total g N equivalent per million gallons of treated wastewater at the Laguna WWTP.
Additional information regarding calculations of atmospheric and aquatic eutrophication
potentials for operation of the Laguna WWTP is included in Appendix C-II-b.
Laguna WWTP - Atmospheric Eutrophication Potential from NH3 and NOx Emissions (g N eq./MG)
203
0.50
50
100
150
200
250
2005
g N
eq./M
G
NitrogenOxides
Ammonia

90
Figure 4-16. Aquatic Eutrophication Potential for Laguna WWTP (g N eq. /MG)
Figure 4-17. Aquatic Eutrophication Potential from Emissions at the Laguna WWTP (g N eq. /MG)
Laguna WWTP - Aquatic Eutrophication Potential from Electricity, Natural Gas Combustion, Chemicals and Diesel Fuel (g N eq./MG)
0.20.002
4
0.0070
0.5
1
1.5
2
2.5
3
3.5
4
2005
g N
eq./M
G ElectricityDieselNat.gas combustionChemicals
Laguna WWTP- Aquatic Eutrophication Potential from Emissions (g N eq./MG)
1
3
0.05 0.0030
0.5
1
1.5
2
2.5
3
2005
g N
eq.
/MG
AmmoniaCODNitratesPhosphates

91
iii. Acidification Potential
The total acidification potential for operating the Laguna WWTP in the year 2005 is 646
kmoles of H+ equivalent per MG of wastewater treated at the plant. Emissions from
electricity contribute nearly 99% of the total acidification potential for a 100 year time
horizon. Figure 4-18 presents the Acidification Potential results obtained upon analysis of
emissions from electricity and diesel fuel in kmoles of H+ equivalent per MG.
Figure 4-18. Acidification Potential from Electricity, Natural Gas, Chemicals and Diesel Fuel for Laguna WWTP (kmoles of H+ eq. / MG)
The results are also presented in the form of sulfur dioxide, hydrochloric acid, nitrogen
oxides and ammonia emissions mainly from electricity consumption but there are very
small quantities from diesel fuel consumption as well. Figure 4-19 presents these results
in the form of kmoles of H+ equivalent per MG acidification potential from the operation
of the Laguna WWTP in the year 2005. High sulfur dioxide emissions due to
consumption of electricity from the grid are a major contributing factor to the total
acidification potential.
Laguna WWTP - Acidification Potential from Electricity, Natural gas Combustion, Chemicals and Diesel Fuel (kmoles H+ eq./MG)
621
6 0.05 2.080
100
200
300
400
500
600
700
2005
kmol
es H
+ eq
./MG Electricity
Diesel
Nat.gascombustionChemicals

92
Figure 4-19. Acidification Potential from NH3, NOx, HCl and SO2 Emissions at Laguna WWTP (kmoles of H+ eq. / MG)
Further details of the data, calculations and results pertinent to the total acidification
potential from the plant can be found in Appendix C-II-c of this report. Although the total
life-cycle energy and emissions for Laguna WWTP are calculated based on data from a
single year, the results obtained are fairy indicative of the contribution of various energy
sources used for operating the plant to the total environmental burden from the plant. The
results from this chapter will be discussed further in Chapter 5 which compares the
performance and environmental burdens from three wastewater treatment plants in the
US.
Laguna WWTP - Acidification Potential from NH3, NOx, HCl and SO2 Emissions (kmoles H+ eq./MG)
393
34
201
00
50
100
150
200
250
300
350
400
450
2005
kmol
es H
+ eq
./MG Sulfur Dioxide
HydrochloricAcidNitrogenOxidesAmmonia

93
Chapter 5
Comparative Assessment for Ann Arbor, YCUA and Laguna Wastewater
Treatment Plants
5.1 Background
The detailed background information and analyses for Ann Arbor Wastewater Treatment
Plant and Laguna Wastewater Treatment Plant have already been explained in this report
(Chapter 3 and Chapter 4). Another important case-study in Michigan conducted by the
Center for Sustainable Systems for the study ‘Preliminary Application of Life-cycle
Assessment to US Water and Wastewater Treatment Facilities’ (Deslauriers et al)25 is the
Ypsilanti Community Utilities Authority (YCUA) WWTP. Although the information
about this plant is included in the report by Deslauriers et al, the data was updated and
new results were generated to enable a comparison with the Ann Arbor and Laguna
WWTPs. The background information for this plant is attached in Appendix D-I. The
reason for including this case-study in this research is that YCUA WWTP is also a
tertiary treatment plant with a plant capacity similar to the other two case-studies
discussed in this report. Since there are certain dissimilarities in operation of each of
these plants, it is interesting to discuss how these dissimilarities impact the total energy
and environmental performance of a plant compared to the other two.
5.2 Total Flow The average total flow recorded for the four year period from 2001 to 2004 at the Ann
Arbor WWTP is 569 MG per month. During the same period Laguna WWTP received
618 MG per month on an average. The plant influent received at YCUA WWTP is the
highest- 666 MG per month. Total influent for Ann Arbor and YCUA is generally low for
the winter months and fluctuates a little during the year, but the difference in the influent
treated during summer months and winter months is not exceptionally high. On the other
hand, for Laguna WWTP the total influent is significantly high every year from
December to March, i.e., the winter months. The increase in plant flow during

94
the winter months reflects winter storms, which cause the groundwater to rise, which then
makes its way into the sewer system through cracks.
Figure 5-1. Total Plant Influent for Ann Arbor, Laguna and YCUA Wastewater Treatment Plants (MG/month)
The total plant influent treated at the plant is crucial for all further comparisons made in
this report for energy consumption and emissions, since the functional unit for
comparison is ‘per million gallons wastewater treated’.
5.2 Electricity Utilization
The electricity consumption for YCUA WWTP is the highest of the three plants studied.
The average electricity consumption per month is for YCUA for four years from 2001 to
2004 was 1,974,250 kWh per month. The average electricity consumption for the Laguna
WWTP, only slightly less for the same period, equaled 1,691,044 kWh per month. It is to
be noted that the actual electricity requirement for Laguna WWTP is much more, since
nearly 40% of the electricity required for its operation comes from co-generators working
on methane generated upon treatment of sewage at the plant. The Ann Arbor WWTP
Wastewater Treatment Plants - Plant Influent (MG/month)
0
200
400
600
800
1000
1200Ja
n-01
Apr
-01
Jul-0
1
Oct
-01
Jan-
02
Apr
-02
Jul-0
2
Oct
-02
Jan-
03
Apr
-03
Jul-0
3
Oct
-03
Jan-
04
Apr
-04
Jul-0
4
Oct
-04
MG
per
mon
th
Ann ArborYCUASanta Rosa

95
utilizes much less electrical energy; the average electricity consumption for the plant is
only 1,227,556 kWh per month.
Figure 5-2. Electricity Utilization for Operation of Ann Arbor, YCUA and Laguna WWTP (kWh/month)
Figure 5-3. Electricity Utilization for Operation of Ann Arbor, YCUA and Laguna WWTP (GJ/MG)
Wastewater Treatment Plants - Electricity Utilization (kWh/month)
-
500,000
1,000,000
1,500,000
2,000,000
2,500,000
3,000,000
Jan-
01
May
-01
Sep-
01
Jan-
02
May
-02
Sep-
02
Jan-
03
May
-03
Sep-
03
Jan-
04
May
-04
Sep-
04
kWh
per m
onth Ann Arbor
YCUASanta Rosa
Wastewater Treatment Plants- Electricity Utilization (GJ/MG)
0
2
4
6
8
10
12
14
16
Jan-
01
Apr-
01
Jul-0
1
Oct
-01
Jan-
02
Apr-
02
Jul-0
2
Oct
-02
Jan-
03
Apr-
03
Jul-0
3
Oct
-03
Jan-
04
Apr-
04
Jul-0
4
Oct
-04
GJ/
MG
Ann ArborYCUASanta Rosa

96
Figure 5-2, shows the electricity consumption for each plant in terms of kWh utilized per
month for four years. Since the life-cycle energy consumption is expressed in terms of
Giga Joules per month in this report and the functional unit is per million gallons of
wastewater treated at the plant, the electricity consumption for each facility is converted
to GJ/MG. These results are presented in Figure 5-3 above. Although the total monthly
electricity consumption is higher for YCUA WWTP when compared with the Ann Arbor
WWTP, YCUA WWTP is actually more efficient in terms of electricity consumption
since the total quantity of influent treated at the plant is more than that at the Ann Arbor
WWTP. At Laguna WWTP, the total electricity imported from the grid also supports
pumping stations for recycling and geysers recharge systems, hence the electricity
utilized at the plant is highest of the three WWTPs. However, Laguna WWTP utilizes
methane produced at the plant for generating 40% of the electricity required for plant
operation, reducing the burden from the grid considerably.
5.3 Natural Gas Utilization
Natural gas use is also the highest for YCUA WWTP since the plant uses incinerator for
sludge disposal which requires much more natural gas than the amount required for
heating at Ann Arbor WWTP and Laguna WWTP. The average monthly consumption of
natural gas for YCUA WWTP for 2001 to 2004 is 56,087 CCF per month. On an average
Ann Arbor WWTP consumes 17,451 CCF per month and the average consumption for
Laguna is 2,086 CCF per month for the same period. Since the natural gas consumption
reported in this section is solely for the purpose of heating for Ann Arbor and Laguna
WWTPs as opposed to natural gas consumption for incineration at YCUA, there is an
obvious difference between the quantities consumed. Further, the quantity required for
heating at Laguna WWTP is much less than that required at Ann Arbor WWTP due to a
significant difference in the weather in Ann Arbor, Michigan and Santa Rosa California.

97
Figure 5-4. Natural Gas Utilization at Ann Arbor, YCUA and Laguna WWTP (CCF/month)
Figure 5-5. Natural Gas Utilization at Ann Arbor, YCUA and Laguna WWTP (GJ/MG)
Wastewater Treatment Plants - Natural Gas Utilization (CCF/month)
-
10,000
20,000
30,000
40,000
50,000
60,000
70,000
80,000
90,000
100,000
110,000
Jul-0
2
Nov
-02
Mar
-03
Jul-0
3
Nov
-03
Mar
-04
Jul-0
4
Nov
-04
CC
F pe
r mon
th
Ann ArborYCUASanta Rosa
Wastewater Treatment Plants - Natural Gas Utilization (GJ/MG)
0.000
0.002
0.004
0.006
0.008
0.0100.012
0.014
0.016
0.018
0.020
0.022
Jul-0
2
Nov
-02
Mar
-03
Jul-0
3
Nov
-03
Mar
-04
Jul-0
4
Nov
-04
GJ/
MG Ann Arbor
YCUASanta Rosa

98
Interestingly, even though the natural gas requirement for heating at the plant is low for
Laguna WWTP, the required quantity is produced at its co-generation facility using the
gas produced after activated sludge treatment. This becomes a major factor responsible
for lower environmental emissions from operation of the Laguna WWTP, discussed later
in this chapter. Figure 5-4 shows the consumption of natural gas at the three WWTPs
from July 2002 to December 2004.
The old incinerator at the YCUA WWTP was replaced in 2004; as a result, the sludge
had to be disposed completely at the landfill. This reduces the natural gas consumption
for the remaining part of the year drastically. Since the details of the presently used
incinerator are not included in this report, it cannot be stated whether the natural gas and
electricity requirement of the plant is reduced since then. The natural gas use for each
plant was converted to GJ per million gallons wastewater (Figure 5-5) treated at the plant
to contribute to total life-cycle energy consumption for operating each facility, discussed
later in this chapter.
5.4 Energy Required for Production of Chemicals Utilized
Different chemicals are utilized at the Ann Arbor, YCUA and Laguna WWTPs for
treatment of wastewater at different stages. The Ann Arbor WWTP uses only ferric
chloride and lime for treatment. YCUA WWTP utilized chlorine, ferric chloride, ferrous
chloride, lime, and a polymer for treatment during 2001 to 2004. The Laguna WWTP
uses only ferric chloride, alum and hypochlorite.
Since the number of chemicals used and respective quantities are high for YCUA WWTP
(Appendix D), the energy associated with production of chemicals utilized per month for
treatment is also the highest for YCUA WWTP. The average energy consumption
associated with chemicals utilized at YCUA WWTP is 1,236 GJ per month; 790 GJ per
month for Ann Arbor WWTP; and 917 GJ per month for Laguna WWTP

99
Figure 5-6. Energy Required for Production of Chemicals Utilized at Ann Arbor, YCUA and Laguna WWTPs (GJ/month)
Figure 5-7. Energy Required for Production of Chemicals Utilized at Ann Arbor, YCUA and Laguna WWTPs (GJ/MG)
Wastewater Treatment Plants - Energy Required for Production of Chemicals Utilized for Treatment (GJ/month)
0
500
1000
1500
2000
2500
3000
3500
4000
4500
5000
Jan-
01
May
-01
Sep-
01
Jan-
02
May
-02
Sep-
02
Jan-
03
May
-03
Sep-
03
Jan-
04
May
-04
Sep-
04
GJ
per m
onth
Ann ArborYCUASanta Rosa
Wastewater Treatment Plant - Energy Required for Production of Chemicals Utilized for Treatment (GJ/MG)
0
1
2
3
4
5
6
7
Jan-
01
May
-01
Sep-
01
Jan-
02
May
-02
Sep-
02
Jan-
03
May
-03
Sep-
03
Jan-
04
May
-04
Sep-
04
GJ
/ MG
Ann ArborYCUASanta Rosa

100
The average energy required for production of chemicals utilized for treatment at YCUA
WWTP is over 2 GJ/MG. The energy consumption for production of chemicals used for
treatment at the Ann Arbor WWTP and Laguna WWTP is a little over 1 GJ/MG. These
figures are incorporated in the calculations for total life-cycle energy for operation of the
three treatment plants.
5.4 Energy Required for Sludge Disposal
The YCUA WWTP employed incineration and landfill for disposing sludge produced
after treatment. The Ann Arbor WWTP does not use incinerator and disposes all the
sludge at land-application sites or landfills. The Laguna WWTP on the other hand
employs composting in addition to disposal at landfill and land-application sites.
However, the quantity of sludge produced and the method of disposal for Laguna WWTP
was unavailable for 2001 to 2004, hence this section compares the pros and cons of the
methods of disposal adopted at Ann Arbor and YCUA WWTPs for the years 2001 to
2004 and there a discussion on the energy consumption for sludge disposal at Laguna
WWTP and Ann Arbor WWTP during the year 2005.
Table 5-1 Sludge Disposal for YCUA WWTP for 2001 to 2004
Year Total
Sludge Incineration Landfill Total Energy
Wet Sludge Ash Natural
Gas Sludge Sludge and Ash Diesel
fuel
Natural gas,
Diesel fuel
Metric tons
Metric tons
Metric tons GJ
Metric tons
Metric tons
metric ton-miles GJ GJ
2001 30,377 25,036 5,829
84,779 5,341
11,169 207,957
919 85,698
2002 27,459 20,081 8,037
89,982 6,840
14,876 284,363
1,256 91,238
2003 33,063 24,684 6,020
82,723 8,380
14,399 374,451
1,685 84,409
2004 31,555 6,559 3,616
10,232 24,996
28,612 575,323
2,542 12,774
For YCUA WWTP, more than 75% of the average total sludge was incinerated at the
plant from January 2001 to March 2004. Incineration was stopped in April 2004 and all
the sludge produced was disposed at the landfill during April 2004 to December 2004.
The landfill used for disposal is located at a one-way distance of 18 miles from the plant.
A summary of the findings on sludge disposal at YCUA is presented in Table 5-1.

101
As shown above the natural gas consumption from 2001 to 2003 was very high since
most of the sludge was incinerated. When the quantity of sludge disposed at the landfill
and the quantity of sludge incinerated are reversed in 2004, the total energy consumed in
terms of GJ reduces significantly (almost 85% reduction from an average of 84,409 GJ in
2003 to 12,774 GJ in 2004). Since the energy content of natural gas is significantly high,
the use of natural gas for incineration is more energy expensive than sludge disposal at
the landfill for YCUA. A detailed comparison of the energy consumption for sludge
disposal at the landfill vs. incineration is located in (Appendix D-I).
Figure 5-8. Total Volume of Sludge Generated in at the Ann Arbor and YCUA WWTPs (kGal/month)
Compared to the Ann Arbor WWTP, the quantity of sludge produced per month at the
YCUA WWTP shows a sudden increase in January 2003. The quantity of sludge
produced at the YCUA WWTP is an average of 1,166 kilo gallons (kGal) per month from
January 2001 to December 2002. However from January 2003 to December 2004 the
quantity of sludge is four times higher- an average of 4,603 kilo gal (Figure 5-8). Since
the quantity of influent received during this period does not show an increase, the reason
for this sudden increase sludge production is not known.
Wastewater Treatment Plant - Total Volume of Sludge Generated (kGal/Month)
0
1000
2000
3000
4000
5000
6000
7000
8000
Jan-
01
Apr
-01
Jul-0
1
Oct
-01
Jan-
02
Apr
-02
Jul-0
2
Oct
-02
Jan-
03
Apr
-03
Jul-0
3
Oct
-03
Jan-
04
Apr
-04
Jul-0
4
Oct
-04
kGal
/mon
th Ann ArborYCUA

102
Consequently, the energy consumed for sludge disposal for the YCUA WWTP is
significantly higher for January 2003. Surprisingly, the natural gas consumption does not
remain as high after January 2003 (Figure 5-9). However, the energy consumption for
disposal of sludge is significantly higher till March 2004 and becomes lower than the
energy consumption for disposal at the Ann Arbor WWTP from April 2004 onwards. The
reason for this reduction is the reduction in natural gas consumption after April 2004 due
to stoppage of incineration until December 2004.
Figure 5-9. Energy Required for Sludge Disposal for Ann Arbor and YCUA WWTP (GJ/month)
The adoption of incineration for sludge disposal is certainly more energy expensive than
opting for disposal at landfills or land-application sites. Even when the one-way distance
to the landfill used by the Ann Arbor WWTP for disposal of the sludge produced from it
is 80 miles, the energy consumption is not anywhere near to the energy consumed in the
form of natural gas for incineration at the YCUA WWTP. Hence, the total life-cycle
energy for YCUA WWTP is impacted significantly due to the use of the sludge
incinerator.
Wastewater Treatment Plants - Energy Required for Sludge Disposal (GJ per Month)
0
2000
4000
6000
8000
10000
12000
14000
16000
Jan-
01
May
-01
Sep-
01
Jan-
02
May
-02
Sep-
02
Jan-
03
May
-03
Sep-
03
Jan-
04
May
-04
Sep-
04
GJ
per m
onth
Ann ArborYCUA

103
Figure 5-10. Energy Required for Sludge Disposal for Ann Arbor and YCUA WWTP (GJ/MG)
Like Ann Arbor WWTP, the Laguna WWTP does not use incineration for sludge
disposal. The total energy consumed for disposal of sludge from Laguna WWTP in the
year 2005 is 869 GJ per month, or 1 GJ per MG wastewater treated at the plant. The
reason for this low energy consumption for disposal is the fact that nearly 25% of the
total sludge from Laguna WWTP was composted very near to the plant.
Further, the distance from the Laguna WWTP to the landfill and land-application sites is
much less when compared with the distance of Ann Arbor WWTP from its sludge
disposal sites. On the other hand the energy consumed for sludge disposal from Ann
Arbor WWTP is 3 GJ per MG wastewater treated at the plant. Evidently the low energy
consumption for disposal for Laguna WWTP impacts the total life-cycle energy
consumed for operation of the plant.
Wastewater Treatment Plant- Energy Required for Sludge Disposal (GJ/MG)
0
5
10
15
20
25
Jan-
01
Apr
-01
Jul-0
1
Oct
-01
Jan-
02
Apr
-02
Jul-0
2
Oct
-02
Jan-
03
Apr
-03
Jul-0
3
Oct
-03
Jan-
04
Apr
-04
Jul-0
4
Oct
-04
GJ
/ MG
Ann ArborYCUA

104
5.5 Total Life-cycle Energy for Operation of the WWTPs
The total life-cycle energy is calculated by inventorying electricity consumption, natural
gas consumption, chemicals utilized and diesel fuel consumption at each wastewater
treatment plant. The detailed discussion on the total life-cycle energy for operation of
Ann Arbor and Laguna WWTP are presented in Chapters 3 & 4 and complete results for
YCUA WWTP are included in Appendix D. The total life-cycle energy for operation of
YCUA WWTP is 22 GJ/MG for the year 2003 compared to the total life-cycle energy of
16 GJ/MG for operation of Ann Arbor WWTP.
However in the year 2004, the total life-cycle energy for operation of Ann Arbor WWTP
is higher than that of YCUA WWTP because of a significant decrease in the consumption
of natural gas at the YCUA WWTP in that year. Figure 5-11 and 5-12 present the total
life-cycle energy consumption for Ann Arbor and YCUA WWTP for the years 2003 and
2004 respectively.
Figure 5-11. Life-cycle Energy for Ann Arbor and YCUA WWTPs in 2003 (GJ/MG)
Wastewater Treatment Plants- Total Life-cycle Energy for the Year 2003 (GJ/MG)
811
6
91
8
0
5
10
15
20
25
30
Ann Arbor YCUA
GJ/
MG Chemicals
Natural Gas& DieselElectricity

105
Figure 5-11. Life-cycle Energy for Ann Arbor and YCUA WWTPs in 2004 (GJ/MG)
The reduction in consumption of natural gas in the year 2004 leads to a drastic reduction
in the total life-cycle energy for operation of YCUA WWTP, since natural gas and diesel
fuel consumption together constitute a large percentage of the total-life-cycle energy for
the plant in 2003. The same is applicable to Ann Arbor WWTP, but the natural gas
consumed for heating purposes at the plant and the pumping stations is not very high;
instead diesel fuel consumption for sludge disposal contributes more to the life-cycle
energy for Ann Arbor WWTP. As a result YCUA WWTP appears to be more energy
efficient in 2004. However, since a new incinerator came in use in 2005 at YCUA
WWTP it cannot be stated if the plant consumes more energy or less than the Ann Arbor
WWTP presently.
Further, a comparison on life-cycle energy for operation of the Laguna WWTP and the
Ann Arbor WWTP could not be made since the complete information was not available
for the Laguna WWTP except for the year 2005. However, in the year 2005 the total
energy consumption for the Laguna WWTP was 11 GJ/MG which is less than the life-
cycle energy required for operation of Ann Arbor WWTP in the year 2004. Since there
has not been a drastic change in the monthly consumption of electricity, natural gas,
Wastewater Treatment Plants- Total Life-cycle Energy for the Year 2004 (GJ/MG)
8 9
72
1
4
0
5
10
15
20
25
30
Ann Arbor YCUA
GJ/
MG Chemicals
Natural Gas& DieselElectricity

106
chemicals usage or diesel fuel consumption for disposal for the Ann Arbor WWTP it
would be fair to state that based on the available information for the year 2005 for both
plants Laguna WWTP appears to be more energy efficient than the Ann Arbor WWTP.
5.6 Conclusions and Recommendations
The comparative assessment of the Ann Arbor, YCUA and Laguna WWTPs provides an
understanding that the difference in methods adopted during each stage of plant operation
variegates the total-life-cycle energy and emissions of similar treatment plants. For
instance, natural gas consumption for incineration at the YCUA WWTP increases the
total energy burden on the plant significantly. Similarly, the use of a landfill at a farther
distance for sludge disposal for the Ann Arbor WWTP increases the total life-cycle
energy for the plant. Based on the life-cycle energy and emissions assessment conducted
for each case-study, the average life-cycle energy and environmental impacts from each
facility was obtained. A summary of the life-cycle energy consumption at the Ann Arbor,
YCUA and Laguna WWTPs and the environmental impacts from operation of these
plants is presented in Table 5-2.
Table 5-2 Life-cycle Energy and Impacts from Operation of Ann Arbor, YCUA and Laguna WWTPs
Total Life-cycle
Energy
Global Warming Potential
Atmospheric Eutrophication
Potential
Aquatic Eutrophication
Potential Acidification
Potential Wastewater Treatment Plant
GJ/MG kg CO2 eq./MG g N eq./MG g N eq./MG kmoles H+
eq./MG Ann Arbor WWTP 16 1,984 291 3 673Laguna WWTP 11 2,192 204 4 629YCUA WWTP 21 2,747 222 4 1094
Note: These are average values obtained from analysis of each case-study
The highest life-cycle energy of the three case-studies is for YCUA WWTP. Incineration
of sludge at YCUA WWTP requires considerably large amount of natural gas per month,
as a result life-cycle energy for operation of the plant is significantly higher than the other
plants. Although the old incinerator at YCUA WWTP was replaced in 2005, the detailed
information on energy consumption and emissions from the new incinerator is not
included in this research study. On an average 120,000 kgs of methane gas emissions or

107
23,298,000† CCF per month of methane is produced from sludge treatment at the plant.
Interestingly, the natural gas requirement at the plant with the old incinerator was much
smaller- 56,086 CCF per month. Similarly, the natural gas requirement for the Ann Arbor
WWTP is much lower than the quantity of methane generated as a result of sludge
treatment at the plant (Table 5-3).
Table 5-3 Methane Emissions from Sludge Treatment Compared to Monthly Natural Gas Requirement for operation of the WWTPs
Natural Gas Requirement per month (Average)
Methane Production from Sludge Treatment per month (Average) Wastewater
Treatment Plant CCF CCF Ann Arbor WWTP 17,706 24,439,602YCUA WWTP 58,438 23,298,000
Hence, the methane produced at YCUA and Ann Arbor WWTP can be utilized for
meeting the respective natural gas requirements at the plant completely. Further, like
Laguna WWTP, the excess methane can be utilized to produce electricity by adopting a
co-generation system at YCUA and Ann Arbor WWTPs. Additionally, the life-cycle
energy can be reduced further by energy conservation during sludge hauling. As
mentioned earlier, the diesel fuel consumption for sludge hauling accounts for 13% of the
total life-cycle energy for operation of the plant. The diesel fuel consumption can be
reduced by opting for a landfill located nearer to the plant for disposal of sludge.
This study has provided the basic framework for a life-cycle energy and impact
assessment for wastewater treatment plants. Detailed analysis using meters for gauging
the electricity consumption at each stage of the treatment process at the wastewater
treatment plants would prove to be extremely beneficial for. Also, studies analyzing the
energy consumption from construction and maintenance of the physical structure of these
plants would provide accurate information on the total life-cycle energy of these plants.
Further, incorporation of economic modeling for each facility would provide insightful
information for adoption of strategies that are environmentally sustainable as well as
economical.
† Density of gaseous methane is 1.819 g/m3 thus 1kg of methane is equal to 19,415 CCF

108
Lastly, life-cycle assessments can be carried forth for the municipal water treatment and
supply systems complimenting each case-study, providing the total environmental impact
of ‘water and wastewater treatment’ system. A similar effort has been made in the next
chapter of this report presenting the energy analysis and impacts for the Ann Arbor
‘water and wastewater treatment’ system with an aim to facilitate further studies and
development of sustainable energy practices at these plants based on the findings in this
study.

109
Chapter 6
Ann Arbor Water and Wastewater System
6.1 Background
The detailed background information and analyses for Ann Arbor Water Treatment Plant
and Ann Arbor Wastewater Treatment Plant are provided in Chapter 2 and Chapter 3 of
this report respectively. Since the water and wastewater system for any city is crucial in
terms of the environmental benefits† and burdens‡ associated with the operation of
treatment plants this chapter discusses the performance of the water treatment plant and
the wastewater treatment plant combined as one system.
6.2 Total Flow
The quantity of the influent received at the Ann Arbor WWTP per month is generally
higher than the total quantity of water delivered to the customers by the Ann Arbor WTP
for all six years under consideration from 2000 to 2005. An exception to this monthly
flow is when the quantity of water delivered is very high i.e., during the summer months
every year. The average quantity of water supplied from the Ann Arbor WTP for the six
year period is 439 MG per month and the average quantity of influent received at the Ann
Arbor WWTP is 582 MG per month. Thus, more than 140 MG of the total influent is a
result of infiltration and inflow of storm water into the system.
Figure 6-1 shows the monthly flow for the Ann Arbor water and wastewater system in
MG per month. The difference in quantity of influent received at the Ann Arbor WWTP
and the quantity delivered from the Ann Arbor WTP is illustrated in Figure 6-2.
† Public health benefits due to treatment of water supplied to the city and environmental benefits in the form of pollution mitigation of surface water sources due to treatment of wastewater before discharging ‡ Environmental burdens due to consumption of natural resources for operation of these plants and emissions from various stages of operation
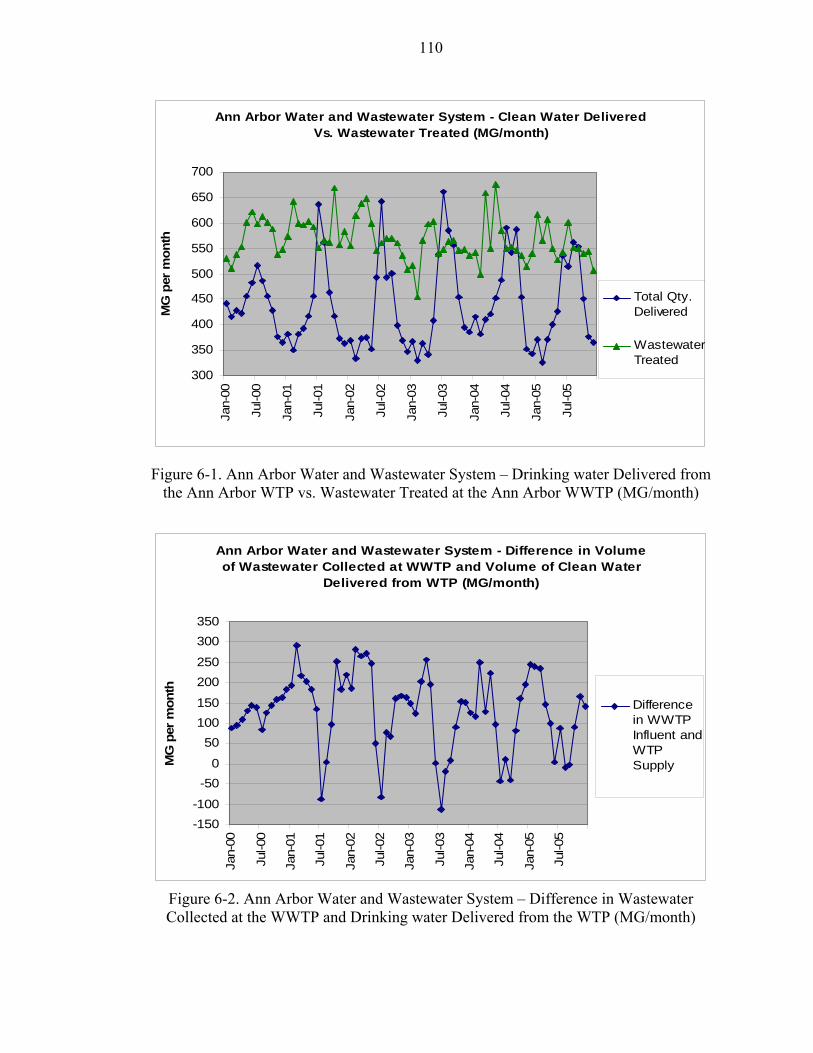
110
Figure 6-1. Ann Arbor Water and Wastewater System – Drinking water Delivered from the Ann Arbor WTP vs. Wastewater Treated at the Ann Arbor WWTP (MG/month)
Figure 6-2. Ann Arbor Water and Wastewater System – Difference in Wastewater Collected at the WWTP and Drinking water Delivered from the WTP (MG/month)
Ann Arbor Water and Wastewater System - Clean Water Delivered Vs. Wastewater Treated (MG/month)
300
350
400
450
500
550
600
650
700
Jan-
00
Jul-0
0
Jan-
01
Jul-0
1
Jan-
02
Jul-0
2
Jan-
03
Jul-0
3
Jan-
04
Jul-0
4
Jan-
05
Jul-0
5
MG
per
mon
th
Total Qty.Delivered
WastewaterTreated
Ann Arbor Water and Wastewater System - Difference in Volume of Wastewater Collected at WWTP and Volume of Clean Water
Delivered from WTP (MG/month)
-150-100
-500
50100150
200250
300350
Jan-
00
Jul-0
0
Jan-
01
Jul-0
1
Jan-
02
Jul-0
2
Jan-
03
Jul-0
3
Jan-
04
Jul-0
4
Jan-
05
Jul-0
5
MG
per
mon
th
Differencein WWTPInfluent andWTPSupply

111
Another interesting aspect of the Ann Arbor Water and Wastewater system is its impact
on the Huron River. The Ann Arbor WTP collects 80% of the raw water required for
meeting the demand from the Huron River and the Ann Arbor WWTP discharges the
treated effluent into Huron River.
Figure 6-3. Ann Arbor Water and Wastewater System – Raw Water Obtained from Huron by the WTP Vs. Treated Wastewater Discharged from the WWTP (MG/month)
The monthly quantity of treated effluent discharged to the Huron River is generally
higher than the quantity of water withdrawn from the river. One reason for this difference
is that the Ann Arbor WTP adds around 20% groundwater from the wells to the river
water before treatment and supply to the city. The second reason is the infiltration of
storm water in the system and consequently a larger quantity of influent received at the
WWTP for treatment. Since the quantity of water delivered to the customers in the city of
Ann Arbor is high during the summer months and a significant part of this supply is
consumed for irrigation and gardening in the summer months, the effluent discharged
from the Ann Arbor WWTP is lower the quantity of water withdrawn from the river in
the summer months (generally in the month of July). The difference in the quantity of
Ann Arbor Water and Wastewater System- Raw Water Obtained from Huron by WTP and Treated Wastewater Discharged to Huron
by WWTP (MG/month)
200
300
400
500
600
700
800
Jan-
00
Jul-0
0
Jan-
01
Jul-0
1
Jan-
02
Jul-0
2
Jan-
03
Jul-0
3
Jan-
04
Jul-0
4
Jan-
05
Jul-0
5
MG
per
mon
th
QuantityAcquired
QuantityDis-charged

112
water acquired from the Huron and the quantity of treated effluent discharged in Huron
from the WWTP is shown in Figure 6-4.
Figure 6-4. Ann Arbor Water and Wastewater System – Difference in Treated Effluent Discharged from WWTP and Raw Water Obtained at WTP from Huron (MG/month)
Although the quantity of treated effluent discharged to the river is lower in summer
months, the total quantity of water discharged in Huron per year is always higher than the
total quantity of water withdrawn from the river. Table 6-1, shows the quantity of water
withdrawn from Huron and the quantity discharged to Huron per year
Table 6-1 Ann Arbor Water and Wastewater System – Quantity of Water Collected from Huron at WTP and Quantity of Water Discharged to Huron from WWTP
Year Water Withdrawn at WTP Total Effluent Discharged
Total From Huron from WWTP to Huron MG/Yr MG/Yr MG/Yr
2001 6277 5195 7334 2002 6334 5180 7114 2003 5958 4701 6767 2004 5800 4636 6873 2005 5975 4851 6857
Ann Arbor Water and Wastewater System - Difference in Volume of Treated Wastewater Discharged from WWTP and Raw Water
Obtainedby WTP from Huron (MG/month)
-200
-100
0
100
200
300
400
Jan-
00
Jul-0
0
Jan-
01
Jul-0
1
Jan-
02
Jul-0
2
Jan-
03
Jul-0
3
Jan-
04
Jul-0
4
Jan-
05
MG
per
mon
th Diff. inWaterDischargedby WWTPand WaterCollectedby WTPfrom Huron

113
Interestingly, the quantity of treated wastewater discharged from the Ann Arbor WWTP
to the Huron River is also higher than the total quantity of water collected at the Ann
Arbor WTP from the wells and the river combined. Thus, a significant amount of storm
water gets collected and treated at the wastewater treatment plant and consequently
discharged to the river in addition to the groundwater and surface water supplied to the
city. Further, the quality of treated effluent discharged to the river meets the wastewater
effluent standards and discharge permits.
6.3 Water Quality
The treated effluent discharged from the Ann Arbor WWTP meets Michigan Water
Quality Standards (MWQS) as well as the National Pollutant Discharge Elimination
System (NPDES). The water quality parameters reported in the monthly reports obtained
from the Ann Arbor WWTP included- biological oxygen demand (BOD5), carbonaceous
biological oxygen demand (CBOD5), total suspended solids (TSS), total phosphorus,
ammonia nitrate (NH3-N), nitrate nitrogen (NO3-N), nitrite nitrogen (NO2-N), alkalinity,
fecal coliform and dissolved oxygen (DO). The water quality information is attached in
Appendix E. The final effluent discharged to the Huron is well under the water quality
limits specified in the NPDES permits†. The quality of effluent discharged to the river is
further compared with the quality of water withdrawn from the Huron River by the Ann
Arbor WTP.
Table 6-2 shows the quality of water collected at the Ann Arbor WTP from Huron and
the quality of water discharged from the Ann Arbor WWTP to the Huron River. Since
BOD5‡
is not tested for the water withdrawn from Huron at the Ann Arbor WTP, instead
the total organic carbon (TOC)ψ is tested; it is not possible to compare this key water
quality parameter. However, the monthly reports from the Ann Arbor WWTP show a
more than 99% BOD5 removal upon treatment.
† Tallied with Permit Number MIG570000 ‡ Biochemical Oxygen Demand is supposed to measure the amount of food (or organic carbons) that bacteria can oxidize. ψ The Total Organic Carbon test measures all organic carbon as CO2

114
Table 6-2 Quality of Water Withdrawn from Huron at WTP and Water Discharged to Huron from WWTP
Jan Feb Mar Apr May Jun Jul Aug Sep Oct Nov Dec WTP 8.20 8.10 8.20 8.20 8.10 8.00 8.00 8.00 8.00 8.20 8.30 8.20 pH (SU) WWTP 6.83 6.83 6.80 6.79 6.93 6.93 6.82 6.75 6.72 6.87 6.90 6.92
TOC (mg/l) WTP 3.30 4.00 5.00 5.70 6.80 7.40 7.50 7.50 6.60 6.50 6.10 5.80 BOD5 (mg/l) WWTP 2.27 1.79 1.84 1.32 1.26 2.07 1.72 1.24 1.33 2.35 2.00 1.60
WTP 478 456 484 434 475 349 470 405 397 410 454 443 SS (mg/l) WWTP 1.76 1.96 2.31 1.92 2.00 1.74 1.87 1.80 2.15 1.95 1.70 1.82 WTP 0.02 0.03 0.02 0.02 0.21 0.02 0.03 0.03 0.03 0.02 0.01 0.02 P (mg/l) WWTP 0.13 0.11 0.13 0.11 0.24 0.28 0.39 0.30 0.31 0.32 0.30 0.24 WTP 0.02 0.32 0.05 0.02 0.02 0.02 0.02 0.02 0.02 0.02 0.02 0.08 NH3-N
(mg/l) WWTP 0.08 0.06 0.08 0.06 0.05 0.09 0.07 0.14 0.13 0.11 0.00 0.22 WTP 0.54 0.51 0.68 0.41 0.87 0.79 0.28 0.34 0.34 0.24 0.29 0.38 NO3-N
(mg/l) WWTP 14 11 14 14 12 12 13 13 16 14 15 13 WTP 220 225 214 207 203 200 199 203 212 216 220 231 Alkalinity
(mg/l) WWTP 105 148 119 147 135 123 105 83 85 136 121 135 WTP 785 615 40 108 484 638 1058 1479 1023 319 228 1044 Fecal
Coliform (/100ml) WWTP 20 15 32 17 27 63 51 30 32 32 5 33
Out of all other parameters shown in the Table above, Suspended Solids, Alkalinity and
Fecal Coliform for the final effluent discharged from the WWTP are lower than the water
collected at the WTP. Also, even though the quantities of total phosphorus, Ammonia-
nitrogen and nitrate nitrogen is higher in the effluent discharged, they meets the NPDES
permit limits and there is a 99% removal of all the three pollutants upon treatment of
wastewater at the Ann Arbor WWTP. Thus, the treatment of wastewater prevents
pollution in the Huron significantly.
6.4 Electricity Utilization
The average electricity consumption for the Ann Arbor WTP for the period of six years
from 2000 to 2005 was found to be close to 1,039,895 kWh per month. The average
electricity consumption for the Ann Arbor WWTP was higher for the same period and
found to be 1,103,685 kWh per month. Figure 6-5, shows the electricity consumption for
the Ann Arbor WTP and WWTP in terms of kWh per month. Figure 6-6, presents the
electricity consumption for the Ann Arbor WTP per MG of drinking water delivered and
electricity consumption for Ann Arbor WWTP per MG wastewater treated.

115
Figure 6-5. Ann Arbor Water and Wastewater System – Electricity Utilization (kWh/month)
Figure 6-6. Ann Arbor Water and Wastewater System – Electricity Utilization (GJ/MG)
Ann Arbor Water and Wastewater System - Electricity Utilization (kWh/month)
-
200,000
400,000
600,000
800,000
1,000,000
1,200,000
1,400,000
1,600,000
1,800,000
Jan-
00
Jul-0
0
Jan-
01
Jul-0
1
Jan-
02
Jul-0
2
Jan-
03
Jul-0
3
Jan-
04
Jul-0
4
kWh
per m
onth
AA WTPAA WWTP
Ann Arbor Water and Wastewater System - Electricity Utilization (GJ/MG)
0
2
4
6
8
10
12
Jan-
00
Jul-0
0
Jan-
01
Jul-0
1
Jan-
02
Jul-0
2
Jan-
03
Jul-0
3
Jan-
04
Jul-0
4
GJ
/ MG
AA WTP(per MGdelivered)AA WWTP(per MGtreated)

116
For the year 2000 the total electricity consumption calculated from primary data available
from the plants for the Ann Arbor ‘water and wastewater’ system is 25,357,775 kWh. In
a study conducted by Epstein et.al26 on GHG emissions reduction strategy for the City of
Ann Arbor the total electricity consumption for the Municipal Government Sector for the
same year was reported to be 46,681,772 kWh.
Table 6-3 Electricity Consumption for the Ann Arbor Municipal Government Sector
Year Ann Arbor WTP Ann Arbor WWTP Ann Arbor WTP and
WWTP Ann Arbor Municipal Govt. Sector
kWh % of Total
kWh % of Total
kWh % of Total
kWh 2000
11,631,010 25 13,726,765 29 25,357,775 54 46,681,772
Based on the figures above the Ann Arbor WTP consumes 25% of the total electricity
consumption of the municipal government sector in Ann Arbor and Ann Arbor WWTP
accounts to 29%. Thus, the ‘water and wastewater’ system accounts for 54% of the total
electricity consumed for the services† provided by the Ann Arbor City Government.
Energy savings practices for reduction of electricity consumption at the water and
wastewater treatment plants for Ann Arbor could reduce the total burden of electricity
consumption from the grid significantly. However, the total life-cycle energy for
operation of the water and wastewater system in the city comprises of other sources as
well.
6.4 Total Life-cycle Energy for the Ann Arbor Water and Wastewater System
The life-cycle energy consumed per month for operating the Ann Arbor WTP and Ann
Arbor WWTP is presented in Chapter 2 and Chapter 3 respectively. This section
discusses the life-cycle energy for the water and wastewater system as a whole. The life-
cycle energy for operating the Ann Arbor WTP was 111,083 GJ for the year 2003 and
110,138 GJ for the year 2004. The Ann Arbor WWTP consumed 103,396 GJ and
107,571 GJ for 2003 and 2004 respectively. Table 6-4 shows the contribution of Ann
† Including Water treatment (incl. lift pumps), Wastewater treatment (incl. lift pumps), Office space (incl. City Hall), Maintenance garages, Park shelters and canoe liveries, Community centers, Fire stations, Pools and ice rinks, parking lots and structures, Leslie Science Center, golf courses, and miscellaneous.

117
Arbor WTP and WWTP to the total life-cycle energy for operation of the water and
wastewater treatment system as a whole.
Table 6-4 Life-cycle Energy Consumed for Operation of Ann Arbor Water and Wastewater System
Year Ann Arbor WTP Ann Arbor WWTP Life-cycle energy for the Water and Wastewater System
GJ/Yr GJ/Yr GJ/Yr 2003 111,083 103,396 214,479 2004 110,138 107,751 217,889
The production of chemicals utilized at the Ann Arbor WTP plant is responsible for 37%
and electricity consumption for operation of the plant and pumping stations accounts for
35% of the total life-cycle energy for operation of the plant. On the other hand, 50% of
the life-cycle energy for operation of the Ann Arbor WWTP is from electricity
consumption for at the plant and 26% from consumption of natural gas for heating.
Figure 6-6. Total Life-cycle Energy for the Ann Arbor Water and Wastewater System (GJ/Yr)
Ann Arbor Water and Wastewater System - Total Life-cycle Energy (GJ/Yr)
111,083 110,138
103,396 107,751
0
50000
100000
150000
200000
250000
2003 2004
GJ
/ Yr
Ann Arbor WWTPAnn Arbor WTP

118
The Ann Arbor WTP accounts for 52% of the total life-cycle energy for the water and
wastewater system for 2003 and 51% for 2004. Although the quantity of chemicals
consumed for treatment at the WTP or the WWTP cannot be reduced for reducing the
total-cycle energy for the system, the consumption of electricity and natural gas can be
reduced by employing energy-saving equipments and utilizing co-generation‡ at the
wastewater treatment plant for reducing the burdens of electricity and natural gas
consumption thereby reducing the life-cycle emissions for the system.
6.5 Life-cycle Emissions from Ann Arbor Water and Wastewater System
The natural gas consumption for heating purposes at the Ann Arbor WTP, Barton and
Steere Farm Pumping stations and distribution pumping stations together account for a
large part of the total greenhouse gas emissions from operation of the plant. Also, the
production processes of chemicals required for treatment at the WTP result into emission
of greenhouse gases. As a result, the total life-cycle global warming potential from
emissions is much higher for the WTP when compared with the Ann Arbor WWTP.
Table 6-5 Global Warming Potential for Ann Arbor Water and Wastewater System (kg CO2 equivalent per year)
Year Ann Arbor WTP Ann Arbor WWTP Life-cycle GWP from Ann Arbor Water and Wastewater System
kg CO2 eq./Yr kg CO2 eq./Yr kg CO2 eq./Yr 2003 22,308,448 12,965,912 35,274,360 2004 22,598,446 13,484,100 36,082,546
The electricity consumption for operation of the Ann Arbor WTP and WWTP are major
sources of greenhouse gas emissions for the Ann Arbor WWTP.
Further, a major part of the total atmospheric eutrophication potential for the system over
a hundred year time horizon is a result of NOx emissions from electricity consumption at
the WTP and WWTP. The total atmospheric eutrophication potential for the system is
542 g N eq. for 2003 and 510 kg N eq. for 2004. Table 6-6 shows the contribution of the
‡ The co-generation system for the Laguna WWTP has been discussed in Chapter 5

119
WTP and WWTP each to the total atmospheric eutrophication potential from the Ann
Arbor water and wastewater system as a whole.
Table 6-6 Eutrophication Potential from the Ann Arbor Water and Wastewater System (g N eq. /MG)
Atmospheric Eutrophication Potential Aquatic Eutrophication Potential kg Nitrogen eq./Yr g Nitrogen eq./Yr
Year Ann Arbor
WTP Ann Arbor WWTP
Water and Wastewater System
Ann Arbor WTP
Ann Arbor WWTP
Water and Wastewater System
2003 243 299 542 11 3 14
2004 227 283 510 10 3 13
The aquatic eutrophication potential is higher from the Ann Arbor WTP since the natural
gas consumption is higher for the WTP when compared with the WWTP and the COD
and Ammonia emissions from natural gas consumption are major factors responsible for
the total aquatic eutrophication potential for the system. The total aquatic eutrophication
potential for the Ann Arbor water and wastewater system is 14 g N eq. for 2003 and 13 g
N eq. for the year 2004.
The total acidification potential from operation of the Ann Arbor water and wastewater
system is 1,300 kmoles of H+ eq. per year for the two year period from 2003 to 2004.
Table 6-7 presents the total life-cycle acidification potential per year from the Ann Arbor
water and wastewater system comprising of the Ann Arbor WTP and Ann Arbor WWTP.
Table 6-7 Acidification Potential from the Ann Arbor Water and Wastewater System (kmoles of H+ eq. per year)
Year Acidification Potential in terms of kmoles of H+ eq. per year Ann Arbor WTP Ann Arbor WWTP Ann Arbor Water and Wastewater System
2003 663 691 1,354 2004 631 657 1,288
The major contributors to the total acidification potential from the system are sulfur
dioxide emissions from electricity used at both treatment plants. Since the electricity
utilization is higher for Ann Arbor WWTP the total impact in terms of acidification
potential over a hundred year time horizon is also higher for the Ann Arbor WWTP when
compared with the Ann Arbor WTP.

120
6.6 Conclusions
Water and wastewater treatment plants are essential for modern society in terms of the
service provided towards the people and the environment of a city. This research effort
does not focus on the benefits in terms of public health and reduction of environmental
pollution. The main focus of this study is to document the energy intensity and
environmental impacts from operation of Ann Arbor Water and Wastewater Treatment
System. Table 6-8 presents the total life-cycle energy and environmental impacts from
operation of Ann Arbor ‘water and wastewater treatment system per million gallons
drinking water†.
Table 6-8 Energy and Environmental Impacts from Ann Arbor Water and Wastewater System
Year Life-cycle Energy for Operation
Total Global Warming Potential
Atmospheric Eutrophication
Potential
Aquatic Eutrophication
Potential Acidification
Potential
GJ/MG kg CO2 eq./MG g N eq./ MG g N eq./ MG kmoles H+
eq./MG 2003 40 5213 534 14 12402004 40 5250 505 13 1174
The total life-cycle energy for operation of Ann Arbor ‘water and wastewater treatment’
system is 40 GJ per million gallons clean water or 216,000 GJ per year (Table 6-4). The
life-cycle energy of the Ann Arbor ‘water and wastewater’ system per year is equivalent
to that of 2160‡ passenger cars or 685ψ residential homes27.
Although the annual electricity consumption at the WTP is lower than that of the WWTP,
high energy consumption in the form of chemicals and natural gas contributes
significantly to the total life-cycle energy for the Ann Arbor WTP. As result, the Ann
Arbor WTP contributes 60% of the total life-cycle energy for operation of the Ann Arbor
‘water and wastewater treatment system’.
† Although this study uses million gallons of wastewater treated as a functional unit for all results presented in previous chapters the results in Table 6-8 are based on per million gallons of clean water or effluent discharged from the Ann Arbor WWTP. ‡ Life-cycle energy of a passenger car (120,000 miles and 10 years) is 100 GJ/Yr ψ Life-cycle energy of a residential home (228m2, 50 years) is 320 GJ/Yr

121
The total global warming potential from operation of the Ann Arbor ‘water and
wastewater treatment’ system is 5,232 kg CO2 eq. /MG. As with the total life-cycle
energy, the contribution of the Ann Arbor WTP to this environmental impact is much
higher than that of the Ann Arbor WWTP. However, the atmospheric eutrophication
potential from the Ann Arbor WWTP is significantly higher than the Ann Arbor WTP
contributing over 55% of the total atmospheric eutrophication potential of 526 g N eq.
/MG.
The aquatic eutrophication potential from the Ann Arbor WTP is higher than that of the
Ann Arbor WWTP contributing 77% of the total aquatic eutrophication potential due to
high COD emissions from natural gas consumption. The total life-cycle aquatic
eutrophication potential from operation of the Ann Arbor ‘water and wastewater
treatment’ system is 13 g N eq. per million gallons clean water. Lastly, the life-cycle
acidification potential from the system is 1,321 kmoles of H+ eq. per million gallons of
clean water, out of which 50% is contributed from operation of WTP and WWTP each.
6.7 Recommendations and Future Directions
Sustainability analyses using life-cycle assessments for water and wastewater system as a
whole are uncommon. The presently available literature and research focus on water
treatment plants and wastewater treatment plants as individual systems. However, the
interdependence of these systems and their significance in a city make studies focusing
on the ‘water and wastewater treatment’ system crucial for development of sustainable
strategies. The framework for life-cycle energy and emissions analyses for the ‘Ann
Arbor Water and Wastewater’ system and the findings compiled in this study can be
utilized for comparative assessments with similar facilities in future.
The life-cycle energy for the Ann Arbor ‘water and wastewater treatment’ would reduce
significantly by reducing the electricity consumption for operation of the plants and
natural gas consumption for heating. The adoption of anaerobic sludge treatment process
at the Ann Arbor WWTP could produce approximately 125,880 kg of methane per month

122
which is equal to 24,439,602 CCF†. The average monthly requirement of natural gas for
heating at the Ann Arbor WWTP plant is 17,706 CCF and the average monthly
requirement for the WTP 24,390 CCF. The methane gas produced from the proposed
system at the Ann Arbor WWTP is sufficient for meeting the total natural gas
requirements for heating at the Ann Arbor water and wastewater treatment plants.
Further, the excess methane can be used for production of electricity at the plant using a
co-generation system. This would also reduce the total global warming potential from the
‘water and wastewater treatment’ system.
Life-cycle energy and emissions assessments would be much more beneficial if the
contribution of each treatment stage towards the total life-cycle energy and impacts can
be ascertained. Since, it is difficult to track the energy consumption at each stage without
separate metering systems for each treatment stage; it was difficult to pin-point particular
stages of high electricity consumption for the Ann Arbor ‘water and wastewater’ system.
Future studies employing meters at the different stages of treatment at the plants
combined with the findings of this study should prove to be beneficial for development of
strategies for reducing the total energy consumption and consequent emissions from
operation of water and wastewater treatment plants.
Further, incorporation of the construction and maintenance of the physical structure of
water and wastewater treatment systems in the life-cycle energy and emissions
assessments would provide a more comprehensive analysis. Lastly, a life-cycle cost
analysis for the water and wastewater treatment plants complimenting the findings of this
study would certainly be more beneficial for understanding the economic aspect of these
plants. Such studies, together with the findings presented in this study would aid
decision-making for sustainable management of water and wastewater treatment systems.
† Density of gaseous methane is 1.819 kg/m3, thus 1 kg is equal to 19.415 CCF of the gas.

123
Appendix A-I
Ann Arbor Water Treatment Plant Energy Consumption
a. Ann Arbor Water Treatment Plant - Total Flow
Date From From Total Filtered Delivered Difference
River Well Influent Acqd-Delivd
Month/Yr MGD MG MG/Yr MGD MG MGD MG MG/Yr MGD MG MGD MG MG/yr MG Jan-00 11.81 366.00 4874.17 3.18 98.65 14.99 464.65 5855.49 15.35 475.84 14.22 440.94 5274.29 23.72 Feb-00 11.27 315.48 3.92 109.89 15.19 425.37 15.64 437.91 14.84 415.63 9.73 Mar-00 11.52 357.09 3.15 97.67 14.67 454.77 15.00 464.89 13.82 428.27 26.49 Apr-00 13.30 399.14 2.17 64.97 15.47 464.11 15.77 473.16 14.10 422.86 41.25 May-00 13.70 424.80 2.18 67.65 15.89 492.45 16.21 502.46 14.72 456.35 36.10 Jun-00 15.44 463.29 2.26 67.90 17.71 531.20 18.05 541.59 16.06 481.77 49.42 Jul-00 16.37 507.57 2.26 70.02 18.63 577.58 19.19 594.96 16.61 514.89 62.69 Aug-00 15.64 484.89 2.27 70.37 17.91 555.26 18.43 571.32 15.68 486.13 69.13 Sep-00 15.20 455.91 2.35 70.56 17.55 526.47 18.09 542.75 15.24 457.21 69.26 Oct-00 13.77 426.93 2.28 70.75 16.05 497.68 16.59 514.18 13.82 428.28 69.39 Nov-00 12.29 368.80 2.33 69.81 14.62 438.61 14.94 448.07 12.55 376.59 62.02 Dec-00 9.82 304.28 3.97 123.08 13.79 427.36 14.12 437.73 11.79 365.35 62.01 Jan-01 10.56 327.31 5194.95 3.95 122.48 14.51 449.79 6277.06 14.79 458.46 12.29 381.10 5198.00 68.69 Feb-01 11.01 308.26 3.81 106.61 14.82 414.87 15.19 425.21 12.48 349.49 65.38 Mar-01 10.59 328.32 3.93 121.81 14.52 450.13 14.90 461.87 12.34 382.60 67.53 Apr-01 13.08 392.49 2.66 79.67 15.74 472.16 16.16 484.93 13.10 393.03 79.13 May-01 14.12 437.57 2.41 74.57 16.52 512.14 16.93 524.78 13.47 417.58 94.56 Jun-01 16.30 489.08 2.40 71.94 18.70 561.01 19.13 574.01 15.24 457.09 103.93 Jul-01 22.57 699.70 2.28 70.70 24.85 770.40 25.48 790.03 20.57 637.53 132.87 Aug-01 19.08 591.41 3.12 96.68 22.20 688.08 22.68 703.12 18.14 562.37 125.71 Sep-01 15.76 472.71 2.99 89.72 18.75 562.43 19.09 572.60 15.48 464.45 97.98 Oct-01 14.12 437.57 2.41 74.57 16.52 512.14 16.93 524.78 13.47 417.58 94.56 Nov-01 12.40 372.05 2.59 77.79 14.99 449.84 15.18 455.47 12.42 372.63 77.21

124
Dec-01 10.92 338.50 3.08 95.59 14.00 434.09 14.26 441.96 11.70 362.57 71.52 Jan-02 10.43 323.30 5179.78 3.70 114.71 14.13 438.01 6334.02 14.40 446.34 11.88 368.24 5044.03 69.77 Feb-02 10.13 283.68 3.77 105.53 13.90 389.20 14.21 397.76 11.90 333.06 56.14 Mar-02 10.55 327.09 3.42 106.12 13.97 433.21 14.31 443.56 12.00 371.93 61.28 Apr-02 12.43 372.88 2.64 79.15 15.07 452.03 15.42 462.62 12.49 374.56 77.46 May-02 12.16 376.88 2.99 92.63 15.15 469.50 15.47 479.58 11.39 352.94 116.57 Jun-02 18.55 556.60 2.97 89.21 21.53 645.81 21.81 654.25 16.45 493.45 152.36 Jul-02 23.39 725.23 2.95 91.38 26.34 816.61 26.69 827.53 20.71 641.97 174.64 Aug-02 18.58 576.04 2.94 91.17 21.52 667.21 21.89 678.52 15.91 493.21 173.99 Sep-02 19.40 582.10 2.94 88.12 22.34 670.22 22.96 688.82 16.71 501.35 168.87 Oct-02 13.19 408.74 2.96 91.75 16.14 500.49 16.60 514.50 12.87 398.82 101.67 Nov-02 11.64 349.05 2.90 87.01 14.54 436.06 15.03 450.88 12.27 367.99 68.06 Dec-02 9.62 298.22 3.79 117.47 13.41 415.68 13.46 417.15 11.18 346.50 69.18 Jan-03 10.01 310.29 4701.02 4.12 127.83 14.13 438.11 5958.48 14.68 455.07 11.83 366.60 5381.46 71.51 Feb-03 10.07 281.97 4.02 112.65 14.09 394.63 14.47 405.13 11.78 329.85 64.77 Mar-03 9.74 301.97 4.58 141.91 14.32 443.88 14.63 453.41 11.71 363.12 80.76 Apr-03 11.21 336.26 4.03 120.93 15.24 457.19 15.63 468.81 11.38 341.39 115.80 May-03 12.45 386.02 3.29 102.03 15.74 488.05 16.11 499.38 13.15 407.74 80.32 Jun-03 16.06 481.90 2.57 77.18 18.64 559.09 18.97 569.00 17.93 538.01 21.08 Jul-03 18.89 585.71 2.76 85.45 21.65 671.17 22.01 682.31 21.31 660.74 10.43 Aug-03 16.92 524.40 2.79 86.40 19.70 610.81 20.11 623.46 18.84 583.93 26.88 Sep-03 16.57 497.23 2.81 84.36 19.39 581.59 19.78 593.29 18.54 556.11 25.48 Oct-03 13.03 403.91 2.81 87.19 15.84 491.10 16.16 500.81 14.65 454.15 36.95 Nov-03 11.09 332.65 3.02 90.72 14.11 423.36 14.42 432.49 13.13 394.00 29.36 Dec-03 8.35 258.71 4.54 140.81 12.89 399.52 13.13 407.16 12.45 385.83 13.69 Jan-04 9.23 286.10 4636.13 4.63 143.41 13.86 429.51 5799.87 14.39 445.97 13.40 415.48 5436.70 14.03 Feb-04 9.44 264.44 4.68 131.05 14.12 395.49 14.42 403.62 13.66 382.39 13.10 Mar-04 9.58 296.84 4.18 129.56 13.75 426.40 14.04 435.34 13.21 409.59 16.81 Apr-04 11.82 354.53 2.99 89.82 14.81 444.35 15.23 456.87 14.04 421.24 23.11 May-04 12.94 401.14 2.55 78.98 15.49 480.13 15.95 494.50 14.58 451.85 28.28 Jun-04 14.66 439.72 2.63 78.78 17.28 518.50 17.79 533.56 16.24 487.17 31.33 Jul-04 17.25 534.65 2.57 79.77 19.82 614.42 20.34 630.47 19.05 590.46 23.95 Aug-04 15.84 490.93 2.55 79.07 18.39 570.00 18.86 584.67 17.47 541.51 28.49 Sep-04 17.92 537.72 2.52 75.60 20.44 613.32 21.00 629.91 19.54 586.29 27.03

125
Oct-04 13.41 415.65 2.52 78.27 15.93 493.92 16.46 510.21 14.66 454.56 39.36 Nov-04 11.00 330.05 2.81 84.34 13.81 414.40 14.22 426.71 11.76 352.92 61.47 Dec-04 9.17 284.36 3.71 115.09 12.89 399.45 13.28 411.75 11.07 343.25 56.21 Jan-05 9.58 296.89 4851.24 3.77 116.81 13.35 413.70 5975.31 13.70 424.85 11.96 370.67 5252.57 43.03 Feb-05 9.51 266.14 3.88 108.64 13.39 374.78 13.74 384.81 11.63 325.56 49.22 Mar-05 9.00 278.87 4.28 132.53 13.27 411.40 13.61 421.79 11.98 371.26 40.14 Apr-05 11.52 345.66 3.06 91.78 14.58 437.44 14.95 448.63 13.36 400.77 36.67 May-05 13.20 409.34 2.21 68.52 15.41 477.86 15.81 490.11 13.79 427.36 50.50 Jun-05 18.96 568.66 2.26 67.85 21.22 636.50 21.72 651.57 17.90 536.89 99.62 Jul-05 17.37 538.59 2.36 73.02 19.73 611.60 20.32 629.79 16.56 513.41 98.19 Aug-05 18.59 576.16 2.54 78.82 21.13 654.98 21.79 675.34 18.12 561.61 93.37 Sep-05 18.23 546.96 2.77 82.98 21.00 629.94 21.57 647.13 18.42 552.47 77.47 Oct-05 13.38 414.63 2.94 91.02 16.31 505.64 16.81 521.18 14.52 450.16 55.49 Nov-05 10.92 327.56 3.13 93.97 14.05 421.52 14.41 432.39 12.57 377.21 44.31 Dec-05 9.09 281.79 3.81 118.15 12.90 399.94 13.25 410.70 11.78 365.21 34.74

126
b. Ann Arbor Water Treatment Plant – Electrical Consumption
Date Total Total Treatment Distribution Total Electrical
Flow Delivered Plant Pumping
Sta. Energy Supplied
Month/Yr MG MG kWh kWh kWh kWh/MG kWh/Yr GJ GJ/Yr GJ/MG-
Yr GJ/MGJan-00 464.65 440.94 558400.00 305280.00 863680.00 1958.74 11631010.00 3109.25 41871.64 8.30 7.05Feb-00 425.37 415.63 543040.00 277500.00 820540.00 1974.19 2953.94 7.11Mar-00 454.77 428.27 620800.00 354380.00 975180.00 2277.01 3510.65 8.20Apr-00 464.11 422.86 623360.00 188920.00 812280.00 1920.92 2924.21 6.92May-00 492.45 456.35 749440.00 238560.00 988000.00 2165.01 3556.80 7.79Jun-00 531.20 481.77 679360.00 462180.00 1141540.00 2369.45 4109.54 8.53Jul-00 577.58 514.89 678720.00 281280.00 960000.00 1864.47 3456.00 6.71Aug-00 555.26 486.13 774080.00 519070.00 1293150.00 2660.08 4655.34 9.58Sep-00 526.47 457.21 606720.00 409280.00 1016000.00 2222.20 3657.60 8.00Oct-00 497.68 428.28 561920.00 368430.00 930350.00 2172.27 3349.26 7.82Nov-00 438.61 376.59 605120.00 341190.00 946310.00 2512.81 3406.72 9.05Dec-00 427.36 365.35 589440.00 294540.00 883980.00 2419.54 3182.33 8.71Jan-01 449.79 381.10 536960.00 304330.00 841290.00 2207.55 29057.98 3028.64 45129.38 8.68 7.95Feb-01 414.87 349.49 590400.00 322360.00 912760.00 2611.72 3285.94 9.40Mar-01 450.13 382.60 579520.00 350770.00 930290.00 2431.51 3349.04 8.75Apr-01 472.16 393.03 591680.00 397720.00 989400.00 2517.36 3561.84 9.06May-01 512.14 417.58 690880.00 452060.00 1142940.00 2737.07 4114.58 9.85Jun-01 561.01 457.09 739840.00 578150.00 1317990.00 2883.46 4744.76 10.38Jul-01 770.40 637.53 904640.00 681090.00 1585730.00 2487.29 5708.63 8.95Aug-01 688.08 562.37 674240.00 479150.00 1153390.00 2050.94 4152.20 7.38Sep-01 562.43 464.45 596800.00 370860.00 967660.00 2083.47 3483.58 7.50Oct-01 512.14 417.58 537600.00 322270.00 859870.00 2059.18 3095.53 7.41Nov-01 449.84 372.63 612480.00 349670.00 962150.00 2582.08 3463.74 9.30Dec-01 434.09 362.57 579520.00 292950.00 872470.00 2406.34 3140.89 8.66Jan-02 438.01 368.24 586240.00 320230.00 906470.00 2461.63 29727.40 3263.29 44777.74 8.88 8.86

127
Feb-02 389.20 333.06 513280.00 259570.00 772850.00 2320.45 2782.26 8.35Mar-02 433.21 371.93 556800.00 316420.00 873220.00 2347.83 3143.59 8.45Apr-02 452.03 374.56 576000.00 298230.00 874230.00 2333.99 3147.23 8.40May-02 469.50 352.94 642880.00 436630.00 1079510.00 3058.65 3886.24 11.01Jun-02 645.81 493.45 880960.00 502760.00 1383720.00 2804.17 4981.39 10.10Jul-02 816.61 641.97 840320.00 571780.00 1412100.00 2199.65 5083.56 7.92Aug-02 667.21 493.21 744640.00 529380.00 1274020.00 2583.11 4586.47 9.30Sep-02 670.22 501.35 605120.00 539340.00 1144460.00 2282.74 4120.06 8.22Oct-02 500.49 398.82 592640.00 355570.00 948210.00 2377.52 3413.56 8.56Nov-02 436.06 367.99 586880.00 297090.00 883970.00 2402.14 3182.29 8.65Dec-02 415.68 346.50 608640.00 276860.00 885500.00 2555.53 3187.80 9.20Jan-03 438.11 366.60 656640.00 309950.00 966590.00 2636.63 28085.36 3479.72 44499.96 8.27 9.49Feb-03 394.63 329.85 549120.00 255300.00 804420.00 2438.74 2895.91 8.78Mar-03 443.88 363.12 575040.00 276940.00 851980.00 2346.30 3067.13 8.45Apr-03 457.19 341.39 629120.00 330490.00 959610.00 2810.87 3454.60 10.12May-03 488.05 407.74 716160.00 362900.00 1079060.00 2646.46 3884.62 9.53Jun-03 559.09 538.01 813120.00 426920.00 1240040.00 2304.86 4464.14 8.30Jul-03 671.17 660.74 863360.00 495870.00 1359230.00 2057.14 4893.23 7.41Aug-03 610.81 583.93 647040.00 489760.00 1136800.00 1946.81 4092.48 7.01Sep-03 581.59 556.11 762560.00 463490.00 1226050.00 2204.70 4413.78 7.94Oct-03 491.10 454.15 591680.00 322000.00 913680.00 2011.83 3289.25 7.24Nov-03 423.36 394.00 568000.00 279300.00 847300.00 2150.50 3050.28 7.74Dec-03 399.52 385.83 634560.00 341780.00 976340.00 2530.52 3514.82 9.11Jan-04 429.51 415.48 701120.00 390060.00 1091180.00 2626.34 28677.80 3928.25 46224.32 8.50 9.45Feb-04 395.49 382.39 567360.00 404920.00 972280.00 2542.67 3500.21 9.15Mar-04 426.40 409.59 559040.00 380010.00 939050.00 2292.66 3380.58 8.25Apr-04 444.35 421.24 636480.00 374080.00 1010560.00 2399.01 3638.02 8.64May-04 480.13 451.85 605440.00 417330.00 1022770.00 2263.51 3681.97 8.15Jun-04 518.50 487.17 664960.00 520410.00 1185370.00 2433.16 4267.33 8.76Jul-04 614.42 590.46 797440.00 455280.00 1252720.00 2121.60 4509.79 7.64Aug-04 570.00 541.51 721280.00 527400.00 1248680.00 2305.93 4495.25 8.30

128
Sep-04 613.32 586.29 811200.00 476420.00 1287620.00 2196.22 4635.43 7.91Oct-04 493.92 454.56 649920.00 299280.00 949200.00 2088.19 3417.12 7.52Nov-04 414.40 352.92 577920.00 304890.00 882810.00 2501.42 3178.12 9.01Dec-04 399.45 343.25 675520.00 322330.00 997850.00 2907.10 3592.26 10.47Jan-05 413.70 370.67 570240.00 292980.00 863220.00 2328.84 29969.15 3107.59 47037.82 8.96 8.38Feb-05 374.78 325.56 602080.00 292230.00 894310.00 2746.96 3219.52 9.89Mar-05 411.40 371.26 633920.00 343770.00 977690.00 2633.45 3519.68 9.48Apr-05 437.44 400.77 568000.00 351960.00 919960.00 2295.47 3311.86 8.26May-05 477.86 427.36 752000.00 499650.00 1251650.00 2928.77 4505.94 10.54Jun-05 636.50 536.89 844800.00 548060.00 1392860.00 2594.33 5014.30 9.34Jul-05 611.60 513.41 856320.00 518900.00 1375220.00 2678.58 4950.79 9.64Aug-05 654.98 561.61 884160.00 593320.00 1477480.00 2630.81 5318.93 9.47Sep-05 629.94 552.47 678720.00 441940.00 1120660.00 2028.47 4034.38 7.30Oct-05 505.64 450.16 592320.00 310440.00 902760.00 2005.42 3249.94 7.22Nov-05 421.52 377.21 610560.00 282490.00 893050.00 2367.52 3214.98 8.52Dec-05 399.94 365.21 699520.00 297680.00 997200.00 2730.52 3589.92 9.83
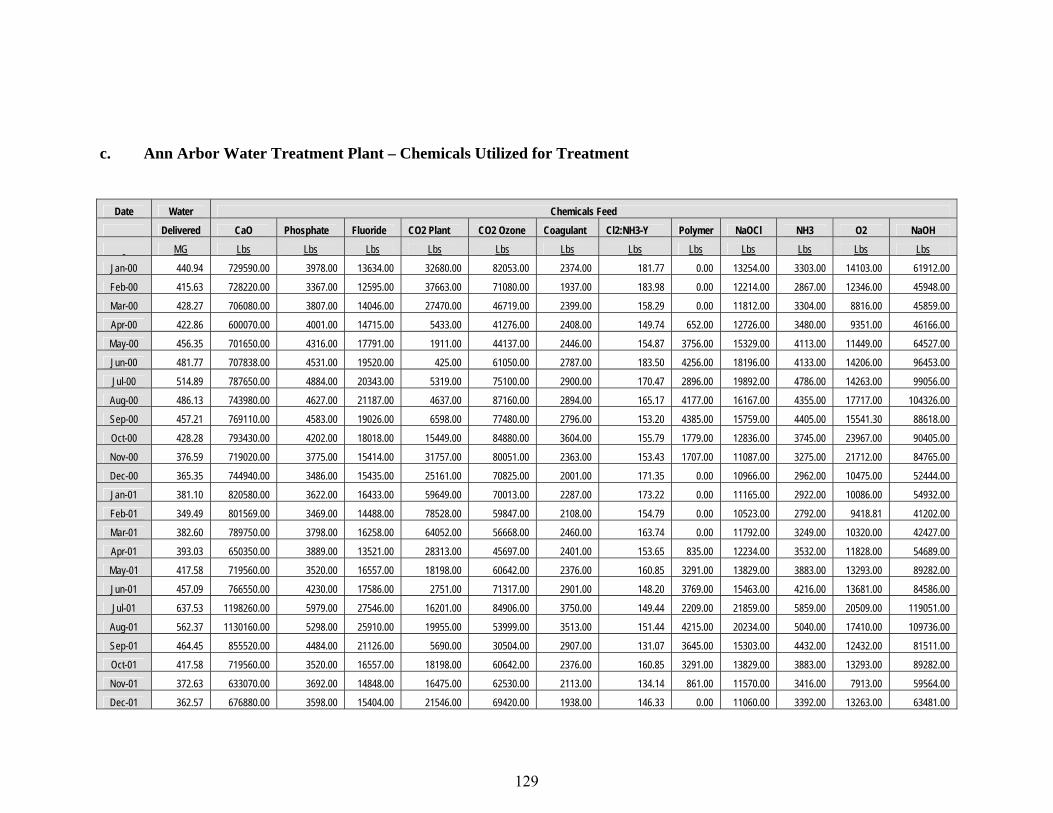
129
c. Ann Arbor Water Treatment Plant – Chemicals Utilized for Treatment
Date Water Chemicals Feed
Delivered CaO Phosphate Fluoride CO2 Plant CO2 Ozone Coagulant Cl2:NH3-Y Polymer NaOCl NH3 O2 NaOH
MG Lbs Lbs Lbs Lbs Lbs Lbs Lbs Lbs Lbs Lbs Lbs Lbs
Jan-00 440.94 729590.00 3978.00 13634.00 32680.00 82053.00 2374.00 181.77 0.00 13254.00 3303.00 14103.00 61912.00
Feb-00 415.63 728220.00 3367.00 12595.00 37663.00 71080.00 1937.00 183.98 0.00 12214.00 2867.00 12346.00 45948.00
Mar-00 428.27 706080.00 3807.00 14046.00 27470.00 46719.00 2399.00 158.29 0.00 11812.00 3304.00 8816.00 45859.00
Apr-00 422.86 600070.00 4001.00 14715.00 5433.00 41276.00 2408.00 149.74 652.00 12726.00 3480.00 9351.00 46166.00
May-00 456.35 701650.00 4316.00 17791.00 1911.00 44137.00 2446.00 154.87 3756.00 15329.00 4113.00 11449.00 64527.00
Jun-00 481.77 707838.00 4531.00 19520.00 425.00 61050.00 2787.00 183.50 4256.00 18196.00 4133.00 14206.00 96453.00
Jul-00 514.89 787650.00 4884.00 20343.00 5319.00 75100.00 2900.00 170.47 2896.00 19892.00 4786.00 14263.00 99056.00
Aug-00 486.13 743980.00 4627.00 21187.00 4637.00 87160.00 2894.00 165.17 4177.00 16167.00 4355.00 17717.00 104326.00
Sep-00 457.21 769110.00 4583.00 19026.00 6598.00 77480.00 2796.00 153.20 4385.00 15759.00 4405.00 15541.30 88618.00
Oct-00 428.28 793430.00 4202.00 18018.00 15449.00 84880.00 3604.00 155.79 1779.00 12836.00 3745.00 23967.00 90405.00
Nov-00 376.59 719020.00 3775.00 15414.00 31757.00 80051.00 2363.00 153.43 1707.00 11087.00 3275.00 21712.00 84765.00
Dec-00 365.35 744940.00 3486.00 15435.00 25161.00 70825.00 2001.00 171.35 0.00 10966.00 2962.00 10475.00 52444.00
Jan-01 381.10 820580.00 3622.00 16433.00 59649.00 70013.00 2287.00 173.22 0.00 11165.00 2922.00 10086.00 54932.00
Feb-01 349.49 801569.00 3469.00 14488.00 78528.00 59847.00 2108.00 154.79 0.00 10523.00 2792.00 9418.81 41202.00
Mar-01 382.60 789750.00 3798.00 16258.00 64052.00 56668.00 2460.00 163.74 0.00 11792.00 3249.00 10320.00 42427.00
Apr-01 393.03 650350.00 3889.00 13521.00 28313.00 45697.00 2401.00 153.65 835.00 12234.00 3532.00 11828.00 54689.00
May-01 417.58 719560.00 3520.00 16557.00 18198.00 60642.00 2376.00 160.85 3291.00 13829.00 3883.00 13293.00 89282.00
Jun-01 457.09 766550.00 4230.00 17586.00 2751.00 71317.00 2901.00 148.20 3769.00 15463.00 4216.00 13681.00 84586.00
Jul-01 637.53 1198260.00 5979.00 27546.00 16201.00 84906.00 3750.00 149.44 2209.00 21859.00 5859.00 20509.00 119051.00
Aug-01 562.37 1130160.00 5298.00 25910.00 19955.00 53999.00 3513.00 151.44 4215.00 20234.00 5040.00 17410.00 109736.00
Sep-01 464.45 855520.00 4484.00 21126.00 5690.00 30504.00 2907.00 131.07 3645.00 15303.00 4432.00 12432.00 81511.00
Oct-01 417.58 719560.00 3520.00 16557.00 18198.00 60642.00 2376.00 160.85 3291.00 13829.00 3883.00 13293.00 89282.00
Nov-01 372.63 633070.00 3692.00 14848.00 16475.00 62530.00 2113.00 134.14 861.00 11570.00 3416.00 7913.00 59564.00
Dec-01 362.57 676880.00 3598.00 15404.00 21546.00 69420.00 1938.00 146.33 0.00 11060.00 3392.00 13263.00 63481.00

130
Jan-02 368.24 799160.00 3689.00 15651.00 57217.00 49230.00 2225.00 156.08 0.00 11288.00 3411.00 10753.00 40015.00
Feb-02 333.06 730530.00 3296.00 13058.00 60743.00 25820.00 2024.00 145.04 0.00 9693.00 2773.00 7383.00 30254.00
Mar-02 371.93 737270.00 3713.00 14344.00 57134.00 19890.00 2279.00 156.37 0.00 10347.00 3158.00 7950.00 50338.00
Apr-02 374.56 654690.00 3884.00 15816.00 27902.00 43213.00 2325.00 159.87 0.00 12465.00 3279.00 8430.00 102335.00
May-02 352.94 684938.00 3927.00 16855.00 12692.00 46441.00 2651.00 155.21 1939.00 12410.00 3500.00 11910.00 52788.00
Jun-02 493.45 840533.00 5271.00 21470.00 4362.00 43506.00 3283.00 148.56 2711.00 17070.00 4659.00 15900.00 76379.00
Jul-02 641.97 1114402.00 6749.00 25088.00 4285.00 58128.00 3715.00 150.74 3998.00 22047.00 5994.00 20457.00 94077.00
Aug-02 493.21 873084.00 5486.00 18333.00 143.00 35252.00 3707.00 154.65 3021.00 18877.00 4870.00 15334.00 73816.00
Sep-02 501.35 887714.00 5756.00 23214.00 21142.00 48691.00 3728.00 142.81 677.00 18666.00 4956.00 11921.00 79808.00
Oct-02 398.82 774073.00 3937.00 17491.00 92898.00 36406.00 2326.00 146.83 1693.00 13412.00 3827.00 9446.00 39444.00
Nov-02 367.99 670879.00 3522.00 14701.00 106246.00 30293.00 2090.00 142.44 0.00 10694.00 3286.00 8036.69 26500.00
Dec-02 346.50 755056.00 3377.00 12885.00 65072.00 30259.00 2096.00 149.09 0.00 10274.00 3135.00 6944.00 27530.00
Jan-03 366.60 868149.00 3570.00 14316.00 71123.00 30148.00 2238.00 147.66 0.00 11671.00 3451.00 7297.00 27141.00
Feb-03 329.85 708376.00 3105.00 12706.00 27598.00 33590.00 2211.00 145.10 0.00 10667.00 2806.00 6394.00 28752.00
Mar-03 363.12 757385.00 3559.00 15703.00 4449.00 33473.00 2239.00 170.39 0.00 11344.00 2961.00 8159.00 21450.00
Apr-03 341.39 645223.00 3606.00 15702.00 1560.00 27693.00 2274.00 151.35 0.00 10953.00 3163.00 9594.00 19357.00
May-03 407.74 702591.00 4191.00 17631.00 4425.00 37606.00 2649.00 145.39 1002.00 12298.00 3498.00 10806.00 46109.00
Jun-03 538.01 767900.00 4722.00 19228.00 18726.00 40228.00 2675.00 130.87 1649.00 14120.00 4775.00 12728.00 54446.00
Jul-03 660.74 994543.00 4836.00 25609.00 5255.00 36044.00 2805.00 147.19 3378.00 18100.00 5192.00 16944.00 77721.00
Aug-03 583.93 890425.00 4388.00 21087.00 36.00 27164.00 3011.00 149.79 2539.00 16522.00 4618.00 13953.00 70696.00
Sep-03 556.11 885857.00 4501.00 21963.00 3282.00 34064.00 2639.00 137.62 1844.00 15415.00 4617.00 10457.00 44992.00
Oct-03 454.15 767306.00 3725.00 15444.00 25820.00 31820.00 2530.00 140.79 3475.00 12933.00 3869.00 8384.00 12460.00
Nov-03 394.00 772813.00 3173.00 13437.00 40100.00 31287.00 2323.00 131.72 0.00 10353.00 3369.00 8102.00 15635.00
Dec-03 385.83 558031.00 2867.00 11698.00 2048.00 26130.00 1976.00 139.48 0.00 9763.00 3159.00 7888.00 11554.00
Jan-04 415.48 646678.00 3070.00 11767.00 0.00 27073.00 2026.00 148.61 0.00 11062.00 3326.00 6721.15 14214.00
Feb-04 382.39 572135.00 2907.00 10909.00 383.00 23503.00 1864.00 143.10 0.00 9821.00 2832.00 6423.00 15371.00
Mar-04 409.59 594458.00 3163.00 11763.00 10630.00 23665.00 2212.00 148.41 0.00 10338.00 3152.00 7737.00 2426.00
Apr-04 421.24 690892.00 3449.00 12600.00 124967.00 26889.00 2603.00 148.28 0.00 11540.00 3330.00 8417.00 2806.00
May-04 451.85 725016.00 3722.00 16918.00 104866.00 12538.00 2181.00 147.12 3804.00 13422.00 3776.00 11291.00 6361.00
Jun-04 487.17 684432.00 3861.00 18515.00 27859.00 21851.00 2037.00 155.10 1830.00 15960.00 4223.00 15586.00 80871.00

131
Jul-04 590.46 837791.00 4761.00 21782.00 4324.00 44052.00 2766.00 136.88 3174.00 16792.00 4502.00 16502.00 105437.00
Aug-04 541.51 779435.00 4640.00 18874.00 0.00 47001.00 2767.00 149.72 1622.00 17280.00 5003.00 15861.00 97208.00
Sep-04 586.29 706102.00 4280.00 19582.00 10439.00 31819.00 2698.00 144.73 3436.00 15325.00 4431.00 17698.00 91514.00
Oct-04 454.56 634848.00 3873.00 15009.00 6362.00 53075.00 2472.00 135.89 1717.00 13022.00 3849.00 9428.00 58752.00
Nov-04 352.92 500045.00 3085.00 12315.00 0.00 30724.00 2059.00 134.50 0.00 10511.00 3548.00 7945.00 33782.00
Dec-04 343.25 481017.00 3103.00 11322.00 0.00 21122.00 2032.00 146.58 0.00 9939.00 3265.00 8474.00 29473.00
Jan-05 370.67 518985.00 3206.00 11474.00 6493.00 47310.00 2313.00 149.70 0.00 10469.00 3698.00 3393.00 38184.00
Feb-05 325.56 506620.00 2759.00 10834.00 31325.00 55753.00 2245.00 149.69 0.00 9266.00 3025.00 2849.00 55882.00
Mar-05 371.26 585866.00 2935.00 13188.00 31813.00 49231.00 2065.00 112.70 0.00 9527.00 2523.00 8104.00 38352.00
Apr-05 400.77 597553.00 3180.00 14346.00 24314.00 44193.00 2121.00 142.24 0.00 10557.00 3528.00 7667.00 65699.00
May-05 427.36 601925.00 3515.00 16553.00 22434.00 49986.00 2881.00 150.02 809.00 11906.00 3783.00 7952.00 76769.00
Jun-05 536.89 799809.00 4780.00 19528.00 7529.00 58746.00 3007.00 150.04 2518.00 16669.00 4861.00 11627.00 106216.00
Jul-05 513.41 751933.00 4476.00 19765.00 10286.00 50583.00 3253.00 153.83 3648.00 17629.00 4877.00 11382.00 109228.00
Aug-05 561.61 812403.00 4775.00 21157.00 7867.00 51894.00 2645.00 144.67 2873.00 19729.00 4899.00 16136.00 116087.00
Sep-05 552.47 776669.00 4688.00 19504.00 0.00 49229.00 2897.00 134.07 3173.00 18370.00 5283.00 12399.00 110113.00
Oct-05 450.16 609150.00 3850.00 14774.00 3287.00 27963.00 2531.00 139.87 2547.00 13972.00 4069.00 7867.00 79581.00
Nov-05 377.21 542122.00 2861.00 12346.00 10290.00 31904.00 2647.00 133.62 0.00 10931.00 3509.00 7516.00 47039.00
Dec-05 365.21 541034.00 3212.00 9058.00 19275.00 35626.00 2223.00 144.24 0.00 10176.00 3182.00 6985.00 44619.00
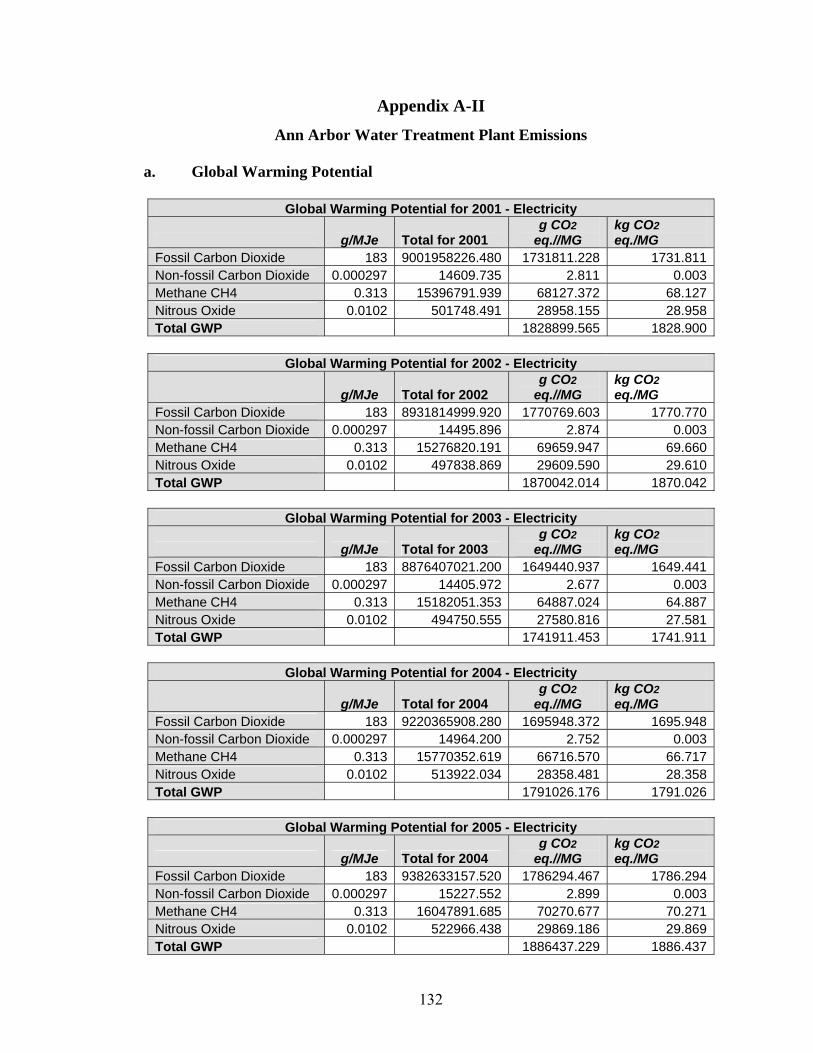
132
Appendix A-II
Ann Arbor Water Treatment Plant Emissions
a. Global Warming Potential
Global Warming Potential for 2001 - Electricity
g/MJe Total for 2001 g CO2
eq.//MG kg CO2 eq./MG
Fossil Carbon Dioxide 183 9001958226.480 1731811.228 1731.811Non-fossil Carbon Dioxide 0.000297 14609.735 2.811 0.003Methane CH4 0.313 15396791.939 68127.372 68.127Nitrous Oxide 0.0102 501748.491 28958.155 28.958Total GWP 1828899.565 1828.900
Global Warming Potential for 2002 - Electricity
g/MJe Total for 2002 g CO2
eq.//MG kg CO2 eq./MG
Fossil Carbon Dioxide 183 8931814999.920 1770769.603 1770.770Non-fossil Carbon Dioxide 0.000297 14495.896 2.874 0.003Methane CH4 0.313 15276820.191 69659.947 69.660Nitrous Oxide 0.0102 497838.869 29609.590 29.610Total GWP 1870042.014 1870.042
Global Warming Potential for 2003 - Electricity
g/MJe Total for 2003 g CO2
eq.//MG kg CO2 eq./MG
Fossil Carbon Dioxide 183 8876407021.200 1649440.937 1649.441Non-fossil Carbon Dioxide 0.000297 14405.972 2.677 0.003Methane CH4 0.313 15182051.353 64887.024 64.887Nitrous Oxide 0.0102 494750.555 27580.816 27.581Total GWP 1741911.453 1741.911
Global Warming Potential for 2004 - Electricity
g/MJe Total for 2004 g CO2
eq.//MG kg CO2 eq./MG
Fossil Carbon Dioxide 183 9220365908.280 1695948.372 1695.948Non-fossil Carbon Dioxide 0.000297 14964.200 2.752 0.003Methane CH4 0.313 15770352.619 66716.570 66.717Nitrous Oxide 0.0102 513922.034 28358.481 28.358Total GWP 1791026.176 1791.026
Global Warming Potential for 2005 - Electricity
g/MJe Total for 2004 g CO2
eq.//MG kg CO2 eq./MG
Fossil Carbon Dioxide 183 9382633157.520 1786294.467 1786.294Non-fossil Carbon Dioxide 0.000297 15227.552 2.899 0.003Methane CH4 0.313 16047891.685 70270.677 70.271Nitrous Oxide 0.0102 522966.438 29869.186 29.869Total GWP 1886437.229 1886.437
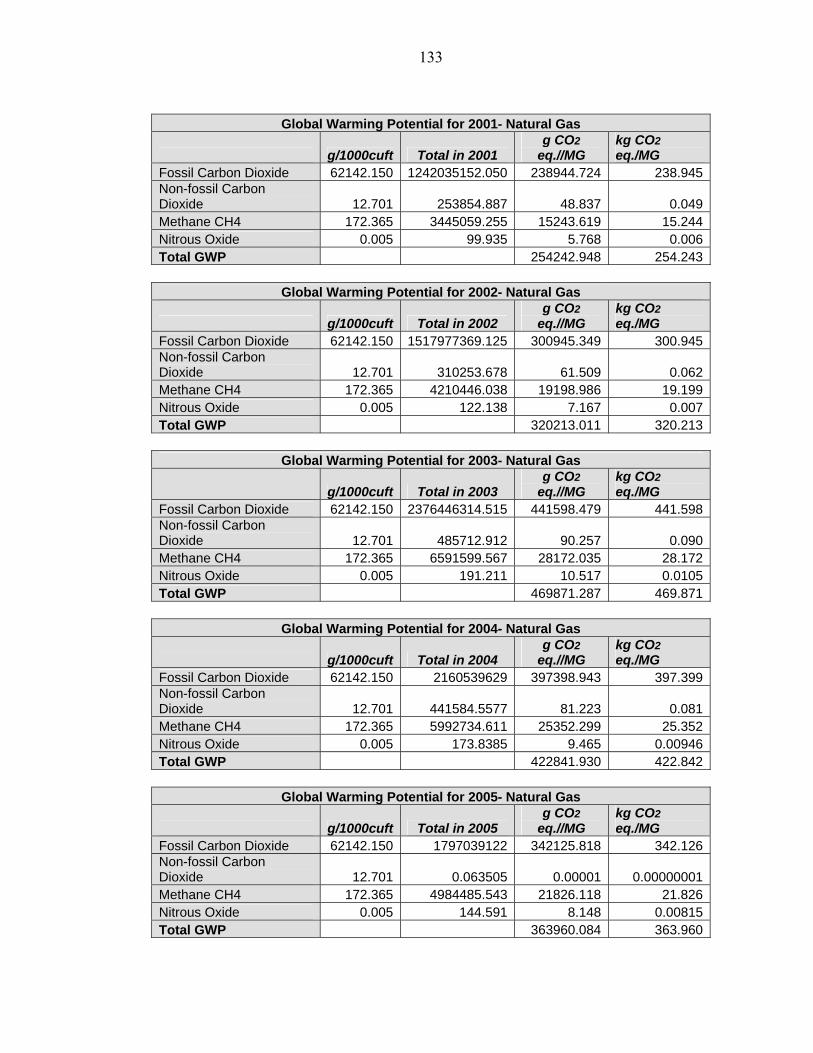
133
Global Warming Potential for 2001- Natural Gas
g/1000cuft Total in 2001 g CO2
eq.//MG kg CO2 eq./MG
Fossil Carbon Dioxide 62142.150 1242035152.050 238944.724 238.945Non-fossil Carbon Dioxide 12.701 253854.887 48.837 0.049Methane CH4 172.365 3445059.255 15243.619 15.244Nitrous Oxide 0.005 99.935 5.768 0.006Total GWP 254242.948 254.243
Global Warming Potential for 2002- Natural Gas
g/1000cuft Total in 2002 g CO2
eq.//MG kg CO2 eq./MG
Fossil Carbon Dioxide 62142.150 1517977369.125 300945.349 300.945Non-fossil Carbon Dioxide 12.701 310253.678 61.509 0.062Methane CH4 172.365 4210446.038 19198.986 19.199Nitrous Oxide 0.005 122.138 7.167 0.007Total GWP 320213.011 320.213
Global Warming Potential for 2003- Natural Gas
g/1000cuft Total in 2003 g CO2
eq.//MG kg CO2 eq./MG
Fossil Carbon Dioxide 62142.150 2376446314.515 441598.479 441.598Non-fossil Carbon Dioxide 12.701 485712.912 90.257 0.090Methane CH4 172.365 6591599.567 28172.035 28.172Nitrous Oxide 0.005 191.211 10.517 0.0105Total GWP 469871.287 469.871
Global Warming Potential for 2004- Natural Gas
g/1000cuft Total in 2004 g CO2
eq.//MG kg CO2 eq./MG
Fossil Carbon Dioxide 62142.150 2160539629 397398.943 397.399Non-fossil Carbon Dioxide 12.701 441584.5577 81.223 0.081Methane CH4 172.365 5992734.611 25352.299 25.352Nitrous Oxide 0.005 173.8385 9.465 0.00946Total GWP 422841.930 422.842
Global Warming Potential for 2005- Natural Gas
g/1000cuft Total in 2005 g CO2
eq.//MG kg CO2 eq./MG
Fossil Carbon Dioxide 62142.150 1797039122 342125.818 342.126Non-fossil Carbon Dioxide 12.701 0.063505 0.00001 0.00000001Methane CH4 172.365 4984485.543 21826.118 21.826Nitrous Oxide 0.005 144.591 8.148 0.00815Total GWP 363960.084 363.960

134
Global Warming Potential for 2001 - Chemicals
kg CO2 eq./Yr
kg CO2 eq./MG
Fossil Carbon Dioxide 5595299.99 1076.433 Methane CH4 219404.88 42.209 Nitrous Oxide 24006.80 4.618 Total GWP 1123.261
Global Warming Potential for 2002 - Chemicals
kg CO2 eq./Yr
kg CO2 eq./MG
Fossil Carbon Dioxide 5595299.99 1109.292 Methane CH4 219404.88 43.498 Nitrous Oxide 24006.80 4.759 Total GWP 1157.549
Global Warming Potential for 2003 - Chemicals
kg CO2 eq./Yr
kg CO2 eq./MG
Fossil Carbon Dioxide 5595299.99 1039.736 Methane CH4 219404.88 40.770 Nitrous Oxide 24006.80 4.461 Total GWP 1084.967
Global Warming Potential for 2004 - Chemicals
kg CO2 eq./Yr
kg CO2 eq./MG
Fossil Carbon Dioxide 5595299.99 1029.172 Methane CH4 219404.88 40.356 Nitrous Oxide 24006.80 4.416 Total GWP 1073.944
Global Warming Potential for 2005 - Chemicals
kg CO2 eq./Yr
kg CO2 eq./MG
Fossil Carbon Dioxide 5595299.99 1065.250 Methane CH4 219404.88 41.771 Nitrous Oxide 24006.80 4.570 Total GWP 1111.592

135
b. Eutrophication Potential
Eutrophication Potential for 2001- Electricity Atmospheric Aquatic
g/MJe Total in 2001 kg phosphate eq./MG g/MJe Total in 2001 kg phosphate eq./MG NOx 0.475 23365738.566 0.180 N
NH3 0.00035 17216.860 0.000 NH3 0.000151 7427.845 0.00111
NH4+ COD 0.004660 229230.193 0.002
NO3- NO3- 0.000047 2326.736 0.00004
PO43- PO43- 0.000000002 0.091 0.00000004 P P
Total 0.180 0.00336 Eutrophication Potential for 2002- Electricity
Atmospheric Aquatic g/MJe Total in 2002 kg phosphate eq./MG g/MJe Total in 2002 kg phosphate eq./MG
NOx 0.475 23183672.814 0.184 N
NH3 0.00035 17082.706 0.000 NH3 0.000151 7369.968 0.00114
NH4+ COD 0.004660 227444.032 0.00225
NO3- NO3- 0.0000473 2308.606 0.00005
PO43- PO43- 0.000000002 0.090 0.00000004 P P
Total 0.184 0.00344 Eutrophication Potential for 2003- Electricity
Atmospheric Aquatic g/MJe Total in 2003 kg phosphate eq./MG g/MJe Total in 2003 kg phosphate eq./MG
NOx 0.475 23039854.290 0.171 N
NH3 0.00035 16976.735 0.000 NH3 0.000151 7324.248 0.00106
NH4+ COD 0.00466 226033.097 0.00210
NO3- NO3- 0.0000473 2294.284 0.00004
PO43- PO43- 0.000000002 0.090 0.00000 P P
Total 0.172 0.00320 Eutrophication Potential for 2004- Electricity
Atmospheric Aquatic g/MJe Total in 2004 kg phosphate eq./MG g/MJe Total in 2004 kg phosphate eq./MG
NOx 0.475 21956553.900 0.162 N
NH3 0.00035 16178.513 0.000 NH3 0.000151 6979.873 0.0010
NH4+ COD 0.00466 215405.350 0.0020
NO3- NO3- 0.0000473 2186.411 0.00004
PO43- PO43- 0.000000002 0.086 0.00000004 P P
Total 0.162 0.00302

136
Eutrophication Potential for 2005- Electricity Atmospheric Aquatic
g/MJe Total in 2005 kg phosphate eq./MG g/MJe Total in 2005 kg phosphate eq./MG NOx 0.475 22342962.600 0.170 N
NH3 0.00035 16463.236 0.000 NH3 0.000151 6979.873 0.0010
NH4+ COD 0.00466 215405.350 0.0021
NO3- NO3- 0.0000473 2186.411 0.00004
PO43- PO43- 0.000000002 0.086 0.00000004 P P
Total 0.171 0.00313
Eutrophication Potential for 2001- Natural Gas Atmospheric Aquatic
g/1000 cuft. Total in 2001
kg phosphate eq./MG g/1000 cuft. Total in 2001
kg phosphate eq./MG
NOx 231.332 4623632.684 0.036 N
NH3 1.361 27202.307 0.00063 NH3 0.027 539.649 0.0000810
NH4+ COD 19.504 389826.448 0.003750
NO3- NO3- 0.000082 1.639 0.0000000315
PO43- PO43- 0.005 99.935 0.0000458 P P
Total 0.036 0.00388 Eutrophication Potential for 2002- Natural Gas
Atmospheric Aquatic
g/1000 cuft. Total in 2002
kg phosphate eq./MG g/1000 cuft. Total in 2002
kg phosphate eq./MG
NOx 231.332 5650862.430 0.146 N
NH3 1.361 33245.828 0.00231 NH3 0.027 659.543 0.0000431
NH4+ COD 19.504 476433.960 0.002078
NO3- NO3- 0.000082 2.003 0.0000000397
PO43- PO43- 0.005 122.138 0.0000242 P P
Total 0.148 0.00215 Eutrophication Potential for 2003- Natural Gas
Atmospheric Aquatic
g/1000 cuft. Total in 2003
kg phosphate eq./MG g/1000 cuft. Total in 2003
kg phosphate eq./MG
NOx 231.332 8846621.477 0.214 N
NH3 1.361 52047.498 0.00339 NH3 0.027 1032.537 0.000063
NH4+ COD 19.504 745873.918 0.00305
NO3- NO3- 0.000082 3.136 0.000000058
PO43- PO43- 0.005 191.211 0.0000355 P P
Total 0.217 0.00315

137
Eutrophication Potential for 2004- Natural Gas Atmospheric Aquatic
g/1000 cuft. Total in 2004 kg phosphate eq./MG
g/1000 cuft. Total in 2004
kg phosphate eq./MG
NOx 231.332 8042881.576 0.192 N
NH3 1.361 47318.840 0.00305 NH3 0.027 938.728 0.000057
NH4+ COD 19.504 678109.221 0.002744
NO3- NO3- 0.00008
2 2.851 0.000000052
PO43- PO43- 0.005 173.839 0.0000320
P P Total 0.195 0.00283
Eutrophication Potential for 2005- Natural Gas Atmospheric Aquatic
g/1000 cuft. Total in 2005 kg phosphate eq./MG
g/1000 cuft. Total in 2005
kg phosphate eq./MG
NOx 231.332 6689705.042 0.166 N
NH3 1.361 39357.670 0.00262 NH3 0.027 780.791 0.0000491
NH4+ COD 19.504 564020.573 0.002362
NO3- NO3- 0.00008
2 2.371 0.0000000451
PO43- PO43- 0.005 144.591 0.0000275 P P
Total 0.168 0.00244
Eutrophication Potential for 2001- Chemicals Atmospheric Aquatic
g N/Yr g N/MG g N/Yr g N/MG NOx 23916 4.60 N 75 0.0144 NH3 761 0.15 NH3 3.26 0.0006
NH4+ COD 840 0.1616 NO3
- NO3- 89 0.0171
PO43- PO4
3- 8 0.0015 P P
Total 4.75 0.20 Eutrophication Potential for 2002- Chemicals Atmospheric Aquatic
g N/Yr g N/MG g N/Yr g N/MG NOx 23916 4.74 N 75 0.0148 NH3 761 0.15 NH3 3.26 0.0006
NH4+ COD 840 0.1666 NO3
- NO3- 89 0.0176
PO43- PO4
3- 8 0.0015 P P
Total 4.89 0.20

138
Eutrophication Potential for 2003- Chemicals Atmospheric Aquatic
g N/Yr g N/MG g N/Yr g N/MG NOx 23916 4.44 N 75 0.0139 NH3 761 0.14 NH3 3 0.0006
NH4+ COD 840 0.1561 NO3
- NO3- 89 0.0165
PO43- PO4
3- 8 0.0014 P P
Total 4.59 0.19
Eutrophication Potential for 2004- Chemicals Atmospheric Aquatic
g N/Yr g N/MG g N/Yr g N/MG NOx 23916 4.40 N 75 0.0137 NH3 761 0.14 NH3 3 0.0006
NH4+ COD 840 0.1545 NO3
- NO3- 89 0.0163
PO43- PO4
3- 8 0.0014 P P
Total 4.54 0.19
Eutrophication Potential for 2005- Chemicals Atmospheric Aquatic
g N/Yr g N/MG g N/Yr g N/MG NOx 23916 4.55 N 75 0.0142 NH3 761 0.14 NH3 3 0.0006
NH4+ COD 840 0.1599 NO3
- NO3- 89 0.0169
PO43- PO4
3- 8 0.0014 P P
Total 4.70 0.19

139
c. Acidification Potential
Acidification Potential for 2001- Electricity g/MJe Total in 2001 moles of H+ eq./MG SO2 38.042 1871310843.081 360.006 HCl 3.356 165086961.106 31.760 NOx 19.019 935564172.183 179.985 NH3 0.033 1644037.961 0.316 Total 572.067
Acidification Potential for 2002- Electricity g/MJe Total in 2002 moles of H+ eq./MG SO2 38.042 1856729595.632 368.104 HCl 3.3560 163800604.091 32.474 NOx 19.019 928274259.473 184.034 NH3 0.033 1631227.623 0.323 Total 584.936
Acidification Potential for 2003- Electricity g/MJe Total in 2003 moles of H+ eq./MG SO2 38.042 1845211485 342.883 HCl 3.356 162784476.9 30.249 NOx 19.019 922515765.8 171.425 NH3 0.033 1621108.4 0.301 Total 544.858
Acidification Potential for 2004- Electricity g/MJe Total in 2004 moles of H+ eq./MG SO2 38.042 1758452328.554 323.441 HCl 3.356 155130587.868 28.534 NOx 19.019 879140418.156 161.705 NH3 0.033 1544886.245 0.284 Total 513.964
Acidification Potential for 2005- Electricity g/MJe Total in 2005 moles of H+ eq./MG SO2 38.042 1789398955.305 340.671 HCl 3.356 157860697.933 30.054 NOx 19.019 894612222.504 170.319 NH3 0.033 1572074.367 0.299 Total 541.344

140
Acidification Potential for 2001- Natural Gas g/MJe Total in 2001 moles of H+ eq./MG SO2 893.577 178599.235 1.229 HCl 0.044 8.79428 0.000097 NOx 231.332 46236.32684 0.251 NH3 1.361 272.02307 0.00352 Total 1.483
Acidification Potential for 2002- Natural Gas g/1000 cuft Total in 2002 moles of H+ eq./MG SO2 893.577 218278.5217 2.198 HCl 0.044 10.7481 0.000173 NOx 231.332 56508.6243 0.449 NH3 1.361 332.458275 0.0063 Total 2.653
Acidification Potential for 2003- Natural Gas g/1000 cuft Total in 2003 moles of H+ eq./MG SO2 893.577 341722.6099 3.225 HCl 0.044 16.826524 0.000254 NOx 231.332 88466.21477 0.658 NH3 1.361 520.474981 0.0092 Total 3.893
Acidification Potential for 2004- Natural Gas g/1000 cuft Total in 2004 moles of H+ eq./MG SO2 893.577 310676.1706 2.902 HCl 0.044 15.297788 0.000229 NOx 231.332 80428.81576 0.592 NH3 1.361 473.188397 0.0083 Total 3.503
Acidification Potential for 2005- Natural Gas g/1000 cuft Total in 2005 moles of H+ eq./MG SO2 893.577 258406.384 2.499 HCl 0.044 12.724008 0.000197 NOx 231.332 66897.05042 0.510 NH3 1.361 393.576702 0.0072 Total 3.016

141
Acidification Potential for 2001- Chemicals
moles H+
eq./Yr moles H+ eq./MGSO2 250959 48HCl 36391 7.00NOx 195174 38NH3 132834 25.55Total 118
Acidification Potential for 2002- Chemicals
moles H+
eq./Yr moles H+ eq./MGSO2 250959 50HCl 36391 7.21NOx 195174 39NH3 132834 26.33Total 122
Acidification Potential for 2003- Chemicals
moles H+
eq./Yr moles H+ eq./MGSO2 250959 47HCl 36391 6.76NOx 195174 36NH3 132834 24.68Total 114
Acidification Potential for 2004- Chemicals
moles H+
eq./Yr moles H+ eq./MGSO2 250959 46HCl 36391 6.69NOx 195174 36NH3 132834 24.43Total 113
Acidification Potential for 2005- Chemicals
moles H+
eq./Yr moles H+ eq./MGSO2 250959 48HCl 36391 6.93NOx 195174 37NH3 132834 25.29Total 117

142
Appendix B-I
Ann Arbor Wastewater Treatment Plant Energy Consumption
a. Ann Arbor Wastewater Treatment Plant - Total Flow
Date Total Flow
Month/Year MGD MG MG/Yr Jan-00 17.10 530.20 6841.90Feb-00 18.21 509.90 Mar-00 17.36 538.30 Apr-00 18.44 553.10 May-00 19.41 601.60 Jun-00 20.73 622.00 Jul-00 19.27 597.40 Aug-00 19.77 612.80 Sep-00 20.07 602.00 Oct-00 18.95 587.50 Nov-00 17.96 538.80 Dec-00 17.69 548.30 Jan-01 18.50 573.40 7093.30Feb-01 22.91 641.50 Mar-01 19.36 600.30 Apr-01 19.84 595.20 May-01 19.44 602.70 Jun-01 19.75 592.50 Jul-01 17.75 550.40 Aug-01 18.26 566.20 Sep-01 18.74 562.20 Oct-01 21.58 668.90 Nov-01 18.59 557.60 Dec-01 18.79 582.40 Jan-02 17.89 554.50 6903.40Feb-02 21.94 614.40 Mar-02 20.59 638.30 Apr-02 21.59 647.70 May-02 19.32 599.00 Jun-02 18.16 544.80 Jul-02 18.07 560.20 Aug-02 18.37 569.50 Sep-02 18.98 569.40 Oct-02 18.08 560.40 Nov-02 17.87 536.20 Dec-02 16.42 509.00 Jan-03 16.64 515.70 6582.60Feb-03 16.22 454.10 Mar-03 18.27 566.30 Apr-03 19.89 596.80

143
May-03 19.47 603.60 Jun-03 18.00 539.90 Jul-03 17.66 547.50 Aug-03 18.20 564.10 Sep-03 18.85 565.40 Oct-03 17.61 545.80 Nov-03 18.22 546.70 Dec-03 17.31 536.70 Jan-04 17.46 541.20 6746.80Feb-04 17.82 499.00 Mar-04 21.28 659.80 Apr-04 18.31 549.30 May-04 21.80 675.80 Jun-04 19.48 584.40 Jul-04 17.70 548.70 Aug-04 17.85 553.50 Sep-04 18.19 545.80 Oct-04 17.27 535.50 Nov-04 17.13 514.00 Dec-04 17.41 539.80 Jan-05 19.88 616.30 6696.80Feb-05 20.20 565.50 Mar-05 19.57 606.60 Apr-05 18.28 548.40 May-05 16.97 526.20 Jun-05 18.07 542.00 Jul-05 19.38 600.80 Aug-05 17.80 551.90 Sep-05 18.29 548.70 Oct-05 17.43 540.30 Nov-05 18.10 543.10 Dec-05 16.35 507.00

144
b. Ann Arbor Wastewater Treatment Plant – Electricity Consumption
Date Total Flow Electricity Supplied to the Plant Generator Electrical Energy Electrical Energy
Electricity used per
North Feed South Feed Total Fuel for WWTP Operation for WWTP Operation MG WW Treated
Month/Yr MG kWh kWh kWh kWh gallons kWh kWh/MG GJ GJ/Yr GJ/MG GJ/MG-
Yr Jan-00 530.20 851575.20 352896.20 1204471.40 1868.60 218.84 1206340.00 2275.25 4342.82 49416.35 8.19 7.22 Feb-00 509.90 897338.00 190336.90 1087674.90 0.00 0.00 1087674.90 2133.11 3915.63 7.68 Mar-00 538.30 770771.20 394930.90 1165702.10 0.00 0.00 1165702.10 2165.52 4196.53 7.80 Apr-00 553.10 367093.40 751948.10 1119041.50 0.00 0.00 1119041.50 2023.22 4028.55 7.28 May-00 601.60 366910.70 722520.90 1089431.60 7929.80 4.20 1097361.40 1824.07 3950.50 6.57 Jun-00 622.00 413479.40 667020.90 1080500.30 0.00 0.00 1080500.30 1737.14 3889.80 6.25 Jul-00 597.40 367896.80 677903.70 1045800.50 0.00 0.00 1045800.50 1750.59 3764.88 6.30 Aug-00 612.80 395631.80 658836.00 1054467.80 0.00 0.00 1054467.80 1720.74 3796.08 6.19 Sep-00 602.00 354374.20 726643.20 1081017.40 0.00 0.00 1081017.40 1795.71 3891.66 6.46 Oct-00 587.50 413235.40 784282.10 1197517.50 0.00 0.00 1197517.50 2038.33 4311.06 7.34 Nov-00 538.80 413030.40 824194.00 1237224.40 0.00 0.00 1237224.40 2296.26 4454.01 8.27 Dec-00 548.30 474250.50 879866.40 1354116.90 0.00 0.00 1354116.90 2469.66 4874.82 8.89 Jan-01 573.40 825544.40 488499.30 1314043.70 0.00 0.00 1314043.70 2291.67 4730.56 54298.94 8.25 7.65 Feb-01 641.50 928460.70 307567.70 1236028.40 0.00 0.00 1236028.40 1926.78 4449.70 6.94 Mar-01 600.30 531627.70 795832.60 1327460.30 0.00 0.00 1327460.30 2211.33 4778.86 7.96 Apr-01 595.20 437623.30 840822.80 1278446.10 0.00 0.00 1278446.10 2147.93 4602.41 7.73 May-01 602.70 425808.00 783940.10 1209748.10 93.50 0.00 1209841.60 2007.37 4355.43 7.23 Jun-01 592.50 520619.20 638605.60 1159224.80 1157.90 0.00 1160382.70 1958.45 4177.38 7.05 Jul-01 550.40 471705.90 767905.70 1239611.60 0.00 0.00 1239611.60 2252.20 4462.60 8.11 Aug-01 566.20 913089.70 305137.40 1218227.10 0.00 0.00 1218227.10 2151.58 4385.62 7.75 Sep-01 562.20 563819.30 647346.20 1211165.50 0.00 0.00 1211165.50 2154.33 4360.20 7.76

145
Oct-01 668.90 453685.90 858569.70 1312255.60 0.00 0.00 1312255.60 1961.81 4724.12 7.06 Nov-01 557.60 399129.40 865054.10 1264183.50 0.00 0.00 1264183.50 2267.19 4551.06 8.16 Dec-01 582.40 624784.60 686608.00 1311392.60 0.00 0.00 1311392.60 2251.70 4721.01 8.11 Jan-02 554.50 896333.00 377002.30 1273335.30 0.00 0.00 1273335.30 2296.37 4584.01 52497.91 8.27 7.60 Feb-02 614.40 871113.80 328336.50 1199450.30 0.00 0.00 1199450.30 1952.23 4318.02 7.03 Mar-02 638.30 728696.60 584737.10 1313433.70 0.00 0.00 1313433.70 2057.71 4728.36 7.41 Apr-02 647.70 549736.50 736013.70 1285750.20 0.00 0.00 1285750.20 1985.10 4628.70 7.15 May-02 599.00 393921.80 742045.70 1135967.50 0.00 0.00 1135967.50 1896.44 4089.48 6.83 Jun-02 544.80 497282.80 591140.00 1088422.80 0.00 0.00 1088422.80 1997.84 3918.32 7.19 Jul-02 560.20 507489.20 609668.50 1117157.70 0.00 0.00 1117157.70 1994.21 4021.77 7.18 Aug-02 569.50 838739.80 308559.60 1147299.40 0.00 0.00 1147299.40 2014.57 4130.28 7.25 Sep-02 569.40 951660.70 248845.70 1200506.40 0.00 0.00 1200506.40 2108.37 4321.82 7.59 Oct-02 560.40 944484.80 324424.60 1268909.40 0.00 0.00 1268909.40 2264.29 4568.07 8.15 Nov-02 536.20 930297.10 334490.60 1264787.70 0.00 0.00 1264787.70 2358.80 4553.24 8.49 Dec-02 509.00 509738.50 777993.60 1287732.10 0.00 0.00 1287732.10 2529.93 4635.84 9.11 Jan-03 515.70 429921.30 903949.20 1333870.50 0.00 0.00 1333870.50 2586.52 4801.93 53229.44 9.31 8.09 Feb-03 454.10 787367.90 382775.30 1170143.20 0.00 0.00 1170143.20 2576.84 4212.52 9.28 Mar-03 566.30 501816.90 852791.00 1354607.90 0.00 0.00 1354607.90 2392.03 4876.59 8.61 Apr-03 596.80 832947.80 397420.70 1230368.50 0.00 0.00 1230368.50 2061.61 4429.33 7.42 May-03 603.60 916891.50 308130.00 1225021.50 3330.00 2.00 1228351.50 2035.04 4422.07 7.33 Jun-03 539.90 406072.80 779570.20 1185643.00 0.00 0.00 1185643.00 2196.04 4268.31 7.91 Jul-03 547.50 807215.10 382867.70 1190082.80 0.00 0.00 1190082.80 2173.67 4284.30 7.83 Aug-03 564.10 589241.60 575177.80 1164419.40 13935.00 484.80 1178354.40 2088.91 4242.08 7.52 Sep-03 565.40 514463.00 700234.40 1214697.40 0.00 0.00 1214697.40 2148.39 4372.91 7.73 Oct-03 545.80 475784.10 774807.60 1250591.70 0.00 0.00 1250591.70 2291.30 4502.13 8.25 Nov-03 546.70 390824.20 817718.90 1208543.10 0.00 0.00 1208543.10 2210.61 4350.76 7.96 Dec-03 536.70 412269.00 828433.30 1240702.30 0.00 0.00 1240702.30 2311.72 4466.53 8.32

146
Jan-04 541.20 478306.70 768741.90 1247048.60 379.00 0.00 1247427.60 2304.93 4490.74 52095.54 8.30 7.72 Feb-04 499.00 773573.60 369940.00 1143513.60 0.00 0.00 1143513.60 2291.61 4116.65 8.25 Mar-04 659.80 874384.60 361036.30 1235420.90 0.00 0.00 1235420.90 1872.42 4447.52 6.74 Apr-04 549.30 750259.30 442218.20 1192477.50 650.00 5.00 1193127.50 2172.09 4295.26 7.82 May-04 675.80 553375.10 671067.90 1224443.00 0.00 0.00 1224443.00 1811.84 4407.99 6.52 Jun-04 584.40 357031.50 822705.80 1179737.30 39124.00 0.00 1218861.30 2085.66 4387.90 7.51 Jul-04 548.70 414128.70 752823.20 1166951.90 49.70 117.23 1167001.60 2126.85 4201.21 7.66 Aug-04 553.50 408497.80 817818.80 1226316.60 377.00 0.00 1226693.60 2216.25 4416.10 7.98 Sep-04 545.80 464986.10 757133.10 1222119.20 0.00 0.00 1222119.20 2239.13 4399.63 8.06 Oct-04 535.50 879138.60 341550.70 1220689.30 0.00 0.00 1220689.30 2279.53 4394.48 8.21 Nov-04 514.00 863229.10 279737.40 1142966.50 0.00 0.00 1142966.50 2223.67 4114.68 8.01 Dec-04 539.80 729420.50 499299.70 1228720.20 0.00 0.00 1228720.20 2276.25 4423.39 8.19 Jan-05 616.30 705500.80 283324.10 988824.90 0.00 0.00 988824.90 1604.45 3559.77 5.78 Jul-05 600.80 665157.70 210262.80 875420.50 0.00 0.00 875420.50 1457.09 3151.51 5.25 Aug-05 551.90 591410.40 263935.70 855346.10 0.00 0.00 855346.10 1549.82 3079.25 5.58 Sep-05 548.70 282014.40 572570.00 854584.40 0.00 0.00 854584.40 1557.47 3076.50 5.61 Oct-05 540.30 331913.00 580927.60 912840.60 0.00 0.00 912840.60 1689.51 3286.23 6.08 Nov-05 543.10 667434.50 217532.20 884966.70 0.00 0.00 884966.70 1629.47 3185.88 5.87 Dec-05 507.00 733134.90 190362.40 923497.30 0.00 0.00 923497.30 1821.49 3324.59 6.56

147
c. Ann Arbor Wastewater Treatment Plant – Natural Gas Consumption
Date Natural Gas Consumption Boilers Retention Bldg Admin Bldg Total
Month/Year CCF CCF CCF Cuft Cuft/MG GJ GJ/Yr Jul-02 570.00 57000.00 101.75 69.76 Aug-02 12.00 1200.00 2.11 1.47 Sep-02 2.00 200.00 0.35 0.24 Oct-02 19165.00 1916500.00 3419.88 2345.63 Nov-02 23372.00 2337200.00 4358.82 2860.54 Dec-02 27246.60 2724660.00 5352.97 3334.75 Jan-03 33772.00 3377200.00 6548.77 4133.41 24660.43Feb-03 28407.00 2358.00 2498.00 3326300.00 7325.04 4071.11 Mar-03 27075.00 2047.00 2122.00 3124400.00 5517.22 3824.00 Apr-03 18814.00 0.00 1201.00 2001500.00 3353.72 2449.67 May-03 125.00 0.00 207.00 33200.00 55.00 40.63 Jun-03 68.00 0.00 106.00 17400.00 32.23 21.30 Jul-03 57.00 0.00 103.00 16000.00 29.22 19.58 Aug-03 87.00 0.00 103.00 19000.00 33.68 23.25 Sep-03 449.00 0.00 288.00 73700.00 130.35 90.20 Oct-03 19752.00 0.00 1733.00 2148500.00 3936.42 2629.58 Nov-03 13766.00 0.00 4067.00 1783300.00 3261.94 2182.61 Dec-03 36908.00 0.00 5375.00 4228300.00 7878.33 5175.08 Jan-04 39988.00 2149.90 5011.00 4714890.00 8711.92 5770.63 30802.53Feb-04 36077.00 2565.00 3804.00 4244600.00 8506.21 5195.03 Mar-04 33125.00 0.00 4091.00 3721600.00 5640.50 4554.92 Apr-04 26860.00 0.00 2592.00 2945200.00 5361.73 3604.68 May-04 10038.00 0.00 895.00 1093300.00 1617.79 1338.11 Jun-04 164.00 0.00 95.00 25900.00 44.32 31.70 Jul-04 85.00 0.00 86.00 17100.00 31.16 20.93 Aug-04 108.00 0.00 85.00 19300.00 34.87 23.62 Sep-04 340.10 0.00 368.00 70810.00 129.74 86.67

148
Oct-04 11723.00 0.00 2357.00 1408000.00 2629.32 1723.27 Nov-04 25620.00 0.00 3954.00 2957400.00 5753.70 3619.61 Dec-04 33772.00 0.00 5719.00 3949100.00 7315.86 4833.37 Jan-05 36163.00 0.00 6055.50 4221850.00 6850.32 5167.19 Jul-05 29.00 0.00 72.00 10100.00 16.81 12.36 Aug-05 31.00 0.00 69.00 10000.00 18.12 12.24 Sep-05 30.00 0.00 134.50 16450.00 29.98 20.13 Oct-05 9504.00 0.00 1962.60 1146660.00 2122.27 1403.42 Nov-05 17527.00 0.00 2180.00 1970700.00 3628.61 2411.97 Dec-05 29262.00 0.00 3517.00 3277900.00 6465.29 4011.87

149
d. Ann Arbor Wastewater Treatment Plant – Chemicals Utilized for Treatment
Date Ferric Chloride
(FeCl3-) Energy for producing Lime (CaO)
Total FeCl3- FeCl3- Total
Lbs Lbs/M
G kWh Lbs Lbs/MG Jan-00 261616.04 493.43 13080.80 338868.66 639.13Feb-00 265274.82 520.25 13263.74 369506.47 724.66Mar-00 219331.94 407.45 10966.60 357256.89 663.68Apr-00 95684.52 173.00 4784.23 215043.38 388.80May-00 80720.96 134.18 4036.05 208175.23 346.04Jun-00 79087.83 127.15 3954.39 220786.18 354.96Jul-00 74510.64 124.72 3725.53 153599.76 257.11Aug-00 69681.63 113.71 3484.08 213390.19 348.22Sep-00 73221.90 121.63 3661.10 183236.76 304.38Oct-00 73165.71 124.54 3658.29 230478.51 392.30Nov-00 74514.38 138.30 3725.72 204200.91 378.99Dec-00 170069.88 310.18 8503.49 718453.01 1310.33Jan-01 227295.84 396.40 11364.79 386363.73 673.81Feb-01 162933.29 253.99 8146.66 332030.94 517.59Mar-01 255883.35 426.26 12794.17 311642.84 519.15Apr-01 192964.05 324.20 9648.20 369897.54 621.47May-01 35911.71 59.58 1795.59 222411.46 369.03Jun-01 32004.36 54.02 1600.22 172947.23 291.89Jul-01 40081.29 72.82 2004.06 227603.76 413.52Aug-01 62700.46 110.74 3135.02 177862.15 314.13Sep-01 6364.07 11.32 318.20 247964.09 441.06Oct-01 53779.47 80.40 2688.97 243917.57 364.65Nov-01 59320.85 106.39 2966.04 222290.70 398.66Dec-01 105616.76 181.35 5280.84 269070.89 462.00Jan-02 138653.34 250.05 6932.67 269457.98 485.95

150
Feb-02 162934.23 265.19 8146.71 308489.31 502.10Mar-02 112296.15 175.93 5614.81 284818.13 446.21Apr-02 161464.31 249.29 8073.22 360116.38 555.99May-02 42958.30 71.72 2147.92 201146.00 335.80Jun-02 29525.86 54.20 1476.29 163866.26 300.78Jul-02 31989.39 57.10 1599.47 167300.52 298.64Aug-02 45784.11 80.39 2289.21 191918.41 336.99Sep-02 62604.92 109.95 3130.25 332704.98 584.31Oct-02 57273.85 102.20 2863.69 246310.80 439.53Nov-02 45824.18 85.46 2291.21 265027.67 494.27Dec-02 116378.53 228.64 5818.93 289708.05 569.17Jan-03 124325.17 241.08 6216.26 298025.26 577.90Feb-03 105556.72 232.45 5277.84 270968.00 596.71Mar-03 134122.42 236.84 6706.12 309842.96 547.14Apr-03 158333.25 265.30 7916.66 289947.38 485.84May-03 113166.29 187.49 5658.31 240224.93 397.99Jun-03 45750.65 84.74 2287.53 313665.56 580.97Jul-03 57705.00 105.40 2885.25 201206.48 367.50Aug-03 59562.12 105.59 2978.11 185329.40 328.54Sep-03 60819.86 107.57 3040.99 211500.85 374.07Oct-03 41640.43 76.29 2082.02 170943.24 313.20Nov-03 43134.64 78.90 2156.73 213686.54 390.87Dec-03 125837.63 234.47 6291.88 206236.21 384.27Jan-04 92163.75 170.30 4608.19 262106.41 484.31Feb-04 123451.84 247.40 6172.59 300064.40 601.33Mar-04 130390.64 197.62 6519.53 351255.11 532.37Apr-04 122436.94 222.90 6121.85 376131.63 684.75May-04 62878.08 93.04 3143.90 205233.78 303.69Jun-04 97291.23 166.48 4864.56 269613.05 461.35Jul-04 48464.25 88.33 2423.21 120883.00 220.31Aug-04 47554.47 85.92 2377.72 184805.80 333.89Sep-04 46957.75 86.03 2347.89 220984.98 404.88

151
Oct-04 45255.31 84.51 2262.77 157890.18 294.85Nov-04 7627.56 14.84 381.38 153432.17 298.51Dec-04 88105.35 163.22 4405.27 294286.98 545.18Jan-05 159446.40 258.72 7972.32 424594.58 688.94Feb-05 144420.45 255.39 7221.02 411546.07 727.76Mar-05 156337.48 257.73 7816.87 394850.44 650.92Apr-05 159172.01 290.25 7958.60 326994.40 596.27May-05 84929.40 161.40 4246.47 308673.78 586.61Jun-05 34026.60 62.78 1701.33 235648.55 434.78Jul-05 66539.87 110.75 3326.99 230048.53 382.90Aug-05 40833.90 73.99 2041.69 169123.14 306.44Sep-05 73731.34 134.37 3686.57 227882.10 415.31Oct-05 0.00 0.00 254992.46 471.95Nov-05 63177.46 474.66 3158.87 256810.87 1929.46Dec-05 75576.38 149.07 3778.82 245698.19 484.61

152
e. Ann Arbor Wastewater Treatment Plant – Sludge Disposal
For January 2000, the volume of sludge for landfill before compression was 3581.49 kGal and the weight of the wet cake (2338.61
metric tons) and dry solids (603.60 metric tons) together after compression turned out to be 2942.21 metric tons, thus the ratio of
weight transported per kGal of sludge = 0.82 metric tons/kGal. Compared to this the volume of sludge for land-application in March
2000 was 206.00 kGal and the corresponding weight to be transported was 782.24 metric tons (including sludge, water, solids), thus
the ratio of weight transported per kGal of sludge = 3.79 metric tons/kGal. The same pattern can be observed for other months as
well.
Date Total Sludge Produced Total Hauled to and from Landfill
Volume Weight To From Total Diesel
Month/Yr kGal metric tons metric tons/yr
metric tons
metric tons
metric tons metric tons/yr metric ton-miles metric ton-miles/yr Gallons Gallons/yr
Jan-00 3581.49 2942.21 111534.07 2958.21 16.00 2974.21 11635.52 237936.60 930841.48 6305.32 24667.30 Feb-00 3602.20 3186.68 3202.68 16.00 3218.68 257494.39 6823.60 Mar-00 3997.80 3862.19 3095.95 16.00 3111.95 248956.18 6597.34 Apr-00 3200.30 10803.95 451.91 16.00 467.91 37432.67 991.97 May-00 3974.10 15118.88 0.00 0.00 0.00 0.00 0.00 Jun-00 3352.30 12737.14 0.00 0.00 0.00 0.00 0.00 Jul-00 2517.00 9577.04 0.00 0.00 0.00 0.00 0.00 Aug-00 3333.40 12689.21 0.00 0.00 0.00 0.00 0.00 Sep-00 3199.40 12179.44 0.00 0.00 0.00 0.00 0.00 Oct-00 3450.20 13131.84 0.00 0.00 0.00 0.00 0.00 Nov-00 3095.10 11774.29 0.00 0.00 0.00 0.00 0.00 Dec-00 2560.90 3531.20 1846.77 16.00 1862.77 149021.63 3949.07 Jan-01 3261.90 2934.34 100942.90 2950.34 16.00 2966.34 12332.45 237307.30 986595.82 6288.64 26144.79 Feb-01 2978.49 2521.62 2537.62 16.00 2553.62 204289.27 5413.67

153
Mar-01 3350.80 3241.52 3257.52 16.00 3273.52 261881.27 6939.85 Apr-01 3410.10 7367.59 2288.11 16.00 2304.11 184328.64 4884.71 May-01 3318.60 12626.14 0.00 0.00 0.00 0.00 0.00 Jun-01 2682.20 10198.14 0.00 0.00 0.00 0.00 0.00 Jul-01 2881.00 10956.91 0.00 0.00 0.00 0.00 0.00 Aug-01 2694.00 10253.17 0.00 0.00 0.00 0.00 0.00 Sep-01 3014.10 11454.29 0.00 0.00 0.00 0.00 0.00 Oct-01 3117.40 11860.24 0.00 0.00 0.00 0.00 0.00 Nov-01 2965.10 11253.62 0.00 0.00 0.00 0.00 0.00 Dec-01 2915.70 6275.32 1218.87 16.00 1234.87 98789.34 2617.92 Jan-02 2773.00 2482.31 98488.85 2498.31 16.00 2514.31 13498.99 201145.00 1079919.00 5330.34 28617.85 Feb-02 3212.70 3443.77 3459.77 16.00 3475.77 278061.55 7368.63 Mar-02 2929.60 2619.87 2635.87 16.00 2651.87 212149.24 5621.95 Apr-02 3102.25 4286.17 2930.84 16.00 2946.84 235747.08 6247.30 May-02 3222.11 11811.48 192.54 16.00 208.54 16683.48 442.11 Jun-02 2498.91 9506.36 0.00 0.00 0.00 0.00 0.00 Jul-02 2496.69 9473.30 0.00 0.00 0.00 0.00 0.00 Aug-02 2684.20 10209.28 0.00 0.00 0.00 0.00 0.00 Sep-02 3802.30 14453.79 0.00 0.00 0.00 0.00 0.00 Oct-02 3016.90 11487.26 0.00 0.00 0.00 0.00 0.00 Nov-02 3224.75 12133.26 0.00 0.00 0.00 0.00 0.00 Dec-02 3423.10 6582.01 1685.66 16.00 1701.66 136132.66 3607.52 Jan-03 3329.60 2680.52 94632.33 2696.52 16.00 2712.52 14228.08 217001.79 1138246.06 5750.55 30163.52 Feb-03 3101.60 1622.77 1638.77 16.00 1654.77 132381.72 3508.12 Mar-03 3756.00 2896.11 2912.11 16.00 2928.11 234248.54 6207.59 Apr-03 4011.20 3332.29 3348.29 16.00 3364.29 269142.99 7132.29 May-03 3355.91 6296.28 2065.98 16.00 2081.98 166558.66 4413.80 Jun-03 2770.01 10995.75 0.00 0.00 0.00 0.00 0.00 Jul-03 2925.88 11601.28 0.00 0.00 0.00 0.00 0.00 Aug-03 3062.51 11518.36 0.00 0.00 0.00 0.00 0.00 Sep-03 3443.74 12950.42 0.00 0.00 0.00 0.00 0.00 Oct-03 3564.05 13467.24 0.00 0.00 0.00 0.00 0.00

154
Nov-03 3015.38 11483.02 0.00 0.00 0.00 0.00 0.00 Dec-03 2915.42 5788.29 1470.40 16.00 1486.40 118912.36 3151.18 Jan-04 2387.24 2143.58 92352.60 2159.58 16.00 2175.58 12386.28 174046.12 990902.55 4612.22 26258.92 Feb-04 3026.50 2505.56 2521.56 16.00 2537.56 203005.06 5379.63 Mar-04 3154.76 2392.50 2408.50 16.00 2424.50 193960.27 5139.95 Apr-04 3360.83 4891.29 2081.34 16.00 2097.34 167787.07 4446.36 May-04 2120.58 6615.29 435.40 16.00 451.40 36112.31 956.98 Jun-04 3411.88 10834.88 1189.19 16.00 1205.19 96415.22 2555.00 Jul-04 2522.98 9498.85 0.00 0.00 0.00 0.00 0.00 Aug-04 3103.08 11641.00 0.00 0.00 0.00 0.00 0.00 Sep-04 4094.92 15333.15 0.00 0.00 0.00 0.00 0.00 Oct-04 3195.22 12054.49 0.00 0.00 0.00 0.00 0.00 Nov-04 2972.60 11279.96 0.00 0.00 0.00 0.00 0.00 Dec-04 2322.97 3162.06 1478.71 16.00 1494.71 119576.50 3168.78 Jan-05 3412.20 2966.45 91779.46 2982.45 16.00 2998.45 18183.46 239876.39 1454677.10 6356.72 38548.94 Feb-05 3392.00 3776.40 3792.40 16.00 3808.40 304672.00 8073.81 Mar-05 3579.32 3072.77 3088.77 16.00 3104.77 248381.53 6582.11 Apr-05 3463.47 2580.73 2596.73 16.00 2612.73 209018.22 5538.98 May-05 4249.80 11534.12 1062.14 16.00 1078.14 86251.27 2285.66 Jun-05 3966.88 14732.58 140.74 16.00 156.74 12538.88 332.28 Jul-05 2658.37 7503.47 378.68 16.00 394.68 31574.05 836.71 Aug-05 3386.90 12856.55 62.37 16.00 78.37 6269.42 166.14 Sep-05 3092.62 10236.12 360.36 16.00 376.36 30108.60 797.88 Oct-05 3162.06 8014.69 1093.31 16.00 1109.31 88744.52 2351.73 Nov-05 3333.37 8828.46 835.91 16.00 851.91 68152.68 1806.05 Dec-05 2827.55 5677.14 1597.62 16.00 1613.62 129089.55 3420.87
Date Total Hauled to and from Land application Total Diesel Consumption To From Total Dist* Diesel
Month /Yr metric tons
metric tons metric tons Miles
metric ton-miles
metric ton-miles/yr Gallons
Gallons /year Gallons
GJ/ month
GJ/ MG GJ/yr
GJ/ MG-Yr
Jan-00 0.00 0.00 0.00 31.67 0.00 3178654.06 0.00 84234.33 6305.32 1051.13 1.98 18154.53 2.65

155
Feb-00 0.00 0.00 0.00 31.67 0.00 0.00 6823.60 1137.53 2.23 Mar-00 798.24 16.00 814.24 31.67 25784.27 683.28 7280.62 1213.72 2.25 Apr-00 10384.04 16.00 10400.04 31.67 329334.68 8727.37 9719.33 1620.27 2.93 May-00 15134.88 16.00 15150.88 31.67 479777.80 12714.11 12714.11 2119.52 3.52 Jun-00 12753.14 16.00 12769.14 31.67 404356.12 10715.44 10715.44 1786.32 2.87 Jul-00 9593.04 16.00 9609.04 31.67 304286.25 8063.59 8063.59 1344.25 2.25 Aug-00 12705.21 16.00 12721.21 31.67 402838.38 10675.22 10675.22 1779.62 2.90 Sep-00 12195.44 16.00 12211.44 31.67 386695.47 10247.43 10247.43 1708.31 2.84 Oct-00 13147.84 16.00 13163.84 31.67 416854.89 11046.65 11046.65 1841.54 3.13 Nov-00 11790.29 16.00 11806.29 31.67 373865.89 9907.45 9907.45 1651.63 3.07 Dec-00 1716.43 16.00 1732.43 31.67 54860.31 1453.80 5402.87 900.69 1.64 Jan-01 0.00 0.00 0.00 31.67 0.00 2820184.17 0.00 74734.88 6288.64 1048.35 1.83 16817.22 2.6 Feb-01 0.00 0.00 0.00 31.67 0.00 0.00 5413.67 902.49 1.41 Mar-01 0.00 0.00 0.00 31.67 0.00 0.00 6939.85 1156.91 1.93 Apr-01 5111.49 16.00 5127.49 31.67 162370.37 4302.81 9187.52 1531.61 2.57 May-01 12642.14 16.00 12658.14 31.67 400840.95 10622.29 10622.29 1770.80 2.94 Jun-01 10214.14 16.00 10230.14 31.67 323954.38 8584.79 8584.79 1431.13 2.42 Jul-01 10972.91 16.00 10988.91 31.67 347982.18 9221.53 9221.53 1537.28 2.79 Aug-01 10269.17 16.00 10285.17 31.67 325697.10 8630.97 8630.97 1438.83 2.54 Sep-01 11470.29 16.00 11486.29 31.67 363732.42 9638.91 9638.91 1606.86 2.86 Oct-01 11876.24 16.00 11892.24 31.67 376587.73 9979.57 9979.57 1663.65 2.49 Nov-01 11269.62 16.00 11285.62 31.67 357378.07 9470.52 9470.52 1578.79 2.83 Dec-01 5088.45 16.00 5104.45 31.67 161640.96 4283.49 6901.40 1150.50 1.98 Jan-02 0.00 0.00 0.00 31.67 0.00 2706545.62 0.00 71723.46 5330.34 888.60 1.60 16727.47 2.4 Feb-02 0.00 0.00 0.00 31.67 0.00 0.00 7368.63 1228.39 2.00 Mar-02 0.00 0.00 0.00 31.67 0.00 0.00 5621.95 937.21 1.47 Apr-02 1387.33 16.00 1403.33 31.67 44438.70 1177.63 7424.92 1237.78 1.91 May-02 11650.94 16.00 11666.94 31.67 369453.04 9790.51 10232.62 1705.84 2.85 Jun-02 9522.36 16.00 9538.36 31.67 302048.06 8004.27 8004.27 1334.36 2.45 Jul-02 9489.30 16.00 9505.30 31.67 301001.14 7976.53 7976.53 1329.73 2.37 Aug-02 10225.28 16.00 10241.28 31.67 324307.21 8594.14 8594.14 1432.69 2.52 Sep-02 14469.79 16.00 14485.79 31.67 458716.54 12155.99 12155.99 2026.47 3.56 Oct-02 11503.26 16.00 11519.26 31.67 364776.72 9666.58 9666.58 1611.47 2.88 Nov-02 12149.26 16.00 12165.26 31.67 385233.22 10208.68 10208.68 1701.85 3.17 Dec-02 4928.35 16.00 4944.35 31.67 156570.99 4149.13 7756.65 1293.08 2.54 Jan-03 0.00 0.00 0.00 31.67 0.00 2560321.26 0.00 67848.51 5750.55 958.65 1.86 16339.17 2.5

156
Feb-03 0.00 0.00 0.00 31.67 0.00 0.00 3508.12 584.82 1.29 Mar-03 0.00 0.00 0.00 31.67 0.00 0.00 6207.59 1034.84 1.83 Apr-03 0.00 0.00 0.00 31.67 0.00 0.00 7132.29 1188.99 1.99 May-03 4262.29 16.00 4278.29 31.67 135479.25 3590.20 8004.00 1334.31 2.21 Jun-03 11011.75 16.00 11027.75 31.67 349212.13 9254.12 9254.12 1542.72 2.86 Jul-03 11617.28 16.00 11633.28 31.67 368387.05 9762.26 9762.26 1627.42 2.97 Aug-03 11534.36 16.00 11550.36 31.67 365761.52 9692.68 9692.68 1615.83 2.86 Sep-03 12966.42 16.00 12982.42 31.67 411110.07 10894.42 10894.42 1816.16 3.21 Oct-03 13483.24 16.00 13499.24 31.67 427475.82 11328.11 11328.11 1888.46 3.46 Nov-03 11499.02 16.00 11515.02 31.67 364642.27 9663.02 9663.02 1610.88 2.95 Dec-03 4349.89 16.00 4365.89 31.67 138253.14 3663.71 6814.89 1136.08 2.12 Jan-04 0.00 0.00 0.00 31.67 0.00 2548480.00 0.00 67534.72 4612.22 768.88 1.42 15635.94 2.32 Feb-04 0.00 0.00 0.00 31.67 0.00 0.00 5379.63 896.82 1.80 Mar-04 0.00 0.00 0.00 31.67 0.00 0.00 5139.95 856.86 1.30 Apr-04 2841.95 16.00 2857.95 31.67 90501.81 2398.30 6844.66 1141.04 2.08 May-04 6211.89 16.00 6227.89 31.67 197216.55 5226.24 6183.21 1030.78 1.53 Jun-04 9677.68 16.00 9693.68 31.67 306966.69 8134.62 10689.62 1782.02 3.05 Jul-04 9514.85 16.00 9530.85 31.67 301810.14 7997.97 7997.97 1333.31 2.43 Aug-04 11657.00 16.00 11673.00 31.67 369645.00 9795.59 9795.59 1632.98 2.95 Sep-04 15349.15 16.00 15365.15 31.67 486562.95 12893.92 12893.92 2149.49 3.94 Oct-04 12070.49 16.00 12086.49 31.67 382738.83 10142.58 10142.58 1690.83 3.16 Nov-04 11295.96 16.00 11311.96 31.67 358211.93 9492.62 9492.62 1582.47 3.08 Dec-04 1715.35 16.00 1731.35 31.67 54826.10 1452.89 4621.67 770.46 1.43 Jan-05 0.00 0.00 0.00 31.67 0.00 2350806.66 0.00 62296.38 6356.72 1059.70 1.72 16811.49 2.51 Feb-05 0.00 0.00 0.00 31.67 0.00 0.00 8073.81 1345.95 2.38 Mar-05 0.00 0.00 0.00 31.67 0.00 0.00 6582.11 1097.28 1.81 Apr-05 0.00 0.00 0.00 31.67 0.00 0.00 5538.98 923.38 1.68 May-05 10503.98 16.00 10519.98 31.67 333132.71 8828.02 11113.68 1852.71 3.52 Jun-05 14623.84 16.00 14639.84 31.67 463594.93 12285.27 12617.55 2103.42 3.88 Jul-05 7156.79 16.00 7172.79 31.67 227138.48 6019.17 6855.88 1142.91 1.90 Aug-05 12826.18 16.00 12842.18 31.67 406668.97 10776.73 10942.87 1824.24 3.31 Sep-05 9907.76 16.00 9923.76 31.67 314252.33 8327.69 9125.56 1521.28 2.77 Oct-05 6953.38 16.00 6969.38 31.67 220697.09 5848.47 8200.20 1367.02 2.53 Nov-05 8024.55 16.00 8040.55 31.67 254617.32 6747.36 8553.41 1425.90 2.63 Dec-05 4111.52 16.00 4127.52 31.67 130704.82 3463.68 6884.55 1147.69 2.26

157
Appendix B-II
Ann Arbor Wastewater Treatment Plant Emissions Analysis
a. Ann Arbor Wastewater Treatment Plant – Global Warming Potential
Global Warming Potential for 2003 - Electricity
g/MJe Total for 2003 g CO2 eq./MG
kg CO2 eq./MG
Fossil Carbon Dioxide 183 10617676931 1612991 1613Non-fossil Carbon Dioxide 0.000297 17232 3 0Methane CH4 0.313 18160289 63453 63Nitrous Oxide 0.0102 591805 26971 27Total GWP 1703418 1703
Global Warming Potential for 2004 - Electricity
g/MJe Total for 2004 g CO2 eq./MG
kg CO2 eq./MG
Fossil Carbon Dioxide 183 10391498058 1652907 1653Non-fossil Carbon Dioxide 0.000297 16865 3 0Methane CH4 0.313 17773437 65023 65Nitrous Oxide 0.0102 579198 27639 28Total GWP 1745572 1746
Global Warming Potential for 2003- Natural Gas
g/1000cuft Total in 2003 g CO2 eq./MG
kg CO2 eq./MG
Fossil Carbon Dioxide 62142.150 12520897.519 1902.120 1.902Non-fossil Carbon Dioxide 12.701 2559.099 0.389 0.000Methane CH4 172.365 34729.479 121.347 0.121Nitrous Oxide 0.005 1.007 0.046 0.000Total GWP 2023.902 2.024
Global Warming Potential for 2004- Natural Gas
g/1000cuft Total in 2004 g CO2 eq./MG
kg CO2 eq./MG
Fossil Carbon Dioxide 62142.150 15639439.17 2318.053 2.318Non-fossil Carbon Dioxide 12.701 3196.486 0.474 0.000Methane CH4 172.365 43379.444 147.882 0.148Nitrous Oxide 0.005 1.258 0.056 0.000Total GWP 2466.464 2.466
Global Warming Potential for 2003- Diesel
g/1000cuft Total in 2003 g CO2 eq./MG
kg CO2 eq./MG
Fossil Carbon Dioxide 11626480.00 1139534950.59 173113.20 173.113Non-fossil Carbon Dioxide 2766.913 271190.770 41.20 0.041Methane CH4 1837.049 180052.909 629.12 0.629Nitrous Oxide 0.007 0.686 0.03 0.000Total GWP 173783.55 173.784

158
Global Warming Potential for 2004- Diesel
g/1000cuft Total in 2004 g CO2 eq./MG
kg CO2 eq./MG
Fossil Carbon Dioxide 11626480.00 1090489851.76 161630.68 161.631Non-fossil Carbon Dioxide 2766.913 259518.835 38.47 0.038Methane CH4 1837.049 172303.508 587.39 0.587Nitrous Oxide 0.007 0.657 0.03 0.000Total GWP 162256.56 162.257
Global Warming Potential for 2003-
Chemicals
kg CO2eq./Yr
kg CO2eq./MG
Carbon Dioxide 580778 88 Methane CH4 12709 2 Nitrous Oxide 2233 0 Total GWP 595720 90
Global Warming Potential for 2003- Chemicals
kg CO2eq./Yr
kg CO2eq./MG
Carbon Dioxide 580778 86 Methane CH4 12709 2 Nitrous Oxide 2233 0 Total GWP 595720 88

159
b. Ann Arbor Wastewater Treatment Plant – Eutrophication Potential
Eutrophication Potential for 2003- Electricity Atmospheric Aquatic
g/MJe Total in 2003 kg N eq./MG g/MJe Total in 2003 kg N eq./MG NOx 0.475 27559543.948 0.167 N NH3 0.00035 20307.032 0.000000 NH3 0.000151 8761.034 0.0010
NH4+ COD 0.00466 270373.631 0.002 NO3- NO3- 0.0000473 2744.350 0.00004 PO43- PO43- 0.000000002 0.107 0.00000012
P P Total 0.167 0.003
Eutrophication Potential for 2004- Electricity Atmospheric Aquatic
g/MJe Total in 2004 kg N eq./MG g/MJe Total in 2004 kg N eq./MG NOx 0.475 26972467.637 0.160 N NH3 0.00035 19874.450 0.000 NH3 0.000151 8574.406 0.0010
NH4+ COD 0.00466 264614.104 0.002 NO3- NO3- 0.0000473 2685.890 0.00004 PO43- PO43- 0.000000002 0.105 0.00000011
P P Total 0.160 0.003
Eutrophication Potential for 2003- Natural Gas Atmospheric Aquatic
g/1000 cuft. Total in 2003 kg N eq./MG g/1000 cuft. Total in 2003 kg N eq./MG NOx 231.332 46610.622 0.0003 N NH3 1.361 274.225 0.000005 NH3 0.027 5.440 0.0000006
NH4+ COD 19.504 3929.822 0.000030 NO3- NO3- 0.000082 0.017 0.0000000003 PO43- PO43- 0.005 1.007 0.0000004
P P Total 0.000 0.000031
Eutrophication Potential for 2004- Natural Gas Atmospheric Aquatic
g/1000 cuft. Total in 2004 kg N eq./MG g/1000 cuft. Total in 2004 kg N eq./MG NOx 231.332 58219.787 0.0003 N NH3 1.361 342.526 0.000006 NH3 0.027 6.795 0.0000008
NH4+ COD 19.504 4908.611 0.000036 NO3- NO3- 0.000082 0.021 0.0000000003 PO43- PO43- 0.005 1.258 0.00000
P P Total 0.000 0.000038

160
Eutrophication Potential for 2003- Diesel
Atmospheric Aquatic g/1000 cuft. Total in 2003 kg N eq./MG g/1000 cuft. Total in 2003 kg N eq./MG
NOx 216950.400 21263749.94 0.129 N NH3 18.144 1778.330 0.00003 NH3 6.35 622.376 0.00007
NH4+ COD 39.463 3867.849 0.000029 NO3- NO3- 0.018 1.764 0.00000003 PO43- PO43- 1.588 155.643 0.000056
P P Total 0.129 0.000159
Eutrophication Potential for 2004- Diesel
Atmospheric Aquatic g/1000 cuft. Total in 2004 kg N eq./MG g/1000 cuft. Total in 2004 kg N eq./MG
NOx 216950.400 20348567.20 0.121 N NH3 18.144 1701.792 0.000030 NH3 6.35 595.590 0.000069
NH4+ COD 39.463 3701.378 0.000027 NO3- NO3- 0.018 1.688 0.00000003 PO43- PO43- 1.588 148.944 0.000053
P P Total 0.121 0.000149
Eutrophication Potential for 2003- Chemicals
Atmospheric Aquatic g N eq./Yr g N eq./MG g N eq./Yr g N eq./MG
NOx 10874 2 N 86.67 0.01NH3 24 0.004 NH3 0.31 0.000047
NH4+ COD 133.23 0.02NO3
- NO3- 2.73 0.0004
PO43- PO4
3- 0.62 0.0001P P
Total 2 0.03
Eutrophication Potential for 2004- Chemicals Atmospheric Aquatic
g N eq./Yr g N eq./MG g N eq./Yr g N eq./MG NOx 10874 2 N 86.67 0.01NH3 24 0.004 NH3 0.31 0.000046
NH4+ COD 133.23 0.02NO3
- NO3- 2.73 0.0004
PO43- PO4
3- 0.62 0.0001P P 0.00
Total 2 0.03

161
c. Ann Arbor Wastewater Treatment Plant –Acidification Potential
Acidification Potential for 2003- Electricity
g/MJe Total in 2003 moles H+ eq./MG
SO2 38.042 2207183534 335.31 HCl 3.3560380 194717635.3 29.581 NOx 19.0190 1103484140 167.637 NH3 0.033422 1939118.522 0.295 Total 532.817
Acidification Potential for 2004- Electricity
g/MJe Total in 2004 moles H+ eq./MG
SO2 38.042 2160165878 320.176 HCl 3.356 190569739.7 28.246 NOx 19.019 1079977604 160.073 NH3 0.033 1897811.215 0.281 Total 508.776
Acidification Potential for 2003- Natural Gas
g/1000 cuft Total in 2003 moles H+ eq./MG
SO2 893.577 180045.0426 1.389 HCl 0.044 8.865472 0.000109 NOx 231.332 46610.62202 0.284 NH3 1.361 274.225168 0.0040 Total 1.677
Acidification Potential for 2004- Natural Gas
g/1000 cuft Total in 2004 moles H+ eq./MG
SO2 893.577 224888.3107 1.693 HCl 0.044 11.073568 0.000133 NOx 231.332 58219.7871 0.346 NH3 1.361 342.525592 0.0048 Total 2.043
Acidification Potential for 2003- Diesel
g/1000 gallons
Total in 2003 kg SO2 equiv./MG
SO2 25854.77 2534078.591 19.552 HCl 11.34 1111.456463 0.0137 NOx 216590.4 21228465.6 129.126 NH3 18.144 1778.330341 0.0258 Total 148.718

162
Acidification Potential for 2004- Diesel
g/1000 gallons
Total in 2004 moles H+ eq./MG
SO2 25854.77 2425012.928 18.256 HCl 11.34 1063.61985 0.0128 NOx 216590.4 20314801.49 120.562 NH3 18.144 1701.791761 0.0241 Total 138.854
Acidification Potential for 2003- Chemicals moles H+ eq./Yr moles H+ eq./MG SO2 27560 4HCl 2061 0.3NOx 23050 4NH3 22 0.003Total 8 Acidification Potential for 2004- Chemicals moles H+ eq./Yr moles H+ eq./MG SO2 27560 4HCl 2061 0.3NOx 23050 3NH3 22 0.003Total 8

163
Appendix C-I
Laguna Wastewater Treatment Plant
a. Details of the Subregional Recycling System (Courtesy: City Website, City of Santa Rosa)
Subregional Operations comprises of eight sections that operate and maintain- The
Laguna Treatment Plant, the Oakmont Treatment Plant, the Subregional Compost
Facility and the Reclamation system. Laguna Treatment Plant is a tertiary-level
treatment facility that has an average daily dry weather flow of 17.5 million gallons
per day. This facility serves the Subregional partners including the Cities of Santa
Rosa, Sebastopol, Cotati, Rohnert Park and the Sonoma County South Park Sanitation
District. The Oakmont Treatment Plant has an average flow of .5 to .6 MGD and
operates between April and October. The Subregional Compost Facility is an
agitated, aerobic, naturally heated, biological process that produces approximately
20,000 cubic yards of compost annually. The Reclamation system comprises 6,130
acres, utilizing 45 pump stations that deliver reclaimed water to buried pipe and
aboveground irrigation systems.

164
b. Details of the Geysers Recharge Project (Courtesy: City Website, City of Santa Rosa)

165
c. Total flow at Laguna WWTP
Date Total Flow Total Flow ave. daily flow Monthly
Month/Year MGD MG MG/Yr Jan-00 21.55 668.05 7607.41 Feb-00 33.59 940.52 Mar-00 28.01 868.31 Apr-00 21.22 636.60 May-00 20.02 620.62 Jun-00 18.07 542.10 Jul-00 17.60 545.60 Aug-00 17.80 551.80 Sep-00 17.51 525.30 Oct-00 18.22 564.82 Nov-00 18.81 564.30 Dec-00 18.69 579.39 Jan-01 21.12 654.72 7382.01 Feb-01 26.03 728.84 Mar-01 23.17 718.27 Apr-01 19.47 584.10 May-01 17.70 548.70 Jun-01 16.79 503.70 Jul-01 16.37 507.47 Aug-01 16.47 510.57 Sep-01 16.45 493.50 Oct-01 16.47 510.57 Nov-01 20.81 624.30 Dec-01 32.17 997.27 Jan-02 29.55 916.05 7382.34 Feb-02 22.01 616.28 Mar-02 22.43 695.33 Apr-02 19.28 578.40 May-02 18.11 561.41 Jun-02 17.15 514.50 Jul-02 16.32 505.92 Aug-02 16.36 507.16 Sep-02 16.20 486.00 Oct-02 16.30 505.30 Nov-02 17.74 532.20 Dec-02 31.09 963.79 Jan-03 28.46 882.26 7509.01 Feb-03 22.51 630.28 Mar-03 21.86 677.66 Apr-03 22.41 672.30 May-03 21.96 680.76 Jun-03 18.28 548.40 Jul-03 17.25 534.75

166
Aug-03 17.26 535.06 Sep-03 16.94 508.20 Oct-03 16.71 518.01 Nov-03 17.87 536.10 Dec-03 25.33 785.23 Jan-04 25.68 796.08 7371.38 Feb-04 30.42 851.76 Mar-04 22.66 702.46 Apr-04 19.71 591.30 May-04 17.73 549.63 Jun-04 17.17 515.10 Jul-04 16.84 522.04 Aug-04 16.73 518.63 Sep-04 16.55 496.50 Oct-04 17.59 545.29 Nov-04 17.86 535.80 Dec-04 24.09 746.79 Jan-05 27.88 864.28 8056.49 Feb-05 24.26 679.28 Mar-05 28.68 889.08 Apr-05 22.92 687.60 May-05 24.38 755.78 Jun-05 19.76 592.80 Jul-05 18.15 562.65 Aug-05 17.62 546.22 Sep-05 17.30 519.00 Oct-05 16.65 516.15 Nov-05 17.69 530.70 Dec-05 29.45 912.95

167
d. Electricity Consumption at the Laguna WWTP
Date Electricity Consumption Electricity supplied from the Grid Grid Generator Total
Month/ Year
kWh/ month
% of Total
kWh/ month
% of Total kWh
kWh/ MG GJ
GJ/ Yr
GJ/ MG
GJ/ MG-Yr
Jan-00 1709991.00 59.12 1182433.00 40.88 2892424.00 2559.68 6155.97 71341.19 9.21 9.38Feb-00 2078054.00 63.09 1097992.00 36.91 2974944.00 2209.47 7480.99 7.95 Mar-00 1880987.00 60.62 1221865.00 39.38 3102852.00 2166.26 6771.55 7.80 Apr-00 1743750.00 60.85 1085730.00 39.15 2773230.00 2739.16 6277.50 9.86 May-00 1736992.00 57.64 1276642.00 42.36 3013634.00 2798.80 6253.17 10.08 Jun-00 1683300.00 58.89 1137270.00 41.11 2766270.00 3105.15 6059.88 11.18 Jul-00 1494014.00 54.00 1272612.00 46.00 2766626.00 2738.30 5378.45 9.86 Aug-00 1484745.00 53.58 1286314.00 46.42 2771059.00 2690.73 5345.08 9.69 Sep-00 1308045.00 50.88 1222260.00 49.12 2488110.00 2490.09 4708.96 8.96 Oct-00 1312664.00 50.40 1292049.00 49.60 2604713.00 2324.04 4725.59 8.37 Nov-00 1703450.00 59.59 1117920.00 40.41 2766420.00 3018.70 6132.42 10.87 Dec-00 1681006.00 59.03 1166499.00 40.97 2847505.00 2901.34 6051.62 10.44 Jan-01 1764551.00 59.14 1219075.00 40.86 2983626.00 2695.12 6352.38 74249.83 9.70 10.06Feb-01 2160142.00 70.71 808360.00 29.29 2759456.00 2963.81 7776.51 10.67 Mar-01 2447730.00 82.00 555117.00 18.00 3084438.00 3407.81 8811.83 12.27 Apr-01 2145293.00 78.87 556110.00 21.13 2632200.00 3672.82 7723.05 13.22 May-01 1860496.00 71.71 733894.00 28.29 2594390.00 3390.73 6697.79 12.21 Jun-01 1347600.00 54.54 1123320.00 45.46 2470920.00 2675.40 4851.36 9.63 Jul-01 1365054.00 52.18 1250912.00 47.82 2615966.00 2689.92 4914.19 9.68 Aug-01 1399898.00 52.02 1291181.00 47.98 2691079.00 2741.83 5039.63 9.87 Sep-01 1157640.00 48.64 1222230.00 51.36 2379870.00 2345.78 4167.50 8.44 Oct-01 1171304.00 47.98 1269915.00 52.02 2441219.00 2294.11 4216.69 8.26 Nov-01 1506780.00 57.31 1122570.00 42.69 2629350.00 2413.55 5424.41 8.69 Dec-01 2298464.00 69.94 987753.00 30.06 3286217.00 2304.76 8274.47 8.30 Jan-02 2012737.00 64.29 1117953.00 35.71 3130690.00 2197.19 7245.85 69847.49 7.91 9.46

168
Feb-02 1547336.00 59.81 1039892.00 40.19 2587228.00 2510.77 5570.41 9.04 Mar-02 2023308.00 70.13 861769.00 29.87 2885077.00 2909.85 7283.91 10.48 Apr-02 1577130.00 58.28 1128930.00 41.72 2706060.00 2726.71 5677.67 9.82 May-02 1513606.00 56.65 1158346.00 43.35 2671952.00 2696.08 5448.98 9.71 Jun-02 1404780.00 55.94 1106670.00 44.06 2511450.00 2730.38 5057.21 9.83 Jul-02 1424450.00 55.28 1152518.00 44.72 2576968.00 2815.56 5128.02 10.14 Aug-02 1575730.00 58.23 1130136.00 41.77 2618580.00 3106.97 5672.63 11.19 Sep-02 1285170.00 51.31 1219590.00 48.69 2504760.00 2644.38 4626.61 9.52 Oct-02 1374602.00 52.55 1240992.00 47.45 2615594.00 2720.37 4948.57 9.79 Nov-02 1519860.00 57.56 1120500.00 42.44 2640360.00 2855.81 5471.50 10.28 Dec-02 2143371.00 64.79 1164763.00 35.21 3308134.00 2223.90 7716.14 8.01 Jan-03 1989611.00 63.54 1141823.00 36.46 3131434.00 2255.13 7162.60 66801.07 8.12 8.90Feb-03 1550388.00 59.37 1061004.00 40.63 2611392.00 2459.84 5581.40 8.86 Mar-03 1852560.00 62.18 1126695.00 37.82 2979255.00 2733.76 6669.22 9.84 Apr-03 1654080.00 59.76 1113630.00 40.24 2767710.00 2460.33 5954.69 8.86 May-03 1466517.00 53.18 1290902.00 46.82 2757419.00 2154.23 5279.46 7.76 Jun-03 1249920.00 50.05 1247460.00 49.95 2497380.00 2279.21 4499.71 8.21 Jul-03 1347539.00 51.20 1284206.00 48.80 2631745.00 2519.94 4851.14 9.07 Aug-03 1348810.00 51.92 1249238.00 48.08 2598048.00 2520.86 4855.72 9.08 Sep-03 1342500.00 52.04 1237350.00 47.96 2579850.00 2641.68 4833.00 9.51 Oct-03 1316415.00 50.71 1279556.00 49.29 2595971.00 2541.29 4739.09 9.15 Nov-03 1436400.00 56.16 1121100.00 43.84 2557500.00 2679.35 5171.04 9.65 Dec-03 2001112.00 63.20 1165321.00 36.80 3166433.00 2548.44 7204.00 9.17 Jan-04 2131684.00 64.97 1149356.00 35.03 3281040.00 2677.73 7674.06 82022.10 9.64 11.13Feb-04 2306108.00 72.25 885724.00 27.75 3191832.00 2707.46 8301.99 9.75 Mar-04 2038312.00 63.75 1159183.00 36.25 3197495.00 2901.68 7337.92 10.45 Apr-04 1672080.00 60.45 1094130.00 39.55 2766210.00 2827.80 6019.49 10.18 May-04 1665847.00 57.57 1227693.00 42.43 2893540.00 3030.85 5997.05 10.91 Jun-04 1635120.00 57.82 1192650.00 42.18 2827770.00 3174.37 5886.43 11.43 Jul-04 1614418.00 56.91 1222547.00 43.09 2836965.00 3092.52 5811.90 11.13 Aug-04 1726545.00 58.73 1213092.00 41.27 2939637.00 3329.05 6215.56 11.98 Sep-04 1482000.00 55.14 1205880.00 44.86 2687880.00 2984.89 5335.20 10.75

169
Oct-04 2105489.00 63.25 1223167.00 36.75 3328656.00 3861.23 7579.76 13.90 Nov-04 2108160.00 66.59 1057770.00 33.41 3165930.00 3934.60 7589.38 14.16 Dec-04 2298154.00 67.31 1116310.00 32.69 3414464.00 3077.38 8273.35 11.08 Jan-05 2431237.00 68.05 1141606.00 31.95 3572843.00 2813.02 8752.45 82730.24 10.13 10.27Feb-05 1828792.00 63.56 1048600.00 36.44 2877392.00 2692.25 6583.65 9.69 Mar-05 2250228.00 66.04 1156982.00 33.96 3407210.00 2530.96 8100.82 9.11 Apr-05 1858620.00 63.16 1084050.00 36.84 2942670.00 2703.05 6691.03 9.73 May-05 1894813.00 59.26 1302744.00 40.74 3197557.00 2507.10 6821.33 9.03 Jun-05 1527840.00 54.90 1254990.00 45.10 2782830.00 2577.33 5500.22 9.28 Jul-05 1702551.00 57.90 1238202.00 42.10 2940753.00 3025.95 6129.18 10.89 Aug-05 1793040.00 59.15 1238202.00 40.85 3031242.00 3282.63 6454.94 11.82 Sep-05 1638480.00 58.22 1175940.00 41.78 2814420.00 3156.99 5898.53 11.37 Oct-05 1701528.00 59.51 1157912.00 40.49 2859440.00 3296.58 6125.50 11.87 Nov-05 1853280.00 66.40 937650.00 33.60 2790930.00 3492.14 6671.81 12.57 Dec-05 2500212.00 73.45 903712.00 26.55 3403924.00 2738.61 9000.76 9.86

170
e. Natural Gas Consumption at the Laguna WWTP
Date Total Flow Natural Gas Consumption
WW
Treated Cogeneration Month/Year MG CCF cuft cuft/MG GJ GJ/Yr GJ/MG GJ/MG-Yr
Jan-00 668.05 2100.00 210000.00 314.35 0.252 3.379 0.0004 0.0004Feb-00 940.52 2184.00 218400.00 232.21 0.262 0.0003 Mar-00 868.31 2150.00 215000.00 247.61 0.258 0.0003 Apr-00 636.60 2122.00 212200.00 333.33 0.255 0.0004 May-00 620.62 2531.00 253100.00 407.82 0.304 0.0005 Jun-00 542.10 2284.00 228400.00 421.32 0.274 0.0005 Jul-00 545.60 2599.00 259900.00 476.36 0.312 0.0006 Aug-00 551.80 2642.00 264200.00 478.80 0.317 0.0006 Sep-00 525.30 2619.00 261900.00 498.57 0.314 0.0006 Oct-00 564.82 2717.00 271700.00 481.04 0.326 0.0006 Nov-00 564.30 2137.00 213700.00 378.70 0.256 0.0005 Dec-00 579.39 2072.00 207200.00 357.62 0.249 0.0004 Jan-01 654.72 2224.00 222400.00 339.69 0.267 2.433 0.0004 0.0003Feb-01 728.84 1185.00 118500.00 162.59 0.142 0.0002 Mar-01 718.27 45.00 4500.00 6.27 0.005 0.0000 Apr-01 584.10 110.00 11000.00 18.83 0.013 0.0000 May-01 548.70 590.00 59000.00 107.53 0.071 0.0001 Jun-01 503.70 2021.00 202100.00 401.23 0.243 0.0005 Jul-01 507.47 2531.00 253100.00 498.75 0.304 0.0006 Aug-01 510.57 2792.00 279200.00 546.84 0.335 0.0007 Sep-01 493.50 2710.00 271000.00 549.14 0.325 0.0007 Oct-01 510.57 2589.00 258900.00 507.08 0.311 0.0006 Nov-01 624.30 2037.00 203700.00 326.29 0.244 0.0004 Dec-01 997.27 1445.00 144500.00 144.90 0.173 0.0002 Jan-02 916.05 1887.00 188700.00 205.99 0.226 3.040 0.0002 0.0004

171
Feb-02 616.28 2057.00 205700.00 333.78 0.247 0.0004 Mar-02 695.33 1077.00 107700.00 154.89 0.129 0.0002 Apr-02 578.40 2096.00 209600.00 362.38 0.252 0.0004 May-02 561.41 2090.00 209000.00 372.28 0.251 0.0004 Jun-02 514.50 2142.00 214200.00 416.33 0.257 0.0005 Jul-02 505.92 2266.00 226600.00 447.90 0.272 0.0005 Aug-02 507.16 2213.00 221300.00 436.35 0.266 0.0005 Sep-02 486.00 2605.00 260500.00 536.01 0.313 0.0006 Oct-02 505.30 2559.00 255900.00 506.43 0.307 0.0006 Nov-02 532.20 2204.00 220400.00 414.13 0.264 0.0005 Dec-02 963.79 2140.00 214000.00 222.04 0.257 0.0003 Jan-03 882.26 1992.00 199200.00 225.78 0.239 3.375 0.0003 0.0004Feb-03 630.28 2017.00 201700.00 320.02 0.242 0.0004 Mar-03 677.66 1957.00 195700.00 288.79 0.235 0.0003 Apr-03 672.30 1986.00 198600.00 295.40 0.238 0.0004 May-03 680.76 2460.00 246000.00 361.36 0.295 0.0004 Jun-03 548.40 2609.00 260900.00 475.75 0.313 0.0006 Jul-03 534.75 2677.00 267700.00 500.61 0.321 0.0006 Aug-03 535.06 2602.00 260200.00 486.30 0.312 0.0006 Sep-03 508.20 2727.00 272700.00 536.60 0.327 0.0006 Oct-03 518.01 2675.00 267500.00 516.40 0.321 0.0006 Nov-03 536.10 2229.00 222900.00 415.78 0.267 0.0005 Dec-03 785.23 2196.00 219600.00 279.66 0.264 0.0003 Jan-04 796.08 2054.00 205400.00 258.01 0.246 3.162 0.0003 0.0004Feb-04 851.76 1549.00 154900.00 181.86 0.186 0.0002 Mar-04 702.46 2129.00 212900.00 303.08 0.255 0.0004 Apr-04 591.30 1999.00 199900.00 338.07 0.240 0.0004 May-04 549.63 2384.00 238400.00 433.75 0.286 0.0005 Jun-04 515.10 2409.00 240900.00 467.68 0.289 0.0006 Jul-04 522.04 2449.00 244900.00 469.12 0.294 0.0006 Aug-04 518.63 2493.00 249300.00 480.69 0.299 0.0006 Sep-04 496.50 2521.00 252100.00 507.75 0.302 0.0006

172
Oct-04 545.29 2474.00 247400.00 453.70 0.297 0.0005 Nov-04 535.80 1906.00 190600.00 355.73 0.229 0.0004 Dec-04 746.79 1988.00 198800.00 266.21 0.239 0.0003 Jan-05 864.28 2065.00 206500.00 238.93 0.248 3.361 0.0003 0.0004Feb-05 679.28 2066.00 206600.00 304.15 0.248 0.0004 Mar-05 889.08 2117.00 211700.00 238.11 0.254 0.0003 Apr-05 687.60 2008.00 200800.00 292.03 0.241 0.0004 May-05 755.78 2566.00 256600.00 339.52 0.308 0.0004 Jun-05 592.80 2635.00 263500.00 444.50 0.316 0.0005 Jul-05 562.65 2518.00 251800.00 447.53 0.302 0.0005 Aug-05 546.22 2738.00 273800.00 501.26 0.329 0.0006 Sep-05 519.00 2890.00 289000.00 556.84 0.347 0.0007 Oct-05 516.15 2890.00 289000.00 559.91 0.347 0.0007 Nov-05 530.70 2060.00 206000.00 388.17 0.247 0.0005 Dec-05 912.95 1458.00 145800.00 159.70 0.175 0.0002

173
f. Chemicals Utilized for Treatment at the Laguna WWTP
Date Ferrous Chloride
(FeCl3-) Alum Hypochlorite 24% Ferrous (or Ferric) 47% Al2(SO4)2
Lbs Lbs/MG Lbs Lbs/MG Lbs Lbs/ MG
Jan-00 54095.00 80.97 25513.00 38.19 16000.21 23.95Feb-00 47628.00 50.64 37520.00 39.89 16000.21 17.01Mar-00 61597.00 70.94 34379.00 39.59 16000.21 18.43Apr-00 42540.00 66.82 26820.00 42.13 16000.21 25.13May-00 41726.00 67.23 29481.00 47.50 16000.21 25.78Jun-00 48450.00 89.37 26400.00 48.70 16000.21 29.52Jul-00 48000.00 87.98 24490.00 44.89 16000.21 29.33Aug-00 50747.00 91.97 26164.00 47.42 16000.21 29.00Sep-00 50640.00 96.40 22890.00 43.58 16000.21 30.46Oct-00 54312.00 96.16 24242.00 42.92 16000.21 28.33Nov-00 48030.00 85.11 21870.00 38.76 16000.21 28.35Dec-00 59179.00 102.14 25296.00 43.66 16000.21 27.62Jan-01 55738.00 85.13 30659.00 46.83 35509.94 54.24Feb-01 55832.00 76.60 31136.00 42.72 35509.94 48.72Mar-01 77779.00 108.29 44919.00 62.54 35509.94 49.44Apr-01 61659.00 105.56 26940.00 46.12 35509.94 60.79May-01 45539.00 82.99 26877.00 48.98 35509.94 64.72Jun-01 49080.00 97.44 45720.00 90.77 35509.94 70.50Jul-01 45539.00 89.74 48856.00 96.27 35509.94 69.97Aug-01 49848.00 97.63 29357.00 57.50 35509.94 69.55Sep-01 55950.00 113.37 22770.00 46.14 35509.94 71.96Oct-01 62434.00 122.28 24087.00 47.18 35509.94 69.55Nov-01 775620.00 1242.38 40980.00 65.64 35509.94 56.88Dec-01 126914.00 127.26 55087.00 55.24 35509.94 35.61Jan-02 100595.00 109.81 58156.00 63.49 39335.04 42.94

174
Feb-02 55076.00 89.37 40152.00 65.15 39335.04 63.83Mar-02 66185.00 95.19 43059.00 61.93 39335.04 56.57Apr-02 73800.00 127.59 40200.00 69.50 39335.04 68.01May-02 75671.00 134.79 35681.00 63.56 39335.04 70.06Jun-02 54240.00 105.42 36840.00 71.60 39335.04 76.45Jul-02 53816.00 106.37 32395.00 64.03 39335.04 77.75Aug-02 51584.00 101.71 34317.00 67.67 39335.04 77.56Sep-02 51840.00 106.67 31950.00 65.74 39335.04 80.94Oct-02 57381.00 113.56 33728.00 66.75 39335.04 77.84Nov-02 44550.00 83.71 33480.00 62.91 39335.04 73.91Dec-02 118265.00 122.71 50964.00 52.88 39335.04 40.81Jan-03 62930.00 71.33 47554.00 53.90 24203.75 27.43Feb-03 43344.00 68.77 39732.00 63.04 24203.75 38.40Mar-03 47895.00 70.68 40548.00 59.84 24203.75 35.72Apr-03 41370.00 61.54 37950.00 56.45 24203.75 36.00May-03 47926.00 70.40 31093.00 45.67 24203.75 35.55Jun-03 42090.00 76.75 26100.00 47.59 24203.75 44.14Jul-03 43772.00 81.86 24986.00 46.72 24203.75 45.26Aug-03 45477.00 84.99 24180.00 45.19 24203.75 45.24Sep-03 50190.00 98.76 24060.00 47.34 24203.75 47.63Oct-03 57164.00 110.35 33418.00 64.51 24203.75 46.72Nov-03 47820.00 89.20 34140.00 63.68 24203.75 45.15Dec-03 68448.00 87.17 32829.00 41.81 24203.75 30.82Jan-04 61969.00 77.84 32333.00 40.62 14738.50 18.51Feb-04 44660.00 52.43 84084.00 98.72 14738.50 17.30Mar-04 47151.00 67.12 60264.00 85.79 14738.50 20.98Apr-04 46050.00 77.88 110280.00 186.50 14738.50 24.93May-04 45663.00 83.08 23870.00 43.43 14738.50 26.82Jun-04 51510.00 100.00 22170.00 43.04 14738.50 28.61Jul-04 66061.00 126.54 33232.00 63.66 14738.50 28.23Aug-04 67363.00 129.89 40796.00 78.66 14738.50 28.42Sep-04 57840.00 116.50 23850.00 48.04 14738.50 29.68

175
Oct-04 74400.00 136.44 24211.00 44.40 14738.50 27.03Nov-04 54030.00 100.84 26700.00 49.83 14738.50 27.51Dec-04 39897.00 53.42 58249.00 78.00 14738.50 19.74Jan-05 88071.00 101.90 43090.00 49.86 18076.42 20.92Feb-05 45472.00 66.94 26348.00 38.79 18076.42 26.61Mar-05 74369.00 83.65 63426.00 71.34 18076.42 20.33Apr-05 51600.00 75.04 30270.00 44.02 18076.42 26.29May-05 42749.00 56.56 31682.00 41.92 18076.42 23.92Jun-05 51660.00 87.15 27990.00 47.22 18076.42 30.49Jul-05 32581.00 57.91 28241.00 50.19 18076.42 32.13Aug-05 49011.00 89.73 26257.00 48.07 18076.42 33.09Sep-05 56730.00 109.31 27390.00 52.77 18076.42 34.83Oct-05 49600.00 96.10 30380.00 58.86 18076.42 35.02Nov-05 45420.00 85.59 26640.00 50.20 18076.42 34.06Dec-05 73780.00 80.81 77035.00 84.38 18076.42 19.80
Date Total Energy for Producing Chemicals MJ GJ GJ/Yr GJ/MG GJ/MG-Yr
Jan-00 534242.57 534.24 6441.89 0.80 0.85Feb-00 564979.63 564.98 0.60 Mar-00 563621.54 563.62 0.65 Apr-00 531682.05 531.68 0.84 May-00 538831.07 538.83 0.87 Jun-00 533700.63 533.70 0.98 Jul-00 528006.27 528.01 0.97 Aug-00 534277.58 534.28 0.97 Sep-00 524878.30 524.88 1.00 Oct-00 530734.40 530.73 0.94 Nov-00 520547.49 520.55 0.92 Dec-00 536390.72 536.39 0.93 Jan-01 1076583.30 1076.58 13520.38 1.64 1.83

176
Feb-01 1077995.39 1078.00 1.48 Mar-01 1129265.61 1129.27 1.57 Apr-01 1069195.50 1069.20 1.83 May-01 1060241.46 1060.24 1.93 Jun-01 1115929.76 1115.93 2.22 Jul-01 1122949.66 1122.95 2.21 Aug-01 1069662.58 1069.66 2.10 Sep-01 1054190.62 1054.19 2.14 Oct-01 1061477.46 1061.48 2.08 Nov-01 1497869.71 1497.87 2.40 Dec-01 1185020.60 1185.02 1.19 Jan-02 1282729.19 1282.73 14525.26 1.40 1.97Feb-02 1206585.56 1206.59 1.96 Mar-02 1220926.26 1220.93 1.76 Apr-02 1216914.18 1216.91 2.10 May-02 1205039.45 1205.04 2.15 Jun-02 1196681.06 1196.68 2.33 Jul-02 1183768.26 1183.77 2.34 Aug-02 1188037.01 1188.04 2.34 Sep-02 1181423.07 1181.42 2.43 Oct-02 1189511.90 1189.51 2.35 Nov-02 1181820.28 1181.82 2.22 Dec-02 1271827.69 1271.83 1.32 Jan-03 823432.99 823.43 9299.28 0.93 1.24Feb-03 790455.20 790.46 1.25 Mar-03 795260.48 795.26 1.17 Apr-03 784296.51 784.30 1.17 May-03 768301.33 768.30 1.13 Jun-03 750879.23 750.88 1.37 Jul-03 748616.41 748.62 1.40 Aug-03 747244.86 747.24 1.40 Sep-03 749467.83 749.47 1.47

177
Oct-03 779963.13 779.96 1.51 Nov-03 776937.02 776.94 1.45 Dec-03 784424.66 784.42 1.00 Jan-04 523920.35 523.92 6673.46 0.66 0.91Feb-04 662149.46 662.15 0.78 Mar-04 595544.58 595.54 0.85 Apr-04 737645.76 737.65 1.25 May-04 490899.07 490.90 0.89 Jun-04 489231.39 489.23 0.95 Jul-04 528712.61 528.71 1.01 Aug-04 551002.12 551.00 1.06 Sep-04 497470.08 497.47 1.00 Oct-04 507513.83 507.51 0.93 Nov-04 503527.58 503.53 0.94 Dec-04 585847.16 585.85 0.78 Jan-05 658942.75 658.94 7468.38 0.76 0.93Feb-05 587989.12 587.99 0.87 Mar-05 709505.17 709.51 0.80 Apr-05 602514.50 602.51 0.88 May-05 601725.37 601.73 0.80 Jun-05 596042.10 596.04 1.01 Jul-05 586373.32 586.37 1.04 Aug-05 589655.80 589.66 1.08 Sep-05 597089.89 597.09 1.15 Oct-05 601739.72 601.74 1.17 Nov-05 588793.92 588.79 1.11 Dec-05 748012.36 748.01 0.82

178
Appendix C-II
Laguna Wastewater Treatment Plant – Emissions from the Plant
a. Global Warming Potential
Global Warming Potential for 2000 - Electricity
g/MJe Total for 2000
g CO2 eq.//MG
kg CO2 eq./MG
Fossil Carbon Dioxide 183 13936873872 1832013 1832Non-fossil Carbon Dioxide 0.000297 22619 3 0.003Methane CH4 0.313 23837385 72069 72Nitrous Oxide 0.0102 776809 30634 31Total GWP 1934719 1935
Global Warming Potential for 2001 - Electricity
g/MJe Total for 2001
g CO2 eq.//MG
kg CO2 eq./MG
Fossil Carbon Dioxide 183 14669394495 1987182 1987Non-fossil Carbon Dioxide 0.0003 23808 3 0.003Methane CH4 0.313 25090276 78173 78Nitrous Oxide 0.010 817638 33228 33Total GWP 2098586 2099
Global Warming Potential for 2002 - Electricity
g/MJe Total for 2002
g CO2 eq.//MG
kg CO2 eq./MG
Fossil Carbon Dioxide 183 13932478431 1887271 1887Non-fossil Carbon Dioxide 0.0003 22612 3 0.003Methane CH4 0.313 23829867 74243 74Nitrous Oxide 0.0102 776564 31558 32Total GWP 1993075 1993
Global Warming Potential for 2003 - Electricity
g/MJe Total for 2003
g CO2 eq.//MG
kg CO2 eq./MG
Fossil Carbon Dioxide 183 13324808874 1774509 1775Non-fossil Carbon Dioxide 0.0003 21626 3 0.003Methane CH4 0.313 22790520 69807 70Nitrous Oxide 0.0102 742694 29672 30Total GWP 1873991 1874
Global Warming Potential for 2004 - Electricity
g/MJe Total for 2004
g CO2 eq.//MG
kg CO2 eq./MG
Fossil Carbon Dioxide 183 16360948526 2219523 2220Non-fossil Carbon Dioxide 0.0003 26553 4 0.004Methane CH4 0.313 27983480 87313 87Nitrous Oxide 0.0102 911922 37113 37Total GWP 2343953 2344

179
Global Warming Potential for 2005 - Electricity
g/MJe Total for 2004
g CO2 eq.//MG
kg CO2 eq./MG
Fossil Carbon Dioxide 183 16502200095 2048311 2048Non-fossil Carbon Dioxide 0.0003 26782 3 0.003Methane CH4 0.313 28225074 80578 81Nitrous Oxide 0.0102 919795 34250 34Total GWP 2163143 2163
Global Warming Potential for 2000- Natural Gas
g/1000cuft Total in 2000 g CO2
eq.//MG kg CO2 eq./MG
Fossil Carbon Dioxide 62142 174973652 23000 23Non-fossil Carbon Dioxide 13 35762 5 0.005Methane CH4 172 485328 1467 1Nitrous Oxide 0.005 14 0.555 0.001Total GWP 24473 24
Global Warming Potential for 2001- Natural Gas
g/1000cuft Total in 2001 g CO2
eq.//MG kg CO2 eq./MG
Fossil Carbon Dioxide 62142 126018066 17071 17Non-fossil Carbon Dioxide 13 25756 3 0.003Methane CH4 172 349539 1089 1.089Nitrous Oxide 0.005 10 0.412 0.000Total GWP 18164 18
Global Warming Potential for 2002- Natural Gas
g/1000cuft Total in 2002 g CO2
eq.//MG kg CO2 eq./MG
Fossil Carbon Dioxide 62142 157443351 21327 21Non-fossil Carbon Dioxide 13 32179 4 0.004Methane CH4 172 436704 1361 1Nitrous Oxide 0.005 13 0.515 0.001Total GWP 22692 23
Global Warming Potential for 2003- Natural Gas
g/1000cuft Total in 2003 g CO2
eq.//MG kg CO2 eq./MG
Fossil Carbon Dioxide 62142 174787225 23277 23.277Non-fossil Carbon Dioxide 13 35724 5 0.005Methane CH4 172 484811 1485 1Nitrous Oxide 0.005 14 0.562 0.001Total GWP 24767 25

180
Global Warming Potential for 2004- Natural Gas
g/1000cuft Total in 2004 g CO2
eq.//MG kg CO2 eq./MG
Fossil Carbon Dioxide 62142 163775636 22218 22Non-fossil Carbon Dioxide 13 33473 5 0.005Methane CH4 172 454268 1417 1Nitrous Oxide 0.005 13 0.536 0.001Total GWP 23640 24
Global Warming Potential for 2005- Natural Gas Combustion
g/1000cuft Total in 2005 g CO2
eq.//MG kg CO2 eq./MG
Fossil Carbon Dioxide 54885 153737477 19082 19Non-fossil Carbon Dioxide 0 0 0 0Methane CH4 0.1360 381 1 0.001Nitrous Oxide 2.268 6353 236.563 0.24Total GWP 19320 19.32
Global Warming Potential for 2005- Diesel
g/1000cuft Total in
2005 g CO2
eq.//MG kg CO2 eq./MG
Fossil Carbon Dioxide 11626480.00 60612543.27 7523.443 7.523Non-fossil Carbon Dioxide 2766.913 14424.80 1.790 0.002Methane CH4 1837.049 9577.12 27.341 0.027Nitrous Oxide 0.007 0.04 0.001 0.000001Total GWP 7552.58 7.553
Global Warming Potential for 2005-
Chemicals
kg Co2/Yr kg Co2/MG
Carbon Dioxide 17756 2.2Methane CH4 744 0.09Nitrous Oxide 240 0.03Total GWP 2.3

181
b. Eutrophication Potential
Eutrophication Potential for 2005- Electricity Atmospheric Aquatic
g/MJe Total in 2005 kg N eq./MG g/MJe Total in 2005 kg N eq./MG NOx 0.475 39296861.910 0.195 N NH3 0.00035 28955.582 0.0004 NH3 0.000151 12385.337 0.0012
NH4+ COD 0.00466 382222.992 0.00237 NO3- NO3- 0.0000473 3879.645 0.000048 PO43- PO43- 0.000000002 0.152 0.00000014
P P Total 196 g 4
Eutrophication Potential for 2005- Natural Gas Combustion Atmospheric Aquatic
g/1000 cuft. Total in 2004 g N eq./MG g/1000 cuft. Total in 2004 g N eq./MG NOx 176.9 495514.590 2.460 N NH3 1.361 3812.297 0.0568 NH3 0.0245 68.627 0.006644
NH4+ COD 10.886 30492.775 0.18924 NO3- NO3- 0 0.000 0.00000 PO43- PO43- 0 0.000 0.00000
P P Total 2.517 0.2
Eutrophication Potential for 2005- Chemicals Atmospheric Aquatic
g N eq./Yr g N eq./MG g N eq./Yr g N eq./MG NOx 1398.98 0.174 N NH3 3.09 0.000 NH3 0.03 0.000004
NH4+ COD 17.15 0.002129 NO3- NO3- 0.35 0.000044 PO43- PO43- 0.21 0.000026
P P Total 0.174 0.002
Eutrophication Potential for 2005- Diesel Atmospheric Aquatic
g/1000 cuft. Total in 2005 kg N eq./MG g/1000 cuft. Total in 2005 kg N eq./MG NOx 216950.400 1131031.53 0.006 N NH3 18.144 94.59 0.000001 NH3 6.35 33.105 0.000003
NH4+ COD 39.463 205.733 0.000001 NO3- NO3- 0.018 0.094 0.000000001 PO43- PO43- 1.588 8.279 0.000002
P P Total 6 0.007

182
c. Acidification Potential
Acidification Potential for 2000- Electricity Acidification Potential for 2001- Electricity g/MJe Total in 2000 g SO2 equiv./MG g/MJeTotal in 2001 g SO2 equiv./MGSO2 38 2897172209 381 SO2 38 3049447275 413HCl 3 255588406 34 HCl 3 269022106 36NOx 19 1448444832 190 NOx 19 1524574939 207NH3 0.03 2545307 0 NH3 0.03 2679088 0Total 605 Total 656 Acidification Potential for 2002- Electricity Acidification Potential for 2003- Electricity g/MJe Total in 2002 kg SO2 equiv./MG g/MJeTotal in 2003 kg SO2 equiv./MGSO2 38 2896258492 392 SO2 38 2769937240 369HCl 3 255507798 35 HCl 3 244363743 33NOx 19 1447988018 196 NOx 19 1384833552 184NH3 0 2544505 0 NH3 0.03 2433525 0Total 623 Total 586 Acidification Potential for 2004- Electricity Acidification Potential for 2005- Electricity g/MJe Total in 2004 kg SO2 equiv./MG g/MJeTotal in 2005 kg SO2 equiv./MGSO2 38 3120260987 423 SO2 38 3147199631 391HCl 3 275269288 37 HCl 3 277645814 34NOx 19 1559978343 212 NOx 19 1573446351 195NH3 0.03 2741302 0 NH3 0.03 2764969 0Total 673 Total 621
Acidification Potential for 2005- Diesel g/1000 gallonsTotal in 2005kg SO2 equiv./MG
Sulfur Dioxide 25854.77 134789.1508 0.017Hydrochloric Acid 11.34 59.11903179 0.00001
Nitrous Oxides 216590.4 1129154.739 0.098Ammonia 18.144 94.59045086 0.000
Total 0.11
Acidification Potential for 2005- Chemicals
moles H+/Yr
moles H+ eq./MG
Sulfur Dioxide 14357 1.782Hydrochloric
Acid 296 0.037Nitrous Oxides 2121 0.263
Ammonia 3 0.000Total 2.08

183
Appendix D
Details of YCUA Wastewater Treatment plant
a. Background
The Ypsilanti Community Utilities Authority WWTP is a tertiary treatment plant with
a capacity of 29 MGD. The details of the case study have already been compiled in
the ongoing ‘Preliminary Application of Life Cycle Assessment to U.S. Water and
Wastewater Treatment Facilities’ conducted by Center for Sustainable Systems at the
University of Michigan, Ann Arbor. For the purpose of comparisons with recent case
studies of Ann Arbor and Laguna WWTPs some of the calculations have been
upgraded or further calculations have been made as required.
b. Plant Influent
The influent quantity at YCUA WWTP is generally lower in winters and a little
higher during summers. The total quantity of influent does not fluctuate drastically
and ranges from 18 MGD to 25 MGD
YCUA WWTP - Total Plant Influent per month
0.00
5.00
10.00
15.00
20.00
25.00
30.00
Jan-
01
May
-01
Sep
-01
Jan-
02
May
-02
Sep
-02
Dec
-02
Apr
-03
Aug
-03
Dec
-03
Apr
-04
Aug
-04
Dec
-04
MG
D
Influent

184
c. Electricity Consumption
The electricity consumption at YCUA includes in-plant electricity disinfection and
electricity consumed within buildings. There is a sudden drop in electricity usage at
the plant from Dec-03 to April 04.
YCUA WWTP - Total Plant Influent per month
0
100
200
300
400
500
600
700
800
900
Jan-
01
May
-01
Sep-
01
Jan-
02
May
-02
Sep-
02
Dec
-02
Apr-
03
Aug-
03
Dec
-03
Apr-
04
Aug-
04
Dec
-04
MG
per
mon
th Influent
YCUA WWTP - Electricity Consumption per month
-
500,000
1,000,000
1,500,000
2,000,000
2,500,000
Jan-
01
May
-01
Sep-
01
Jan-
02
May
-02
Sep-
02
Dec
-02
Apr-
03
Aug-
03
Dec
-03
Apr-
04
Aug-
04
Dec
-04
kWh
per m
onth
Electricity

185
d. Chemicals Utilized for Treatment
Chlorine, Ferric Chloride, Ferrous Chloride, Lime, and a polymer are used for treatment
at YCUA WWTP. The average consumption of lime during Jan-01 to may-04 was
342,448 Lbs per month. Average consumption of Ferric Chloride for the same period was
127,910 Lbs per month
YCUA WWTP - Electricity Consumption per Million Gallon Wastewater Treated at the Plant
0
500
1000
1500
2000
2500
3000
3500
4000
Jan-
01
May
-01
Sep
-01
Jan-
02
May
-02
Sep
-02
Dec
-02
Apr
-03
Aug
-03
Dec
-03
Apr
-04
Aug
-04
Dec
-04
kWh
/ MG Electricity
YCUA WWTP - Chemicals Utilized for Treatment per month
0
100000
200000
300000
400000
500000
600000
700000
800000
Jan-
01
Jul-0
1
Jan-
02
Jul-0
2
Jan-
03
Jul-0
3
Jan-
04
Jul-0
4
Lbs
per m
onth
Ferric ChlorideLime

186
The average consumption of Chlorine from Jan-01 to may-03 was 9964 Lbs per month.
The average consumption of Polymer was 11852 Lbs per month. An exceptionally high
amount was consumed in Jul-02. The average consumption of ferrous Chloride was
35,362 Lbs month.
The total energy consumed per month in the form of chemicals used at the plant-
Chlorine, Ferric Chloride, Ferrous Chloride, Lime, and a polymer.
YCUA WWTP - Chemicals Utilized for Treatment per month
0
20000
40000
60000
80000
100000
120000
140000
160000
Jan-
01
Jul-0
1
Jan-
02
Jul-0
2
Jan-
03
Jul-0
3
Jan-
04
Jul-0
4
Lbs
per m
onth Chlorine
Polymer
Ferrous Chloride

187
e. Sludge Handling
On an average, more than 75% of the total sludge was incinerated at the plant from
Jan’01 to March’04. No Incineration was reported after April’04.
Year Total
Sludge Incineration Landfill Total Energy
Wet Sludge Ash Nat. Gas Sludge Sludge and Ash Diesel
Nat.gas+ diesel
Metric tons
Metric tons
Metric tons GJ
Metric tons
Metric tons
metric ton-miles GJ GJ
2001
30,377 25,036 5,829
84,779
5,341
11,169
207,957
919
85,698
2002
27,459 20,081 8,037
89,982
6,840
14,876
284,363
1,256
91,238
2003
33,063 24,684 6,020
82,723
8,380
14,399
374,451
1,685
84,409
2004
31,555 6,559 3,616
10,232
24,996
28,612
575,323
2,542
12,774
When the quantity of waste incinerated is reduced significantly in 2004, the energy
consumed in GJ reduces significantly as well. Further, the volume of sludge produced per
month and the weight of the dry solids at YCUA WWTP shows a sudden increase in Jan-
03.
YCUA WWTP - Volume of Sludge Produced per Month
0
1000
2000
3000
4000
5000
6000
7000
8000
Jan-
01
May
-01
Sep
-01
Jan-
02
May
-02
Sep
-02
Jan-
03
May
-03
Sep
-03
Jan-
04
May
-04
Sep
-04
kGal
per
mon
th
Total SludgeProduced

188
Since natural gas has higher energy intensity than diesel the energy consumption for
incineration is significantly higher than land-filling.
YCUA WWTP - Weight of Dry Solids Produced per Month
0
300000
600000
900000
1200000
1500000
1800000
2100000
Jan-
01
May
-01
Sep-
01
Jan-
02
May
-02
Sep-
02
Jan-
03
May
-03
Sep-
03
Jan-
04
May
-04
Sep-
04
Lbs
per m
onth
DrySolids
YCUA WWTP - Wet-cake Disposed per month
0
500
1000
1500
2000
2500
3000
3500
4000
Jan-
01
May
-01
Sep-
01
Jan-
02
May
-02
Sep-
02
Jan-
03
May
-03
Sep-
03
Jan-
04
May
-04
Sep-
04
met
ric to
ns p
er m
onth
Incineration
Landfill

189
YCUA WWTP - Energy Consumed for Disposal per month
0
2000
4000
6000
8000
10000
12000
Jan-
01
May
-01
Sep-
01
Jan-
02
May
-02
Sep-
02
Jan-
03
May
-03
Sep-
03
Jan-
04
May
-04
Sep-
04
GJ
per m
onth Incineration
Landfill
YCUA WWTP - Energy Consumed for Disposal per month
0
2
4
6
8
10
Jan-
01
May
-01
Sep-
01
Jan-
02
May
-02
Sep-
02
Jan-
03
May
-03
Sep-
03
Jan-
04
May
-04
Sep-
04
GJ/
met
ric to
n of
slu
dge
disp
osed
Incineration
Landfill

190
f. Life-cycle Energy for Operation of YCUA WWTP
The average Life Cycle Energy for the YCUA WWTP from 2001 to 2004 is around 21 GJ/MG.
YCUA WWTP - Total Energy Consumed per Year
-
50,000
100,000
150,000
200,000
250,000
2001 2002 2003 2004
GJ
/ Yr
Chemicals
SludgeDisposalElectricity
YCUA WWTP - Total Energy Consumed per MG Wastewater Treated at the Plant
0
5
10
15
20
25
30
2001 2002 2003 2004
GJ
/ MG
-yr
Chemicals
SludgeDisposalElectricity
Year Electricity Sludge Disposal Chemicals Total GJ GJ/MG % GJ GJ/MG % GJ GJ/MG % GJ GJ/MG 2001 88794 11 44 85698 12 46 19429 2 10 193921 26 2002 92561 11 45 91238 11 44 22271 3 11 206070 25 2003 84978 11 49 70986 9 41 18896 2 11 174861 22 2004 74817 9 78 12774 2 13 8679 1 9 96270 12

191
g. Life-cycle Impacts from Operation of YCUA WWTP
Global Warming Potential for YCUA WWTP (kgs of CO2 eq./MG) 2001 Electricity Nat. Gas Diesel Chemicals TotalCarbon Dioxide 2258 549 8 27 2842Methane CH4 89 35 0.03 0.49 124Nitrous Oxide 38 0.01 0.000001 0.04 38Total GWP/MG 2385 584 8 28 3004% of Total GWP/MG 79 19 0 1 2002 Electricity Nat. Gas Diesel Chemicals TotalCarbon Dioxide 2283 565 11 26 2885Methane CH4 90 36 0.04 0.48 126Nitrous Oxide 38 0.01 0.000002 0.04 38Total GWP/MG 2411 601 11 27 3050% of Total GWP/MG 79 20 0 1 2003 Electricity Nat. Gas Diesel Chemicals TotalCarbon Dioxide 2151 533 15 27 2726Methane CH4 85 34 0.05 0.49 119Nitrous Oxide 36 0.01 0.000003 0.04 36Total GWP/MG 2272 567 15 27 2881% of Total GWP/MG 79 19.69 0.51 0.95 2004 Electricity Nat. Gas Diesel Chemicals TotalCarbon Dioxide 1833 64 22 26 1944Methane CH4 72 4 0.08 0.48 77Nitrous Oxide 31 0.002 0.000004 0.04 31Total GWP/MG 1935 68 22 27 2052% of Total GWP/MG 94 3 1 1
Eutrophication Potential for YCUA WWTP 2001 2002
Atmospheric Aquatic Atmospheric Aquatic g N eq./MG g N eq./MG g N eq./MG g N eq./MG
NOx 234.609 N NOx 237.182 N NH3 0.520 NH3 1.454 NH3 0.526 NH3 1.469
NH4+ COD 2.885 NH4+ COD 2.916NO3
- NO3- 0.0584 NO3
- NO3- 0.0590
PO43- PO4
3- 0.0003 PO43- PO4
3- 0.0003P P P P
Total 235.129 4.397 Total 237.707 4.445

192
2003 2004
Atmospheric Aquatic Atmospheric Aquatic g N eq./MG g N eq./MG g N eq./MG g N eq./MG
NOx 223.498 N NOx 190.361 N NH3 0.495 NH3 1.385 NH3 0.421 NH3 1.180
NH4+ COD 2.748 NH4+ COD 2.335NO3
- NO3- 0.0556 NO3
- NO3- 0.0474
PO43- PO4
3- 0.0003 PO43- PO4
3- 0.0002P P P P
Total 223.993 4.189 Total 190.782 3.562
Acidification Potential for YCUA WWTP 2001 2002 2003 2004 g SO2 equiv./MG
SO2 872 889 839 431 HCl 41 42 40 34 NOx 323 330 315 217 NH3 2 2 2 0.5
Total/MG 1238 1263 1194 682
YCUA Wastewater Treatment Plant- Emissions from Electricity and Fuels
Global Warming Potential Eutrophication
Potential Acidification Potential
kg CO2 equiv / MG kg Phosphate equiv /
MG kg SO2 equiv / MG Year
Atmospheric Aquatic 2001 3004.465 235.129 4.397 1238.0832002 3049.588 237.707 4.445 1262.7052003 2880.999 223.993 4.1886 1194.3652004 2051.637 190.782 3.5622 681.597

193
Appendix E
Water Quality Information on Ann Arbor WWTP Date Influent pH BOD 5 BOD 5 SS SS Total Total Vol. SS Vol. SS NH3-NOrg-NAlkalinity
Temp. PhosphorousPhosphorous Month/Yr Degree F SU mg/l Lbs mg/l Lbs mg/l Lbs mg/l Lbs mg/l mg/l mg/l Jan-00 56.70 7.10265.00 1173109.00335.001498667.00 6.10 27062.00 265.00839788.00 18.40 10.90 224.00Feb-00 54.80 7.10268.00 1121545.00454.001893316.00 6.30 26483.00 322.00973989.00 17.20 12.10 214.00Mar-00 56.60 7.10243.00 1091883.00305.001374680.00 5.70 25508.00 250.00695815.00 15.70 11.30 207.00Apr-00 58.80 7.10260.00 1175230.00330.001495053.00 5.90 25713.00 286.00901554.00 16.00 14.20 205.00May-00 62.90 7.10182.00 907448.00283.001397109.00 5.00 24747.00 264.00917762.00 12.60 11.00 225.00Jun-00 66.40 7.10193.00 977698.00289.001496746.00 4.80 24195.00 262.00974766.00 10.80 11.00 210.00Jul-00 69.00 7.00191.00 946820.00257.001273823.00 4.90 24166.00 231.00662948.00 10.50 8.90 205.00Aug-00 70.30 7.00168.00 856549.00273.001389199.00 4.80 24315.00 237.00749272.00 10.40 9.80 206.00Sep-00 70.90 7.00210.00 1047156.00366.001824045.00 6.20 31003.00 273.00791596.00 16.00 12.90 Oct-00 68.20 7.00230.00 1125460.00327.001604297.00 6.20 30435.00 285.00858754.00 16.90 13.70 Nov-00 64.50 7.10252.00 1131072.00349.001566899.00 6.20 27717.00 285.00699462.00 15.50 13.50 Dec-00 58.30 7.10232.00 1057153.00317.001447384.00 5.90 26769.00 261.00552432.00 15.10 12.20 Jan-01 54.90 7.30209.00 999999.00279.001333439.00 5.40 25749.00 240.00708126.00 15.70 11.80 Feb-01 52.90 7.50146.00 746839.00184.00 947674.00 4.30 21960.00 131.00452875.00 13.30 7.80 Mar-01 53.10 7.30173.00 866169.00195.00 972681.00 4.80 24128.00 160.00444525.00 14.80 9.80 Apr-01 55.80 7.40176.00 871154.00222.001098458.00 4.70 23169.00 166.00468645.00 15.20 10.90 May-01 60.80 7.30154.00 765333.00187.00 930774.00 4.50 22236.00 141.00341653.00 13.40 8.90 Jun-01 64.40 7.00146.00 715646.00185.00 905621.00 4.30 21352.00 147.00451651.00 13.50 9.90 Jul-01 69.80 7.10149.00 684832.00199.00 915045.00 5.30 24590.00 154.00458643.00 13.40 9.60 Aug-01 72.30 7.10152.00 718519.00188.00 891559.00 5.60 26567.00 151.00461849.00 14.90 10.60 Sep-01 70.80 7.20175.00 817435.00210.00 982689.00 5.20 24470.00 163.00387793.00 17.40 9.90 Oct-01 66.60 7.30188.00 993286.00262.001438648.00 5.30 29005.00 229.00840996.00 18.50 15.30 Nov-01 7.40 55.00 972360.00229.001062976.00 6.70 31183.00 191.00566229.00 19.90 12.10 Dec-01 59.50 7.40175.00 840669.00222.001062866.00 5.00 24429.00 180.00329520.00 18.30 13.40 Jan-02 56.10 7.40186.00 860458.00237.001094805.00 5.30 24530.00 188.00565829.00 17.90 11.6

194
Feb-02 55.60 7.50165.00 832147.00204.001036722.00 4.80 24448.00 165.00450093.00 12.20 8.70 Mar-02 53.70 7.50176.00 890765.00185.00 978659.00 4.90 26022.00 155.00293408.00 13.80 10.00 264.00Apr-02 57.60 7.50166.00 881642.00193.001023421.00 4.80 25521.00 167.00592394.00 14.30 9.50 272.00May-02 59.10 7.20160.00 793288.00155.00 769438.00 4.80 23773.00 124.00406355.00 13.80 8.60 299.00Jun-02 65.00 7.00158.00 716052.00173.00 785811.00 4.90 22481.00 156.00475760.00 14.50 9.70 232.00Jul-02 70.80 7.00156.00 682057.00172.00 752558.00 4.80 21214.00 140.00320603.00 14.90 10.20 217.00Aug-02 72.00 6.90156.00 735697.00172.00 811475.00 5.10 23992.00 141.00406301.00 14.20 9.40 203.00Sep-02 72.80 7.00173.00 820028.00189.00 896693.00 5.60 26507.00 177.00526611.00 17.00 11.10 211.00Oct-02 68.80 7.10183.00 826246.00191.00 892296.00 5.80 26869.00 167.00398956.00 18.00 10.80 212.00Nov-02 63.30 7.40204.00 776273.00208.00 925710.00 6.00 26712.00 191.00400760.00 18.00 11.60 207.00Dec-02 58.00 7.00218.00 913623.00284.001215392.00 5.80 24595.00 194.00434971.00 19.60 9.00 224.00Jan-03 55.70 7.10228.00 980847.00243.001048301.00 6.20 26688.00 220.00614468.00 17.50 10.80 231.00Feb-03 53.60 7.20210.00 692961.00210.00 797568.00 6.10 22972.00 191.00490646.00 17.30 10.80 226.00Mar-03 52.90 7.20216.00 1006971.00210.00 972728.00 5.70 26890.00 193.00513053.00 16.70 10.40 233.00Apr-03 56.10 7.20201.00 982978.00187.00 915589.00 5.40 26518.00 169.00543037.00 17.90 12.70 232.00May-03 59.40 7.10168.00 846855.00164.00 824466.00 4.80 24092.00 154.00399516.00 13.30 8.40 238.00Jun-03 63.90 7.30188.00 710877.00224.001010014.00 5.40 24389.00 207.00437900.00 16.80 11.20 231.00Jul-03 69.00 7.30179.00 818841.00207.00 948465.00 5.30 24005.00 188.00587922.00 16.50 10.40 216.00Aug-03 71.10 7.30177.00 829220.00208.00 976364.00 5.00 23658.00 186.00505614.00 15.50 11.20 212.00Sep-03 71.00 7.30208.00 943988.00262.001236779.00 5.80 27303.00 244.00853065.00 230.00Oct-03 67.30 7.10271.00 1149500.00370.001678644.00 6.70 30450.00 355.00938822.00 255.00Nov-03 63.40 7.40240.00 1088031.00280.001261932.00 6.20 28112.00 256.00590769.00 245.00Dec-03 58.80 7.20190.00 739889.00188.00 838417.00 5.30 23847.00 159.00394829.00 251.00Jan-04 55.80 7.20184.00 830063.00194.00 876027.00 5.70 25667.00 159.00354870.00 253.00Feb-04 54.30 7.20204.00 702625.00187.00 777605.00 5.60 23400.00 166.00474202.00 249.00Mar-04 54.10 7.20167.00 762344.00173.00 944919.00 5.00 26426.00 152.00469779.00 264.00Apr-04 57.40 7.20188.00 860621.00207.00 943591.00 5.60 25755.00 173.00427659.00 242.00May-04 62.60 7.20151.00 796377.00188.001013370.00 4.60 24740.00 151.00455487.00 267.00Jun-04 70.60 7.50142.00 566650.00162.00 762690.00 4.80 22531.00 143.00351778.00 251.00Jul-04 74.90 7.30156.00 717086.00173.00 788217.00 5.00 22909.00 147.00325410.00 229.00Aug-04 75.90 7.30151.00 690362.00160.00 736452.00 5.10 23596.00 136.00373262.00 232.00Sep-04 77.60 7.10182.00 826513.00181.00 823285.00 5.90 26852.00 175.00531688.00 238.00

195
Oct-04 73.70 7.60201.00 897573.00187.00 836705.00 6.20 27517.00 177.00455944.00 246.00Nov-04 70.10 7.70200.00 856754.00197.00 841303.00 6.00 25655.00 182.00394879.00 233.00Dec-04 66.20 7.60186.00 836466.00191.00 866179.00 5.50 25005.00 176.00471057.00 240.00Jan-05 60.90 7.20163.00 808694.00176.00 880107.00 4.70 23589.00 166.00498295.00 10.10 6.40 260.00Feb-05 63.10 7.30165.00 756903.00145.00 674136.00 4.40 20094.00 126.00326751.00 212.00Mar-05 63.00 7.10165.00 830342.00150.00 749663.00 4.30 20957.00 130.00501985.00 256.00Apr-05 62.90 7.10183.00 833797.00199.00 910598.00 5.00 22844.00 170.00645726.00 232.00May-05 65.90 7.10211.00 897621.00242.001059944.00 5.40 23816.00 211.00778175.00 247.00Jun-05 72.30 7.10193.00 843618.00227.001028159.00 4.70 21128.00 202.00707062.00 228.00Jul-05 76.60 7.10169.00 849685.00217.001090980.00 4.50 22563.00 188.00818005.00 205.00Aug-05 78.60 7.00210.00 934017.00253.001164778.00 5.00 22859.00 214.00826823.00 245.00Sep-05 79.10 7.00226.00 1026008.00295.001340160.00 5.50 24338.00 240.00878786.00 Oct-05 75.10 7.10205.00 782350.00251.001134021.00 5.40 23737.00 223.00785083.00 Nov-05 71.20 7.10226.00 766748.00219.00 900723.00 5.20 20435.00 181.00540041.00 Dec-05 64.70 7.10227.00 962228.00234.00 989533.00 5.70 24171.00 225.00676141.00
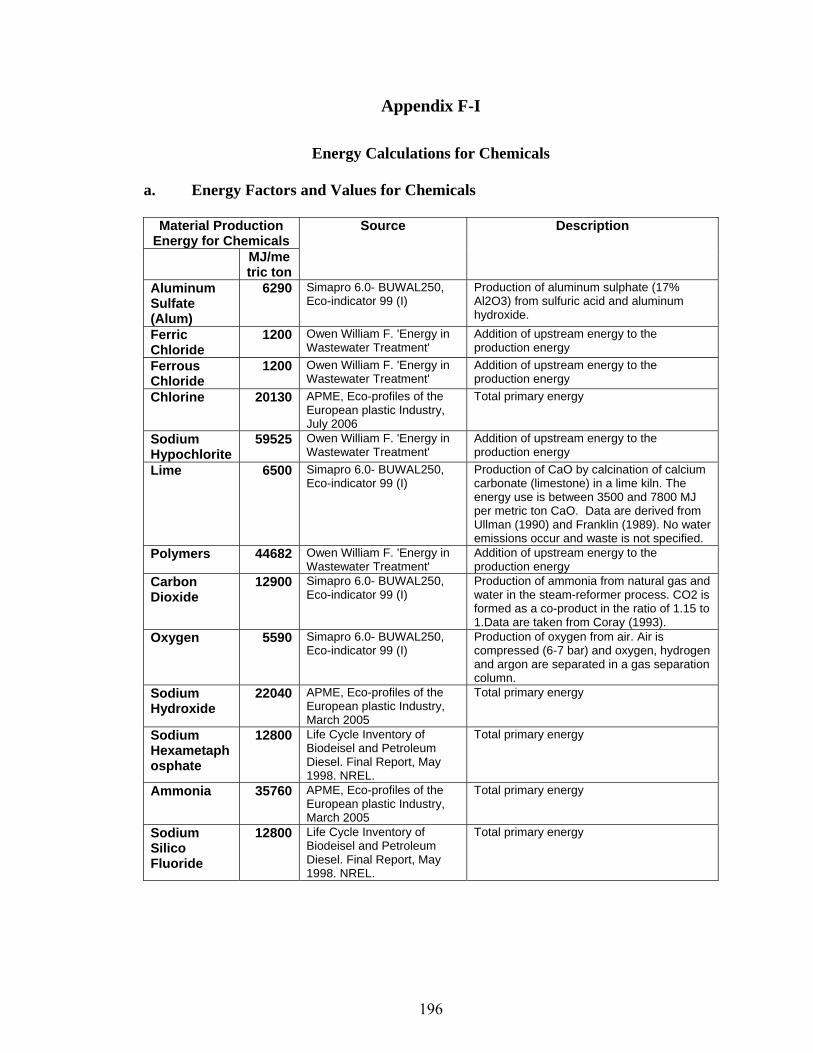
196
Appendix F-I
Energy Calculations for Chemicals
a. Energy Factors and Values for Chemicals
Material Production Energy for Chemicals
MJ/metric ton
Source Description
Aluminum Sulfate (Alum)
6290 Simapro 6.0- BUWAL250, Eco-indicator 99 (I)
Production of aluminum sulphate (17% Al2O3) from sulfuric acid and aluminum hydroxide.
Ferric Chloride
1200 Owen William F. 'Energy in Wastewater Treatment'
Addition of upstream energy to the production energy
Ferrous Chloride
1200 Owen William F. 'Energy in Wastewater Treatment'
Addition of upstream energy to the production energy
Chlorine 20130 APME, Eco-profiles of the European plastic Industry, July 2006
Total primary energy
Sodium Hypochlorite
59525 Owen William F. 'Energy in Wastewater Treatment'
Addition of upstream energy to the production energy
Lime 6500 Simapro 6.0- BUWAL250, Eco-indicator 99 (I)
Production of CaO by calcination of calcium carbonate (limestone) in a lime kiln. The energy use is between 3500 and 7800 MJ per metric ton CaO. Data are derived from Ullman (1990) and Franklin (1989). No water emissions occur and waste is not specified.
Polymers 44682 Owen William F. 'Energy in Wastewater Treatment'
Addition of upstream energy to the production energy
Carbon Dioxide
12900 Simapro 6.0- BUWAL250, Eco-indicator 99 (I)
Production of ammonia from natural gas and water in the steam-reformer process. CO2 is formed as a co-product in the ratio of 1.15 to 1.Data are taken from Coray (1993).
Oxygen 5590 Simapro 6.0- BUWAL250, Eco-indicator 99 (I)
Production of oxygen from air. Air is compressed (6-7 bar) and oxygen, hydrogen and argon are separated in a gas separation column.
Sodium Hydroxide
22040 APME, Eco-profiles of the European plastic Industry, March 2005
Total primary energy
Sodium Hexametaphosphate
12800 Life Cycle Inventory of Biodeisel and Petroleum Diesel. Final Report, May 1998. NREL.
Total primary energy
Ammonia 35760 APME, Eco-profiles of the European plastic Industry, March 2005
Total primary energy
Sodium Silico Fluoride
12800 Life Cycle Inventory of Biodeisel and Petroleum Diesel. Final Report, May 1998. NREL.
Total primary energy

197
b. Energy Calculation for Fluoride Fluorosilicic acid produced as a by product from wet process for phosphoric acid production= 20-40kg / tonne of P2O5 (The quantity of fluosilicic acid obtained as a by-product in phosphoric acid production is normally in the range 20 to 40 Kg (as H2SiF6 100%) per ton of P2O5 produced. http://www.fluoridealert.org/fertilizer-waste.htm) Energy for production of P2O5 = 12.8 MJ/kg (Life Cycle Inventory of Biodiesel and Petroleum Diesel. Final Report, May 1998. NREL. Page 202, table 121.) 12.8 MJ/kg * 1000kg/tonne = 12800 MJ/tonne Mass of H2SiF6 to total mass = 30 kg / 1030 kg = 3/103 = 0.029 Mass of P2O5 to total mass = 1000 kg / 1030 kg = 0.97 = approximately equal to 1 Hence, the energy intensity for H2SiF6 will be the same as P2O5 = 12800 MJ/tonne
= 12800 MJ/2204.623 lbs = 1.613 kWh/lb
c. Energy Calculation for Sodium Hexametaphosphate Basic information: 1) Chemical formula: (NaPO3)6 2) Molecular weight: 611.82 Food grade: 1) Total phosphate (as P2O5):68% min. 2) Inactive phosphate (as P2O5):7.5% max. 3) Solubility: Pass 4) Insoluble matter in water: 0.05% max. 5) Iron (Fe):0.05% max. 6) pH value: 5.8 - 7.0 7) Heavy metals (as Pb):0.001% max. 8) Arsenic (As):0.0003% max. 9) Fluoride (as F):0.003% max. Since more than 68% of it is P2O5, the energy intensity for (NaPO3)6 would be more or less the same as that of P2O5 = 12.8 MJ/kg Hence, energy for (NaPO3)6 = 12.8 MJ/kg = 12800 MJ/ tonne = 12800 MJ/2204.623 lbs

198
Appendix F-II
Emissions calculations a. Emissions from Electricity Source: Kim, Seungdo. Dale, Bruce E. ‘Life Cycle Inventory Information of the United States Electricity System’ International Journal of Life Cycle Assessment, 10 (4). 2005. Appendix B: Environmental Burdens associated with generating1 MJe electricity in the US in 2000 (based on generation)
Global Warming Potential g/MJe
Fossil CO2 183Non-Fossil CO3 0.000297
CH4 0.313N2O 0.0102
Eutrophication Potential
Atmospheric g/MJe NOx 0.475NH3 0.00035
NH4+ NO3
- PO4
3- P
Aquatic g/MJe N
NH3 0.000151COD 0.00466NO3
- 0.0000473PO4
3- 1.85E-09P
Acidification Potential g/MJe
SO2 0.749HCl 0.0413NOx 0.475NH3 0.00035

199
b. Emissions from Natural Gas Source: Franklin's Appendix A. Table A-20
Global Warming Potential lbs/1000cuft g/cuft
Fossil CO2 137 62142.15Non-Fossil CO2 0.028 12.701
CH4 0.38 172.365N2O 0.000012 0.0054
Eutrophication Potential
Atmospheric lbs/1000cuft g/1000cuftNOx 0.51 231.332NH3 0.003 1.361
NH4+ NO3
- PO4
3- P
Aquatic lbs/1000cuft g/1000cuftN
NH3 0.000059 0.027COD 0.043 19.504NO3
- 0.00000018 0.000082PO4
3- 0.000011 0.005P
Acidification Potential
lbs/1000cuft g/1000cuftSO2 1.97 893.577HCl 0.000098 0.044NOx 0.51 231.332NH3 0.003 1.361

200
c. Emissions from Diesel Source: Franklin's Appendix A. Table A-23
Global Warming Potential lbs/1000gal. g/1000gal
Fossil CO2 25632 11626480.00 Non-Fossil CO2 6.1 2766.913
CH4 4.05 1837.049 N2O 0.000015 0.007
Eutrophication Potential
Atmospheric lbs/1000gal. g/1000gal NOx 477.5 216950.400 NH3 0.04 18.144
NH4+ NO3
- PO4
3- P
Aquatic lbs/1000gal. g/1000gal N
NH3 0.014 6.35 COD 0.87 39.463 NO3
- 0.000039 0.018 PO4
3- 0.0035 1.588 P
Acidification Potential
lbs/1000gal. g/1000gal SO2 57 25854.77 HCl 0.025 11.34 NOx 477.5 216590.4 NH3 0.04 18.144

201
Bibliography
1. UNO. ‘International Decade for Action: Water for Life, 2005-2025’. Factsheet on Water and Sanitation. United Nations Organization. Extracted on January 10, 2006. <http://www.un.org/waterforlifedecade/factsheet.html>
2. Seckler, David. Amarisinghe, Upali. Molden, David. De Silva, Radhika. Barker, Randolph. ‘World Water Demand and Supply, 1990 to 2025: Scenarios and Isuues’. International Water Management Institute. Research Report 19. IWMI, 1998.
3. UNEP, 2002. Global Environmental Outlook, Nairobi, Kenya.
4. Baker M.N., Taras M.J., 1981, The quest for pure water – The history of the twentieth century, volume I and II, Denver: AWWA
5. James, Kevin. Campbell, Stephanie L. Godlove, Christopher E. ‘Watergy: Taking Advantage of Untapped Energy and Water Efficiency Opportunities in Municipal Water Systems’. Alliance to Save Energy and USAID.
6. Center for Sustainable Systems. ‘U.S. Water Supply and Distribution’ Factsheet. August 2005.
7. EPRI. ‘Water and Sustainability: U.S. Electricity Consumption for Water Supply and Treatment- The Next Half Century’. Vol.4, Electric Power Research Institute, 2002
8. Center for Sustainable Systems. ‘US Wastewater Treatment’ Factsheet. August 2005.
9. Energy Information Administration. ‘Electric Power Annual 2005 – Data Tables’. Extracted on January 5, 2007. <http://www.eia.doe.gov/cneaf/electricity/epa/generation_state.xls>
10. USEPA, ‘Inventory of U.S. Greenhouse Gas Emissions and Sinks, 1990-2004, 2004’. April 15, 2006. US Environmental Protection Agency. 1200 Pennsylvania Avenue, N.W. Washington, DC 20460. USA
11. ISO 14040. ‘Environmental Management- life-cycle Assessment- Principles and Framework’. 1997
12. SETAC. ‘Guidelines for Life-Cycle Assessment: A Code of Practice’. Society for Environmental Toxicology and Chemistry. 1993.
13. Franklin Associates ‘Appendix A- Energy Requirements and Environment Emissions for Fuel Consumption. December 2000. Table A-9. page A-24.
14. Kim, Seungdo. Dale, Bruce E. ‘Life-cycle Inventory Information of the United States Electricity System’ International Journal of Life-cycle Assessment,10 (4). 2005
202
15. Franklin Associates ‘Appendix A- Energy Requirements and Environment Emissions for Fuel Consumption. December 2000.Table A-20. page A-55
16. Franklin Associates ‘Appendix A- Energy Requirements and Environment Emissions for Fuel Consumption. December 2000.Table A-23. page A-61
17. IPCC. ‘Good Practice Guidance and Uncertainty Management in National Greenhouse Gas Inventories’. Intergovernmental Panel on Climate Change. 2000 18. EPA. ‘The History of Drinking Water Treatment’ Factsheet. United States Environmental Protection Agency. EPA-816-F-00-006. February 2000. 19. Owen William F. ‘Energy in Wastewater Treatment’. Englewoods Cliffs, N.J. Prentice-Hall. 1982 20. Fuller, Jennifer. ‘Energy Efficient Alternatives for the Fortuna Wastewater Treatment facility’. The Community Clean Water Institute, Fortuna Water Quality Project. 2002
21. Raluy, Gemma R. Serra, Luis. Uche Javier. “Life-cycle Assessment of Water Production Technologies” International Journal of Life-cycle Assessments 10 (4) 285. 2005
22. Stokes, Jenifer. Horvath, Arpad. “Life-cycle Energy Assessment of Alternative Water Supply Systems”. International Journal of Life-cycle Assessments 11 (5) 335-343. 2006
23. NREL. “Life-cycle Inventory of Biodiesel fuel and Petroleum Diesel fuel”. Final Report, May 1998. Page 202, table 121.
24. City Website. City of Santa Rosa. ‘Recycled Water Overview’. Extracted on November 02, 2006. <http://ci.santa-rosa.ca.us/default.aspx?PageId=2219>
25. Deslauriers, Sarah. Kanzaki Mazayuki. Kumar, Akshay. Bulkley Jonathan. Tripathi, Malavika. ‘Preliminary Application of Life-cycle Assessment to U.S. Water and Wastewater Treatment Facilities’. Center for Sustainable Systems. University of Michigan. Ann Arbor. CSS05-12
26. ‘Epstein et al. ‘City of Ann Arbor Greenhouse Gas Emissions Reduction Strategy’. University of Michigan. May 2003
27. Keoleian, Gregory A. Spitzley, David V. “Life-cycle based Sustainability Metrics”. Published by Elsevier B.V. 2006