limitations in the use of unipolar charging for electrical mobility
TRANSCRIPT
LUND UNIVERSITY
PO Box 117221 00 Lund+46 46-222 00 00
Limitations in the Use of Unipolar Charging for Electrical Mobility Sizing Instruments:A Study of the Fast Mobility Particle Sizer
Levin, M.; Gudmundsson, Anders; Pagels, Joakim; Fierz, M.; Molhave, K.; Löndahl, Jakob;Jensen, K. A.; Koponen, I. K.Published in:Aerosol Science and Technology
DOI:10.1080/02786826.2015.1052039
Published: 2015-01-01
Link to publication
Citation for published version (APA):Levin, M., Gudmundsson, A., Pagels, J., Fierz, M., Molhave, K., Löndahl, J., ... Koponen, I. K. (2015). Limitationsin the Use of Unipolar Charging for Electrical Mobility Sizing Instruments: A Study of the Fast Mobility ParticleSizer. Aerosol Science and Technology, 49(8), 556-565. DOI: 10.1080/02786826.2015.1052039
General rightsCopyright and moral rights for the publications made accessible in the public portal are retained by the authorsand/or other copyright owners and it is a condition of accessing publications that users recognise and abide by thelegal requirements associated with these rights.
• Users may download and print one copy of any publication from the public portal for the purpose of privatestudy or research. • You may not further distribute the material or use it for any profit-making activity or commercial gain • You may freely distribute the URL identifying the publication in the public portal ?

Limitations in the use of unipolar charging for electrical mobility sizing instruments: A study of the Fast
Mobility Particle Sizer
Levin M1, 2, Gudmundsson A3, Pagels J.H3, Fierz M4, Mølhave K1,Löndahl J3, Jensen KA2, Koponen IK2
1 Department of Micro and Nanotechnology, Technical University of Denmark, Kgs. Lyngby, DK-2800,
Denmark
2 National Research Centre for the Working Environment, Lersø Parkallé 105, DK-2100 Copenhagen,
Denmark.
3 Ergonomics and Aerosol Technology (EAT), Lund University, SE-221 00, Lund, Sweden
4 University of Applied Sciences Northwestern Switzerland, Institute of Aerosol & Sensor Technology,
Klosterzelgstr 2, CH-5210 Windisch, Switzerland.
Corresponding author:
Marcus Levin
Danish NanoSafety Centre
National Research Center for Working Environment
Lersø Park Alle 105,
DK-2100 Copenhagen, Denmark
E-mail [email protected]
Phone: +45 3916 5274 (direct)

Abstract
A comparison between three different types of particle sizing instruments (Fast Mobility Particle Sizer
(FMPS), Electrical Low Pressure Impactor (ELPI) and Scanning Mobility Particle Sizer (SMPS)) and one
Condensation Particle Counter was made to compare instrument response in terms of size distributions
and number concentration. Spherical oil droplets in 39 different sizes, with Geometric Mean Diameter
(GMD) ranging from 50 to 820 nm were used as test particles. Furthermore, a characterization of the FMPS
unipolar charger behavior was made to analyze the measured size distributions and number
concentrations. The results show that all three sizing-instruments agree well for particle sizes below
200nm, both in terms of size and number concentration, but the FMPS deviates clearly when particle sizes
exceed 200 nm. Above this, the FMPS underestimates the particle size throughout the remainder of the
size range, with an apparent upper limit for GMD of 300 nm. It also estimates a higher particle number
concentration as compared to the other instruments. Analysis of the 22 FMPS electrometer currents and
calculation of average number of charges per particle show a diameter dependence of response of 𝑑𝑝1.21 for
the FMPS unipolar charger. The resulting calculated electrical mobility showed a minimum in mobility for
spherical particles at 577 nm, which indicates an interfering range of particles above the measurement
range, but below the cut-off of the inlet pre-separator (1 µm). The study concludes that particle
distributions with a true GMD above 200 nm cannot be measured reliably with the FMPS.

1. Introduction
Measurement of airborne particle size and number concentration in the sub-micron size range is important
for understanding the properties and mechanics of airborne particles within the atmosphere and its
radiative forcing (Seinfeld and Pandis, 2006). In addition, reliable measurements of exposures to particles
from a few nanometers to several micrometers in size are increasingly becoming important in order to
assess, measure and manage the inhalation risk of airborne fine, ultrafine particles and manufactured
nanomaterials which are increasingly documented to be of serious concern regarding our respiratory
human health (Dockery et al., 1993; Donaldson et al., 2004; Oberdorster et al., 2005; Oberdorster and Utell,
2002).
For studies performed at workplaces aiming at measuring manufactured nanostructured particles, the
Scanning Mobility Particle Sizer (SMPS, Wang and Flagan, 1990) is the most common instrument to be used
for measurements of particle size distributions in the sub-micron range (Brouwer et al., 2009; Kuhlbusch et
al., 2011). The potential downside of this technique is the relatively low time-resolution where a full
scanning time takes from 16 seconds up to several minutes, depending on desired size resolution and
instrument response time, which can cause erroneous measurements during transient concentrations
(Asbach et al., 2014; Yao et al., 2006; Zimmerman et al., 2014). Other common instruments used for
particle sizing in this range include the Fast Mobility Particle Sizer (FMPS, TSI Inc. Shoreview, MN, USA) and
the Electrical Low Pressure Impactor (ELPI, Dekati Ltd., Finland), which both have the advantage of 1 second
time resolution. However, it is imperative that the gain in time resolution should not come at a too high
decrease in precision and accuracy in the determination of particle size and concentration.
Several studies have been carried out which compare these three instruments in different regards and
during measurement of a large number of different aerosols. Asbach et al. (2009) compared three different
commercial SMPS systems and one FMPS by measuring NaCl particles (Geometric mean diameter ~ 30 nm)
and soot agglomerates (70-90 nm). They found that the FMPS consistently measured slightly lower
Geometric Mean Diameters (GMD) than the SMPS systems. In terms of concentration, the FMPS
measurement was comparable to the SMPS systems for NaCl, but significantly higher for soot particles,
likely due to the complex morphology of soot. Jeong and Evans (2009) compared the FMPS with a SMPS for
measurements of urban ambient and indoor particles, rural ambient particles and laboratory particles.
They found a strong correlation between the two instruments in terms of total concentrations but poor
agreement in the shape of the measured size distributions. All tested aerosols had a GMD below 100 nm.
Leskinen et al. (2012) compared SMPS, FMPS and ELPI along with additional instruments to aerosols
relevant for occupational health measurements. They found that the SMPS, FMPS and ELPI produced
similar results for 30 nm ammonium sulphate particles in terms of concentration and GMD, but for larger
size TiO2 agglomerates and powder dusts with more complex morphology, the FMPS reported higher
concentrations and smaller GMDs than the SMPS. Kaminski et al. (2013) compared eight commercial SMPS
systems with three FMPSs using NaCl, DEHS and soot particles of various sizes. They found very good
agreement for small nanosized (~40 nm) NaCl particles while FMPSs underestimated the 250nm DEHS
particles by 20-26 % as compared to the SMPS systems. For the soot particles, the FMPS underestimated
the particle sizes even more, up to 40 %. The study concluded that the agreement between FMPS and
SMPS is linked to the particle size and morphology. Hornsby and Pryor (2014) compared four SMPS systems
and one FMPS for particles with GMDs between 10 and 100 nm. They found low deviation for the FMPSs
from the GMD (±7.5 %) as measured by the SMPS systems. Awasthi et al. (2013) compared the Engine
Exhaust Particle Size (EEPS 3090, TSI Inc. Shoreview, MN, USA), which uses the same measurement design
as the FMPS, with a SMPS for silver agglomerates, and showed that the EEPS consistently measured smaller
number median mobility diameters and overestimated the total number concentration up to 67%. They
also concluded that for small monodipserse particles (<80 nm), the EEPS measured diameters close to that
of the SMPS but with a polydispersive distribution. No studies containing FMPS size distributions with a
GMD higher than 200-250 nm could be found within the available literature by the authors.
This study was initiated by the observation that measuring the particle size distributions from powder
agitation using rotating drum methods has been shown to produce inconsistent results when comparing
size distributions measured with FMPS and ELPI, where the FMPS consistently showed a mode with the
GMD of 200 nm, which is not observable in the ELPI data (Levin et al., In prep.). These data showing a mode
with a GMD of 200 nm are consistent with data from several other dustiness studies, where the FMPS has
been used to measure dust particles (Burdett et al., 2013; Jensen et al., 2009; Levin et al., 2014; Schneider
and Jensen, 2008).
Previously, efforts to establish correction algorithms for the FMPS have been presented by Jeong and Evans
(2009) and Zimmerman et al. (2015). The first study proposed an adjustment of measured FMPS number
concentration in channels below 93.1 nm through an empirical correction established by comparing FMPS
size distributions with that of a SMPS. The second study extended this correction by proposing an
adjustment of size bins starting at 80.6 nm and above which broadens the upper limit of the instrument to
857 nm to compensate for the underestimation of particle sizes. Furthermore, they normalized each size
bin with the ratio in total concentration between the FMPS and a water-based Condensation Particle
counter (CPC). There is, however, a need to further test if such a correction holds true for particles larger
than 300 nm, which was the upper size range in Zimmerman et al. (2015). Since no information on the
influence of particles with a GMD above the measurement range of the FMPS but below the pre-separator
has been found by the authors, this possible error source needed to be addressed.
This study aims to investigate the apparent size-dependent deviations of FMPS when compared to other
particle sizing instruments such as SMPS and ELPI. While a large amount of studies have compared the
instruments for <200 nm particles, scarce data exist for particle size distributions with geometric mean
diameters in the remainder of the claimed FMPS size range reaching up to 560 nm. Because the FMPS
samples particles up to 1 µm in size by pre-selection through a PM1.0 cyclone, we have also studied the
effect of particle size distributions with GMDs above the FMPS size classification limit (560 nm) on the

FMPS response. Finally, attempts were made to characterize the FMPS unipolar charger and calculate the
charging profile with regard to particle size to further understand the instrument response to various
particle sizes and possible interfering size ranges.

2. Methods
2.1 Instrumentation
Three types of instruments designed for size measurements of particles in the sub-micron size range were
included in the study. Additionally, a CPC was added as a reference instrument for comparisons of total
number concentration.
Fast Mobility Particle Sizer (FMPS 3091, TSI)
The FMPS (TSI, 2006) is a recently developed instrument based on the Electrical Aerosol
Spectrometer (EAS, Tammet et al., 2002). While the EAS consists of two parallel
compartments for measuring particle mobility, one with diffusion charging and one with field
charging, the FMPS only used the diffusion charger part which positively charges the
particles. In the EAS setup information from the field charging part was used in the
classification of particles larger than 300 nm due to the conversion from mobility to particle
size in this region becoming ambiguous in the diffusion charging part (Tammet et al., 2002),
After charging, the particles are separated in an electric field according to their electrical
mobility and detected by 22 electrometers positioned in a vertical column. The measured
currents are then corrected for multiple charges and image charges and then inverted from
the 22 measured currents into 32 size channels ranging from 5.6 to 560 nm in electric
mobility equivalent diameter. The measured size and concentration are therefore both
dependent on the charging efficiency. Since the output contains more size channels than
actual measurements, some assumptions must be made in the data inversion algorithm –
these are, however, not disclosed by the manufacturer. The FMPS measures particle size
distributions with a 1 second time resolution. Intake sampling for the FMPS is done at 10
l/min through a PM1.0 cyclone. Two identical FMPS systems were used within this study,
hereafter denoted as FMPS 1 & 2.
Electrical Low Pressure Impactor (ELPI+, Dekati)
The ELPI (Järvinen et al., 2014; Keskinen et al., 1992) uses a unipolar diffusion charger to
charge the aerosol as it enters the instrument. The particles are size-separated according to
their aerodynamic equivalent diameter in a cascade impactor where the particles are
detected through charge measurements as they impact onto the 13 impactor plates. The
final stage consists of a back-up filter stage. The measured currents in the ELPI+ are then
corrected for multiple charges, image charges and then converted into 14 concentrations
specific for each size fraction ranging from 6 nm to 10 µm in aerodynamic equivalent
diameter. Since the 14 measured currents directly correspond to the 14 size channels, and
only concentration data is extracted from this, the data inversion is simpler and carries less
assumptions than in the case of the FMPS. Intake sampling for the ELPI is done at 10 l/min
and it measured particle size distributions with one second time resolution.
Scanning Mobility Particle Sizer (SMPS)
The SMPS (Wang and Flagan, 1990) used in this study consisted of a 63Ni aerosol neutralizer,
a Differential Mobility Analyser (DMA, Vienna type, 28 cm; Winklmayr et al., 1991) and a CPC
(CPC 3010, TSI; Mertes et al., 1995). It was built and intercompared according to current
technical standards for mobility size spectrometers as described by Wiedensohler et al.
(2012). The sheath air was dried using silica gel. The SMPS measures the mobility equivalent
size of the particles in the range of 10 to 1000 nm, which is within the operating range of the
CPC. To increase size resolution, the measurement range only covered a limited range, e.g.
50 to 500 nm, were the actual size range was adjusted to match the particle size
distributions being measured.
The SMPS was operated with two adjacent 90 second scans, one with increasing voltage and
one with decreasing voltage. Data inversion was performed with a Labview (National

Instruments, Austin, TX, USA) program (Löndahl et al., 2006) which also controlled the DMA
and CPC. Particle charge correction was performed according to the bipolar charge
distribution from Wiedensohler (1988) and, in the interval -2 to 2 elementary charges, from
(1963).The inversion of the SMPS data included correction for CPC smearing (Collins et al.,
2002), CPC counting efficiency (Zhou, 2001) and deviations from the ideal DMA transfer
functions (Collins et al., 2004). The DMA was run with an aerosol flow of 1 l/min and a sheath
air flow of 10 l/min.
Condensation Particle Counter (CPC 3007, TSI)
The CPC 3007 (TSI, 2002) measures the total number concentration of particles larger than
10 nm in the concentration range up to 105 cm-3 (Hämeri et al., 2002) with a 1 second time
resolution. The CPC 3007 samples inlet air with a flow of 0.7 l/min and has a manufacture
stated concentration accuracy of ±20 %.
Sizing instruments were validated prior to the experiments using Polystyrene Latex Spheres (PSL, 80 and
150 nm) to ensure correct sizing and concentration. However, as reported previously, the FMPS is unable to
properly measure the monodisperse distributions that the PSL should give rise to due to its data inversion
where the measured particles always will be spread out over a minimum of 5 channels (Awasthi et al.,
2013; Leskinen et al., 2012; TSI, 2011). The CPC 3010 and CPC 3007 were also compared in terms of
concentration to be within the manufacture-stated precision. More information regarding control of
calibration can be found in the supplementary material.
2.2 Particle Generation and Test Setup

Test particles for the comparative studies were created by first aerosolizing a solution of NH4NO3 and water
with a constant output atomizer using pressurized air of 1.5-3 bar depending on desired conditions. This
aerosol was then dried using a diffusion dryer with silica gel to form salt particles with diameters of 40-50
nm. The dried salt particles were then introduced to the Condensation Aerosol Generator (SLG 250, Topas)
where Di-Ethyl-Hexyl-Sebacat (DEHS) was condensed upon them to create spherical droplets. The oil
droplet size could be varied from 50 nm up to 3 µm by varying the number of seed particles, oil
temperature and flow rate through the saturator.
The formed DEHS droplets were directly emitted into a 1.3 m3 stainless steel chamber (Figure 1). The
chamber was ventilated with HEPA-filtered air at 1h-1 and used as a buffer volume to ensure stable
concentrations. A joint aluminum sampling tube (⌀ = 140 mm) with a constant airflow of 40 l/min was used
to distribute the stainless steel sampling tubes, 10 mm diameter to the instruments. Theoretical
concentration differences along the sampling tube due to diffusional and gravitational losses were
estimated to be less than 1 % for the size range of interest in this study, which were experimentally
confirmed.
Figure 1
A total of 39 measurement runs were made with the desired particle GMD varying from 50 to 800 nm. The
desired Geometric Standard Deviation (GSD) of the distribution was around 1.3 to minimize errors in FMPS
inversion due to monodisperse aerosol. A measurement run constituted of 30 minutes of continuous
measurement of a stable (±10 % in concentration) aerosol. Before a measurement started, all instrument
flows were controlled, zero-tests were conducted using HEPA-filters, and electrometers zeroed where it
was necessary. After each measurement run was concluded, the chamber was flushed with HEPA-filtered
air to lower the background concentration (<50 cm-3) in preparation of the next run.
2.3 Unipolar Charging
In unipolar diffusion charging, the aerosol is introduced to a volume with a high concentration of gaseous
ions of a specific charge which are captured by the particles through the high diffusion coefficient of the
ions. Fuchs’ limited sphere theory (Fuchs, 1963) together with corrections by Hoppel and Frick (1986)
describes the theory of this particle charging. After passing through the charger volume, an average charge
per particle, �̅�, has been imposed onto the particles. The average charge depends on the particle diameter,
dp, the ion density within the charger volume, Ni, and the particle residence time within the charger
volume, t. The latter two relate to charging conditions and are properties of the charger design; they are
often described as the so-called Nit-product. For a specific Nit-product and within a specific particle size
range, the average charge per particle can be related to the particle diameter through a power-law such as:
�̅� ∝ 𝑑𝑝𝑥 (1)
Besides the three parameters described above, unipolar charging may be influenced by several other
factors such as particle morphology, particle dielectric constant, gas pressure temperature as well as ion
properties such as mass and mobility (Kulkarni et al., 2011).
2.4 Data analysis
The raw data from the SMPS was inverted with regard to multiple-charge correction and diffusion losses.
ELPI data was density-corrected with the DEHS density of 912 kg/m3 adjusted for contribution of seed
particle to density. To increase the comparability between instruments, the mobility diameter measured by
FMPS and SMPS was converted into aerodynamic diameter using the assumption of spherical shape and
the known density of DEHS using:
𝑑𝑎𝑒𝑟𝑜2 ∙ 𝐶𝑐,𝑎𝑒𝑟𝑜 = 𝑑𝑚𝑜𝑏
2 ∙ 𝐶𝑐,𝑚𝑜𝑏𝜌𝑝
𝜌0 (2)

where d denotes particle diameter and Cc the Cunningham slip correction factor with subscripts mob and
aero for mobility and aerodynamic equivalent diameters, respectively, ρ0 is the standard density (1000
kg/m3) and ρp is the particle density (Hinds, 1999). All measurement data were corrected for diffusional and
gravitational sampling losses in tubing and tubing bends (<5%).
For each measurement run, 30 minutes of stable conditions were selected and the data of the FMPS and
ELPI were averaged down to the same resolution as the SMPS (180 seconds). Fitting of log-normal
functions to these size distributions was done to parameterize them into GMD, GSD and modal number
concentrations using an automated algorithm (Hussein et al., 2005). In all cases of fitting, single-modal
fitting was selected as the preferable choice. Means and standard deviations of the modal diameter and
modal concentrations were then calculated. Data from the CPC was calculated into a mean value with
standard deviations for the entire 30 minute measurement run.
For further analysis of the FMPS, the raw current response from the 22 electrometers was studied. To
remove the effect of concentration differences between different measurement runs, all electrometer
currents, I, were normalized with the total concentration as measured with CPC 3007, NCPC. Thus the
average number of charges per particle, �̅�, which is equal to the average charge per particle, �̅�, divided by
elementary charge, e, was calculated as:
�̅� = ∑ (𝐼𝑖
𝑁𝐶𝑃𝐶∙𝑄𝐹𝑀𝑃𝑆∙𝑒)𝑖=1:22 (3)
where QFMPS is the flow of the FMPS. By calculating this average number of charges of distributions with
various GMD, an exponential fit was made to determine the exponent x as shown in Equation 1 and the
number of charges can be extrapolated for a large range of particle sizes. Finally, the electrical mobility, Z,
dependency on particle size for the FMPS unipolar charger can be calculated through:

𝑍 =�̅�∙𝑒∙𝐶𝐶
3∙𝜋∙𝜂∙𝑑𝑝 (4)
where η is the viscosity of air.

Results and Discussion
Figure 2 shows typical size distribution measurements within the sub-micron range as measured by FMPS,
SMPS and ELPI during four separate measurement runs. Visually, it appears that there is good agreement
between all instruments for the distributions at 90nm and 150 nm (2a and 2b, respectively). As the particle
sizes increase to 350 nm (2c), the FMPS distribution appears to be situated at a lower size (200 nm) than
that of the other instruments. This becomes even clearer as the particle sizes grow further to 500 nm (2d),
here it obvious that the FMPS modal number concentration (at 200 nm) is higher than the other
instruments. The apparent measured particles in the lowest stage of the ELPI with 10 nm mid-point value in
Figure 2a, b, and d are due to the higher noise ratio of the filter stage of the ELPI.
Figure 2
Figure 3 presents the fitted GMDs with standard deviations from all 39 measurement runs for the four
instruments. The comparison between SMPS and ELPI fitted GMDs falls close to the (1 to 1)-line against
those of the SMPS (R2=0.98), and no size-dependent shift in the comparison can be observed. The FMPS
data appear to behave in two ways depending on the size range: Up to GMDs of ~200 nm, the data
correlates well (R2=0.94); however, above 200 nm, it is clear that both FMPSs underestimate the modal
sizes as compared to both SMPS and ELPI. Thereafter, they continue to produce distributions with GMDs
between 200 and 300nm, well up into ranges above the 560 nm size-classification limit of the instrument.
In no occurrence, as the particle sizes grew, did the FMPSs show only the tail end of a distribution, but
rather showed a full particle mode.
Figure 3
The ratio in number concentrations contained in the particle modes for FMPS and ELPI against SMPS as well
as the concentration ratio between CPC 3007 and the SMPS is shown in figure 4. In general, the number
concentrations were between 3∙104 and 6∙104 cm-3. There is a good correlation between SMPS and CPC

(Ratio=1.03±0.04) and SMPS-ELPI (Ratio=0.98±0.14). For the SMPS-FMPS comparison, there is a similar
scenario to that of the GMD comparison, where there is a good correlation up until 200nm
(Ratio=0.99±0.12). For GMDs larger than this, the FMPS number concentration starts to exceed that of the
SMPS. The number concentration ratio peaks around 500 nm where the number concentration measured
by the FMPS is twice than that of the SMPS. After the particle GMD reaches the FMPS upper size limit, the
ratio decreases again; however, it remains above 1 until the GMD reaches 650 nm. At this point, the
majority of the particle distribution should lie outside the FMPS range.
The correction algorithm suggested by Zimmerman et al. (2015) is based on particle measurements up to
300 nm. However, the fact that the GMD response in the FMPS is not continuously increasing with the
GMD of the measured aerosol above this range, Figure 3, points towards an upper limit for such a
correction of bin sizes. In addition, such an algorithm for correction would still misclassify results given by
erroneous measurements of particles larger than the measured size range but smaller than the pre-
separator cut-off. Furthermore, the size dependent concentration over-estimation in Figure 4 suggests that
a correction of FMPS concentration by that of a CPC would give an incorrect result in cases where a
polydisperse aerosol is measured.
Figure 4
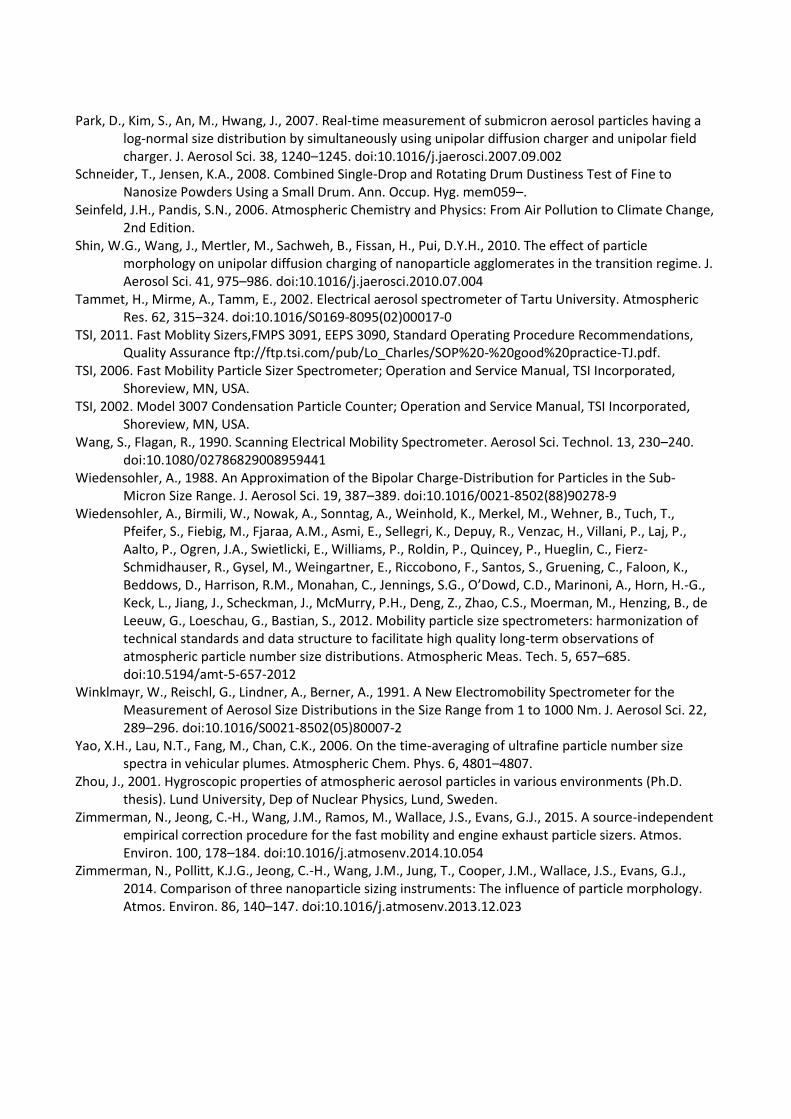
The concentration-normalized electrometer response for 22 different particle sizes, as measured with
SMPS, between 50 and 800 nm is shown in Figure 5. From the response curves, it is clear that the particle
size separation is more size sensitive for smaller particles than larger particles with the same size
increment. In fact, particle GMDs between 550 and 800s nm give almost identical response and GMDs
around 400-450 nm give a very similar response. It is is also noticeable that even-though the three last
distributions have a true GMD outside the FMPS range, the response from the last electrometer is
decreasing for all of them. This all shows that as the particle size increases, it becomes more challenging to
differentiate their particle size through this method.

The exponential fit of average number of charges per particle gave an exponent for the relationship
between size and charge of 1.21±0.02. It should be noted that there is an uncertainty in this value due to
the polydisperse nature of the aerosols. In the ideal case the charger would be characterized with mono-
disperse particles but due to the FMPS inversion being unable to cope with this (TSI, 2011), distribution GSD
varied from 1.25-1.35, as measured by SMPS, during the measurements. No previous value on the FMPS
charger has been reported in literature, and these calculated values lie within the range of other reported
values for unipolar chargers which lie between 1.32 and 1.91 for direct corona charges (Ntziachristos et al.,
2004; Park et al., 2007), for indirect corona chargers between 1.11 and 1.36 (Fierz et al., 2007; Jung and
Kittelson, 2005; Liu and Pui, 1975) and for turbulent jet chargers between 1.13 and 1.17 (Fissan et al., 2007;
Jung and Kittelson, 2005; Park et al., 2007).
Figure 5
This 1.21 exponent in the power law can now be used for further analysis of the FMPS response to
investigate whether the incorrect measurements stem from misclassification of particle sizes. Figure 6
shows a corrected concentration ratio for the FMPS defined as:
𝑅𝑎𝑡𝑖𝑜 = 𝑁𝐹𝑀𝑃𝑆
𝑁𝑆𝑀𝑃𝑆∙ (
𝐺𝑀𝐷𝐹𝑀𝑃𝑆
𝐺𝑀𝐷𝑆𝑀𝑃𝑆)
1.21
This charging corrected ratio is now constant (0.94±0.11) within the measurement range of the FMPS
above which it starts to decline. This constant behavior clearly suggests that the particles are detected in
the FMPS but misclassified, e.g. a 500 nm particle interpreted as a 200 nm particle will give an
overestimation in concentration by a factor of approximately 3 due to it carrying the charge equivalent of a
500 nm particle.
Figure 6
Furthermore, the fact that such high concentrations are measured even at GMDs higher than the upper
limit of the FMPS might be linked to the fact that the inlet cyclone of the FMPS has an aerodynamic cut-off
diameter of f 1µm. This means that particles in the size-range of 560-1000nm will still enter the instrument,
become charged and pass along the electrometer column. The calculated, Equation 4, particle electrical
mobility of spherical particles after being charged by the FMPS charger as a function of size is presented in
Figure 7. It is clear that the size dependency flattens out due to the Cunningham slip factor becoming a
weaker function as the particle size grows and the electrical mobility reaches a minimum at 577±54 nm.
Above this point there is actually an increase in electrical mobility up to the inlet pre-separator D50 of
1000nm, and above. This would effectively mean that differentiation of particles in this region based on
electrical mobility analysis after unipolar charging is becoming impossible and that large particles may even
be unintendedly detected by an electrometer stage aimed for particles of smaller size but similar electrical
mobility. According to this extrapolation, a spherical 1 µm particle, which has a penetration of 0.5, would
have the same electrical mobility and be similarly interpreted as a 360 nm particle. Its concentration
response would, however, be higher due to it carrying a higher charge. Also, it should be noted that as the
function for average charge per particle exceeds the measured size range, the calculated power-law may
not be precise due to shifting conditions.
Figure 7
For non-spherical particles, Shin et al. (2010) showed that agglomerates are able to carry more charge after
unipolar charging than a spherical particle of the same mobility size and that the size dependency is steeper
than that for spherical particles. This would infer that the magnitude of incorrect particle sizing in the FMPS
would increase since the electrical mobility, compared to that shown in Figure 7, would increase and that
the curve minima would move to smaller sizes. This would result in an incorrect response, both in terms of
interpreted size and concentration, since a wider span of particle sizes within the measurement range will
have the same electrical mobility. Furthermore, the influence of particles larger than the intended

measurement range (>560 nm) but below the aerodynamic cut-off of the cyclone (1 µm) would have a
higher risk of being detected in the instrument electrometers and interfere on the measurements. In the
case of agglomerates, the particle effective density can often be below unit density which results in a
shifted cyclone cut-off point to a larger equivalent mobility diameter, which extends the interfering range
of large particles in the measurements. Therefore, post-measurement corrections of FMPS results are
challenging and would need to take the particle shape into account and can therefore not be independent
of the particle source. In the presence of particles with a diameter above the mobility minimum, such a
correction would be impossible due to the measurement ambiguity.
A separate possible explanation for the occurrences of underestimated GMDs and overestimated
concentrations is the data treatment in the FMPS where the signal from 22 electrometers is inverted to 32
size channels. Such data inversion includes some type of data-fitting, e.g. log-normal or polynomial. Such a
fitting would be useful in many applications such as atmospheric measurements were the particles fall into
well-known modes within the range of the instrument (Birmili, 1998; Mäkelä et al., 2000). Similarly
combustion processes mainly produce particle modes within this range. In many other applications such as
dustiness testing, occupational powder handling and other industrial processes the freshly emitted aerosol
might not assume these otherwise common particle modes. Using lognormal fitting for these types of
particle size distributions may result in forcing the particle GMD into the measurement range, while
increasing the particle numbers as the actual current is registered from large particles.
Other instruments using unipolar diffusion charging, such as DISCmini (Fierz et al., 2011) and nanoTracer
(Marra et al., 2009) are known to be using fitting of the data and therefore report upper and lower limits on
the GMD that can be measured within the total measurement range. For the FMPS, however, there are no
such GMD limits reported in literature. If such a fitting takes place in the instrument, an extremely

important parameter to output would be the goodness of fit to ensure that the actual distribution is not an
artefact of fitting.
3. Conclusions
In this study, we compared the measured particle size distributions of two FMPSs with that of one ELPI and
a SMPS for 39 distributions of spherical DEHS particle distributions in a controlled test environment. The
focus was put on the differences in the number size distribution log normal fitted GMDs and the modal
number concentrations as measured by the FMPSs compared to the other instruments.
The study showed that the ELPI and SMPS agreed well, both in terms of GMD (R2=0.98) and number
concentration (Ratio=0.98±0.14), within the entire measured size range (50 to 850 nm). SMPS and ELPI also
agreed well with the CPC in terms of total number concentration. The FMPSs agreed well with the other
instruments for distributions with a GMD lower than 200 nm (R2=0.94). However, for particle size
distributions with a GMD higher than ~200 nm neither the particle size nor concentration can properly be
measured using the FMPS. Furthermore, the size response of the FMPS was not continuously increasing
with increasing true particle size, rendering a correction algorithm difficult.
Calculations on the measured electrometer currents showed an increasingly similar response as the particle
size distribution GMD increased ending with sizes above 500 nm giving almost identical responses. Fitting
of average number of charges per particle and power-law fit resulted in a diameter dependence of charge
response as 𝑑𝑝1.21 for the FMPS unipolar charger. The calculated electrical mobility showed a minimum in
mobility for spherical particles at 577 nm, above which the electrical mobility increases with particle size.
This indicates that there is an interfering range of particles above the measurement range, but below the
cut-off (1 µm) of the inlet pre-separator that will be erroneously detected.
Although further data might be needed for decisive conclusions, indications were given that measured
distributions with a GMD above 200 nm cannot be deemed reliable as it may originate from a distribution
of larger size being incorrectly measured, if not confirmed through other means of measurement, as it
might be an artifact distribution. As many industrial processes, such as production, pouring and packaging

of nano-structured powder, are known to produce GMDs exceeding this or agglomerated particles where
the effect will be even more pronounced, a secondary instrument should always be used to confirm particle
observations. Based on this we recommend that reported size distribution with a GMD of 200 nm or above
be further investigated as it might be caused by erroneous measurement.

Acknowledgments
This work was conducted as part of the Strategic Research effort at the National Research Centre for the
Working Environment and the ‘Danish Centre for Nanosafety’ (20110092173/3) from the Danish Working
Environment Research Foundation, AFA Insurance (Grant no. 130122) and the EU Framework 7 Programme
NANoREG (contract no. 310584). It was carried out within the Nanometer Structure Consortium (nmC@LU)
at Lund University and the FORTE-centre METALUND.
Asbach, C., Aguerre, O., Bressot, C., Brouwer, D.H., Gommel, U., Gorbunov, B., Le Bihan, O., Jensen, K.A., Kaminski, H., Keller, M., Koponen, I.K., Kuhlbusch, T.A.J., Lecloux, A., Morgeneyer, M., Muir, R., Shandilya, N., Stahlmecke, B., Todea, A.M., 2014. Chapter 7 - Examples and Case Studies, in: Berges, U.V.S.W. van T.B. (Ed.), Handbook of Nanosafety. Academic Press, San Diego, pp. 223–278.
Asbach, C., Kaminski, H., Fissan, H., Monz, C., Dahmann, D., Muelhopt, S., Paur, H., Kiesling, H., Herrmann, F., Voetz, M., Kuhlbusch, T., 2009. Comparison of four mobility particle sizers with different time resolution for stationary exposure measurements. J. Nanoparticle Res. 11, 1593–1609.
Awasthi, A., Wu, B.-S., Liu, C.-N., Chen, C.-W., Uang, S.-N., Tsai, C.-J., 2013. The Effect of Nanoparticle Morphology on the Measurement Accuracy of Mobility Particle Sizers. Mapan-J. Metrol. Soc. India 28, 205–215. doi:10.1007/s12647-013-0068-7
Birmili, W., 1998. Production of new ultrafine aerosol particles in continental air masses (Dissertation). University of Leipzig.
Brouwer, D., van Duuren-Stuurman, B., Berges, M., Jankowska, E., Bard, D., Mark, D., 2009. From workplace air measurement results toward estimates of exposure? Development of a strategy to assess exposure to manufactured nano-objects. J. Nanoparticle Res. 11, 1867–1881.
Burdett, G., Bard, D., Kelly, A., Thorpe, A., 2013. The effect of surface coatings on the dustiness of a calcium carbonate nanopowder. J. Nanoparticle Res. 15, 1311. doi:10.1007/s11051-012-1311-9
Collins, D.R., Cocker, D.R., Flagan, R.C., Seinfeld, J.H., 2004. The scanning DMA transfer function. Aerosol Sci. Technol. 38, 833–850. doi:10.1080/027868290503082
Collins, D.R., Flagan, R.C., Seinfeld, J.H., 2002. Improved inversion of scanning DMA data. Aerosol Sci. Technol. 36, 1–9. doi:10.1080/027868202753339032
Dockery, D., Pope, C., Xu, X., Spengler, J., Ware, J., Fay, M., Ferris, B., Speizer, F., 1993. An Association Between Air-Pollution and Mortality in 6 United-States Cities. N. Engl. J. Med. 329, 1753–1759. doi:10.1056/NEJM199312093292401
Donaldson, K., Stone, V., Tran, C.L., Kreyling, W., Borm, P.J.A., 2004. Nanotoxicology. Occup. Environ. Med. 61, 727–728.
Fierz, M., Burtscher, H., Steigmeier, P., Kasper, M., 2007. Field Measurement of Particle Size and Number Concentration with the Diffusion Size Classifier (Disc). Soc. Automot. Eng. SAE Technical Paper Ser. No 2008-01-1179.
Fierz, M., Houle, C., Steigmeier, P., Burtscher, H., 2011. Design, Calibration, and Field Performance of a Miniature Diffusion Size Classifier. Aerosol Sci. Technol. 45, 1–10. doi:10.1080/02786826.2010.516283
Fissan, H., Neumann, S., Trampe, A., Pui, D.Y.H., Shin, W.G., 2007. Rationale and principle of an instrument measuring lung deposited nanoparticle surface area. J. Nanoparticle Res. 9, 53–59. doi:10.1007/s11051-006-9156-8
Fuchs, N.A., 1963. On the stationary charge distribution on aerosol particles in a bipolar ionic atmosphere. Geofis. Pura E Appl. 56, 185–193. doi:10.1007/BF01993343
Hämeri, K., Koponen, I.K., Aalto, P.P., Kulmala, M., 2002. The particle detection efficiency of the TSI-3007 condensation particle counter. Aerosol Sci. 33, 1463–1469.
Hinds, W.C., 1999. Aerosol Technology: Properties, Behavior and Measurements of Airborne Particles, 2nd ed. ed. John Wiley & Sons, New York.
Hoppel, W.A., Frick, G.M., 1986. Ion—Aerosol Attachment Coefficients and the Steady-State Charge Distribution on Aerosols in a Bipolar Ion Environment. Aerosol Sci. Technol. 5, 1–21. doi:10.1080/02786828608959073
Hornsby, K.E., Pryor, S.C., 2014. A Laboratory Comparison of Real-Time Measurement Methods for 10-100-nm Particle Size Distributions. Aerosol Sci. Technol. 48, 571–582. doi:10.1080/02786826.2014.901488
Hussein, T., Dal Maso, M., Petaja, T., Koponen, I.K., Paatero, P., Aalto, P.P., Hameri, K., Kulmala, M., 2005. Evaluation of an automatic algorithm for fitting the particle number size distributions. Boreal Environ. Res. 10, 337–355.

Järvinen, A., Aitomaa, M., Rostedt, A., Keskinen, J., Yli-Ojanpera, J., 2014. Calibration of the new electrical low pressure impactor (ELPI plus ). J. Aerosol Sci. 69, 150–159. doi:10.1016/j.jaerosci.2013.12.006
Jensen, K.A., Koponen, I.K., Clausen, P.A., Schneider, T., 2009. Dustiness behaviour of loose and compacted Bentonite and organoclay powders: What is the difference in exposure risk? J. Nanoparticle Res. 11, 133–146.
Jeong, C.-H., Evans, G.J., 2009. Inter-Comparison of a Fast Mobility Particle Sizer and a Scanning Mobility Particle Sizer Incorporating an Ultrafine Water-Based Condensation Particle Counter. Aerosol Sci. Technol. 43, 364–373. doi:10.1080/02786820802662939
Jung, H.J., Kittelson, D.B., 2005. Characterization of aerosol surface instruments in transition regime. Aerosol Sci. Technol. 39, 902–911. doi:10.1080/02786820500295701
Kaminski, H., Kuhlbusch, T.A.J., Rath, S., Goetz, U., Sprenger, M., Wels, D., Polloczek, J., Bachmann, V., Dziurowitz, N., Kiesling, H.-J., Schwiegelshohn, A., Monz, C., Dahmann, D., Asbach, C., 2013. Comparability of mobility particle sizers and diffusion chargers. J. Aerosol Sci. 57, 156–178. doi:10.1016/j.jaerosci.2012.10.008
Keskinen, J., Pietarinen, K., Lehtimaki, M., 1992. Electrical Low-Pressure Impactor. J. Aerosol Sci. 23, 353–360. doi:10.1016/0021-8502(92)90004-F
Kuhlbusch, T.A.J., Asbach, C., Fissan, H., Goehler, D., Stintz, M., 2011. Nanoparticle exposure at nanotechnology workplaces: A review. Part. Fibre Toxicol. 8, 22. doi:10.1186/1743-8977-8-22
Kulkarni, P., Baron, P.A., Willeke, K., 2011. Aerosol Measurement: Principles, Techniques, and Applications, Third Edition.
Leskinen, J., Joutsensaari, J., Lyyranen, J., Koivisto, J., Ruusunen, J., Jarvela, M., Tuomi, T., Hameri, K., Auvinen, A., Jokiniemi, J., 2012. Comparison of nanoparticle measurement instruments for occupational health applications. J. Nanoparticle Res. 14, 718. doi:10.1007/s11051-012-0718-7
Levin, M., Koponen, I.K., Jensen, K.A., 2014. Exposure Assessment of Four Pharmaceutical Powders Based on Dustiness and Evaluation of Damaged HEPA Filters. J. Occup. Environ. Hyg. 11, 165–177. doi:10.1080/15459624.2013.848038
Levin, M., Witschger, O., Bau, S., Birkedal, R., Clausen, P.A., Jankowska, E., Koponen, I.K., Mølhave, K., Asbach, C., Jensen, K.A., In prep. Can we trust online measurements of the (lung-deposited) surface area concentrations in dust from powder nanomaterials?
Liu, B.Y.H., Pui, D.Y.H., 1975. On the performance of the electrical aerosol analyzer. J. Aerosol Sci. 249–264. Löndahl, J., Pagels, J., Swietlicki, E., Zhou, J., Ketzel, M., Massling, A., Bohgard, M., 2006. A set-up for field
studies of respiratory tract deposition of fine and ultrafine particles in humans. J. Aerosol Sci. 37, 1152–1163. doi:10.1016/j.jaerosci.2005.11.004
Mäkelä, J.M., Koponen, I.K., Aalto, P., Kulmala, M., 2000. One-year data of submicron size mods of tropospheric background aerosol in southern Finland. J. Aerosol Sci. 31, 595–611.
Marra, J., Voetz, M., Kiesling, H.-J., 2009. Monitor for detecting and assessing exposure to airborne nanoparticles. J. Nanoparticle Res. 12, 21–37. doi:10.1007/s11051-009-9695-x
Mertes, S., Schroder, F., Wiedensohler, A., 1995. The Particle-Detection Efficiency Curve of the Tsi-3010 Cpc as a Function of the Temperature Difference Between Saturator and Condenser. Aerosol Sci. Technol. 23, 257–261. doi:10.1080/02786829508965310
Ntziachristos, L., Giechaskiel, B., Ristimaki, J., Keskinen, J., 2004. Use of a corona charger for the characterisation of automotive exhaust aerosol. J. Aerosol Sci. 35, 943–963. doi:10.1016/j.jaerosci.2004.02.005
Oberdorster, G., Maynard, A., Donaldson, K., Castranova, V., Fitzpatrick, J., Ausman, K., Carter, J., Karn, B., Kreyling, W., Lai, D., Olin, S., Monteiro-Riviere, N., Warheit, D., Yang, H., 2005. Principles for characterizing the potential human health effects from exposure to nanomaterials: elements of a screening strategy. Part. Fibre Toxicol. 2, 8–.
Oberdorster, G., Utell, M.J., 2002. Ultrafine particles in the urban air: To the respiratory tract - And beyond? Environ. Health Perspect. 110, A440–A441. doi:10.1289/ehp.110-a440
Park, D., Kim, S., An, M., Hwang, J., 2007. Real-time measurement of submicron aerosol particles having a log-normal size distribution by simultaneously using unipolar diffusion charger and unipolar field charger. J. Aerosol Sci. 38, 1240–1245. doi:10.1016/j.jaerosci.2007.09.002
Schneider, T., Jensen, K.A., 2008. Combined Single-Drop and Rotating Drum Dustiness Test of Fine to Nanosize Powders Using a Small Drum. Ann. Occup. Hyg. mem059–.
Seinfeld, J.H., Pandis, S.N., 2006. Atmospheric Chemistry and Physics: From Air Pollution to Climate Change, 2nd Edition.
Shin, W.G., Wang, J., Mertler, M., Sachweh, B., Fissan, H., Pui, D.Y.H., 2010. The effect of particle morphology on unipolar diffusion charging of nanoparticle agglomerates in the transition regime. J. Aerosol Sci. 41, 975–986. doi:10.1016/j.jaerosci.2010.07.004
Tammet, H., Mirme, A., Tamm, E., 2002. Electrical aerosol spectrometer of Tartu University. Atmospheric Res. 62, 315–324. doi:10.1016/S0169-8095(02)00017-0
TSI, 2011. Fast Moblity Sizers,FMPS 3091, EEPS 3090, Standard Operating Procedure Recommendations, Quality Assurance ftp://ftp.tsi.com/pub/Lo_Charles/SOP%20-%20good%20practice-TJ.pdf.
TSI, 2006. Fast Mobility Particle Sizer Spectrometer; Operation and Service Manual, TSI Incorporated, Shoreview, MN, USA.
TSI, 2002. Model 3007 Condensation Particle Counter; Operation and Service Manual, TSI Incorporated, Shoreview, MN, USA.
Wang, S., Flagan, R., 1990. Scanning Electrical Mobility Spectrometer. Aerosol Sci. Technol. 13, 230–240. doi:10.1080/02786829008959441
Wiedensohler, A., 1988. An Approximation of the Bipolar Charge-Distribution for Particles in the Sub-Micron Size Range. J. Aerosol Sci. 19, 387–389. doi:10.1016/0021-8502(88)90278-9
Wiedensohler, A., Birmili, W., Nowak, A., Sonntag, A., Weinhold, K., Merkel, M., Wehner, B., Tuch, T., Pfeifer, S., Fiebig, M., Fjaraa, A.M., Asmi, E., Sellegri, K., Depuy, R., Venzac, H., Villani, P., Laj, P., Aalto, P., Ogren, J.A., Swietlicki, E., Williams, P., Roldin, P., Quincey, P., Hueglin, C., Fierz-Schmidhauser, R., Gysel, M., Weingartner, E., Riccobono, F., Santos, S., Gruening, C., Faloon, K., Beddows, D., Harrison, R.M., Monahan, C., Jennings, S.G., O’Dowd, C.D., Marinoni, A., Horn, H.-G., Keck, L., Jiang, J., Scheckman, J., McMurry, P.H., Deng, Z., Zhao, C.S., Moerman, M., Henzing, B., de Leeuw, G., Loeschau, G., Bastian, S., 2012. Mobility particle size spectrometers: harmonization of technical standards and data structure to facilitate high quality long-term observations of atmospheric particle number size distributions. Atmospheric Meas. Tech. 5, 657–685. doi:10.5194/amt-5-657-2012
Winklmayr, W., Reischl, G., Lindner, A., Berner, A., 1991. A New Electromobility Spectrometer for the Measurement of Aerosol Size Distributions in the Size Range from 1 to 1000 Nm. J. Aerosol Sci. 22, 289–296. doi:10.1016/S0021-8502(05)80007-2
Yao, X.H., Lau, N.T., Fang, M., Chan, C.K., 2006. On the time-averaging of ultrafine particle number size spectra in vehicular plumes. Atmospheric Chem. Phys. 6, 4801–4807.
Zhou, J., 2001. Hygroscopic properties of atmospheric aerosol particles in various environments (Ph.D. thesis). Lund University, Dep of Nuclear Physics, Lund, Sweden.
Zimmerman, N., Jeong, C.-H., Wang, J.M., Ramos, M., Wallace, J.S., Evans, G.J., 2015. A source-independent empirical correction procedure for the fast mobility and engine exhaust particle sizers. Atmos. Environ. 100, 178–184. doi:10.1016/j.atmosenv.2014.10.054
Zimmerman, N., Pollitt, K.J.G., Jeong, C.-H., Wang, J.M., Jung, T., Cooper, J.M., Wallace, J.S., Evans, G.J., 2014. Comparison of three nanoparticle sizing instruments: The influence of particle morphology. Atmos. Environ. 86, 140–147. doi:10.1016/j.atmosenv.2013.12.023

Figure 1. Schematic overview of measurement setup. Tube lengths are not to scale.
Figure 2a-d. Size distributions as measured by FMPS, SMPS and ELPI in the sub-micron size range (90, 150,
350 and 500 nm as measured by SMPS and ELPI).

Figure 3. Fitted GMDs from FMPSs and ELPI plotted against GMDs from SMPS.
Figure 4. Concentrations of FMPS, ELPI and CPC normalized with that of SMPS. Dashed line indicates the
upper measurement limit of the FMPS.
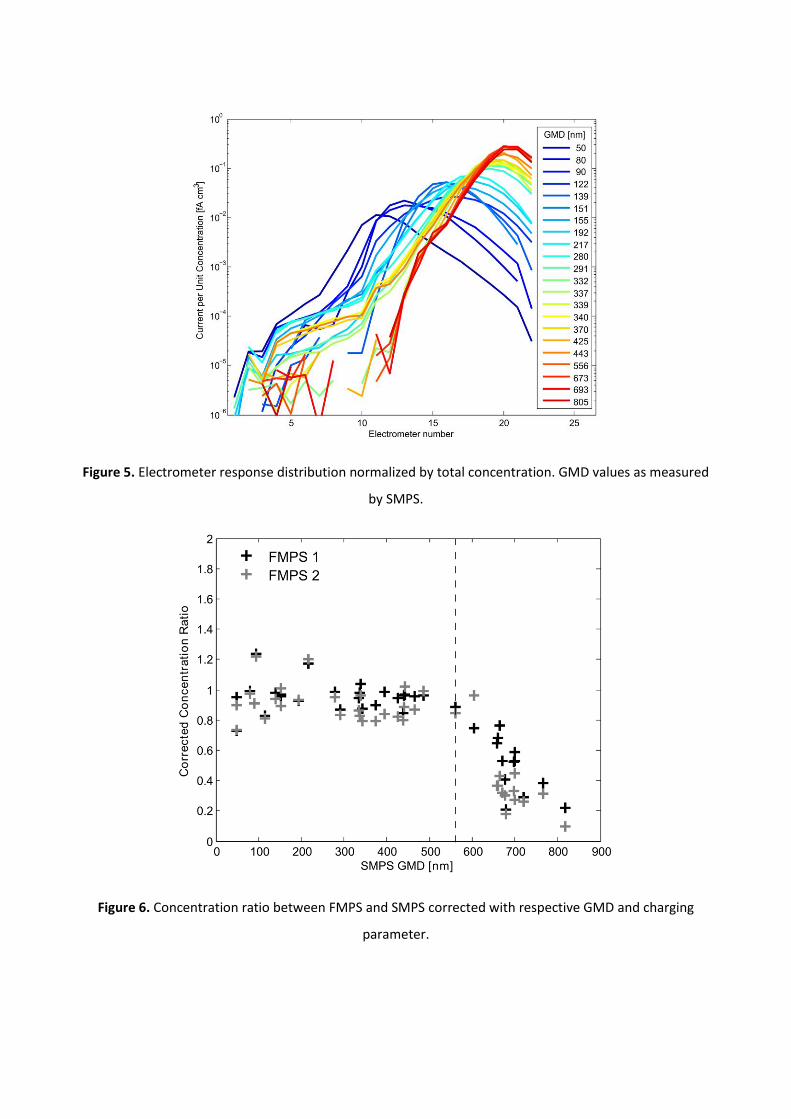
Figure 5. Electrometer response distribution normalized by total concentration. GMD values as measured
by SMPS.
Figure 6. Concentration ratio between FMPS and SMPS corrected with respective GMD and charging
parameter.

Figure 7. Calculated electrical mobility as a function of particle size. Dark shaded area denotes 95%
confidence bounds based on fitting, light shaded area the size range of the FMPS. Dashed line indicates
penetration through FMPS inlet cyclone pre-separator.