lipid profile changes during the development of artemia
TRANSCRIPT

fphys-09-01872 January 18, 2019 Time: 16:27 # 1
ORIGINAL RESEARCHpublished: 22 January 2019
doi: 10.3389/fphys.2018.01872
Edited by:Anna Maria Giudetti,
University of Salento, Italy
Reviewed by:Irena Valterova,
Institute of Organic Chemistryand Biochemistry (ASCR), Czechia
Luis Miguel Rodríguez-Alcalá,Universidade Católica Portuguesa,
Portugal
*Correspondence:Angela Corcelli
Specialty section:This article was submitted to
Lipid and Fatty Acid Research,a section of the journalFrontiers in Physiology
Received: 07 September 2018Accepted: 11 December 2018
Published: 22 January 2019
Citation:Lopalco P, Lobasso S,
Lopes-dos-Santos RMA,Van Stappen G and Corcelli A (2019)
Lipid Profile Changes Duringthe Development of Artemia
franciscana, From Cysts to the FirstTwo Naupliar Stages.
Front. Physiol. 9:1872.doi: 10.3389/fphys.2018.01872
Lipid Profile Changes During theDevelopment of Artemia franciscana,From Cysts to the First Two NaupliarStagesPatrizia Lopalco1, Simona Lobasso1, Ruy Miguel Alfama Lopes-dos-Santos2,Gilbert Van Stappen2 and Angela Corcelli1*
1 Department of Basic Medical Sciences, Neuroscience and Sense Organs, University of Bari Aldo Moro, Bari, Italy,2 Laboratory of Aquaculture & Artemia Reference Center, Ghent University, Ghent, Belgium
The brine shrimp Artemia is an interesting experimental system for studies ofdevelopmental processes. Hatching of dormant cysts gives rise to shrimp larvaecalled nauplii, characterized by numerous naupliar stages representing the first formsof brine shrimp life cycle. Here combined Thin Layer Chromatography (TLC) andMatrix-Assisted Laser Desorption Ionization-Time-of-Flight/Mass Spectrometry (MALDI-TOF/MS) analyses have been performed to gain information on the lipid profiles ofcysts and two naupliar stages. Lipid bands isolated after preparative TLC of the lipidextracts have been analyzed to detect various species of each lipid class; in additionPost-Source Decay (PSD) analyses allowed the identification of phospholipid chains.We compared the relative abundance of various polar and neutral lipid species in thelipid extracts, proving for the first time that during the development of nauplii there isan increase of cardiolipin (CL) and lysophospholipid levels; in parallel, the amount ofphosphatidylcholine (PC) decreases. In addition, as regards neutral lipids, we found anincrease of diacylglycerols (DAGs) in correspondence of the decrease of triacylglycerols(TAGs). Data reflect the fact that naupliar stages, being an active form of life, are moremetabolically active and offer a platform to develop further studies on the importance oflipid metabolic pathways and bioactive lipids during the development.
Keywords: Artemia franciscana, phospholipids, lysophospholipids, neutral lipids, MALDI-TOF/MS, TLC
INTRODUCTION
Artemia franciscana is a planktonic crustacean inhabiting natural salt lakes and salterns. Theirlarvae (nauplii) represent the most commonly used live food in aquaculture (Fisheries andAquaculture Resources Use and Conservation Division, 2017). Apart from practical applications,the brine shrimps of the genus Artemia are interesting organisms from the physiological pointof view. The different stages of the life cycle of Artemia offer many examples of remarkablephysiological mechanisms.
Abbreviations: 9-AA, 9-aminoacridine; C, cysts; CL, cardiolipin; Chol, cholesterol; Chol-esters, cholesteryl-esters; DAG, diacylglycerol; FFA, free fatty acids; LPA, lysophosphatidic acid; LPC, lysophosphatidylcholine; LPE,lysophosphatidylethanolamine; MALDI-TOF/MS, matrix assisted laser desorption ionization time of flight massspectrometry; NI, nauplii instar I; NII, nauplii instar II; PA, phosphatidic acid; PC, phosphatidylcholine; PE,phosphatidylethanolamine; PG, phosphatidylglycerol; PGP, phosphatidylglycerophosphate; PI, phosphatidylinositol;PS, phosphatidylserine; PSD, post-source decay; SM, sphingomyelin; TAG, triacylglycerol; TLC, thin layer chromatography.
Frontiers in Physiology | www.frontiersin.org 1 January 2019 | Volume 9 | Article 1872
fphys-09-01872 January 18, 2019 Time: 16:27 # 2
Lopalco et al. Lipid Composition of Artemia franciscana
For example, the state of anaerobic quiescence inA. franciscana embryos represents the case of the most profoundmetabolic arrest reported in invertebrates. The mechanism ofquiescence of encysted embryos is unique involving acidificationof the intracellular milieu as major factor controlling catabolicand anabolic down regulation; recovery from the metabolic arrestrequires re-sequestration of the protons with a vacuolar-typeATPase (V-ATPase) (Hand et al., 2011). Cysts remain viable foryears and produce nauplii within 24 h after hydration adoptingfast metabolic changes to sustain the transformation of tissues.
During the differentiation of Artemia cysts, morphologicaland functional changes of mitochondria occur. Immediately afterthe hydration of cysts, at the beginning of the differentiation,significant changes in the mitochondrial respiratory capacity andmarked changes in the morphology of the inner membrane havebeen observed (Schmitt et al., 1973).
Artemia nauplii are capable of regulating the ioniccomposition of the hemolymph against wide ranges of salinitiesthanks to specialized epithelia. It is well known that brineshrimps have the ability to adapt and survive under extremesalinities (up to 15% salinity or 2M salts) as well as in 10%seawater. In hyperosmotic media the gut absorbs ions and waterand gills secrete ions; in fresh water, gills absorb ions and waterin excess is eliminated with urine.
Furthermore because of common environment, theassociation of extreme halophilic microorganisms, such ashalophilic Archaea, with Artemia is considered of ecologicaland physiological interest, given that specific microbes may beimportant in the brine shrimp life cycle and the surroundingfood web (Riddle et al., 2013; Rahmani et al., 2016).
Recently, the lipidome of cysts of A. franciscana has beenstudied in parallel with lipids of mitochondria isolated fromcysts by high resolution shotgun lipidomics, aiming to gainbasic knowledge in the elucidation of actionable extremophilia-affording proteins, such as on the late embryogenesis abundantproteins (LEA), which are known to interact with lipidmembranes (Chen et al., 2016). LEA proteins are particularlyprotective of mitochondrial membranes against dehydrationdamage (Tolleter et al., 2010).
The study of Chen et al. (2016) differentiates itself fromprevious lipid literature about Artemia; in effect, it representsthe first lipidomic study on the Artemia eggs offering detailedinformation on lipid classes, on diversity within the lipid classesand on lipid proportions. Indeed, most of the previous analyticalreports on lipids of Artemia are mainly related to nutritionalanalyses in aquaculture, given that the species is used as instantlive food (Abatzopoulos et al., 2002). Therefore, fatty acidcomposition of Artemia has been frequently studied in the pastbecause its determination is important to assess the nutritionalquality of a source of Artemia.
As regards nutritional issues, it is known that Artemia sp.naturally possesses high contents of neutral lipids and lowcontent of long-chain polyunsaturated fatty acids (LC-PUFA),such as 20:5n-3 (EPA), and especially 22:6n-3 (DHA), which areessential fatty acids for normal development of marine fish larvae(Sargent et al., 1999). In this respect, enrichment with fatty acidsof Artemia sp. was used to tailor its lipid composition toward the
nutritional needs of marine larvae (Webster and Lovell, 1990; VanStappen, 1996; Sargent et al., 1999; Reis et al., 2017).
Specific lipid classes can also be important in fish andcrustacean nutrition. In spite of this, until few years ago,information on the lipid class composition of Artemia wasrelatively scarce.
The present study reports novel data and information on lipidsof Artemia by comparing the lipid composition of three differentforms of life: cysts (C) and two naupliar stages, namely naupliiinstar I (NI) and nauplii instar II (NII).
Here we have used a semiquantitative approach in the lipidanalyses by combining TLC analyses and MALDI-TOF/MS. Ouranalytical approach is suited to give information on variousspecies in different classes of polar and neutral lipids and on theproportion of different lipids in the three different forms of life ofArtemia.
The study of the modification of the lipid composition duringthe development represents the basis to evaluate the changes inlipid metabolic pathways and, more generally, to understand thecontribution of lipids to the development processes.
MATERIALS AND METHODS
MaterialsThe matrix used for MALDI-TOF/MS analyses was 9-Aminoacridine hemihydrate (9-AA) and was purchasedfrom Acros Organics (Morris Plains, NJ, United States). Allorganic solvents used in extraction and MS analyses werecommercially distilled, of the highest available purity, andpurchased from Sigma-Aldrich, J. T. Baker, or Carlo Erba. Thefollowing commercial glycerophospholipids (used as standards):1,2-dimyristoyl-sn-glycero-3-phosphate, 1,2-dimyristoyl-sn-glycero-3-phospho-(1′-rac-glycerol), 1,2-dimyristoyl-sn-glycero-3-phospho-L-serine, 1,2-diphytanoyl-sn-glycero-3-phosphoeth-anolamine, 1′,3′-bis[1,2-dimyristoyl-sn-glycero-3-phospho]-sn-glycerol, 1′,3′-bis[1,2-dioleoyl-sn-glycero-3-phospho]-sn-glycerol were purchased from Avanti Polar Lipids, Inc. (Alabaster,AL, United States).
Preparation of Artemia DecapsulatedCysts and NaupliiArtemia decapsulated cysts and nauplii samples were obtainedaccording to the protocol as described by Sorgeloos et al. (1977).Briefly, Artemia franciscana cysts, originating from the Great SaltLake, Utah, United States (Ocean Nutrition, batch L19516012),were hydrated in sterile distilled water for 1.5 h. Decapsulatedcysts were obtained using 32% NaOH and 50% NaOCl. Thereaction was stopped after 2–4 min by adding 1% Na2S2O3.Decapsulated cysts were then washed with distilled water, beingpart sampled and frozen for analysis and the rest resuspendedin an aerated glass cone containing filtered (0.22 µm) andautoclaved seawater, and then incubated at 28◦C with constantillumination (approximately 2000 lux) for hatching. After 22 and30 h of incubation, respectively, the instar I and instar II wereharvested on a sieve, washed with distilled water and frozen foranalysis.
Frontiers in Physiology | www.frontiersin.org 2 January 2019 | Volume 9 | Article 1872

fphys-09-01872 January 18, 2019 Time: 16:27 # 3
Lopalco et al. Lipid Composition of Artemia franciscana
Lipid ExtractionArtemia decapsulated cysts and nauplii samples were thawed andhomogenized 20-fold on ice with a Potter homogenizer; then totallipids were extracted using the Bligh and Dyer method (Bligh andDyer, 1959). The extracts were dried under N2 before weighingand then dissolved in chloroform (final concentration 10 mg/ml).Fractionation of the total lipid extract by the procedure of coldacetone precipitation yielded a fraction enriched in neutral lipids(Kates, 1986).
TLC AnalysesTotal lipid extracts were analyzed by thin layer chromatography(TLC) on silica gel 60A plates (Merck, 20 × 10 cm, layerthickness 0.2 mm). The plates were washed twice withchloroform/methanol (1:1, by volume) and activated at180◦C before use. Polar lipids were eluted with SolventA (chloroform/methanol/acetic acid/water 85:15:10:3.5, byvolume); the neutral lipids were separated by TLC in Solvent B(hexane/diethyl ether/acetic acid, 70:30:1, by volume).
Lipid detection was carried out by spraying the plate with 5%sulfuric acid in water, followed by charring at 180◦C for 5 min, orexposing the TLC plate to iodine vapor, for staining all classes oflipids. Moreover, the following stainings were performed in orderto identify the different lipid classes present in the TLC bands:(i) molybdenum blue spray reagent (Sigma-Aldrich) specific forphospholipids, and (ii) ninhydrin solution, prepared dissolving0.25 g of reagent grade ninhydrin in 100 ml of acetone-lutidine(9:1, by volume), for phosphatides or lipids carrying a free aminogroup (Kates, 1986).
The estimation of the content of individual polar andneutral lipids of the total lipid extracts was performed byvideo densitometry analysis of spots on TLC, obtained afteraveraging three replicates of C, NI, and NII (ImageJ software).For quantitative determination of lysophosphatidylethanolamine(LPE) content, a standard curve was used. The standard curveof LPE authentic standard stained with ninhydrin solution waslinear in the concentration range 0.5–5.0 µg. In addition, in thiscase the staining intensity was evaluated by densitometry usingImageJ software.
Statistical AnalysisAll densitometric values are expressed as mean ± standarddeviation (SD). One-way ANOVA was used to compare resultsof data from the three conditions (C, NI, and NII) followed byTukey’s HSD post hoc test. P-values less than 0.05 were consideredsignificant. Statistical analysis was made in R environment (RCore Team, 2012).
Isolation and Purification of IndividualLipids From the Total ExtractIn order to analyze in detail the various components of thelipid extracts, bands present on plates were scraped and lipidsextracted from silica were then analyzed by positive and negativeion modes MS.
Briefly the polar lipid components of the total lipidextracts of NII were separated by TLC (Merck 20 × 10 cm
× 0.2 mm thick layer, glass plates) in Solvent A. While,the neutral lipids components were separated by TLC insolvent B. Lipids were visualized by staining with iodine vaporand were eluted and recovered from the scraped silica, aspreviously described (Lobasso et al., 2012; Lopalco et al., 2017).Isolated and purified phospholipids were dissolved in chloroform(1 mg/ml).
Preparation of Lipid Extracts forMALDI-TOF/MS Lipid AnalysesThree microliter of lipid samples in chloroform solution werediluted in 27 µl of 2-propanol/acetonitrile (60/40, by volume),then 10 µl of the diluted solution were mixed with 10 µl of matrixsolution (9-AA, 10 mg/ml in 2-propanol/acetonitrile 60/40, byvolume), as previously described (Sun et al., 2008; Angelini et al.,2015). At variance, spectra of neutral lipids were acquired bypreparing the same matrix solution in the presence of sodiumacetate, as previously described (Sun et al., 2008).
The resulting lipids-matrix solution was then spotted onto theMALDI target (Micro Scout Plate, MSP 96 ground steel target) indroplets of 0.35 µl and analyzed as described below.
After the evaporation of the matrix solvent, the samples areready to be directly analyzed with MALDI-TOF/MS.
MALDI-TOF Mass SpectrometryMALDI-TOF mass spectra of lipid extracts were generallyacquired on a Bruker Microflex LRF mass spectrometer (BrukerDaltonics, Bremen, Germany). The system utilizes a pulsednitrogen laser, emitting at 337 nm, the extraction voltage was20 kV and gated matrix suppression was applied to preventdetector saturation. For each mass spectrum, 2000 single lasershots (sum of 4 × 500) were averaged. The laser fluence waskept about 5% above threshold to have a good signal-to-noiseratio. All spectra were acquired in reflector mode (detectionrange: 200–2000 mass/charge, m/z) using the delayed pulsedextraction; spectra were acquired in negative and positive ionmodes. Spectral mass resolutions and signal-to-noise ratios weredetermined by the software for the instrument: “Flex Analysis3.3” (Bruker Daltonics).
A mix containing 1,2-dimyristoyl-sn-glycero-3-phosphate,1,2-dimyristoyl-sn-glycero-3-phospho-(1′-rac-glycerol), 1,2-dimyristoyl-sn-glycero-3-phospho-L-serine, 1,2-diphytanoyl-sn-glycero-3-phosphoethanolamine, 1′,3′-bis[1,2-dimyristoyl-sn-glycero-3-phospho]-sn-glycerol, 1′,3′-bis[1,2-dioleoyl-sn-glycero-3-phospho]-sn-glycerol was always spotted next to the sampleas external standard and an external calibration was performedbefore each measurement in negative ion mode; the mass rangeof the authentic standards is 590–1450 atomic mass units (amu).A mix containing 1,2-distearoyl-sn-glycero-3-phosphocholine,1,2-dimyristoleoyl-sn-glycero-3-phosphocholine, 1,2-di-O-phytanyl-sn-glycero-3-phosphocholine was always spotted nextto the sample as external standard and an external calibrationwas performed before each measurement in positive ion mode.
Post-Source Decay (PSD) spectra were acquired on aBruker Microflex mass spectrometer (Bruker Daltonics, Bremen,Germany), as previously described (Fuchs et al., 2007). Briefly,
Frontiers in Physiology | www.frontiersin.org 3 January 2019 | Volume 9 | Article 1872
fphys-09-01872 January 18, 2019 Time: 16:27 # 4
Lopalco et al. Lipid Composition of Artemia franciscana
the precursor ions were isolated using a time ion selector. Thefragment ions were refocused onto the detector by steppingthe voltage applied to the reflectron in appropriate increments.This was done automatically by using the “FAST” (fragmentanalysis and structural TOF) subroutine of the Flex Analysissoftware. Mass accuracy of our instrument is 200 ppm (externalcalibration). A specific lipid database (Lipid Maps Database)1
(LIPID MAPS Lipidomics Gateway, 2018) was used to facilitateand confirm the assignment of lipid species.
RESULTS
Thin Layer Chromatography AnalysesReveal That Lysophospholipids andCardiolipin Increase in NaupliiIn order to gain information on lipid profiles during thedevelopment of A. franciscana (Figure 1), we analyzed the totallipid extracts of cysts and two naupliar stages by TLC.
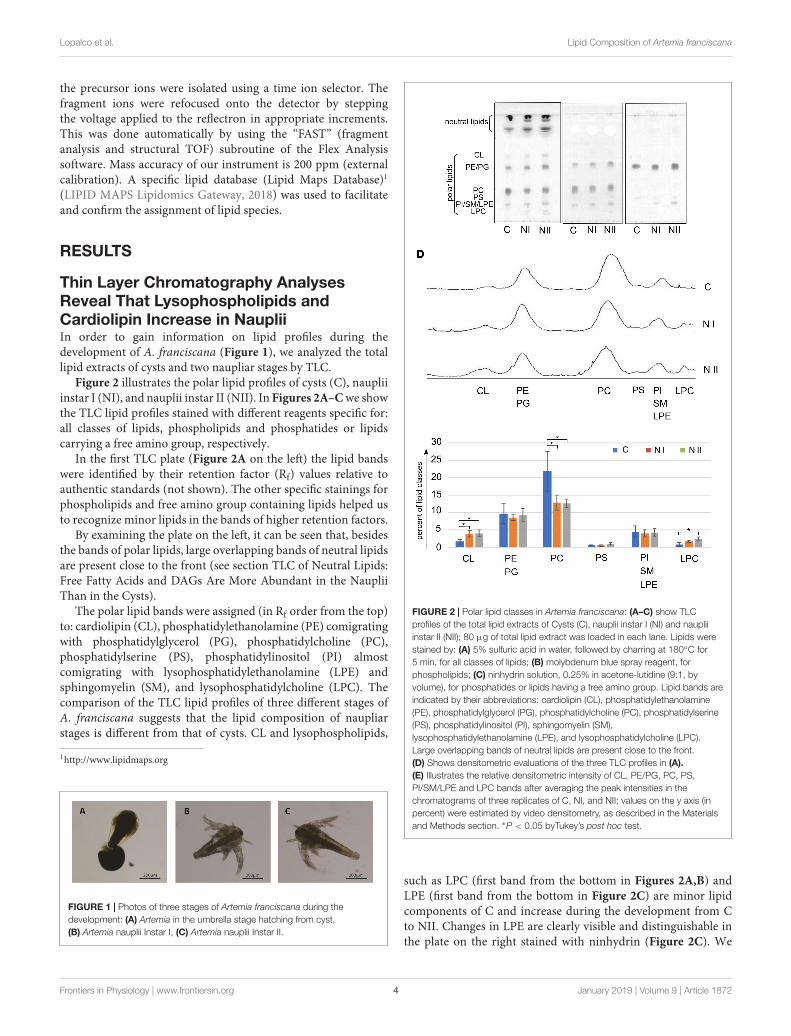
Figure 2 illustrates the polar lipid profiles of cysts (C), naupliiinstar I (NI), and nauplii instar II (NII). In Figures 2A–C we showthe TLC lipid profiles stained with different reagents specific for:all classes of lipids, phospholipids and phosphatides or lipidscarrying a free amino group, respectively.
In the first TLC plate (Figure 2A on the left) the lipid bandswere identified by their retention factor (Rf) values relative toauthentic standards (not shown). The other specific stainings forphospholipids and free amino group containing lipids helped usto recognize minor lipids in the bands of higher retention factors.
By examining the plate on the left, it can be seen that, besidesthe bands of polar lipids, large overlapping bands of neutral lipidsare present close to the front (see section TLC of Neutral Lipids:Free Fatty Acids and DAGs Are More Abundant in the NaupliiThan in the Cysts).
The polar lipid bands were assigned (in Rf order from the top)to: cardiolipin (CL), phosphatidylethanolamine (PE) comigratingwith phosphatidylglycerol (PG), phosphatidylcholine (PC),phosphatidylserine (PS), phosphatidylinositol (PI) almostcomigrating with lysophosphatidylethanolamine (LPE) andsphingomyelin (SM), and lysophosphatidylcholine (LPC). Thecomparison of the TLC lipid profiles of three different stages ofA. franciscana suggests that the lipid composition of naupliarstages is different from that of cysts. CL and lysophospholipids,
1http://www.lipidmaps.org
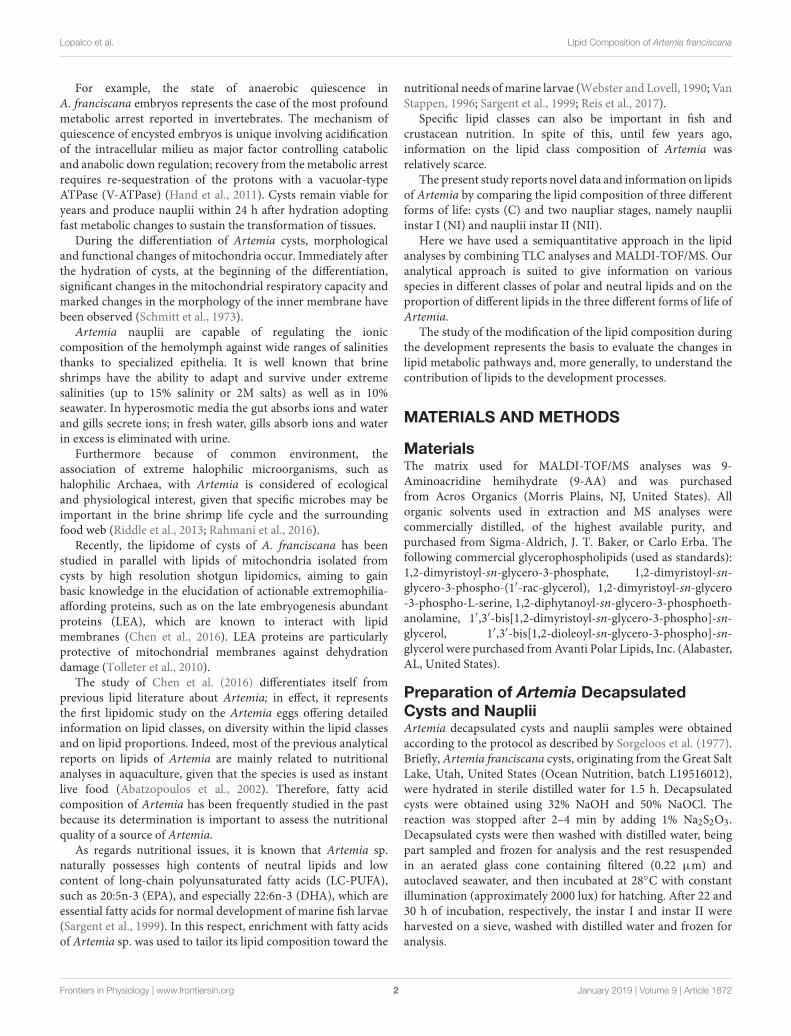
FIGURE 1 | Photos of three stages of Artemia franciscana during thedevelopment: (A) Artemia in the umbrella stage hatching from cyst,(B) Artemia nauplii Instar I, (C) Artemia nauplii Instar II.
FIGURE 2 | Polar lipid classes in Artemia franciscana: (A–C) show TLCprofiles of the total lipid extracts of Cysts (C), nauplii instar I (NI) and naupliiinstar II (NII); 80 µg of total lipid extract was loaded in each lane. Lipids werestained by: (A) 5% sulfuric acid in water, followed by charring at 180◦C for5 min, for all classes of lipids; (B) molybdenum blue spray reagent, forphospholipids; (C) ninhydrin solution, 0.25% in acetone-lutidine (9:1, byvolume), for phosphatides or lipids having a free amino group. Lipid bands areindicated by their abbreviations: cardiolipin (CL), phosphatidylethanolamine(PE), phosphatidylglycerol (PG), phosphatidylcholine (PC), phosphatidylserine(PS), phosphatidylinositol (PI), sphingomyelin (SM),lysophosphatidylethanolamine (LPE), and lysophosphatidylcholine (LPC).Large overlapping bands of neutral lipids are present close to the front.(D) Shows densitometric evaluations of the three TLC profiles in (A).(E) Illustrates the relative densitometric intensity of CL, PE/PG, PC, PS,PI/SM/LPE and LPC bands after averaging the peak intensities in thechromatograms of three replicates of C, NI, and NII; values on the y axis (inpercent) were estimated by video densitometry, as described in the Materialsand Methods section. ∗P < 0.05 byTukey’s post hoc test.
such as LPC (first band from the bottom in Figures 2A,B) andLPE (first band from the bottom in Figure 2C) are minor lipidcomponents of C and increase during the development from Cto NII. Changes in LPE are clearly visible and distinguishable inthe plate on the right stained with ninhydrin (Figure 2C). We
Frontiers in Physiology | www.frontiersin.org 4 January 2019 | Volume 9 | Article 1872

fphys-09-01872 January 18, 2019 Time: 16:27 # 5
Lopalco et al. Lipid Composition of Artemia franciscana
could also identify PS as a pale band close to LPE and PE in themiddle of the TLC plate shown in Figure 2C.
In the Figures 2D,E video densitometric analyses of polarlipids are reported. The peaks of the three chromatograms in theFigure 2D correspond to the relative intensity of polar lipid bandsseparated by TLC (plate in Figure 2A).
The histogram in Figure 2E shows the relative densitometricintensity (as percent) of CL, PE/PG, PC, PS, PI/SM/LPE, andLPC bands after averaging the chromatograms of three replicatesof C, NI, and NII profiles. Percent values of each polar lipidstogether with results of statistical analysis are reported in theTable 1. The most important changes in the proportion of polarlipids during the development are the following: CL and LPCincrease significantly from C to NII; PC is more abundant in thecysts and decrease in the two naupliar stages (from about 22%in the cysts to about 13% in the naupliar stages); PE plus PGcorresponds to about 9–10% of total lipids in all three developingstages. No significant differences in the low PS content of all thesamples have been found. These data indicate that total polarlipids correspond to 30–40%, while the neutral lipids representthe preponderant amount (almost 60–70%).
To evaluate the amount of LPE, we considered the platestained with ninhydrin (Figure 2C) as the overlapping PI andSM bands do not stain. LPE is absent in C, while it amounts to0.8 ± 4.2 µg and 2.3 ± 1.4 µg in 100 micrograms of total lipidsin NI and NII, respectively, as estimated by interpolation witha standard curve (not shown, details in Materials and Methodssection).
Noteworthy an higher content of the mitochondrial lipidmarker CL (clearly seen in the data reported in Figures 2A,D,E)was observed in both the lipid profiles of the two naupliar stages,suggesting an increase in demanding of metabolic energy duringthe development from cysts to naupliar stages.
MALDI-TOF/MS Analyses of IndividualBands Isolated From the Total LipidExtract of Nauplii Instar II by PreparativeTLCTotal lipid extracts of cysts, nauplii instar I and nauplii instarII were analyzed by MALDI-TOF/MS in negative and positive
TABLE 1 | Polar lipid classes identified in cysts, nauplii I, and nauplii II.
Lipid classes % total lipid
Cysts Nauplii I Nauplii II
LPC 0.9 ± 0.6 1.8 ± 0.4 2.6 ± 0.5
PI + SM + LPE 4.6 ± 1.5 4.0 ± 1.0 4.3 ± 1.1
PS 0.8 ± 0.1 0.6 ± 0.2 1.0 ± 0.3
PC 21.8 ± 5.6 12.9 ± 2.2 12.7 ± 1.3
PE + PG 9.7 ± 2.8 8.6 ± 0.9 9.3 ± 1.3
CL 1.8 ± 0.7 3.9 ± 0.8 4.1 ± 0.9
Data are means ± SD of triplicates expressed in percent total lipids. One-wayANOVA [F(2, 6) = 8.35, p = 0.02 for LPC; F(2, 6) = 6.42, p = 0.03 for PC;F(2,6) = 7.76, p = 0.02 for CL] was performed followed by post hoc Tukey’s test.
ion mode (not shown). In our experimental conditions, the massspectra of the total lipid extracts had limited reproducibility,likely due to the preponderant presence of neutral lipids as shownbefore.
The lipid mass spectrometry analyses after chromatographicseparation offer the opportunity to identify minor lipids such ascardiolipins, plasmalogens, and lysophospholipids whose signalswere barely distinguishable from the noise in the MALDI-TOF/MS lipid profiles of the total lipid extracts (not shown).
To further support the TLC assignments and gain detailedinformation on lipid species, the various lipid bands were isolatedby preparative TLC (see plate on the left of Figures 3A,B)and then analyzed by MALDI-TOF/MS (mass spectra ofbands are on the right of the plate in Figures 3A,B).The separation of bands refers to the total lipid extract ofnauplii instar II, where CL and lysocompounds are moreabundant.
Seven bands (B1–B7) of polar lipids stained with iodinevapors were scraped from the plate; then lipids wereextracted from silica (Bligh and Dyer, 1959). TLC bandswere analyzed by MALDI-TOF/MS in positive and negative ionmode, confirming the presence of the glycerophospholipidspreviously identified in the total lipid extracts by TLC(Figure 2).
Figure 3A shows the MALDI-TOF mass spectra of lipid bandsB1, B2, and B4, in positive ion mode; MALDI-TOF mass spectraacquired in negative ion mode refer to the lipid bands B2, B3,B5, and B6 in Figure 3B. A detailed list of all peaks presentin mass spectra acquired in positive and negative ion mode,corresponding to the lipid species present in the lipid bandsand/or in the total lipid extracts, is reported in Tables 2, 3,respectively.
LPC was recognized in the band of highest retention factoron TLC (B1) (Figure 3A). Positive ion mode MALDI-TOF/MSanalyses of B1 revealed peaks at m/z 496.6, 520.5, and 524.5,corresponding to LPC in their protonated form (16:0, 18:2, 18:0,respectively). Furthermore, the peak at m/z 518.5 correspondsto the sodiated form of LPC (16:0) and finally the peaks at m/z510.5 and 538.5 correspond to the plasmenyl-LPC (18:0 and 20:0,respectively).
The mass spectrum of B2, in positive ion mode,revealed the main peaks at m/z 759.7, 773.7, 775.7, 789.7,and 811.6 corresponding to the protonated form of SMspecies and minor peaks at m/z 781.6, 795.7, and 797.6corresponding to the sodiated form of other SM species(listed in Table 2). These data are an agreement ofthose obtained by Chen et al. (2016) and Kojima et al.(2010).
The mass spectrum of B4, acquired in positive ion mode,shows main peaks at m/z 760.6, 782.6, 784.6, and 786.7,corresponding to protonated form of PC species with differentchain length (34:1, 36:4, 36:3, and 36:2, respectively); the peakat m/z 782.6 may also correspond to the sodiated form of PC(34:1); minor peaks at m/z 774.6 and 776.6 are attributable toplasmenyl-PC (36:1 and 36:0, respectively).
B7 contains neutral lipids corresponding to about 60% of totallipid content, as previously shown; more details about these lipids
Frontiers in Physiology | www.frontiersin.org 5 January 2019 | Volume 9 | Article 1872

fphys-09-01872 January 18, 2019 Time: 16:27 # 6
Lopalco et al. Lipid Composition of Artemia franciscana
FIGURE 3 | MALDI-TOF/MS analyses of individual lipid bands isolated from nauplii instar II by TLC. The total lipid extract of NII was loaded on the plate (160 µg pereach lane). TLC was stained with iodine vapors (temporary staining of all classes of lipids). The same chromatography plate is shown on the left of both panels; theRf value of each band corresponds to the Rf value of TLC bands in Figure 2A. Seven lipid bands (B1–B7) were marked with a pencil and silica was scraped; lipidbands were extracted from silica and analyzed by MALDI-TOF/MS. (A) Shows the MALDI/TOF-MS spectra of the lipid bands acquired in positive ion mode; B1, B2,and B4 corresponds to: lysophosphatidylcholine (LPC), sphingomyelin (SM), and phosphatidylcholine (PC), respectively. (B) Shows the MALDI/TOF-MS spectra ofthe lipid bands acquired in negative ion mode; B2 corresponds to lysophosphatidylethanolamine (LPE) and phosphatidylinositol (PI), B3 to phosphatidylserine (PS),B5 to phosphatidylethanolamine (PE) and phosphatidylglycerol (PG) and B6 to cardiolipin (CL). The detailed list of detected peaks is shown in Tables 2, 3.
will be given in the next section TLC of Neutral Lipids: Free FattyAcids and DAGs Are More Abundant in the Nauplii Than in theCysts.
B2 analyzed in negative ion mode shows peaks attributableto both PI and LPE (Figure 3B). In the mass spectrumcorresponding to PI, the main peaks are at m/z 857.6, 859.7,and 885.7 referable to different species (36:4, 36:3, and 38:4,respectively). The peaks at m/z 873.6 and 899.6 can be assignedto the plasmenyl-PI with chains 38:3 and 40:4, in agreement withliterature (Chen et al., 2016). Minor peaks attributable to other PIspecies are also listed in Table 3.
In the low m/z range of the mass spectrum of B2corresponding to LPE, the main peak is at m/z 478.3 attributableto LPE containing an oleic acid chain (18:1). Furthermore,other minor peaks are present at m/z 452.3, 474.2, and 480.3attributable to LPE 16:0, 18:3, and 18:0, respectively. The peakat m/z 494.3 is attributable to plasmenyl-LPE (20:0).
The mass spectrum of B3, acquired in negative ion mode,shows peaks attributable to PS species; the main peaks are at m/z782.6 (36:4) and 784.6 (36:3), listed in Table 3 with other minorPS peaks.
B5, analyzed in negative ion mode, shows two groups of peaksattributable to PE and PG; the main peaks attributable to PEspecies are at m/z 738.5, 740.5, 742.5, and 766.5. In this band
are also present the peaks at m/z 745.5 and 747.5, correspondingto PG.
In the mass spectrum of B6, acquired in negative ion mode, thepeaks in the range m/z 1430–1490 were assigned to CL specieshaving chains constituted by 72 total carbon atoms divided intwo clusters of species with different levels of unsaturations (seeTable 3).
In Figure 4A we show the range m/z 1430–1450 of the MALDImass spectrum corresponding to CL (band B6 of Figure 3B).To have information about the CL structures, PSD analyses havebeen performed. The PSD spectrum of CL atm/z 1440 is shown inFigure 4B; this analysis showed that the main CL species in thenauplii carries four linolenic acid chains, as previously reportedin the literature (Chen et al., 2016).
TLC of Neutral Lipids: Free Fatty Acidsand DAGs Are More Abundant in theNauplii Than in the CystsAlthough all packed at the solvent front in the upper region ofTLC profiles shown in Figure 2A, it can be roughly seen that theneutral lipid components change going from cysts to nauplii. Forthis reason, we further analyzed the neutral lipids of C, NI, andNII by TLC with an eluent designed to highlight various neutral
Frontiers in Physiology | www.frontiersin.org 6 January 2019 | Volume 9 | Article 1872

fphys-09-01872 January 18, 2019 Time: 16:27 # 7
Lopalco et al. Lipid Composition of Artemia franciscana
TABLE 2 | Assignments of m/z values in MALDI–TOF mass spectra detected inpositive ion mode of lipid bands isolated from nauplii instar II.
Lipid classes m/z value [M+H]+ Assignment
LPC 496.630 496.340 16:0
520.540 520.340 18:2
524.593 524.371 18:0
LPC (+Na+) 518.547 518.322 16:0
Plasmenyl-LPC 510.594 510.392 18:0
538.549 538.423 20:0
PC 756.603 756.554 34:3
758.625 758.569 34:2
760.650 760.585 34:1
782.597 782.569 36:4
784.638 784.585 36:3
786.448 786.601 36:2
PC (+Na+) 782.597 782.567 34:1
Plasmenyl-PC 774.612 774.637 36:1
776.627 776.653 36:0
SM 703.643 703.575 d16:1–18:0
759.712 759.637 d16:1–22:0
773.723 773.653 d17:1–22:0
775.701 775.669 d17:0–22:0
789.732 789.684 d18:0–22:0
811.657 811.669 d20:2–22:1
SM (+ Na+) 725.500 725.557 d16:1–18:0
781.630 781.619 d16:1–22:0
795.646 795.635 d17:1–22:0
797.646 797.651 d17:0–22:0
TAG (+Na+) 828.461 827.720 48:1
830.466 829.736 48:0
877.639 877.736 52:4
901.653 901.736 54:6
903.707 903.752 54:5
911.675 911.815 54:1
913.542 913.830 54:0
DAG (+Na+) 587.367 587.475 32:2
615.304 615.507 34:2
639.313 639.507 36:4
641.279 641.522 36:3
The numbers (x:y) denote the total length (as carbon numbers) and number ofdouble bonds of acyl chains, respectively.
lipids in the total extracts (Figure 5A). After the chromatographicrun, polar lipids remain at the bottom of TLC plate (BI), while anumber of bands of neutral lipids were separated along the plateuntil the solvent front (BII – BV).
Neutral lipids were identified by their Rf values relative tostandard markers (not shown).
In BII there are two bands or lipid species. The Rf value of theupper band in BII corresponds to that of cholesterol, while thelower band corresponds to the pigment canthaxanthin (naturallyorange before staining, see TLC bands on the left of Figure 5A);no differences in the cholesterol and pigment bands can be seenin the different Artemia development stages. In addition basedon migration of authentic standards (not shown), we could assess
TABLE 3 | Assignments of m/z values in MALDI –TOF mass spectra detected innegative ion mode of lipid bands isolated from nauplii instar II.
Lipid classes m/z value [M-H]− Assignment
LPE 452.246 452.278 16:0
474.268 474.262 18:3
478.298 478.294 18:1
480.309 480.310 18:0
Plasmenyl-LPE 494.302 494.362 20:0
PI 831.612 831.503 34:3
857.644 857.519 36:4
859.666 859.534 36:3
861.676 861.550 36:2
883.675 883.534 38:5
885.681 885.550 38:4
889.659 889.581 38:2
Plasmenyl-PI 873.652 873.586 38:3
875.667 875.602 38:2
877.673 877.617 38:1
899.666 899.602 40:4
901.685 901.617 40:3
PS 780.609 780.482 36:5
782.628 782.498 36:4
784.643 784.513 36:3
786.649 786.529 36:2
788.667 788.545 36:1
PE 712.516 712.492 34:3
736.544 736.544 36:5
738.557 738.508 36:4
740.565 740.524 36:3
742.582 742.540 36:2
762.546 762.508 38:6
764.565 764.524 38:5
766.580 766.540 38:4
768.585 768.555 38:3
770.586 770.570 38:2
PG 745.563 745.502 34:2
747.563 747.518 34:1
CL 1438.033 1437.889 72:13
1440.056 1439.902 72:12
1442.067 1441.918 72:11
1444.080 1443.934 72:10
1446.091 1445.949 72:9
1448.100 1447.965 72:8
1456.053 1456.028 72:4
1458.053 1458.043 72:3
1460.072 1460.059 72:2
1462.079 1462.074 72:1
The numbers (x:y) denote the total length (as carbon numbers) and number ofdouble bonds of acyl chains, respectively.
that diacylglycerol (DAG) co-migrates with canthaxanthin in BII.By comparing lower band in BII in the three stages, we can seethat DAG is more abundant in the naupliar stages.
The spot in BIII, corresponding to the free fatty acids (FFA), ismore abundant in the naupliar stages than in the cysts.
Frontiers in Physiology | www.frontiersin.org 7 January 2019 | Volume 9 | Article 1872

fphys-09-01872 January 18, 2019 Time: 16:27 # 8
Lopalco et al. Lipid Composition of Artemia franciscana
FIGURE 4 | MALDI-TOF/MS analyses of the CL species of nauplii instar II.(A) Enlargement of range m/z 1430–1450 MALDI-TOF mass spectrum of CLband. Peaks at m/z 1440.1, 1442.1, and 1444.1 correspond to CL speciescontaining four chains of C18 fatty acids with different number of doublebonds. A detailed list of detected peaks of CL is shown in Table 3. (B) PSDanalysis of the peak at m/z 1440.1 from CL band was performed. In thefragmentation patterns of CL, ion fragments correspond to: PGP-H2O (m/z827.1), PG (m/z 747.1), PA (m/z 691.1), LPA (m/z 430.9), LPA-H2O (m/z413.0), and the fatty acid 18:3 (m/z 277.0).
The BIV band contains triacylglycerols (TAGs); these neutrallipids are the most abundant component in all three lipid profiles;in addition, by comparing the three lanes, it can be seen that thecysts contain higher content of TAGs than naupliar stages.
Finally, BV is relative to cholesteryl -esters and no differencescan be seen in the different samples.
Chromatograms shown in Figure 5B correspond to the threeTLC neutral lipid profiles in Figure 5A.
By performing densitometric analyses of neutral lipid profilesand statistical analysis, we confirmed the significantly changes ofTAG, DAG and FFA amounts during the development, from cyststo the first two naupliar stages.
The histogram in Figure 5C shows the relative amount ofneutral lipids in the three-growing states: cysts contain 67% ofTAG that decrease at 49–47% in NI and NII; while FFA andDAG levels are very low in the cysts (3.7 and 2%, respectively)and significantly increase at 20% (FFA) and 6% (DAG) in bothnaupliar stages. Cholesterol and Colesteryl-esters levels do notchange much during the development.
Percent values of different neutral lipids and statistical resultsare reported in the Table 4.
The main species of DAG and TAG recognized by MALDI-TOF/MS analyses of the fraction of neutral lipids isolated after
precipitation in cold acetone (as described in Materials andMethods) are reported in Table 2.
DISCUSSION
Lipids are the major source of metabolic energy and areinvolved in several cellular processes for growth, reproductionand survival of initial larval stages. Besides the structural role,phospholipids are important cofactors of membrane proteinsand substrates of enzymes activated by the signal transductioncascades. Cholesterol, an important lipid component of cellmembrane structure and hormone precursor, is an essentialnutrient for crustaceans; it plays a fundamental role in endocrinefunctions such as for the synthesis of hormones, like ecdysteroidsand sesquiterpenoids, regulating the development (Sánchez-Pazet al., 2006).
In Artemia very few molecular data on the role of lipids inphysiological phenomena as well as on the enzymes involved inlipid metabolism are available in the literature. Information onchanges of lipid composition during the development of Artemiais fragmentary or missing.
Some studies have been carried out in adults, whereas otheranalyses have been reported for nauplii, in most cases ascomplementary information to the main aim of the work. Insome studies lipid analyses on cysts were performed withouttaking into account the presence in the sample of nauplii at thevery initial state of development (Enzler et al., 1974; Gallagherand Brown, 1975; Webster and Lovell, 1990).
Variations in the lipid content and the fatty acid compositionduring the first 24 h of life of Artemia nauplii were studied usingfresh-water-type samples from Great Salt Lake and San FranciscoBay populations (Claus et al., 1979). Soon after, Persoone et al.(1980) also reported data on variations in the lipid contentand fatty acid composition of lipids from cysts to newlyhatched nauplii from several strains. In the 1991, Navarro et al.(1991) analyzed the variations of lipid classes during the firstdevelopment stages using as a model cysts and nauplii fromparthenogenetic diploid strain of Artemia from the “La Mata”lagoon (Torrevieja, Alicante, Spain). The different lipid classes(lysophospholipids, phospholipids, pigments, cholesterol andother neutral lipids) were identified by high performance TLC.Navarro et al. showed a decrease in the percentage of fatty acids16:0 and 16:1n-7 and an increase in 20:5n-3 from cysts to naupliarstages and a decrease in the PC/PE ratio. The implications of thesefindings for the use of Artemia sp. as a larval feed in aquaculturewere widely discussed (Navarro et al., 1991).
The only studies in the literature on lipids of Artemia basedon MALDI-TOF/MS analysis deal with isolated sphingoids,sphingolipids and glycosphingolipids. Kojima et al. studiedin details some complex lipids of cysts of A. franciscana.In particular they characterized minor sphingolipids andglycosphingolipids isolated and purified from the total lipidextract; they discovered that cysts contain novel structures ofglycosphingolipids and fucosylglycosphingolipids not found inother animal species (Kojima et al., 2010, 2011, 2013).
Frontiers in Physiology | www.frontiersin.org 8 January 2019 | Volume 9 | Article 1872

fphys-09-01872 January 18, 2019 Time: 16:27 # 9
Lopalco et al. Lipid Composition of Artemia franciscana
FIGURE 5 | Neutral lipid classes in A. franciscana. (A) Shows TLC profiles of the neutral lipid extracts of cysts (C), nauplii instar I (NI), and nauplii instar II (NII); 80 µgof each total lipid extract was loaded in each lane. Lipids were detected by spraying with 5% sulfuric acid in water, followed by charring at 180◦C for 5 min. BIcorresponds to polar lipids; the lipid bands from BII to BV correspond to neutral lipids. BII is a double band, the lower band contains canthaxanthin (orange beforestaining, see band on the left of the plate) and diacylglycerols (DAG), the upper band was assigned to cholesterol (Chol); BIII, BIV, and BV were assigned to: free fattyacids (FFA), triacylglycerols (TAGs), and cholesteryl esters (Chol-esters), respectively. The molecular structure of the canthaxanthin pigment is shown over the band.(B) Shows chromatograms corresponding to the TLC lipid profiles in (A). (C) Illustrates the relative densitometric intensity of Chol-esters, TAG, FFA, Chol, and DAGbands after averaging the chromatograms of three replicates of C, NI, and NII samples (as described in the Materials and Methods section). ∗P < 0.05, ∗∗P < 0.01by Tukey’s post hoc test.
TABLE 4 | Neutral lipid classes identified in cysts, nauplii I, and nauplii II.
Neutral lipid classes % total neutral lipid
Cysts Nauplii I Nauplii II
Chol-esters 21.3 ± 7.2 20.3 ± 8.1 20.7 ± 11.1
TAG 67.0 ± 3.5 49.0 ± 3.5 47.3 ± 6.6
FFA 3.7 ± 0.6 20.0 ± 1.0 20.3 ± 1.1
Chol 5.7 ± 2.9 4.0 ± 1.7 4.7 ± 2.1
DAG 2.0 ± 1.0 6.3 ± 1.5 6.3 ± 1.5
Data are means ± SD of triplicates expressed in percent total neutral lipids. One-way ANOVA was performed [F(2, 6) = 15.07, p = 0.005 for TAG; F(2, 6) = 385.4,p = 4.61e-07 for FFA; F(2, 6) = 9.98 p = 0.01 for DAG] followed by post hoc Tukey’stest.
We could not detect such complex glycosphingolipids in ourstudy, however, other sphingoid assignments well correspond tothose described in the above studies.
In the present work we used for the first time combinedMALDI-TOF/MS and TLC analyses to compare the main lipidclasses during the development from cysts to two naupliarstages, in order to possibly gain preliminary insights into lipidmetabolism of Artemia.
In general, our data on cysts are in good agreement with thoseof Chen et al. (2016) and, in addition, they neatly document basicchanges in the lipid species during the first stages of development.
Chen et al. assembled the total and mitochondrial lipid profileof A. franciscana cysts by classic shot gun lipidomics (Chen et al.,2016). The number of various lipid species and their abundancein cysts has been assessed in the total lipid extract and theextract of isolated mitochondria. TAGs were the most abundantcomponents in the range from zero to 100 mg of lipid/mg proteinfollowed by PC species; LPE, LPC, and SM were quantified inthe order of 1–2 mg lipid/mg proteins and finally LPA, LPG,and LPI plus other minor components were found to be presentat levels lower than 0.1 mg lipid/mg proteins. In the study
Frontiers in Physiology | www.frontiersin.org 9 January 2019 | Volume 9 | Article 1872

fphys-09-01872 January 18, 2019 Time: 16:27 # 10
Lopalco et al. Lipid Composition of Artemia franciscana
of Chen et al. (2016) particular attention has been dedicated to CLas lipid marker of mitochondria. As expected, due to the presenceof four positions for lipid chains in the molecule, a big number ofCL species have been identified in mitochondria and mitoplastsof cysts; furthermore a number of monolysocardiolipin anddilysocardiolipin species were also described (Chen et al., 2016).
Although with some limitations, we show that many aspectsof the lipid composition of Artemia can be elucidated byour method of analyses. Data on lipid species, chains, polarand neutral lipids have been obtained. In our study neutrallipids, PC, SM, and LPC have been analyzed by MALDI-TOF/MS in the positive ion mode; in parallel CL, PE, PG,PS, PI, LPE have been analyzed in the negative ion mode ofanalysis.
Lipid extracts of Artemia show a preponderant amount ofneutral lipids compared to polar lipids.
The abundance of neutral lipids in cysts (80% of total lipidsNavarro et al., 1992) and nauplii (60%, present paper) indicates agreat availability of energy as storage lipids in these forms of life,but it could also suggest an important physiological role of theselipids in determining the buoyancy of planktonic crustaceans.Here we show for the first time that DAG, the precursor ofphospholipid synthesis, also increases (at the expense of TAG)during the development. DAG represents the backbone for theformation of PC within the Kennedy pathway, whose enzymeswere studied in the past in microsomal preparations from naupliiof the brine shrimp Artemia salina (Ewing and Finamore, 1970).DAG not only plays a role in the lipid biosynthetic reactions,but it is also an important lipid second messenger in signaltransduction.
As regards polar lipids, our data indicate that the ratio PC/PEdecreased progressively from cysts to nauplii, in agreement withabove observations of Navarro et al.
For the first time we document the raise of CL andlysophospholipids levels, indicating an increase in complexity ofmetabolic pathways from cysts to naupliar stages. These changesare clearly associated with differentiation, with the increase of thenumber of molecular functions, as well as with the developmentof the organs and their specialization in nauplii.
The increase of CL in larvae well matches the formationof new cristae during the development, which requires theneosynthesis of the proteins of the respiratory complexes andof the accompanying phospholipids. It clearly suggests a closerelationship between the CL content and the maturation of
mitochondria from cysts to nauplii, and further sheds lighton the important role of CL in the mitochondrial functions.Interestingly two different clusters of CL peaks have been foundin the CL band isolated by TLC that could have differentphysiological roles in nauplii.
Lysophospholipids are bioactive compounds able to interactwith protein membrane receptors and channels, such as theG-protein coupled receptors (GPCRs) and the transient receptorpotential channels (TRPs) operating as cellular sensors andinvolved in various sensory pathways activated by light, chemicaland temperature stimuli (Rivera and Chun, 2008; Zheng, 2013).
Finally, many plasmalogens have been identified in thephospholipid bands isolated by preparative chromatography,some species of PC and LPC, LPE plus many species of PI.Plasmenyl phospholipids are known to release cell-signalingmolecules, affecting intracellular signaling cascades.
CONCLUSION
In conclusion, our study has generated general information onmajor and minor polar lipid components of cell membranestogether with neutral lipids in different forms of life of Artemia.Following our expectations, we have documented an increase oflevels of bioactive lipids in naupliar stages in correspondenceto the increasing complexity of the form of life. The datahere presented may represent the basis for future studiesin order to understand how environmental factors such assalinity, temperature and pH affect the lipid composition of cellmembrane associated with significant effects on the physiology ofthe whole organism and its development.
AUTHOR CONTRIBUTIONS
AC and GVS designed the research. PL and RL-d-S performedthe research. AC, PL, and SL analyzed the data and wrote themanuscript.
FUNDING
This work was supported by Bari University and Regione Puglia(Future in Research).
REFERENCESAbatzopoulos, T. J., Beardmore, J., Clegg, J. S., and Sorgeloos, P. (eds). (2002).
Artemia: Basic and Applied Biology. Berlin: Springer NetherlandsAngelini, R., Lobasso, S., Gorgoglione, R., Bowron, A., Steward, C. G., and
Corcelli, A. (2015). Cardiolipin fingerprinting of leukocytes by MALDI-TOF/MS as a screening tool for Barth syndrome. J. Lipid Res. 56, 1787–1794.doi: 10.1194/jlr.D059824.
Bligh, E. G., and Dyer, W. J. (1959). A rapid method of total lipid extractionand purification. Can. J. Biochem. Physiol. 37, 911–917. doi: 10.1139/o59-099.
Chen, E., Kiebish, M. A., McDaniel, J., Gao, F., Narain, N. R., Sarangarajan, R., et al.(2016). The total and mitochondrial lipidome of Artemia franciscana encysted
embryos. Biochim. Biophys. Acta 1861, 1727–1735. doi: 10.1016/j.bbalip.2016.08.007.
Claus, C., Benijts, F., Vandeputte, G., and Gardner, W. (1979). The biochemicalcomposition of the larvae of two strains of Artemia salina (L.) reared on twodifferent algal foods. J. Exp. Mar. Biol. Ecol. 36, 171–183. doi: 10.1016/0022-0981(79)90107-2.
Enzler, L., Smith, V., Lin, J. S., and Olcott, H. S. (1974). The lipids of Mono Lake,California, brine shrimp (Artemia salina). J. Agric. Food Chem. 22, 330–331.doi: 10.1021/jf60192a017
Ewing, R. D., and Finamore, F. J. (1970). Phospholipid metabolism duringdevelopment of the brine shrimp Artemia salina. II. Synthesis of phosphatidylcholine by a microsomal enzyme system from nauplii. Biochim. Biophys. Acta218, 474–481. doi: 10.1016/0005-2760(70)90010-X
Frontiers in Physiology | www.frontiersin.org 10 January 2019 | Volume 9 | Article 1872

fphys-09-01872 January 18, 2019 Time: 16:27 # 11
Lopalco et al. Lipid Composition of Artemia franciscana
Fisheries and Aquaculture Resources Use and Conservation Division (2017).“Report of the FAO Expert workshop on sustainable use and management ofArtemia resources in Asia,” in Proceeding of the FAO Fisheries and AquacultureReport, (Rome: FAO).
Fuchs, B., Schober, C., Richter, G., Süß, R., and Schiller, J. (2007). MALDI-TOFMS of phosphatidylethanolamines: different adducts cause different post sourcedecay (PSD) fragment ion spectra. J. Biochem. Biophys. Methods 70, 689–692.doi: 10.1016/j.jbbm.2007.03.001.
Gallagher, M., and Brown, W. D. (1975). Composition of San Francisco Baybrine shrimp (Artemia salina). J. Agric. Food Chem. 23, 630–632. doi: 10.1021/jf60200a008.
Hand, S. C., Menze, M. A., Borcar, A., Patil, Y., Covi, J. A., Reynolds, J. A.,et al. (2011). Metabolic restructuring during energy-limited states: insights fromArtemia franciscana embryos and other animals. J. Insect Physiol. 57, 584–594.doi: 10.1016/j.jinsphys.2011.02.010.
Kates, M. (ed.) (1986). Techniques of Lipidology. New York, NY: ElsevierKojima, H., Inoue, T., Sugita, M., Itonori, S., and Ito, M. (2010). Biochemical
studies on sphingolipid ofArtemia franciscana (I) isolation and characterizationof sphingomyelin. Lipids 45, 635–643. doi: 10.1007/s11745-010-3438-8.
Kojima, H., Shimizu, T., Sugita, M., Itonori, S., Fujita, N., and Ito, M. (2011).Biochemical studies on sphingolipids of Artemia franciscana: novel neutralglycosphingolipids. J. Lipid Res. 52, 308–317. doi: 10.1194/jlr.M010173.
Kojima, H., Tohsato, Y., Kabayama, K., Itonori, S., and Ito, M. (2013).Biochemical studies on sphingolipids of Artemia franciscana: complex neutralglycosphingolipids. Glycoconj. J. 30, 257–268. doi: 10.1007/s10719-012-9436-8.
LIPID MAPS Lipidomics Gateway (2018). Available at: http://www.lipidmaps.orgLobasso, S., Lopalco, P., Angelini, R., Vitale, R., Huber, H., Müller, V., et al.
(2012). Coupled TLC and MALDI-TOF/MS analyses of the lipid extract ofthe hyperthermophilic archaeon Pyrococcus furiosus. Archaea 2012:957852. doi:10.1155/2012/957852.
Lopalco, P., Stahl, J., Annese, C., Averhoff, B., and Corcelli, A. (2017). Identificationof unique cardiolipin and monolysocardiolipin species in Acinetobacterbaumannii. Sci. Rep. 7:2972. doi: 10.1038/s41598-017-03214-w.
Navarro, J. C., Amat, F., and Sargent, J. R. (1991). A study of the variations in lipidlevels, lipid class composition and fatty acid composition in the first stages ofArtemia sp. Mar. Biol. 111, 461–465. doi: 10.1007/BF01319419.
Navarro, J. C., Amat, F., and Sargent, J. R. (1992). Lipid composition of cysts of thebrine shrimp Artemia sp. from Spanish populations. J. Exp. Mar. Biol. Ecol. 155,123–131. doi: 10.1016/0022-0981(92)90031-5.
Persoone, G., Sorgeloos, P., Roels, O. A., and Jaspers, E. (1980). The BrineShrimp Artemia: Proceedings of the International Symposium on the BrineShrimp Artemia salina, Corpus Christi. Available at: http://www.vliz.be/en/imis?module=ref&refid=6599&printversion=1&dropIMIStitle=1
Rahmani, R., Zarrini, G., Aein, F., and Hosseingholi, E. Z. (2016). Identificationof extremely halophilic archaea associated with adult Artemia urmiana.Microbiology 85, 386–388. doi: 10.1134/S0026261716030127.
R Core Team (2012). R: A Language and Environment for Statistical Computing.Vienna: R Foundation for Statistical Computing. Available at: http://www.R-project.org/
Reis, D. B., Acosta, N. G., Almansa, E., Navarro, J. C., Tocher, D. R., Andrade, J. P.,et al. (2017). Comparative study on fatty acid metabolism of early stages of two
crustacean species: Artemia sp. metanauplii and Grapsus adscensionis zoeae, aslive prey for marine animals. Comp. Biochem. Physiol. B Biochem.Mol. Biol. 204,53–60. doi: 10.1016/j.cbpb.2016.11.002.
Riddle, M. R., Baxter, B. K., and Avery, B. J. (2013). Molecular identification ofmicroorganisms associated with the brine shrimp Artemia franciscana. Aquat.Biosyst. 9:7. doi: 10.1186/2046-9063-9-7.
Rivera, R., and Chun, J. (2008). Biological effects of lysophospholipids. Rev. Physiol.Biochem. Pharmacol. 160, 25–46. doi: 10.1007/112_0507.
Sánchez-Paz, A., García-Carreño, F., Muhlia-Almazán, A., Peregrino-Uriarte,A. B., Hernández-López, J., and Yepiz-Plascencia, G. (2006). Usage of energyreserves in crustaceans during starvation: status and future directions. InsectBiochem. Mol. Biol. 36, 241–249. doi: 10.1016/j.ibmb.2006.01.002.
Sargent, J., McEvoy, L., Estevez, A., Bell, G., Bell, M., Henderson, J., et al.(1999). Lipid nutrition of marine fish during early development: current statusand future directions. Aquaculture 179, 217–229. doi: 10.1016/S0044-8486(99)00191-X.
Schmitt, H., Grossfeld, H., and Littauer, U. Z. (1973). Mitochondrial biogenesisduring differentiation of Artemia salina cysts. J. Cell Biol. 58, 643–649. doi:10.1083/jcb.58.3.643
Sorgeloos, P., Bossuyt, E., Laviña, E., Baeza-Mesa, M., and Persoone, G. (1977).Decapsulation of Artemia cysts: a simple technique for the improvement ofthe use of brine shrimp in aquaculture. Aquaculture 12, 311–315. doi: 10.1016/0044-8486(77)90209-5.
Sun, G., Yang, K., Zhao, Z., Guan, S., Han, X., and Gross, R. W. (2008).Matrix-assisted laser desorption/ionization time-of-flight mass spectrometricanalysis of cellular glycerophospholipids enabled by multiplexed solventdependent analyte-matrix interactions. Anal. Chem. 80, 7576–7585. doi: 10.1021/ac801200w.
Tolleter, D., Hincha, D. K., and Macherel, D. (2010). A mitochondrial lateembryogenesis abundant protein stabilizes model membranes in the dry state.Biochim. Biophys. Acta 1798, 1926–1933. doi: 10.1016/j.bbamem.2010.06.029.
Van Stappen, G. (1996). “Introduction, biology and ecology of Artemia,” in Manualon the Production and Use of Live Food for Aquaculture, eds Lavens, P, Sorgeloos,P, (Rome: FAO), 79–106.
Webster, C. D., and Lovell, R. T. (1990). Response of striped bass larvae fed brineshrimp from different sources containing different fatty acid compositions.Aquaculture 90, 49–61. doi: 10.1016/0044-8486(90)90282-R.
Zheng, J. (2013). Molecular Mechanism of TRP Channels. Compr. Physiol. 3,221–242. doi: 10.1002/cphy.c120001.
Conflict of Interest Statement: The authors declare that the research wasconducted in the absence of any commercial or financial relationships that couldbe construed as a potential conflict of interest.
Copyright © 2019 Lopalco, Lobasso, Lopes-dos-Santos, Van Stappen and Corcelli.This is an open-access article distributed under the terms of the Creative CommonsAttribution License (CC BY). The use, distribution or reproduction in other forumsis permitted, provided the original author(s) and the copyright owner(s) are creditedand that the original publication in this journal is cited, in accordance with acceptedacademic practice. No use, distribution or reproduction is permitted which does notcomply with these terms.
Frontiers in Physiology | www.frontiersin.org 11 January 2019 | Volume 9 | Article 1872