load active power transfer enhancement using upqc-pv …
TRANSCRIPT

Received: January 2, 2020. Revised: February 13, 2020. 329
International Journal of Intelligent Engineering and Systems, Vol.13, No.2, 2020 DOI: 10.22266/ijies2020.0430.32
Load Active Power Transfer Enhancement Using UPQC-PV-BES System
With Fuzzy Logic Controller
Amirullah Amirullah1* Adiananda Adiananda1 Ontoseno Penangsang2 Adi Soeprijanto2
1Electrical Engineering Study Program, Faculty of Engineering,
Universitas Bhayangkara Surabaya, Surabaya 60231, Indonesia 2Department of Electrical Engineering, Faculty of Intelligent Electrical and Informatics Technology,
Institut Teknologi Sepuluh Nopember, Surabaya 60111, Indonesia
* Corresponding author’s Email: [email protected]
Abstract: This paper presents enhancement of load active power transfer using Unified Power Quality Conditioner-
Photovoltaic-Battery Energy Storage (UPQC-PV-BES) system. This system is connected to a three phase three wire
(3P3W) system with a voltage of 380 V (line to line) and 50 hertz. The proposed model is also compared with UPQC
and UPQC-PV respectively. The parameters investigated are load voltage, load current, load active power, and
efficiency. BES functions to save excess energy generated by PV, distribute it to the load, avoid interruption voltage,
and regulate the charging process and energy utilization. The fuzzy logic controller (FLC) is proposed and compared
with proportional integral (PI) method to control DC voltage variable and input DC reference voltage, to produce a
reference current source on hysteresis current controller on shunt active filter in 12 disturbance scenarios (scns). In
Scenario (Scn) 1 to 5, the 3P3W system uses three combinations of UPQC with PI controller and FLC, still keeps
load voltage and load current above 300 V and 8 A. Whereas in Scn 6, only the UPQC-PV-BES with FLC is able to
maintain load voltage and load current higher compared to UPQC and UPQC-PV combinations as 304.1 V and 8.421
A, respectively. In Scn 1 to 5, the 3P3W system uses three combinations of UPQC with PI controller and FLC,
capable of producing load active power above 3600 W. Whereas in Scn 6, only a combination of UPQC-PV-BES
with PI controller and FLC is able to produce a load voltage of 3720 W and 3700 W, respectively. In Scn 1 to 6,
UPQC-PV-BES results in lower efficiency compared to using UPQC and UPQC-PV. However, in Scn 6, UPQC-PV-
BES with FLC is able to produce load voltage, load current, and load active power higher than UPQC-PV and UPQC.
Thus, the UPQC-PV-BES model using FLC is able to compensate load voltage and load current, as well as to
enhance load active power, especially for an interruption on source bus. This research is simulated using
Matlab/Simulink.
Keywords: Load active power transfer, UPQC, PV, BES, FLC, Disturbance Scns.
1. Introduction
The degradation of fossil energy sources and
increasing concerns about environmental impacts
have caused renewable energy (RE) sources i.e.
photovoltaic (PV) and wind to develop into
alternative energy on power generation. Solar or PV
generator is one of the most potential RE
technologies because it only converts sunlight to
generate electricity, where the resources are
available in abundant and they are free and
relatively clean. Indonesia has a huge energy
potential from the sun because it is located in the
equator. Almost all regions of Indonesia receive
around 10 to 12 hours of sunshine per day, with an
average radiation intensity of 4.5 kWh/m2 or
equivalent to 112.000 GW.
Although, PV is able to generate power, this
equipment also has disadvantage: it results in a
number of voltage and current interferences, as well
as harmonics due to the presence of several types of
PV devices and power converters and increasing the
Received: January 2, 2020. Revised: February 13, 2020. 330
International Journal of Intelligent Engineering and Systems, Vol.13, No.2, 2020 DOI: 10.22266/ijies2020.0430.32
number of non-linear loads connected to the source,
causing a decrease in power quality (PQ). In order to
overcome this problem and to improve PQ due to
the presence of non-linear load and integration of
PV into the grid, UPQC was proposed. This device
has been a function to compensate for problems of
voltage source quality i.e. sag, swell, unbalance,
flicker, harmonics, and load current quality
problems i.e. harmonics, imbalance, reactive current,
and neutral current. UPQC was part of an active
power filter consisting of shunt active filter and
series active filter connected in parallel and serving
as a superior controller to solve a number of PQ
problems simultaneously [1].
UPQC series section was responsible for
reducing a number of disturbances on source side i.e.
sag/swell voltage, flicker, unbalanced voltage, and
source voltage harmonics. This equipment serves to
inject a certain amount of voltage to keep load
voltage at desired level so that it returns to balance
and distortion free. UPQC shunt section was
responsible for overcoming current quality problems
e.g. low power factor, load current harmonics, and
unbalanced current. This device has a function of
injecting current into AC system so that source
current becomes a balanced sinusoidal and in phase
with source voltage [2]. The design and dynamic
performance of integrated PV with UPQC (PV-
UPQC) under variable radiation condition and
voltage sag/swell, and load unbalance has been
investigated [3]. The proposed system was able to
combine both the benefits of distributed generators
(DGs) and active power filters. The PV-UPQC
combination was also able to reduce harmonics due
to nonlinear loads and was able to keep total
harmonics distortion (THD) of grid voltage, load
voltage and grid current below the IEEE-519. The
system was found to be stable under radiation
variations, voltage sag/swell, and load unbalance
conditions.
The dynamic performance of the proposed
model based auto tuned PI controller for PV-UPQC
systems has been analyzed [4]. Online model
optimization methodology was implemented for PV-
UPQC to determine the best value of PI controller
gain. The Vector-Proportional Integral (UV-PI) and
Proportional Resonant-Response (PR-R) controllers
in shunt and series converters significantly increase
PV-UPQC performance by reducing convergence
time, settling time, switching harmonics, complexity
and dynamic response show that they became more
effective. PV-UPQC performance using control
algorithm based on Synchronous Reference Frame
(SRF) with Phase Lock Loop (PLL) mechanism has
been presented [5]. Unbalanced load voltage
containing harmonics and pure unbalanced load
voltage had been compensated and balanced so that
the load voltage was kept constant by PV-UPQC.
UPQC was supplied by 64 PV panels using
boost converters, PI controllers, maximum power
point tracking (MPPT) with Pertub and Observer (P
and O), and having a momentary reactive power
theory (p-q theory) which has been proposed [6].
The system has succesfully to carried out reactive
power compensation and reduced source current and
load voltage harmonics. However, this study did not
address mitigation of sag voltage reduction and
other disturbances caused by PV penetration. PV
supported by UPQC using Space Vector Pulse
Width Modulation (SVPWM) compared to
hysteresis control in a 3P3W distribution system has
been proposed [7]. This model is used to improve
PQ and to reduce the burden of three-phase AC
network by supplying power obtained from PV
array. The UPQC system was able to supply reactive
power needed to increase power factor, reduce
voltage and current distortion and help inject active
power by PV into the load. A conceptual study of
UPQC on three phase four wire (3P4W) system
connected to linear and non-linear loads
simultaneously has been carried out [8]. A
sinusoidal current control strategy drives UPQC in
such a way that the supply system draws a constant
sinusoidal current under steady state conditions. In
addition, the shunt converter also produced reactive
power as required by load so that it could improve
an input power factor and reduce THD of source
current.
Artificial neural network (ANN) based on SRF
theory as a control to compensate for PQ problems
of 3P3W system through UPQC for various
balanced/unbalanced/distorted conditions at load
and source has been proposed [9]. The proposed
model has successfully mitigated harmonics/reactive
currents, unbalanced source and load, and
unbalanced current/voltage. The weakness of neural
network (NN) requires time for learning (training)
and testing process, so that it produces longer
control responses when determining output variables.
Investigation on PQ of enhancements including sag
and source voltage harmonics on the grid using
UPQC provided by PV array connected to DC links
using PI compared to FLC has been conducted [10].
The simulation showed that FLC on UPQC and PV
can improve THD voltage source better than PI.
The improvement of PQ using UPQC on
microgrid supplied by PV and wind turbine has been
implemented using PI and FLC. Both methods are
able to improve PQ and to reduce distortion in
output power [11]. Research on the use of BES in

Received: January 2, 2020. Revised: February 13, 2020. 331
International Journal of Intelligent Engineering and Systems, Vol.13, No.2, 2020 DOI: 10.22266/ijies2020.0430.32
UPQC supplied by PV to improve PQ in 3P3W
distribution systems using FLC validated PI
controller on various disturbances in source and load
side has been investigated [12]. The research
showed that FLC on UPQC-BES supplied by PV
was able to significantly reduce source current
harmonics and load voltage harmonics in number of
disturbances, especially in interruption voltage
disturbance on source bus. The grid-connected
UPQC combined with a PV generator was proposed
by [13] using a converter topology and by [14] using
dual UPQC applied to three phase four wire (3P4W)
system. Both researches showed that the topology
had the capacity to compensate for network
disturbances, inject power generated by PV panels
under different operating conditions, and was able to
compensate THD voltage on load bus and THD
current on source bus. Research on biogeography-
based optimization with harmonic elimination
techniques for modification of UPQC connected to
smartgrid has been carried out [15]. Low-order
harmonics are eliminated by choosing the right
switching angle and at the same time high-order
harmonics are suppressed by injecting the same
harmonics magnitude but opposite the phase by
other converters. Excitation from the UPQC
converter modification is obtained from the PV
panel. The firing angle of shunt-series converter is
obtained in real-time from an angle already stored in
the microcontroller memory.
The previous research on UPQC-PV which has
been carried out aims to compensate for sag/swell
voltage on source bus, to reduce THD caused by
distorted supply and non-linear loads, as well as to
mitigate unbalanced loads. However, this
combination has several disadvantages. This system
is unable to overcome voltage interruption in source
bus if PV power connected to UPQC DC-link circuit
is insufficient to meet load power and the duration
of interruption (momentary) exceeds 3 seconds base
on limit IEEE 1159-1995 Standard. This research
proposes enhancement of load active power transfer
using UPQC-PV-BES system that is connected to a
3P3W system with a voltage of 380 V (line to line)
and 50 hertz. The effectiveness of the proposed
model is validated with UPQC and UPQC-PV,
respectively. BES functions to store excess energy
generated by PV, distribute it to the load if
necessary, prevent interruption voltage, and regulate
the charging process and energy utilization. BES is
also expected to be able to save surplus power
generated by PV and be used as a backup power.
The FLC is proposed and compared with PI method
to control DC voltage variable and input DC
Table 1. Abbreviation
Symbol Description
UPQC Unified Power Quality Conditioner
PV Photovoltaic
BES Battery Energy Storage
RE Renewable Energy
DG Distributed Generation
FLC Fuzzy Logic Controller
PI Proportional Integral
NL Non Linear Load
MPPT Maximum Power Point Tracking
3P3W Three Phase Three Wire
3P4W Three Phase Four Wire
P and O Perturb and Observe
CBs Circuit Breakers
FIS Fuzzy Inference System
MFs Membership Functions
Scn Scenario
reference voltage to produce a reference current
source on hysteresis current controller on active
shunt filter in 12 disturbance scns. The FLC is
proposed and compared with PI, because it has a
weakness in determining proportional and integral
gain constants which remain using trial and error
method. The parameters observed are voltage and
current on source bus, voltage and current on load
bus, source active power, series active power
transfer, shunt active power, load active power, PV
power, and BES power. The next step is to
determine efficiency value of each UPQC
combination to show which circuit has a higher
performance in enhancing of load active power
transfer and in maintaining of load voltage and load
current.
This paper is presented as follow. Section 2
explains proposed method, UPQC-PV-BES system
model, parameter simulation, PV circuit model,
active series and shunt filter control, application of
PI controller and FLC, as well as UPQC efficiency
for proposed model. Section 3 shows results and
discussion of load voltage, load current, source
active power transfer, load active power transfer,
series active power transfer, shunt active power
transfer, PV power, BES power using FLC validated
with PI controller. In this section, six disturbance
scns are presented and the results are verified with
Matlab/Simulink. Finally, this paper is concluded in
Section 4. Table 1 shows the abbreviations used in
this paper.
2. Research method

Received: January 2, 2020. Revised: February 13, 2020. 332
International Journal of Intelligent Engineering and Systems, Vol.13, No.2, 2020 DOI: 10.22266/ijies2020.0430.32
2.1 Proposed method
Fig. 1 shows the proposed model of PV
connected to a 3P3W with 380 V (line-line) and 50
hertz, through a series of DC links UPQC and BES.
The PV generator raises DC power at a constant
temperature and solar radiation level (1000 W/m2
and 250 C) and is connected to BES through DC/DC
boost converter circuit. The MPPT method with P
and O algorithm helps PV to produce peak power,
generate an output voltage, which then become an
input voltage for DC/DC boost converter. The boost
converter functions to adjust duty cycle value with
PV output voltage as an input voltage to result an
output voltage according to DC-link voltage. BES is
connected to the DC-link which serves as energy
storage and is expected to inject power to keep load
voltage and load active power, especially for an
interruption voltage from source bus.
Investigation of the proposed model is carried
out on three UPQC combinations connected to
3P3W (on-grid) system via a DC link circuit. The
three combinations are UPQC, UPQC-PV, and
UPQC-PV-BES. Two single phase circuit breakers
(CBs) are used to connect and disconnect PV and
BES to UPQC DC-link. Each combination of circuit
in each condition consists of six disturbance scns i.e.
NL (Non-Linear Load), Unbalance-NL (Unba-NL),
Distorted-NL (Dis-NL), Sag-NL, Swell-NL, and
Interruption-NL (Inter-NL). FLC is used as DC
voltage control on shunt active filter to fix PQ in
each fault scn and the results are validated with PI
control. Each scn in UPQC uses PI and FLC
controller so that the total number of disturbances
are 12. The measured parameters are voltage and
current on the source bus, voltage and current on the
load bus, source active power, series active power
transfer, shunt active power, load active power, PV
power, and BES power. The next step is to
determine nominal of efficiency of each UPQC
combination to show the circuit that has superior
performance in maintaining load voltage, load
current, and load active power under six disturbance
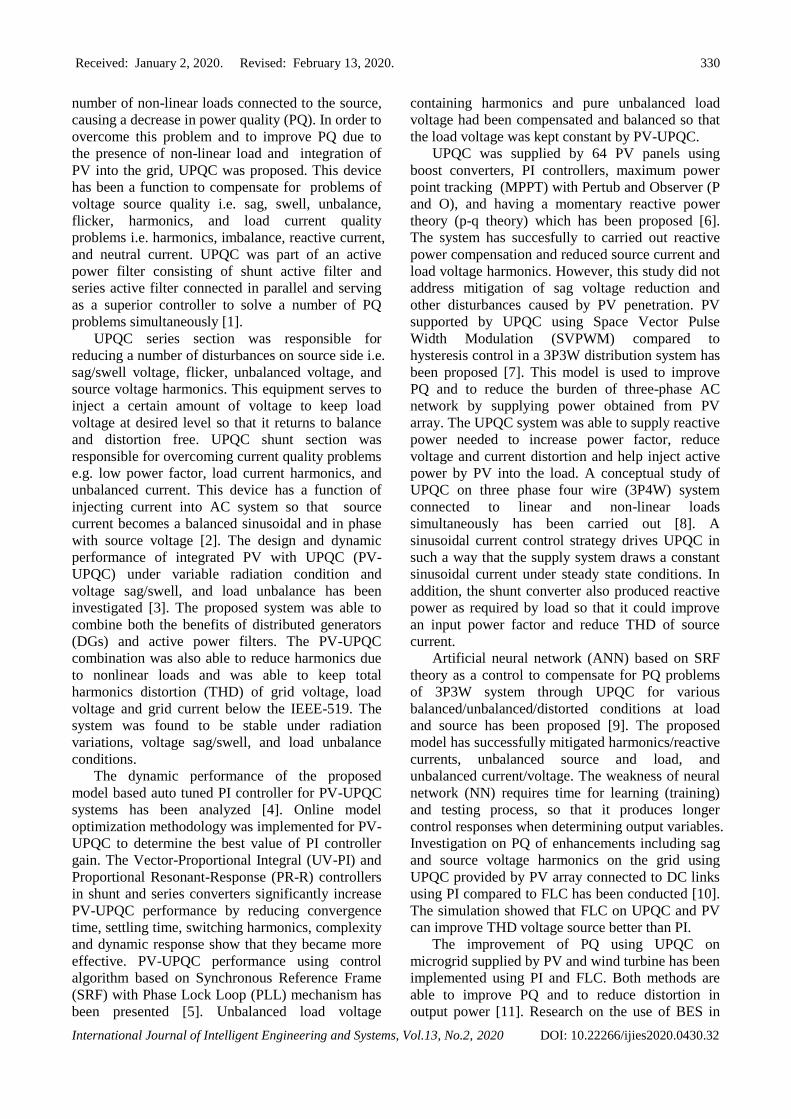
scns. Fig. 2 shows active power transfer using
UPQC-PV-BES. Simulation parameters for the
proposed model is shown in appendix section.
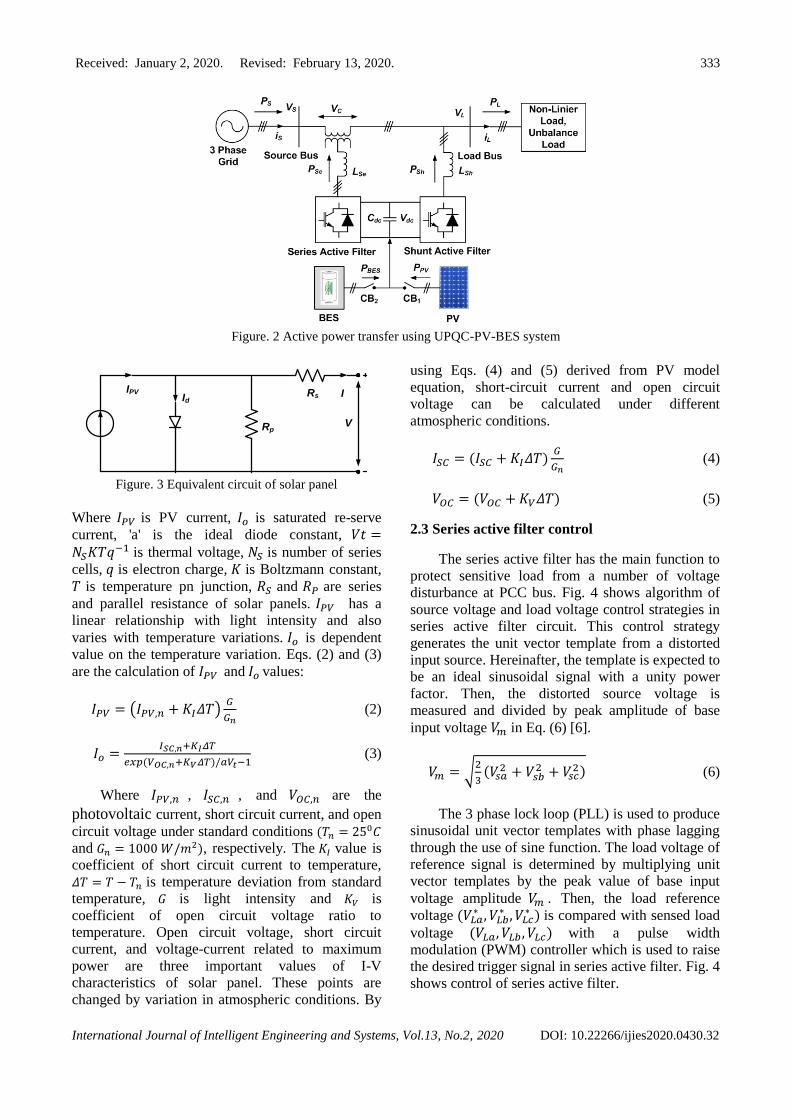
2.2 Modelling of photovoltaic
The equivalent circuit of solar panel is shown in
Fig. 3. It consists of several PV cells which have
external connections in series, parallel, or series-
parallel [16].
The V-I characteristic is shown in Eq. (1):
𝐼 = 𝐼𝑃𝑉−𝐼𝑜 [𝑒𝑥𝑝 (𝑉+𝑅𝑆𝐼
𝑎 𝑉𝑡) − 1] −
𝑉+𝑅𝑆𝐼
𝑅𝑃 (1)
Shunt Active Filter
Cdc
Vdc
Battery Energy Storage Boost Converter
i sh
b
i sh
c
i sh
a
iLa
iLb
iLc
CB2
3 Phase
Grid
LSRS
Lse
- +
+
+
-
-
vca
vcb
vcc
Cr RrLSRS
LSRS
Lse
Lse
VSa iSa
iSb
iSc
VSb
VSc
Series Active Filter
LCRC
LCRC
LCRC
VLa
VLc
VLb
C1
R1
C2
R2
C3
R3
LL
RL
Rectifier
Unbalance
Load
Non Linear Load
PV Array
Lsh
Lsh
Lsh
Cpv
L
CL
L1
C1
ipv
+
-
vpv
Source Bus Load Bus
CB1
UPQC-BES-PV System
Figure. 1 Proposed model using UPQC-PV-BES
Received: January 2, 2020. Revised: February 13, 2020. 333
International Journal of Intelligent Engineering and Systems, Vol.13, No.2, 2020 DOI: 10.22266/ijies2020.0430.32
Figure. 2 Active power transfer using UPQC-PV-BES system
IPVId
Rp
Rs I
V
Figure. 3 Equivalent circuit of solar panel
Where 𝐼𝑃𝑉 is PV current, 𝐼𝑜 is saturated re-serve
current, 'a' is the ideal diode constant, 𝑉𝑡 =𝑁𝑆𝐾𝑇𝑞−1 is thermal voltage, 𝑁𝑆 is number of series
cells, 𝑞 is electron charge, 𝐾 is Boltzmann constant,
𝑇 is temperature pn junction, 𝑅𝑆 and 𝑅𝑃 are series
and parallel resistance of solar panels. 𝐼𝑃𝑉 has a
linear relationship with light intensity and also
varies with temperature variations. 𝐼𝑜 is dependent
value on the temperature variation. Eqs. (2) and (3)
are the calculation of 𝐼𝑃𝑉 and 𝐼𝑜 values:
𝐼𝑃𝑉 = (𝐼𝑃𝑉,𝑛 + 𝐾𝐼𝛥𝑇)𝐺
𝐺𝑛 (2)
𝐼𝑜 =𝐼𝑆𝐶,𝑛+𝐾𝐼𝛥𝑇
𝑒𝑥𝑝 (𝑉𝑂𝐶,𝑛+𝐾𝑉𝛥𝑇)/𝑎𝑉𝑡−1 (3)
Where 𝐼𝑃𝑉,𝑛 , 𝐼𝑆𝐶,𝑛 , and 𝑉𝑂𝐶,𝑛 are the
photovoltaic current, short circuit current, and open
circuit voltage under standard conditions (𝑇𝑛 = 250𝐶
and 𝐺𝑛 = 1000 𝑊/𝑚2), respectively. The 𝐾𝐼 value is
coefficient of short circuit current to temperature,
𝛥𝑇 = 𝑇 − 𝑇𝑛 is temperature deviation from standard
temperature, 𝐺 is light intensity and 𝐾𝑉 is
coefficient of open circuit voltage ratio to
temperature. Open circuit voltage, short circuit
current, and voltage-current related to maximum
power are three important values of I-V
characteristics of solar panel. These points are
changed by variation in atmospheric conditions. By
using Eqs. (4) and (5) derived from PV model
equation, short-circuit current and open circuit
voltage can be calculated under different
atmospheric conditions.
𝐼𝑆𝐶 = (𝐼𝑆𝐶 + 𝐾𝐼𝛥𝑇)𝐺
𝐺𝑛 (4)
𝑉𝑂𝐶 = (𝑉𝑂𝐶 + 𝐾𝑉𝛥𝑇) (5)
2.3 Series active filter control
The series active filter has the main function to
protect sensitive load from a number of voltage
disturbance at PCC bus. Fig. 4 shows algorithm of
source voltage and load voltage control strategies in
series active filter circuit. This control strategy
generates the unit vector template from a distorted
input source. Hereinafter, the template is expected to
be an ideal sinusoidal signal with a unity power
factor. Then, the distorted source voltage is
measured and divided by peak amplitude of base
input voltage 𝑉𝑚 in Eq. (6) [6].
𝑉𝑚 = √2
3(𝑉𝑠𝑎
2 + 𝑉𝑠𝑏2 + 𝑉𝑠𝑐
2) (6)
The 3 phase lock loop (PLL) is used to produce
sinusoidal unit vector templates with phase lagging
through the use of sine function. The load voltage of
reference signal is determined by multiplying unit
vector templates by the peak value of base input
voltage amplitude 𝑉𝑚 . Then, the load reference
voltage (𝑉𝐿𝑎∗ , 𝑉𝐿𝑏
∗ , 𝑉𝐿𝑐∗ ) is compared with sensed load
voltage (𝑉𝐿𝑎, 𝑉𝐿𝑏 , 𝑉𝐿𝑐) with a pulse width
modulation (PWM) controller which is used to raise
the desired trigger signal in series active filter. Fig. 4
shows control of series active filter.

Received: January 2, 2020. Revised: February 13, 2020. 334
International Journal of Intelligent Engineering and Systems, Vol.13, No.2, 2020 DOI: 10.22266/ijies2020.0430.32
VSa
VSb
VSb
K
K
K Three
Phase
PLL
Function to
get Sin (wt)
terms only
Sin (wt)
Sin (wt - 2π)
Sin (wt + 2π)
V*La
V*Lb
V*Lc
VLa VLb VLc
Gating Signals
Sensed Load
Voltage
Sensed
Source
Voltage
PWM
Voltage
Controller
Vm = Peak fundamental
input voltage magnitude
Figure. 4 Series active filter control
2.4 Shunt active filter control
The shunt active filter has the main function to
mitigate PQ problems on the load side. The control
methodology of shunt active filter is that the
absorbed current from PCC bus is a balanced
positive sequence current including an unbalanced
sag voltage on PCC bus, an unbalanced, or a non-
linear load. In order to obtain satisfactory
compensation caused by interference due to NL,
many algorithms have been used in some literatures.
This research uses the method of instantaneous
reactive power theory or "p-q theory". The voltages
and currents modeled in Cartesian coordinates can
be transformed into Cartesian coordinates 𝛼𝛽 in Eqs.
(7) and (8) [6].
[𝑣𝛼
𝑣𝛽] = [
1 −1 2⁄ −1 2⁄
0 √3 2⁄ −√3 2⁄] [
𝑉𝑎
𝑉𝑏
𝑉𝑐
] (7)
[𝑖𝛼
𝑖𝛽] = [
1 −1 2⁄ −1 2⁄
0 √3 2⁄ −√3 2⁄] [
𝑖𝑎
𝑖𝑏
𝑖𝑐
] (8)
Eq. (9) shows calculation of real power (𝑝) and
imaginary power (𝑞). The real and imaginary power
are determined in instantaneously power and
expressed in matrix form. Eq. (10) shows
instantaneous section (mean and fluctuating) [17].
[𝑝𝑞] = [
𝑣𝛼 𝑣𝛽
−𝑣𝛽 𝑣𝛼] [
𝑖𝛼
𝑖𝛽] (9)
𝑝 = �̅� + �̃� ; 𝑞 = �̅� + �̃� (10)
Where �̅� = the average section of real power, �̃�
= the fluctuating section of real power, �̅� = the
average section of imaginary power, �̃� = the
fluctuating section of imaginary power. The total
imaginary power (𝑞) and fluctuating section of real
power are selected as power and current references
and are utilized through the use of Eq. (10) to
compensate harmonics and reactive power [18].
Eq. 7
Eq. 8
VSa
VSb
VSc
iα
iβ
vα
vβ
iLa
iLb
iLc
q
pLPF
-1
vαβ
Icα*
Hysterisis
Current
Controller
iSa*
iSb*
iSc*
Gating Signals
iSa iSb iSc
Sensed Source
Current
Fuzzy
Logic
Controller
Vdc
Vdc*
Sensed
Source
Voltage
Sensed
Load
Current -
+
lossp
vαβ
-qEq. 9 Eq. 11 Icβ
* Eq. 12
-p
Figure. 5 Shunt active filter control
[𝑖𝑐𝛼
∗
𝑖𝑐𝛽∗ ] =
1
𝑣𝛼2+𝑣𝛽
2 [𝑣𝛼 𝑣𝛽
𝑣𝛽 −𝑣𝛼] [
−�̃� + �̅�𝑙𝑜𝑠𝑠
−𝑞] (11)
The �̅�𝑙𝑜𝑠𝑠 signal is obtained from the voltage
regulator and is used as average real power. It can
also be expressed as instantaneous active power
associated with resistive losses and switching losses
from UPQC. The error is obtained by comparing the
actual DC-link capacitor voltage with the reference
value processed using a FLC, driven by a closed
voltage control to minimize steady state errors from
voltage through DC-link circuit to zero. The
compensation current (𝑖𝑐𝛼∗ , 𝑖𝑐𝛽
∗ ) is needed to meet
load power demand as shown in Eq. (11). The
current is expressed in coordinates α-β. The
compensation current is used to obtain source phase
current by using Eq. (12) for compensation. The
source phase current (𝑖𝑠𝑎 ∗ , 𝑖𝑠𝑎
∗ , 𝑖𝑠𝑎∗ ) is expressed in
the abc axis obtained from the compensation current
in 𝛼𝛽 coordinates and is presented in Eq. (12) [17].
Fig. 5 show shunt active filter control [18].
[
𝑖𝑠𝑎∗
𝑖𝑠𝑏∗
𝑖𝑠𝑐∗
] = √2
3[
1 0
−1 2⁄ √3 2⁄
−1/2 − √3 2⁄] [
𝑖𝑐𝛼∗
𝑖𝑐𝛽∗ ] (12)
The UPQC-PV-BES system must have a
minimum DC-link (𝑉𝑑𝑐) voltage in order to operate
properly. The general DC-link voltage value
depends on the instantaneous energy that can be
generated by UPQC which is defined in Eq. (13)
[19]:
𝑉𝑑𝑐 =2√2𝑉𝐿𝐿
√3𝑚 (13)
Where m is the modulation index and VLL is the
voltage of UPQC. Considering modulation index of
1 and the grid voltage between line-line ( (𝑉𝐿𝐿 =
380 𝑉), 𝑉𝑑𝑐 is obtained 620.54 V and chosen as 650
V. The input of shunt active filter shown in Fig. 6 is
DC voltage (𝑉𝑑𝑐) dan DC voltage reference (𝑉𝑑𝑐∗ )
while the output is 𝑃𝑙𝑜𝑠𝑠 by using the PI controller.
Furthermore, 𝑃𝑙𝑜𝑠𝑠 of the input variables produce
source current reference (𝑖𝑠𝑎 ∗ , 𝑖𝑠𝑎
∗ , 𝑖𝑠𝑎∗ ) . Then, the
Received: January 2, 2020. Revised: February 13, 2020. 335
International Journal of Intelligent Engineering and Systems, Vol.13, No.2, 2020 DOI: 10.22266/ijies2020.0430.32
reference of source current output is compared with
current source (𝑖𝑠𝑎 , 𝑖𝑠𝑏 , 𝑖𝑠𝑐) by hysteresis current
controller to generate a trigger signal in IGBT
circuit of shunt active filter. In this paper, FLC as a
DC voltage control algorithm on shunt active filter
is proposed and compared with PI controller. FLC is
able to reduce oscillations and to produce
calculations with rapid convergence during
interference. This method is also used to overcome
the weaknesses of PI controller in determining
proportional gain constants (𝐾𝑃) and integral gain
constants(𝐾𝐼), which remain using the trial and error
method.
2.5 Fuzzy logic controller
This research starts by determining �̅�𝑙𝑜𝑠𝑠 as an
input variable, to produce a reference source current
on the hysteresis current control and to generate a
trigger signal on the shunt active IGBT filter circuit
from UPQC with PI control (𝐾𝑃 = 0.2 and and
(𝐾𝐼 = 0.2). Using the same procedure, �̅�𝑙𝑜𝑠𝑠 is also
determined using FLC. This method has been
widely used in industrial processes today because it
has heuristic properties, is simpler and more
effective, and has multi-rule-based variables in both
linear and non-linear system. The FLC sections
comprise fuzzification, decision making (rulebase,
database, reason mechanism) and defuzzification in
Fig. 6. The fuzzy rules algorithm collects a number
of fuzzy control rules in a particular order. These
rules are used to control the system so that it meets
the desired performance requirements and they are
designed from a number of intelligent control
system knowledge. Fuzzy inference system (FIS) in
FLC uses Mamdani Method with a max-min
composition relationship. FIS consists of three parts
i.e. rulebase, database, and reason-mechanism [20].
The FLC method is applied by determining input
variables i.e. Vdc error (𝑉𝑑𝑐−𝑒𝑟𝑟𝑜𝑟), delta Vdc error
(∆𝑉𝑑𝑐−𝑒𝑟𝑟𝑜𝑟) , seven fuzzy linguistic pairs, fuzzy
operating system blocks, 𝑉𝑑𝑐−𝑒𝑟𝑟𝑜𝑟 and
∆𝑉𝑑𝑐−𝑒𝑟𝑟𝑜𝑟 during seven fuzzy linguistic sets, fuzzy
operating system blocks, 𝑉𝑑𝑐−𝑒𝑟𝑟𝑜𝑟 and ∆𝑉𝑑𝑐−𝑒𝑟𝑟𝑜𝑟
during fuzzification process, fuzzy rule base, as well
as crips value to determine �̅�𝑙𝑜𝑠𝑠 in defuzzification.
Database
Reason
Mechanism
Rulebase
Fuzzy Logic Controller
Fuzzification DefuzzificationVdc
Vdc*
errordcV − lossp
Input
VariableOutput
VariableerrordcV −
Figure. 6 Block diagram of FLC
The value of �̅�𝑙𝑜𝑠𝑠 is one of the input variables to
obtain the compensation current (𝑖𝑐𝛼∗ , 𝑖𝑐𝛽
∗ ) in Eq.
(16). During the fuzzification process, a number of
input variables are calculated and converted into
linguistic variables based on a subset called the
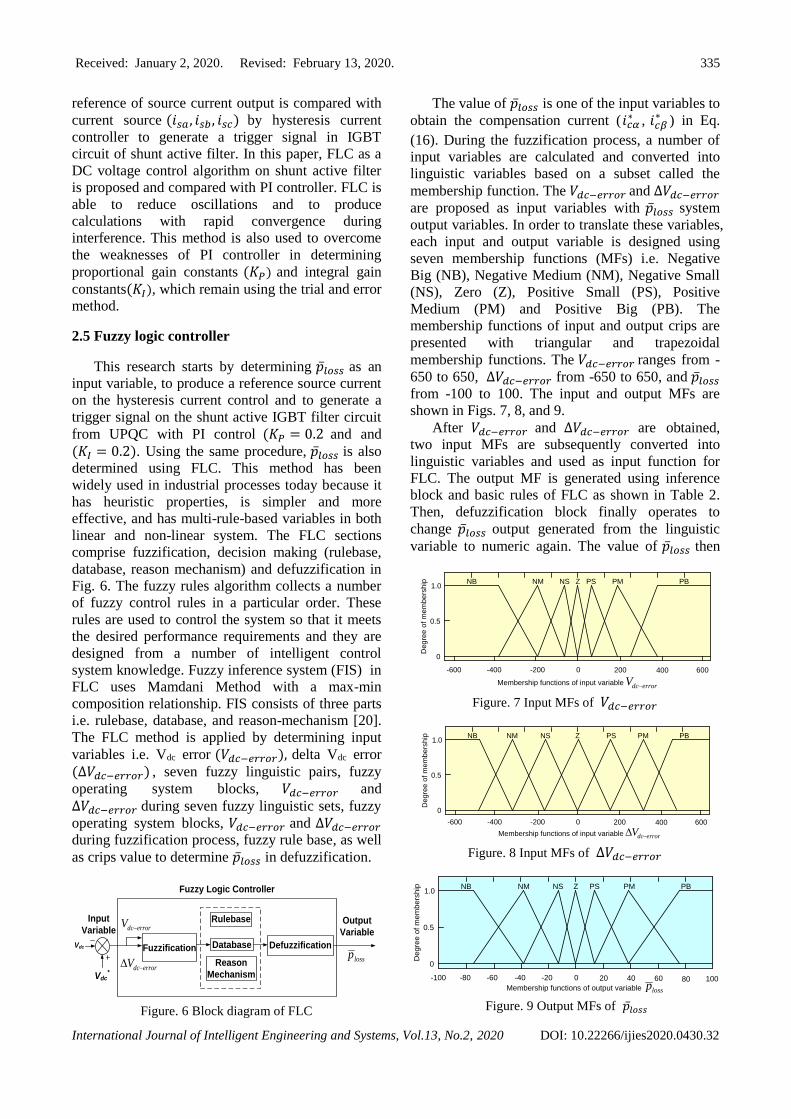
membership function. The 𝑉𝑑𝑐−𝑒𝑟𝑟𝑜𝑟 and ∆𝑉𝑑𝑐−𝑒𝑟𝑟𝑜𝑟
are proposed as input variables with �̅�𝑙𝑜𝑠𝑠 system
output variables. In order to translate these variables,
each input and output variable is designed using
seven membership functions (MFs) i.e. Negative
Big (NB), Negative Medium (NM), Negative Small
(NS), Zero (Z), Positive Small (PS), Positive
Medium (PM) and Positive Big (PB). The
membership functions of input and output crips are
presented with triangular and trapezoidal
membership functions. The 𝑉𝑑𝑐−𝑒𝑟𝑟𝑜𝑟 ranges from -
650 to 650, ∆𝑉𝑑𝑐−𝑒𝑟𝑟𝑜𝑟 from -650 to 650, and �̅�𝑙𝑜𝑠𝑠
from -100 to 100. The input and output MFs are
shown in Figs. 7, 8, and 9.
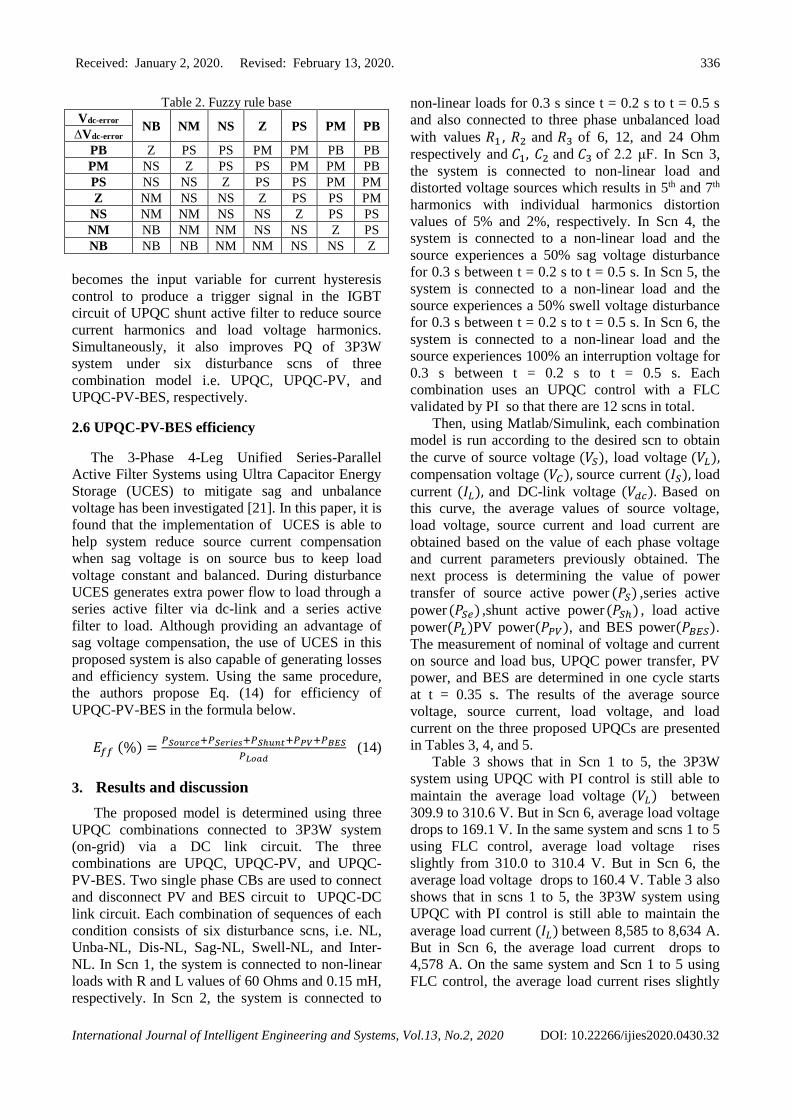
After 𝑉𝑑𝑐−𝑒𝑟𝑟𝑜𝑟 and ∆𝑉𝑑𝑐−𝑒𝑟𝑟𝑜𝑟 are obtained,
two input MFs are subsequently converted into
linguistic variables and used as input function for
FLC. The output MF is generated using inference
block and basic rules of FLC as shown in Table 2.
Then, defuzzification block finally operates to
change �̅�𝑙𝑜𝑠𝑠 output generated from the linguistic
variable to numeric again. The value of �̅�𝑙𝑜𝑠𝑠 then
-600 -400 -200 0 200 400 600
0
0.5
1.0NB NM NS Z PMPS PB
Membership functions of input variable
De
gre
e o
f m
em
be
rsh
ip
errordcV − Figure. 7 Input MFs of 𝑉𝑑𝑐−𝑒𝑟𝑟𝑜𝑟
0
0.5
1.0NB NM NS Z PMPS PB
Membership functions of input variable
De
gre
e o
f m
em
be
rsh
ip
-600 -400 -200 0 200 400 600
errordcV −
Figure. 8 Input MFs of ∆𝑉𝑑𝑐−𝑒𝑟𝑟𝑜𝑟
-100 -80 -60 -40 -20 0 20 40 60 80 100
0
0.5
1.0NB NM NS Z PMPS PB
Membership functions of output variable
De
gre
e o
f m
em
be
rsh
ip
lossp
Figure. 9 Output MFs of �̅�𝑙𝑜𝑠𝑠
Received: January 2, 2020. Revised: February 13, 2020. 336
International Journal of Intelligent Engineering and Systems, Vol.13, No.2, 2020 DOI: 10.22266/ijies2020.0430.32
Table 2. Fuzzy rule base
Vdc-error NB NM NS Z PS PM PB
∆Vdc-error
PB Z PS PS PM PM PB PB
PM NS Z PS PS PM PM PB
PS NS NS Z PS PS PM PM
Z NM NS NS Z PS PS PM
NS NM NM NS NS Z PS PS
NM NB NM NM NS NS Z PS
NB NB NB NM NM NS NS Z
becomes the input variable for current hysteresis
control to produce a trigger signal in the IGBT
circuit of UPQC shunt active filter to reduce source
current harmonics and load voltage harmonics.
Simultaneously, it also improves PQ of 3P3W
system under six disturbance scns of three
combination model i.e. UPQC, UPQC-PV, and
UPQC-PV-BES, respectively.
2.6 UPQC-PV-BES efficiency
The 3-Phase 4-Leg Unified Series-Parallel
Active Filter Systems using Ultra Capacitor Energy
Storage (UCES) to mitigate sag and unbalance
voltage has been investigated [21]. In this paper, it is
found that the implementation of UCES is able to
help system reduce source current compensation
when sag voltage is on source bus to keep load
voltage constant and balanced. During disturbance
UCES generates extra power flow to load through a
series active filter via dc-link and a series active
filter to load. Although providing an advantage of
sag voltage compensation, the use of UCES in this
proposed system is also capable of generating losses
and efficiency system. Using the same procedure,
the authors propose Eq. (14) for efficiency of
UPQC-PV-BES in the formula below.
𝐸𝑓𝑓 (%) =𝑃𝑆𝑜𝑢𝑟𝑐𝑒+𝑃𝑆𝑒𝑟𝑖𝑒𝑠+𝑃𝑆ℎ𝑢𝑛𝑡+𝑃𝑃𝑉+𝑃𝐵𝐸𝑆
𝑃𝐿𝑜𝑎𝑑 (14)
3. Results and discussion
The proposed model is determined using three
UPQC combinations connected to 3P3W system
(on-grid) via a DC link circuit. The three
combinations are UPQC, UPQC-PV, and UPQC-
PV-BES. Two single phase CBs are used to connect
and disconnect PV and BES circuit to UPQC-DC
link circuit. Each combination of sequences of each
condition consists of six disturbance scns, i.e. NL,
Unba-NL, Dis-NL, Sag-NL, Swell-NL, and Inter-
NL. In Scn 1, the system is connected to non-linear
loads with R and L values of 60 Ohms and 0.15 mH,
respectively. In Scn 2, the system is connected to
non-linear loads for 0.3 s since t = 0.2 s to t = 0.5 s
and also connected to three phase unbalanced load
with values 𝑅1 , 𝑅2 and 𝑅3 of 6, 12, and 24 Ohm
respectively and 𝐶1, 𝐶2 and 𝐶3 of 2.2 μF. In Scn 3,
the system is connected to non-linear load and
distorted voltage sources which results in 5th and 7th
harmonics with individual harmonics distortion
values of 5% and 2%, respectively. In Scn 4, the
system is connected to a non-linear load and the
source experiences a 50% sag voltage disturbance
for 0.3 s between t = 0.2 s to t = 0.5 s. In Scn 5, the
system is connected to a non-linear load and the
source experiences a 50% swell voltage disturbance
for 0.3 s between t = 0.2 s to t = 0.5 s. In Scn 6, the
system is connected to a non-linear load and the
source experiences 100% an interruption voltage for
0.3 s between t = 0.2 s to t = 0.5 s. Each
combination uses an UPQC control with a FLC
validated by PI so that there are 12 scns in total.
Then, using Matlab/Simulink, each combination
model is run according to the desired scn to obtain
the curve of source voltage (𝑉𝑆), load voltage (𝑉𝐿), compensation voltage (𝑉𝐶), source current (𝐼𝑆), load
current (𝐼𝐿), and DC-link voltage (𝑉𝑑𝑐). Based on
this curve, the average values of source voltage,
load voltage, source current and load current are
obtained based on the value of each phase voltage
and current parameters previously obtained. The
next process is determining the value of power
transfer of source active power (𝑃𝑆) ,series active
power(𝑃𝑆𝑒) ,shunt active power(𝑃𝑆ℎ) , load active
power(𝑃𝐿)PV power(𝑃𝑃𝑉), and BES power(𝑃𝐵𝐸𝑆).
The measurement of nominal of voltage and current
on source and load bus, UPQC power transfer, PV
power, and BES are determined in one cycle starts
at t = 0.35 s. The results of the average source
voltage, source current, load voltage, and load
current on the three proposed UPQCs are presented
in Tables 3, 4, and 5.
Table 3 shows that in Scn 1 to 5, the 3P3W
system using UPQC with PI control is still able to
maintain the average load voltage (𝑉𝐿) between
309.9 to 310.6 V. But in Scn 6, average load voltage
drops to 169.1 V. In the same system and scns 1 to 5
using FLC control, average load voltage rises
slightly from 310.0 to 310.4 V. But in Scn 6, the
average load voltage drops to 160.4 V. Table 3 also
shows that in scns 1 to 5, the 3P3W system using
UPQC with PI control is still able to maintain the
average load current (𝐼𝐿) between 8,585 to 8,634 A.
But in Scn 6, the average load current drops to
4,578 A. On the same system and Scn 1 to 5 using
FLC control, the average load current rises slightly
Received: January 2, 2020. Revised: February 13, 2020. 337
International Journal of Intelligent Engineering and Systems, Vol.13, No.2, 2020 DOI: 10.22266/ijies2020.0430.32
from 8,587 to 8,623 A. But in Scn 6, the average
load current drops slightly to 4,337 A.
Table 4 shows that in Scn 1 to 5, the 3P3W
system using UPQC-PV with PI control is still able
to keep the average load voltage (𝑉𝐿) between
310.0 to 310.5 V. However, in Scn 6, the average
load voltage drops to 240.4 V. In the system and
with Scn 1 through 5 using FLC control, the average
load voltage rises slightly from 310.1 to 310.5 V.
But in Scn 6, the average load voltage drops to
215.4 V. Table 4 also shows that in Scn 1 to 5, the
3P3W system using UPQC with PI control is still
able to maintain the average load current (𝐼𝐿) of
8,586 to 8,627 A. But in Scn 6, the average load
current drops to 6,477 A. In the same system and
Scn 1 to 5 using FLC control, the average load
current rises slightly from 8,578 to 8,635 A. But in
Scn 6, the average load current drops significantly to
5,921 A.
Table 5 shows that in Scn 1 to 5, the 3P3W
system using UPQC-PV-BES with PI control is still
able to maintain the average load voltage (𝑉𝐿)
between 307.2 to 308.2 V. However, in Scn 6, the
average load voltage drops to 286.7 V. In the same
system and Scn 1 to 6 using FLC control, the
average load voltage rises slightly from 304.1 to
314.1 V. Table 5 also shows that in Scn 1 to 6, the
3P3W system using UPQC with PI control is still
able to maintain the average load current (𝐼𝐿) of
8,031 to 8,746 A. In the same system and Scn 1 to 6
using FLC, the average load curren rises slightly
from 8,421 to 8,718 A.
Figure. 10 Performance of load voltage using
three UPQC combinations in six fault scns
Figure. 11 Performance of load current using three UPQC combinations in six fault scns
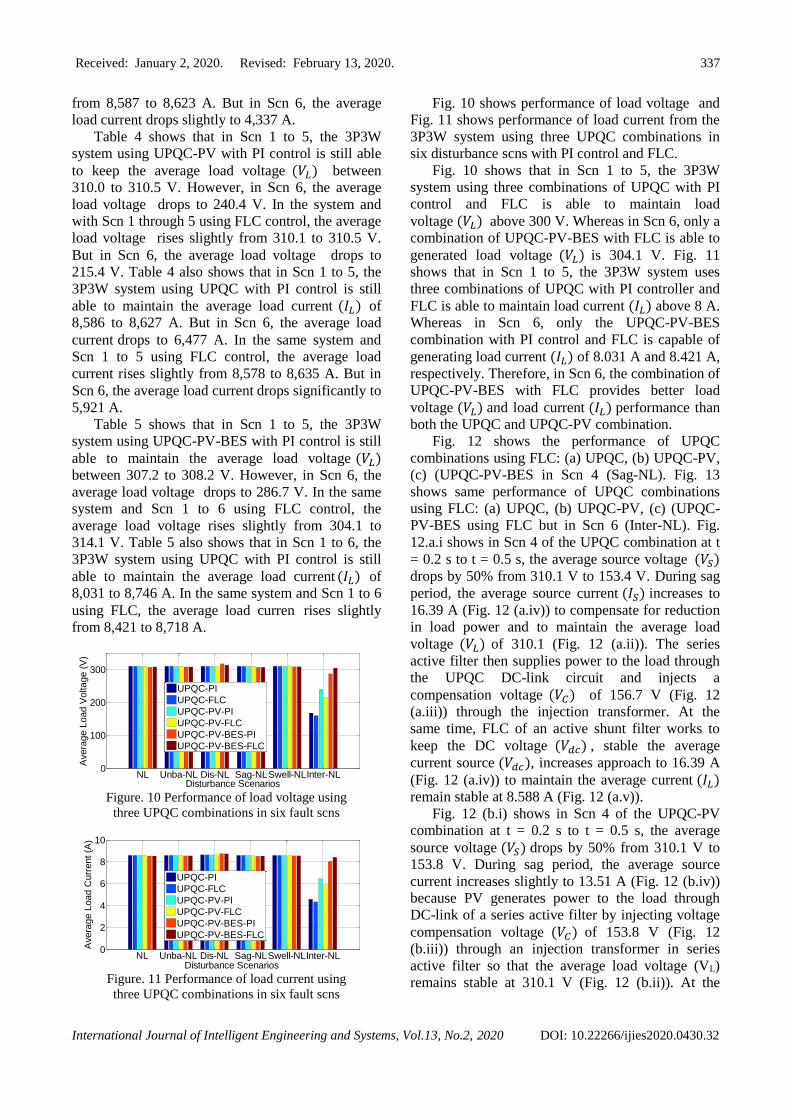
Fig. 10 shows performance of load voltage and
Fig. 11 shows performance of load current from the
3P3W system using three UPQC combinations in
six disturbance scns with PI control and FLC.
Fig. 10 shows that in Scn 1 to 5, the 3P3W
system using three combinations of UPQC with PI
control and FLC is able to maintain load
voltage (𝑉𝐿) above 300 V. Whereas in Scn 6, only a
combination of UPQC-PV-BES with FLC is able to
generated load voltage (𝑉𝐿) is 304.1 V. Fig. 11
shows that in Scn 1 to 5, the 3P3W system uses
three combinations of UPQC with PI controller and
FLC is able to maintain load current (𝐼𝐿) above 8 A.
Whereas in Scn 6, only the UPQC-PV-BES
combination with PI control and FLC is capable of
generating load current (𝐼𝐿) of 8.031 A and 8.421 A,
respectively. Therefore, in Scn 6, the combination of
UPQC-PV-BES with FLC provides better load
voltage (𝑉𝐿) and load current (𝐼𝐿) performance than
both the UPQC and UPQC-PV combination.
Fig. 12 shows the performance of UPQC
combinations using FLC: (a) UPQC, (b) UPQC-PV,
(c) (UPQC-PV-BES in Scn 4 (Sag-NL). Fig. 13
shows same performance of UPQC combinations
using FLC: (a) UPQC, (b) UPQC-PV, (c) (UPQC-
PV-BES using FLC but in Scn 6 (Inter-NL). Fig.
12.a.i shows in Scn 4 of the UPQC combination at t
= 0.2 s to t = 0.5 s, the average source voltage (𝑉𝑆)
drops by 50% from 310.1 V to 153.4 V. During sag
period, the average source current (𝐼𝑆) increases to
16.39 A (Fig. 12 (a.iv)) to compensate for reduction
in load power and to maintain the average load
voltage (𝑉𝐿) of 310.1 (Fig. 12 (a.ii)). The series
active filter then supplies power to the load through
the UPQC DC-link circuit and injects a
compensation voltage (𝑉𝐶) of 156.7 V (Fig. 12
(a.iii)) through the injection transformer. At the
same time, FLC of an active shunt filter works to
keep the DC voltage (𝑉𝑑𝑐) , stable the average
current source (𝑉𝑑𝑐), increases approach to 16.39 A
(Fig. 12 (a.iv)) to maintain the average current (𝐼𝐿)
remain stable at 8.588 A (Fig. 12 (a.v)).
Fig. 12 (b.i) shows in Scn 4 of the UPQC-PV
combination at t = 0.2 s to t = 0.5 s, the average
source voltage (𝑉𝑆) drops by 50% from 310.1 V to
153.8 V. During sag period, the average source
current increases slightly to 13.51 A (Fig. 12 (b.iv))
because PV generates power to the load through
DC-link of a series active filter by injecting voltage
compensation voltage (𝑉𝐶) of 153.8 V (Fig. 12
(b.iii)) through an injection transformer in series
active filter so that the average load voltage (VL)
remains stable at 310.1 V (Fig. 12 (b.ii)). At the
NL Unba-NL Dis-NL Sag-NLSwell-NLInter-NL0
100
200
300
Disturbance Scenarios
Avera
ge L
oad V
oltage (
V)
UPQC-PI
UPQC-FLC
UPQC-PV-PI
UPQC-PV-FLC
UPQC-PV-BES-PI
UPQC-PV-BES-FLC
NL Unba-NL Dis-NL Sag-NLSwell-NLInter-NL0
2
4
6
8
10
Disturbance Scenarios
Avera
ge L
oad C
urr
ent (A
)
UPQC-PI
UPQC-FLC
UPQC-PV-PI
UPQC-PV-FLC
UPQC-PV-BES-PI
UPQC-PV-BES-FLC

Received: January 2, 2020. Revised: February 13, 2020. 338
International Journal of Intelligent Engineering and Systems, Vol.13, No.2, 2020 DOI: 10.22266/ijies2020.0430.32
Table 3. Voltage and current of 3P3W system using UPQC
Scn
Source Voltage 𝑽𝑺
(Volt)
Load Voltage 𝑽𝑳
(Volt)
Source Current 𝑰𝑺
(Ampere)
Load Current 𝑰𝑳
(Ampere)
A B C Avg A B C Avg A B C Avg A B C Avg
PI Controller
1 309.
5
309
.5
309.
5
309.
5
310.
0
310.
0
310.
0
310.
0
8.74
1
8.72
8
8.75
1
8.74
0
8.58
5
8.58
6
8.58
6
8.58
6
2 309.
5
309
.5
309.
5
309.
5
310.
1
310.
0
310.
0
310.
0
8.73
3
8.75
0
8.74
9
8.74
4
8.58
8
8.58
6
8.58
5
8.58
6
3 309.
5
309
.5
309.
5
309.
5
309.
1
312.
6
310.
1
310.
6
8.85
5
8.77
2
8.80
1
8.80
9
8.53
9
8.76
9
8.59
5
8.63
4
4 153.
4
153
.4
153.
4
153.
4
310.
1
310.
1
310.
1
310.
1
16.4
2
16.3
9
16.4
2
16.4
1
8.58
8
8.58
8
8.58
8
8.58
8
5 464.
6
464
.6
464.
6
464.
6
309.
9
309.
9
309.
9
309.
9
8.38
0
8.38
8
8.38
0
8.38
3
8.58
5
8.58
5
8.58
4
8.58
5
6 1.01
7
0.9
82
1.01
4
1.00
4
173.
5
161.
2
169.
5
168.
1
9.47
9
9.35
3
9.02
7
9.28
6
4.86
6
4.46
5
4.40
4
4.57
8
Fuzzy Logic Controller
1 309.
5
309
.5
309.
5
309.
5
310.
0
310.
0
310.
0
310.
0
8.67
9
8.72
1
8.72
0
8.70
6
8.58
7
8.58
7
8.58
5
8.58
6
2 309.
5
309
.5
309.
5
309.
5
310.
0
310.
0
310.
0
310.
0
8.71
3
8.68
7
8.70
0
8.70
0
8.58
6
8.58
7
8.58
8
8.58
7
3 309.
5
309
.5
309.
5
309.
5
308.
9
311.
6
310.
5
310.
4
8.81
6
8.70
3
8.70
3
8.74
1
8.53
3
8.73
4
8.60
3
8.62
3
4 153.
4
153
.4
153.
4
153.
4
310.
1
310.
1
310.
1
310.
1
16.3
9
16.3
8
16.4
1
16.3
9
8.58
8
8.58
8
8.58
8
8.58
8
5 464.
6
464
.7
464.
7
464.
7
310.
0
310.
0
310.
0
310.
0
8.35
6
8.35
3
8.35
7
8.35
5
8.58
7
8.58
7
8.58
6
8.58
7
6 1.13
5
1.3
77
1.29
9
1.27
0
141.
4
172.
2
167.
4
160.
4
10.2
2
12.2
3
13.2
7
11.9
1
3.71
8
4.43
8
4.85
5
4.33
7
Table 4. Voltage and current of 3P3W system using UPQC-PV
Scn
Source Voltage 𝑽𝑺
(Volt)
Load Voltage 𝑽𝑳
(Volt)
Source Current 𝑰𝑺
(Ampere)
Load Current 𝑰𝑳
(Ampere)
A B C Avg A B C Avg A B C Avg A B C Avg
PI Controller
1 309.
5
309.
5
309.
5
309.
5
310.
0
310.
0
310
.0
310.
0
8.82
8
8.83
8
8.85
8
8.84
1
8.58
6
8.58
6
8.58
5
8.58
6
2 309.
5
309.
5
309.
5
309.
5
310.
0
310.
0
310
.0
310.
0
8.75
6
8.77
4
8.74
5
8.75
8
8.58
5
8.58
8
8.58
5
8.58
6
3 309.
5
309.
5
309.
5
309.
5
308.
5
312.
1
310
.5
310.
5
8.93
6
8.86
3
10.7
3
9.51
0
8.52
2
8.75
7
8.60
1
8.62
7
4 153.
8
153.
8
153.
8
153.
8
310.
1
310.
1
310
.1
310.
1
13.3
9
13.3
3
13.4
1
13.3
8
8.58
9
8.58
9
8.58
8
8.58
9
5 464.
4
464.
4
464.
4
464.
4
310.
1
310.
1
310
.1
310.
1
8.45
7
8.46
8
8.46
0
8.46
2
8.55
8
8.59
0
8.55
8
8.58
7
6 1.19
0
1.31
6
1.23
7
1.24
7
229.
2
249.
1
242
.8
240.
4
11.3
1
11.8
6
11.9
1
11.6
9
6.44
3
6.69
8
6.28
9
6.47
7
same time, FLC on an active shunt filter works to
keep DC voltage (𝑉𝑑𝑐) , stable and the average
current source (𝐼𝑆), increases close to 13.51 A (Fig.
12 (b.iv)) to maintain the average load current (𝐼𝐿)
remain stable at 8.578 A (Fig. 12 (b.v)).
Fig. 12 (c.i) also shows that the UPQC-PV-BES
combination in Scn 4 indicates almost the same
performance on an average 𝑉𝐶, 𝑉𝐿, and 𝐼𝐿 values as
presented in Fig. 12 (c.iii), (c.ii), and (c.v). The
difference is that the average 𝐼𝑆 slightly decreases to
8,561 A (Fig. 12 (c.iv)) because part of reduction in
load power has been compensated by power transfer
from PV-BES combination to the load through DC-
link of series active filter and from a shunt active
filter towards the load. The use of BES is able to
prove that in addition to being able to store excess
power from PV, this combination is also able to

Received: January 2, 2020. Revised: February 13, 2020. 339
International Journal of Intelligent Engineering and Systems, Vol.13, No.2, 2020 DOI: 10.22266/ijies2020.0430.32
Table 4. Voltage and current of 3P3W system using UPQC-PV (Continue)
Fuzzy Logic Controller
1 309.
5
309.
5
309.
5
309.
5
310.
1
310.
1
310
.0
310.
1
8.76
9
8.73
8
8.81
1
8.77
3
8.57
8
8.58
8
8.58
7
8.58
4
2 309.
5
309.
5
309.
5
309.
5
310.
0
310.
0
310
.0
310.
1
8.67
4
8.68
2
8.67
4
8.67
7
8.58
7
8.58
7
8.58
8
8.58
7
3 309.
4
309.
5
309.
5
309.
5
309.
6
312.
1
309
.9
310.
5
8.93
8
8.82
0
8.91
6
8.89
1
8.55
2
8.76
6
8.58
6
8.63
5
4 153.
8
153.
8
153.
8
153.
8
310.
1
310.
0
310
.1
310.
1
13.5
2
13.4
6
13.5
6
13.5
1
8.55
8
8.58
7
8.58
9
8.57
8
5 464.
4
464.
7
464.
7
464.
7
310.
1
310.
1
310
.1
310.
1
8.35
3
8.37
1
8.36
5
8.36
3
8.59
1
8.58
8
8.58
7
8.58
9
6 1.25
9
1.28
5
1.53
0
1.35
8
209.
9
193.
7
242
.7
215.
4
13.2
8
11.4
9
14.0
7
12.9
5
6.45
9
5.00
3
6.29
9
5.92
1
Table 5. Voltage and current of 3P3W system using UPQC-PV-BES
Scn
Source Voltage 𝑽𝑺
(Volt)
Load Voltage 𝑽𝑳
(Volt)
Source Current 𝑰𝑺
(Ampere)
Load Current 𝑰𝑳
(Ampere)
A B C Avg A B C Avg A B C Avg A B C Avg
PI Controller
1 309.
6
309.
6
309.
6
309.
6
307.
6
307.
8
307.
7
307.
7
7.76
6
7.79
3
7.75
9
7.77
3
8.52
8
8.52
9
8.53
3
8.53
0
2 309.
6
309.
6
309.
6
309.
6
307.
8
307.
9
307.
9
307.
9
7.78
7
7.80
1
7.77
9
7.78
9
8.53
1
8.53
3
8.53
7
8.53
4
3 309.
6
309.
6
309.
6
309.
6
313,
8
314.
3
317.
4
317.
4
7.89
7
7.91
9
7.86
7
7.89
5
8.74
8
8.70
4
8.78
5
8.74
6
4 154.
5
154.
5
154.
5
154.
5
307.
1
307.
3
307.
3
307.
2
7.23
5
7.27
6
7.22
6
7.24
6
8.50
9
8.51
4
8.51
0
8.51
1
5 464.
7
464.
7
464.
7
464.
7
308.
6
308.
7
308.
6
308.
6
7.97
9
7.98
0
7.96
4
7.97
5
8.55
0
8.55
3
8.55
4
8.55
3
6 0.53
59
1.38
5
0.85
01
0.92
38
310.
2
259.
8
290.
2
286.
7
7.39
2
12.6
7
6.04
5
8.70
3
8.70
7
7.74
7
7.63
7
8.03
1
Fuzzy Logic Controller
1 309.
5
309.
5
309.
5
309.
5
307.
7
307.
9
307.
7
307.
8
8.42
0
8.42
6
8.41
6
8.42
1
8.52
7
8.53
2
8.53
1
8.53
0
2 309.
5
309.
5
309.
5
309.
5
307.
9
308.
0
307.
9
307.
9
8.40
2
8.40
3
8.40
1
8.40
2
8.53
5
8.53
9
8.53
6
8.53
7
3 309.
6
309.
5
309.
5
309.
5
313.
4
312.
9
315.
9
314.
1
8.51
6
8.56
5
8.49
6
8.52
6
8.74
1
8.67
7
8.73
6
8.71
8
4 154.
4
154.
4
154.
4
154.
4
307.
3
307.
3
307.
2
307.
3
8.56
3
8.56
0
8.56
1
8.56
1
8.51
4
8.51
7
8.51
2
8.51
5
5 464.
6
464.
6
464.
6
464.
6
308.
6
308.
8
308.
6
308.
7
8.39
6
8.38
9
8.38
9
8.39
2
8.55
2
8.55
6
8.55
4
8.55
4
6 0.44
67
0.39
18
0.38
01
0.40
62
314.
0
293.
4
304.
9
304.
1
4.02
4
3.77
8
3.60
8
3.80
4
8.87
4
8.19
5
8.19
3
8.42
1
inject current into the load through the DC-link (Fig.
12 (c.vi)) to produce the average IL remaining stable
at 8.515 A (Fig. 12 (c.v)).
Fig. 13 shows the performance of UPQC
combinations using FLC in Scn 6 (Inter-NL). Fig.
13 (a.i) shows that in Scn 6 of UPQC at t = 0.2 s to t
= 0.5 sec, the average 𝑉𝑆 drops by 100% to 1,270 V.
Under this condition, the capacitor in UPQC DC-
link is unable to produce maximum power and inject
average VC (Fig. 13 (a.iii)) through an injection
transformer in series active filter. So at t = 0.2 s to t
= 0.5, the average 𝑉𝐿 in Fig. 13 (a.ii) decreases to
160.4 V. During interruption period, implementation
of the FLC to shunt active filter is unable to
maintain 𝑉𝑑𝑐 (Fig. 13 (a.vi)) and the average 𝑉𝐶
constantly, which causes the average 𝐼𝐿 to also
decrease to 4.337 A (Fig. 13 (a.v)).
Fig. 13 (b.i) shows that in Scn 6 of UPQC-PV
combination at t = 0.2 s to t = 0.5 s, the average 𝑉𝑆
drops by 100% to 1,358 V. Under this condition,
UPQC-PV is unable to generate maximum power to
UPQC DC link and inject and average 𝑉𝐶 in Fig. 13
(a.iii) through an injection transformer in series
active filter so at t = 0.2 s to t = 0.5 s, the average 𝑉𝐿

Received: January 2, 2020. Revised: February 13, 2020. 340
International Journal of Intelligent Engineering and Systems, Vol.13, No.2, 2020 DOI: 10.22266/ijies2020.0430.32
in Fig. 13 (b.ii) decreases to 215.4 V. During
interruption, application of FLC to shunt active filter
is unable to maintain 𝑉𝑑𝑐 (Fig.13 (b.vi)) and the
average 𝑉𝐶 to remain constant, so an average 𝐼𝐿 is
also decrease to 5,921 A (Fig. 13 (b.v)).
Fig. 13 (c.i) shows that the average 𝑉𝑆 also
drops 100% to 0.4062 V in the UPQC-PV-BES
combination at t = 0.2 s to t = 0.5 s. During
interruption period, the UPQC-PV-BES is able to
generate power to UPQC DC-link and to inject the
average 𝑉𝐶 (Fig.13 (c.iii)) through injection
transformer in series active filter so that the average
𝑉𝐿 remains stable at 304.1 V (Fig. 13 (c.ii)). Even
though the average 𝐼𝑆 drop to 3.804 A during
interruption period, the UPQC-PV-BES
combination is able to generate power, store excess
energy from PV, and allow current to load through
shunt active filter so that 𝐼𝐿 remains constant at
8,421 A (Fig. 13 (c.v)).
0 0.1 0.2 0.3 0.4 0.5 0.6 0.7-400
-200
0
200
400
Time (Second)
Sourc
e V
oltage (
Volt)
(a.i) Source Voltage UPQC Using FLC
Ph A
Ph B
Ph C
0 0.1 0.2 0.3 0.4 0.5 0.6 0.7-400
-200
0
200
400
Time (Second)Load V
oltage (
Volt)
(a.ii) Load Voltage UPQC Using FLC
Ph A
Ph B
Ph C
0 0.1 0.2 0.3 0.4 0.5 0.6 0.7-400
-200
0
200
400
Time (Second)
Sourc
e V
oltage (
Volt)
(b.i)Source Voltage UPQC-PV Using FLC
Ph A
Ph B
Ph C
0 0.1 0.2 0.3 0.4 0.5 0.6 0.7-400
-200
0
200
400
Time (Second)
Load V
oltage (
Volt)
(b.ii) Load Voltage UPQC-PV Using FLC
Ph A
Ph B
Ph C
0 0.1 0.2 0.3 0.4 0.5 0.6 0.7-400
-200
0
200
400
Time (Second)
Sourc
e V
oltage (
Volt)
(c.i)Source Voltage UPQC-PV-BES Using FLC
Ph A
Ph B
Ph C
0 0.1 0.2 0.3 0.4 0.5 0.6 0.7-400
-200
0
200
400(c.ii)Load Voltage UPQC-PV-BES Using FLC
Time (Second)
Load V
oltage (
Volt)
Ph A
Ph B
Ph C
0 0.1 0.2 0.3 0.4 0.5 0.6 0.7-400
-200
0
200
400
Time (Second)
Com
p V
oltage (
Volt)
(a.iii)Compensation Voltage UPQC Using FLC
Ph A
Ph B
Ph C
0 0.1 0.2 0.3 0.4 0.5 0.6 0.7-100
-50
0
50
100
Time (Second)
Sourc
e C
urr
ent (A
mpere
)
(a.iv)Source Current UPQC Using FLC
Ph A
Ph B
Ph C
0 0.1 0.2 0.3 0.4 0.5 0.6 0.7-400
-200
0
200
400
Time (Second)
Com
p V
oltage (
Volt)
(b.iii)Compensation Voltage UPQC-PV Using FLC
Ph A
Ph B
Ph C
0 0.1 0.2 0.3 0.4 0.5 0.6 0.7-100
-50
0
50
100
Time (Second)
Sourc
e C
urr
ent (A
mpere
)
(b.iv)Source Current Arus UPQC-PV Using FLC
Ph A
Ph B
Ph C

Received: January 2, 2020. Revised: February 13, 2020. 341
International Journal of Intelligent Engineering and Systems, Vol.13, No.2, 2020 DOI: 10.22266/ijies2020.0430.32
Figure. 12 Performance of UPQC combinations using FLC in Scn 4: (a) UPQC, (b) UPQC-PV, and (c) UPQC-PV-BES
0 0.1 0.2 0.3 0.4 0.5 0.6 0.7-400
-200
0
200
400
Time (Second)
Com
p V
oltage (
Volt)
(c.iii)Compensation Voltage UPQC-PV-BES Using FLC
Ph A
Ph B
Ph C
0 0.1 0.2 0.3 0.4 0.5 0.6 0.7-100
-50
0
50
100
Time (Second)
Sourc
e C
urr
ent (A
mpere
)
(c.iv)Source Current UPQC-PV-BES Using FLC
Ph A
Ph B
Ph C
0 0.1 0.2 0.3 0.4 0.5 0.6 0.7-100
-50
0
50
100
Time (Second)
Load C
urr
ent (A
mpere
)
(a.v)Load Current UPQC Using FLC
Ph A
Ph B
Ph C
0 0.1 0.2 0.3 0.4 0.5 0.6 0.70
200
400
600
800
Time (Second)
DC
-Lin
k V
oltage (
Volt)
(a.vi) DC-Link Voltage UPQC Using FLC
0 0.1 0.2 0.3 0.4 0.5 0.6 0.7-100
-50
0
50
100
Time (Second)
Load C
urr
ent (A
mpere
)
(b.v)Load Current UPQC-PV Using FLC
Ph A
Ph B
Ph C
0 0.1 0.2 0.3 0.4 0.5 0.6 0.70
200
400
600
800
Time (Second)
DC
Lin
k V
oltage (
Volt)
(b.vi)DC-Link Voltage UPQC-PV Using FLC
0 0.1 0.2 0.3 0.4 0.5 0.6 0.7-100
-50
0
50
100 (c.v)Load Current UPQC-PV-BES Using FLC
Time (Second)
Aru
s B
eban (
Am
pere
)
Ph A
Ph B
Ph C
0 0.1 0.2 0.3 0.4 0.5 0.6 0.70
500
1000
1500
2000
Time (Second)
DC
-Lin
k V
oltage (
Volt)
(c.vi)DC-Link Voltage UPQC-PV-BES Using FLC
0 0.1 0.2 0.3 0.4 0.5 0.6 0.7-400
-200
0
200
400
Time (Second)
Sourc
e V
oltage (
Volt)
(a.i)Source Voltage UPQC Using FLC
Ph A
Ph B
Ph C
0 0.1 0.2 0.3 0.4 0.5 0.6 0.7-400
-200
0
200
400
Time (Second)
Load V
oltage (
Volt)
(a.ii)Load Voltage UPQC Using FLC
Ph A
Ph B
Ph C
0 0.1 0.2 0.3 0.4 0.5 0.6 0.7-400
-200
0
200
400(b.i)Source Voltage UPQC-PV Using FLC
Time (Second)
Sourc
e V
oltage (
Volt)
Ph A
Ph B
Ph C
0 0.1 0.2 0.3 0.4 0.5 0.6 0.7-400
-200
0
200
400
Time (Second)
Load V
oltage (
Volt)
(b.ii)Load Voltage UPQC-PV Using FLC
Ph A
Ph B
Ph C

Received: January 2, 2020. Revised: February 13, 2020. 342
International Journal of Intelligent Engineering and Systems, Vol.13, No.2, 2020 DOI: 10.22266/ijies2020.0430.32
0 0.1 0.2 0.3 0.4 0.5 0.6 0.7-400
-200
0
200
400(c.i) Source Voltage UPQC-PV-BES Using FLC
Time (Second)
Sourc
e V
oltage (
Volt)
Ph A
Ph B
Ph C
0 0.1 0.2 0.3 0.4 0.5 0.6 0.7-400
-200
0
200
400
Time (Second)
Load V
oltage (
Volt)
(c.ii)Load Voltage UPQ-PV-BES Using FLC
Ph A
Ph B
Ph C
0 0.1 0.2 0.3 0.4 0.5 0.6 0.7-400
-200
0
200
400
Time (Second)
Com
p V
oltage (
Volt)
(a.iii)Compensation Voltage UPQC Using FLC
Ph A
Ph B
Ph C
0 0.1 0.2 0.3 0.4 0.5 0.6 0.7-100
-50
0
50
100
Time (Second)
Sourc
e C
urr
ent (A
mpere
) (a.iv)Source Current UPQC Using FLC
Ph A
Ph B
Ph C
0 0.1 0.2 0.3 0.4 0.5 0.6 0.7-400
-200
0
200
400
Time (Second)
Com
p V
oltage (
Volt)
(b.iii)Compensation Voltage UPQC-PV Using FLC
Ph A
Ph B
Ph C
0 0.1 0.2 0.3 0.4 0.5 0.6 0.7-100
-50
0
50
100
Time (Second)
Sourc
e C
urr
ent (A
mpere
)
(b.iv)Source Current UPQC-PV Using FLC
Ph A
Ph B
Ph C
0 0.1 0.2 0.3 0.4 0.5 0.6 0.7-400
-200
0
200
400
Time (Second)
Com
p V
oltage (
Volt)
(c.iii)Compensation Voltage UPQC-PV-BES Using FLC
Ph A
Ph B
Ph C
0 0.1 0.2 0.3 0.4 0.5 0.6 0.7-100
-50
0
50
100
Time (Second)
Sourc
e C
urr
ent (A
mpere
) (c.iv)Source Current UPQC-PV-BES Using FLC
Ph A
Ph B
Ph C
0 0.1 0.2 0.3 0.4 0.5 0.6 0.7-100
-50
0
50
100
Time (Second)
Load C
urr
ent (A
mpere
)
(a.v)Load Current UPQC Using FLC
Ph A
Ph B
Ph C
0 0.1 0.2 0.3 0.4 0.5 0.6 0.70
200
400
600
800
Time (Second)
DC
-Lin
k V
olt (
Volt)
(a.vi)DC-Link Voltage UPQC Using FLC
0 0.1 0.2 0.3 0.4 0.5 0.6 0.7-100
-50
0
50
100
Time (Second)
Load C
urr
ent (A
mpere
)
(b.v)Load Current UPQC-PV Using FLC
Ph A
Ph B
Ph C
0 0.1 0.2 0.3 0.4 0.5 0.6 0.70
200
400
600
800
Time (Second)
DC
Lin
k V
oltage (
Volt)
(b.vi)DC-Link Voltage UPQC-PV Using FLC

Received: January 2, 2020. Revised: February 13, 2020. 343
International Journal of Intelligent Engineering and Systems, Vol.13, No.2, 2020 DOI: 10.22266/ijies2020.0430.32
Figure. 13 Performance of UPQC combinations using FLC in Scn 6: (a) UPQC, (b) UPQC-PV, and (c) UPQC-PV-BES
0 0.1 0.2 0.3 0.4 0.5 0.6 0.7-100
-50
0
50
100
Time (Second)
Load C
urr
ent (A
mpere
)(c.v)Load Current UPQC-PV-BES Using FLC
Ph A
Ph B
Ph C
0 0.1 0.2 0.3 0.4 0.5 0.6 0.70
500
1000
1500
2000
Time (Second)
DC
Lin
k V
oltage (
Volt)
(c.vi)DC-Link Voltage UPQC-PV-BES Using FLC
0 0.1 0.2 0.3 0.4 0.5 0.6 0.7-2
-1
0
1
2x 10
4
Time (Second)
Sourc
e A
ctive P
ow
er
(W)
(a.i) Source Active Power UPQC using FLC
0 0.1 0.2 0.3 0.4 0.5 0.6 0.7-2
-1
0
1
2x 10
4
Time (Second)
Series A
ctive P
ow
er
(W)
(a.ii) Series Active Power UPQC using FLC
0 0.1 0.2 0.3 0.4 0.5 0.6 0.7-2
-1
0
1
2x 10
4
Time (Second)
Sourc
e A
ctive P
ow
er
(W)
(b.i) Source Active Power UPQC-PV using FLC
0 0.1 0.2 0.3 0.4 0.5 0.6 0.7-2
-1
0
1
2x 10
4
Time (Second)
Series A
ctive P
ow
er
(W)
(b.ii) Series Active Power UPQC-PV using FLC
0 0.1 0.2 0.3 0.4 0.5 0.6 0.7-2
-1
0
1
2x 10
4
Time (Second)
Sourc
e A
ctive P
ow
er
(W)
(c.i) Source Active Power UPQC-PV-BES using FLC
0 0.1 0.2 0.3 0.4 0.5 0.6 0.7-2
-1
0
1
2x 10
4
Time (Second)
Series A
ctive P
ow
er
(W)
(c.ii) Series Active Power UPQC-PV-BES using FLC
0 0.1 0.2 0.3 0.4 0.5 0.6 0.7-2
-1
0
1
2x 10
4
Time (Second)
Shunt A
ctive P
ow
er
(W)
(a.iii) Shunt Active Power UPQC using FLC
0 0.1 0.2 0.3 0.4 0.5 0.6 0.7-2
-1
0
1
2x 10
4
Time (Second)
Load A
ctive P
ow
er
(W)
(a.iv) Load Active Power UPQC using FLC
0 0.1 0.2 0.3 0.4 0.5 0.6 0.7-2
-1
0
1
2x 10
4
Time (Second)
Shunt A
ctive P
ow
er
(W)
(b.iii) Shunt Active Power UPQC-PV using FLC
0 0.1 0.2 0.3 0.4 0.5 0.6 0.7-2
-1
0
1
2x 10
4
Time (Second)
Load A
ctive P
ow
er
(W)
(b.iv) Load Active Power UPQC-PV using FLC

Received: January 2, 2020. Revised: February 13, 2020. 344
International Journal of Intelligent Engineering and Systems, Vol.13, No.2, 2020 DOI: 10.22266/ijies2020.0430.32
Figure. 14 Active power transfer performance on three UPQC combinations use FLC in Scn 4
0 0.1 0.2 0.3 0.4 0.5 0.6 0.7-2
-1
0
1
2x 10
4
Time (Second)
Shunt A
ctive P
ow
er
(W)
(c.iii) Shunt Active Power UPQC-PV-BES using FLC
0 0.1 0.2 0.3 0.4 0.5 0.6 0.7-2
-1
0
1
2x 10
4
Time (Second)
Load A
ctive P
ow
er
(W
)
(c.iv) Load Active Power UPQC-PV-BES using FLC
0 0.1 0.2 0.3 0.4 0.5 0.6 0.7-2
-1
0
1
2x 10
4
Time (Second)
DC
Pow
er
(W)
(d.v) PV Power UPQC-PV Using FLC
0 0.1 0.2 0.3 0.4 0.5 0.6 0.7-2
-1
0
1
2x 10
5
Time (Second)
DC
Pow
er
(W)
(d.v) PV Power UPQC-PV-BES Using FLC
0 0.1 0.2 0.3 0.4 0.5 0.6 0.7-2
-1
0
1
2x 10
4
Time (Second)
DC
Pow
er
(W)
(e.vi) BES Power UPQC-PV-BES Using FLC
0 0.1 0.2 0.3 0.4 0.5 0.6 0.7-2
-1
0
1
2x 10
4 (a.i) Source Active Power UPQC using FLC
Time (Second)
Sourc
e A
ctive P
ow
er
(W)
0 0.1 0.2 0.3 0.4 0.5 0.6 0.7-2
-1
0
1
2x 10
4
Time (Second)
Series A
ctive P
ow
er
(W)
(a.ii) Series Active Power UPQC using FLC
0 0.1 0.2 0.3 0.4 0.5 0.6 0.7-2
-1
0
1
2x 10
4
Time (Second)
Sourc
e A
ctive P
ow
er
(W)
(b.i)Source Active Power UPQC-PV using FLC
0 0.1 0.2 0.3 0.4 0.5 0.6 0.7-2
-1
0
1
2x 10
4
Time (Second)
Series A
ctive P
ow
er
(W)
(b.ii)Series Active Power UPQC-PV using FLC
0 0.1 0.2 0.3 0.4 0.5 0.6 0.7-2
-1
0
1
2x 10
4
Time (Second)
Sourc
e A
ctive P
ow
er
(W)
(c.i)Source active power UPQC-PV-BES using FLC
0 0.1 0.2 0.3 0.4 0.5 0.6 0.7-2
-1
0
1
2x 10
4
Time (Second)
Series A
ctive P
ow
er
(W)
(c.ii)Series Active Power UPQC-PV-BES using FLC

Received: January 2, 2020. Revised: February 13, 2020. 345
International Journal of Intelligent Engineering and Systems, Vol.13, No.2, 2020 DOI: 10.22266/ijies2020.0430.32
Figure. 15 Active power transfer performance on three UPQC combinations use FLC in Scn 6
Figs.14 and 15 show active power transfer
performance in three UPQC combinations use FLC
in Scn 4 (Sag-NL) and Scn 6 (Inter-NL). Tables 6, 7,
and 8 show active power transfer in the combination
of circuit: (a) UPQC, (b) UPQC-PV, and (c) UPQC-
PV-BES using PI and FLC in six disturbances.
Table 9 shows DC power UPQC-PV and UPQC-
PV-BES.
Fig. 14 (a.i) shows that in Scn 4 of UPQC at t =
0.2 s to t = 0.5 s using FLC, the source active power
(𝑃𝑆) drops to 3700 W. The series active power (𝑃𝑆𝑒)
(Fig. 14 (a.ii)) increases by 3850 W and the shunt
active power (𝑃𝑆ℎ) decreases by -3730 W (Fig. 14
(a.iii)), so that the load active power (𝑃𝐿) (Fig. 15
(a.iv)) becomes 3714 W.
Fig. 14 (b.i) shows that in Scn 4 of UPQC-PV
combination at t = 0.2 s to t = 0.5 s using FLC, the
nominal of source active power (𝑃𝑆) drops to 2800
W. The series active power(𝑃𝑆𝑒) (Fig. 14 (b.ii))
increases by 2860 W and shunt active power (𝑃𝑆ℎ)
decreases by -1840 W (Fig. 15 (b.iii)), PV power
(𝑃𝑃𝑉) (Fig. 14 (d.v)) increases by 650 W, so that
0 0.1 0.2 0.3 0.4 0.5 0.6 0.7-2
-1
0
1
2x 10
4 (a.iii) Shunt Active Power UPQC using FLC
Time (Second)
Shunt A
ctive P
ow
er
(W)
0 0.1 0.2 0.3 0.4 0.5 0.6 0.7-2
-1
0
1
2x 10
4
Time (Second)
Load A
ctive P
ow
er
(W)
(a.iv) Load Active Power UPQC using FLC
0 0.1 0.2 0.3 0.4 0.5 0.6 0.7-2
-1
0
1
2x 10
4
Time (Second)
Shunt A
ctive P
ow
er
(W)
(b.iii)Shunt Active Power UPQC-PV using FLC
0 0.1 0.2 0.3 0.4 0.5 0.6 0.7-2
-1
0
1
2x 10
4(b.iv)Load Active Power UPQC-PV using FLC
Time (Second)
Load A
ctive P
ow
er
(W)
0 0.1 0.2 0.3 0.4 0.5 0.6 0.7-2
-1
0
1
2x 10
4
Time (Second)
Shunt A
ctive P
ow
er
(Watt) (c.iii)Shunt Active Power UPQC-PV-BES using FLC
0 0.1 0.2 0.3 0.4 0.5 0.6 0.7-2
-1
0
1
2x 10
4
Time (Second)
Load A
ctive P
ow
er
(Watt)
(c.iv)Load Active Power UPQC-PV-BES using FLC
0 0.1 0.2 0.3 0.4 0.5 0.6 0.7-2
-1
0
1
2x 10
4
Time (Second)
DC
Pow
er
(W)
(d.v) PV Power UPQC-PV using FLC
0 0.1 0.2 0.3 0.4 0.5 0.6 0.7-2
-1
0
1
2x 10
5
Time (Second)
DC
Pow
er
(W)
(d.v) PV Power UPQC-PV-BES Using FLC
0 0.1 0.2 0.3 0.4 0.5 0.6 0.7-2
-1
0
1
2x 10
4 (vi.e) BES Power UPQC-PV-BES Using FLC
Time (Second)
DC
Pow
er
(W)

Received: January 2, 2020. Revised: February 13, 2020. 346
International Journal of Intelligent Engineering and Systems, Vol.13, No.2, 2020 DOI: 10.22266/ijies2020.0430.32
load active power (𝑃𝐿) (Fig. 14 (b.iv)) becomes of
3715 W.
Fig. 14 (c.i) shows that in Scn 4 of UPQC-PV-
BES at t = 0.2 s to t = 0.5 s using FLC, the value of
source active power (𝑃𝑆) drops to 2000 W. The
series active power (𝑃𝑆𝑒) (Fig. 14 (c.ii)) increases
by 2000 W and shunt power (𝑃𝑆ℎ) decreases by -
150 W (Fig. 14 (c.iii)), PV power (𝑃𝑃𝑉) (Fig. 14
(d.v)) by 0 W, and BES power (𝑃𝐵𝐸𝑆) (Fig. 14
(d.vi)) of 530 W, so that load active power (𝑃𝐿)
(Fig. 14 (c.iv)) equal to 3680 W.
Fig. 15 (a.i) shows that in Scn 6 of UPQC at t =
0.2 s to t = 0.5 s using FLC, the source active power
(𝑃𝑆) drops to 0 W. The series active power (𝑃𝑆𝑒)
(Fig. 15 (a.ii)) increases by 3800 W and shunt active
power (𝑃𝑆𝑒) decreases by -2300 W (Fig. 15 (a.iii)),
so that load active power (𝑃𝐿) (Fig. 15 (a.iv))
decreases to 1420 W. Fig. 15 (b.i) shows that in Scn 6 of UPQC-PV
combination at t = 0.2 s to t = 0.5 s using FLC, the
nominal of source active power (𝑃𝑆) drops to 0 W.
The series active power (𝑃𝑆𝑒) (Fig. 15 (b.ii))
increases by 6000 W and shunt active power (𝑃𝑆ℎ)
decreases by -3100 W (Fig. 15 (a.iii)), PV power
(𝑃𝑃𝑉) (Fig. 15 (d.v)) rises by 1300 W, so that load
active power (𝑃𝐿) (Fig.15 (b.iv)) decreases to 2600
W. Fig. 15 (c.i) shows that in Scn 6 of UPQC-PV-
BES at t = 0.2 s to t = 0.5 s using FLC, the value of
source active power (𝑃𝑆) drops to 0 W. The series
active power (𝑃𝑆𝑒) (Fig. 15 (c.ii)) decrease by -900
W and shunt active power (𝑃𝑆ℎ) increases by 4700
W (Fig. 15 (c.iii)), PV power (𝑃𝑃𝑉) (Fig. 15 (d.v))
of 0 W, and BES power (𝑃𝐵𝐸𝑆) (Fig. 15 (d.vi)) of
600 W, so that load active power (𝑃𝐿) (Fig. 15
(c.iv)) becomes 3700 W.
Table 6. Active power transfer on UPQC
Scn
Active Power Transfer (Watt)
Source
Power
Series
Power
Shunt
Power
Load
Power
PI Controller
1 4000 22 -260 3712
2 4000 20 -270 3712
3 4080 32 -280 3760
4 3675 3820 -3670 3714
5 5760 -1850 0 3712
6 0 2850 -1200 1400
Fuzzy Logic Controller
1 4000 22 -240 3714
2 4010 25 -260 3714
3 4020 20 -228 3750
4 3700 3850 -3730 3714
5 5735 -1850 0 3713
6 0 3800 -2300 1420
Table 7. Active power transfer on UPQC-PV
Scn
Active Power Transfer (Watt)
Source
Power
Series
Power
Shunt
Power
Load
Power
PI Controller
1 4000 20 -280 3715
2 4000 20 -290 3712
3 4000 25 -250 3750
4 2700 2800 -1800 3715
5 6000 -1700 0 3715
6 0 4900 -1900 2650
Fuzzy Logic Controller
1 4000 20 -230 3714
2 4000 20 -240 3714
3 4000 25 -250 3760
4 2800 2860 -1840 3715
5 6000 -1700 0 3715
6 0 6000 -3100 2600
Table 8. Active power transfer on UPQC-PV-BES
Scn
Active Power Transfer (Watt)
Source
Power
Series
Power
Shunt
Power
Load
Power
PI Controller
1 3600 15 150 3690
2 3600 15 135 3690
3 3700 80 120 3850
4 1700 1750 300 3680
5 5500 -1700 0 3600
6 0 -1100 5000 3720
Fuzzy Logic Controller
1 3830 15 -80 3690
2 3830 10 -85 3690
3 3900 100 -100 3850
4 2000 2000 -150 3680
5 5725 -1850 0 3700
6 0 -900 4700 3700
Table 9. DC power on UPQC-PV and UPQC-PV-BES
Scn
DC Power(Watt)
PV PV-BES
PV Power PV Power BES Power
PI Controller
1 120 0 400
2 110 0 400
3 125 0 390
4 650 0 410
5 -560 0 380
6 1300 0 490
Fuzzy Logic Controller
1 130 0 520
2 125 0 520
3 120 0 520
4 650 0 530
5 -550 0 500
6 1300 0 600

Received: January 2, 2020. Revised: February 13, 2020. 347
International Journal of Intelligent Engineering and Systems, Vol.13, No.2, 2020 DOI: 10.22266/ijies2020.0430.32
Table 10. Efficiency of UPQC combinations
Scn Efficiency (%)
UPQC UPQC-PV UPQC-PV-BES
PI Controller
1 98.67 96.25 88.59
2 98.98 96.67 88.92
3 98.12 96.16 89.74
4 97.09 85.40 88.46
5 94.94 99.34 86.12
6 84.85 61.63 84.74
Fuzzy Logic Controller
1 98.20 94.75 86.12
2 98.38 95.10 86.32
3 98.37 96.54 87.11
4 97.23 83.11 84.02
5 95.57 99.07 84.57
6 94.67 61.91 84.10
Figure. 16 Active power transfer performance on three
UPQC combinations in six scns
Figure. 17 Efficiency of UPQC combinations
Fig. 16 shows performance of load active power
transfer in a combination of circuits: (a) UPQC, (b)
UPQC-PV, and (c) UPQC-PV-BES using PI
controller and FLC in six disturbance scns. The
next step is to determine the efficiency of each
combination i.e. (a) UPQC, (b) UPQC-PV, (c)
UPQC-PV-BES using PI control and FLC. The
efficiency of each circuit combination is determined
using Eq. (14) and shown in Table 10 and Fig. 17.
Table 10 and Fig. 17 show that in Scn 1 to 6, the
combination of UPQC-PV and UPQC-PV-BES
respectively, results in lower efficiency compared to
using only UPQC. In Scn 4 and 6, the UPQC-PV-
BES combination produces higher efficiency
compared than the UPQC-PV combination. In Scn 4
using FLC, UPQC-PV-BES combination produces
efficiency of 84.02% compared to UPQC-PV
combination of 83.11%. In Scn 6 using FLC,
UPQC-PV-BES model produces efficiency of
84.10% compared to UPQC-PV of 61.91%.
4. Conclusions
The implementation of UPQC-PV-BES in 3P3W
system has been presented. In disturbance scns 1 to
5, the 3P3W system using three combinations of
UPQC with PI control and FLC is still able to
maintains load voltage and load current to be above
300 V and 8 A. Whereas in Scn 6, only the UPQC-
PV-BES combination with FLC is able to maintain
the load voltage and load current to be higher
compared than the two UPQC combinations of
304.1 V and 8.421 A respectively. In disturbance
scns 1 to 5, the 3P3W system using three
combinations of UPQC with PI controller and FLC
is capable of producing load active power above
3600 W. Whereas in Scn 6, only the combination of
UPQC-PV-BES with PI controller and FLC is able
to produce a load voltage of 3720 W and 3700 W,
respectively. In Scn 1 to 6, the combination of
UPQC-PV-BES results in lower efficiency
compared to using UPQC and UPQC-PV. In Scn 6,
however, the combination of UPQC-PV-BES with
FLC is able to produce higher load voltage, load
current, and load active power compared to UPQC-
PV and UPQC. Thus, the UPQC-PV-BES model
using FLC is able to compensate to the load voltage
and load current, and to enhance the load active
power in case an interruption voltage occurs on
source bus.
This research uses BES with 100% state of
charge (SoC) or fully charged. The use of BES with
varying SoC (0% to 99%) is proposed as future
work to find out load active power transfer
performance of UPQC-PV-BES system in unfully
charged BES condition.
Acknowledgments
The authors gratefully acknowledge the financial
support provided by The Directorate General of
Research and Development Strengthening,
Directorate of Research and Community Service
Ministry of Research, Technology, and Higher
Education, Republic of Indonesia, through
Fundamental Research accordance with the Decree
Letter Number: 7/E/KPT/2019 and Contract
Number: 229/SP2H/DRPM/2019 on 11 March 2019,
008/SP2H/LT/MULTI/L7/2019 on 26 March 2019,
and 170/LPPM/IV/2019/UB on 4 April 2019.
NL Unba-NL Dis-NL Sag-NLSwell-NLInter-NL0
1000
2000
3000
4000
Disturbance Scenarios
Load A
ctive P
ow
er
(W)
UPQC-PI
UPQC-FLC
UPQC-PV-PI
UPQC-PV-FLC
UPQC-PV-BES-PI
UPQC-PV-BES-FLC
NL Unba-NL Dis-NL Sag-NLSwell-NLInter-NL0
20
40
60
80
100
Disturbance Scenarios
UP
QC
Effic
iency (
%)
UPQC-PI
UPQC-FLC
UPQC-PV-PI
UPQC-PV-FLC
UPQC-PV-BES-PI
UPQC-PV-BES-FLC

Received: January 2, 2020. Revised: February 13, 2020. 348
International Journal of Intelligent Engineering and Systems, Vol.13, No.2, 2020 DOI: 10.22266/ijies2020.0430.32
Appendix
Three phase sources: RMS voltage 380 volt
(line-line), 50 Hz, line impedance: 𝑅𝑆 = 0.1 Ohm,
𝐿𝑆 = 15 mH; series and shunt active filter: series
inductance 𝐿𝑆𝑒 = 0.015 mH; shunt inductance 𝐿𝑆ℎ =
15 mH; injection transformers: rating 10 kVA, 50
Hz, turn ratio (N1/N2) = 1:1; non-linear load:
resistance 𝑅𝐿 = 60 ohm, inductance 𝐿𝐿 = 0.15 mH,
load impedance 𝑅𝐶 = 0.4 ohm and 𝐿𝐶 = 15 mH;
unbalance load: resistance 𝑅1 = 24 ohm, 𝑅2 = 12
ohm, and 𝑅3 = 6 ohm, capacitance 𝐶1, 𝐶2, 𝐶3= 2.2
μF; DC-link: voltage 𝑉𝑑𝑐 = 650 volt and capacitance
𝐶𝑑𝑐 = 3000 μF; BES: type = nickel metal hybrid, DC
voltage = 650 volt, rated capacity = 200 Ah, initial
state of charge = 100%, inductance 𝐿1 = 6 mH,
capacitance 𝐶1 = 200 μF; solar photovoltaic: active
power = 0.6 kW temperature = 250 C, radiation =
1000 W/m2; PI controller: 𝐾𝑃= 0.2, 𝐾𝐼 = 1.5; fuzzy
logic controller model: method = mamdani,
composition = max-min; input MF: Vdc error
(𝑉𝑑𝑐−𝑒𝑟𝑟𝑜𝑟) = trapmf, trimf, delta Vdc error
(∆𝑉𝑑𝑐−𝑒𝑟𝑟𝑜𝑟) = trapmf, trimf; output MF:
instantaneous power loss �̅�𝑙𝑜𝑠𝑠 = trapmf, trimf.
References
[1] B. Han, B. Hae, H. Kim, and S. Back,
“Combined Operation of Unified Power
Quality Conditioner With Distributed
Generation”, IEEE Transactions on Power
Delivery, Vol. 21, Issue. 1, pp. 330-338, 2006.
[2] V. Khadkikar, ”Enhanching Electric Power
Quality UPQC: A. Comprehensive Overview”,
IEEE Transactions on Power Electronics, Vol.
27, No. 5, pp. 2284-2297, 2012.
[3] S. Devassy and B. Singh, “Design and
Performance Analysis of Three-Phase Solar PV
Integrated UPQC”, IEEE Transactions on
Industry Applications, Vol. 54, Issue. 1, pp.73-
81, 2016.
[4] S. K. Dash and P. K. Ray, “Power Quality
Improvement Utilizing PV UPQC Based on
UV-PI and PR-R Controller”, In: Proc. of
CPSS Trans. on Power Electronics and Apps,
India, Vol. 3, Issue. 3, pp. 243-253, 2018.
[5] S. K. Dash and P. K. Ray, “Investigation on
The Performance of PV-UPQC Under
Distorted Current and Voltage Conditions”, In:
Proc. of the 5th International Conference on
Renewable Energy: Generation and
Applications, pp. 305-309, 2018.
[6] Y. Bouzelata, E. Kurt, R. Chenni, and N. Altin,
“Design and Simulation of Unified Power
Quality Conditioner Fed by Solar Energy”,
International Journal of Hydrogen Energy, Vol.
40, pp. 15267-15277, 2015.
[7] S. C. Ghosh and S. B. Karanki, “PV Supported
Unified Power Quality Conditioner Using
Space Vector Pulse Width Modulation”, In:
Proc. of National Power Electronics
Conference College of Engineering, Pune,
India, pp. 264-269, 2017.
[8] R. Senapati, R. N. Senapati, P. Behera, and M.
K. Moharana, “Performance Analysis of
Unified Power Quality Conditioner in a Grid
connected PV System”, In: Proc. of
International conference on Signal Processing,
Communication, Power and Embedded System,
pp. 416-420, 2017.
[9] J. Jayachandran and R.M. Sachithanandam,
“Performance Investigation of Unified Power
Quality Conditioner Using Artificial Intelligent
Controller”, International Review on Modelling
Simulations, Vol. 8, No. 1, pp. 48-56, 2015.
[10] K.R. Rao and K.S. Srikanth, “Improvement of
Power Quality using Fuzzy Logic Controller in
Grid Connected Photovoltaic Cell Using
UPQC”, International Journal of Power
Electronics and Drive System, Vol. 5, No. 1, pp.
101-111, 2014.
[11] K.S. Srikanth, K. Mohan, and T.P.
Vishnuvardhan, ”Improvement of Power
Quality for Microgrid Using Fuzzy Based
UPQC Controller”, In: Proc. of International
Conference on Electrical, Electronics, Signals,
Communication and Optimization, pp. 1-6,
2015.
[12] A. Amirullah, O. Penangsang, and A.
Soeprijanto, “High Performance of Unified
Power Quality Conditioner and Battery Energy
Storage Supplied by Photovoltaic Using
Artificial Intelligent Controller”, International
Review on Modelling and Simulations, Vol. 11,
No. 4, pp. 221-234, 2018.
[13] V.P. Pires, D. Foito, A. Cordiero, and J.F.
Martins, “PV Generators Combined With
UPQC Based on a Dual Converter Structure”,
In: Proc. of IEEE 26th International
Symposium on Industrial Electronics, pp.1781-
1786, 2017.
[14] L.B.G. Campanhol, S.A.O. da Silva, and A.A.O.
Junior, “A Three-Phase Four-Wire Grid-
Connected Photovoltaic System Using a Dual
Unified Power Quality Conditioner”, In: Proc.
of IEEE 13th Brazilian Power Electronics
Conference and 1st Southern Power
Electronics Conference, 2015.
[15] S. Paramanik, K. Sarker, D. Chatterjee, and S.K
Goswami, “Smart Grid Power Quality

Received: January 2, 2020. Revised: February 13, 2020. 349
International Journal of Intelligent Engineering and Systems, Vol.13, No.2, 2020 DOI: 10.22266/ijies2020.0430.32
Improvement Using Modified UPQC”, In:
Proc. of Devices for Integrated Circuit, pp.356-
360, 2019.
[16] A.R. Reisi, M.H. Moradi, and H. Showkati,
“Combined Photovoltaic and Unified Power
Quality Controller to Improve Power Quality”,
Solar Energy, Vol. 88, pp.154-162, 2013.
[17] S. Y. Kamble and M. M. Waware,
“Unified Power Quality Conditioner for Power
Quality Improvement”, In: Proc. of International Multi Conference on Automation,
Computing, Communication, Control and
Compressed Sensing, pp. 432-437, 2013.
[18] M. Hembram and A. K. Tudu, “Mitigation
of Power Quality Problems Using Unified
Power Quality Conditioner (UPQC)”, In: Proc.
of International Conference on Computer,
Communication, Control and Information
Technology, pp.1-5, 2015.
[19] Y. Pal, A. Swarup, and B. Singh, “A
Comparative Analysis of Different Magnetic
Support Three Phase Four Wire Unified Power
Quality Conditioners-A Simulation Study”,
Electrical Power and Energy System, Vol. 47,
pp. 437-447, 2013.
[20] A. Amirullah and A. Kiswantono, “Power
Quality Enhancement of Integration
Photovoltaic Generator to Grid under Variable
Solar Radiation Level using MPPT-Fuzzy”,
International Journal of Electrical and
Computer Engineering, Vol. 6, No. 6, pp.2629-
2642, 2016.
[21] M. Ucar and S. Ozdemir, “3-Phase 4-Leg
Unified Series–Parallel Active Filter System
with Ultracapacitor Energy Storage for
Unbalanced Voltage Sag Mitigation”,
Electrical Power and Energy Systems, Vol. 49,
pp. 149-159, 2013.