low-carbon city 2025 sustainable iskandar...
TRANSCRIPT

SUSTAINABLE ISKANDAR MALAYSIA
Universiti Teknologi Malaysia Kyoto University Okayama University Ritsumeikan University
SPONSORED BY VICE CHANCELLOR COUNCIL & JAPAN SOCIETY FOR THE PROMOTION OF SCIENCE THE PLANNING OF URBAN ENERGY AND ENVIRONMENTAL SYSTEMS (GROUP VII )
LOW-CARBON CITY 2025

2
Preface This project is one of the research outcomes of Group 7 of Vice Chancellor
Council‐ Japan Society Promotion Science (VCC‐JSPS) The main universi‐
ties involved in this collaboration work are Universiti Teknologi Malaysia
and Kyoto University, Japan. Other partners involved in related research
work from the same group are Toyohashi University of Technology and
Ritsumeikan University, Okayama University.
We take this opportunity to thank the Johor State government, Iskandar
Malaysia Development Authority and relevant local authorities for their
support in providing relevant data and information for the modeling of
the project.
In line with Malaysian government effort in supporting UNEP program
to integrate climate change responses into the development processes, this
research findings hope to contribute by modeling and facilitating a transi‐
tion of ISKANDAR MALAYSIA, one of the fastest growing regions in Ma‐
laysia towards low carbon society.

3 3
Table of contents Executive Summary 4
About Iskandar Malaysia 6
Iskandar Malaysia Necessity of development as Low‐Carbon Region for IM
Background 8
What is a “Low‐Carbon Society” Principles for a Low‐Carbon Society Objective of this study
Socio‐economic scenario in 2025 10
Assumptions of the future society Scenario quantification
GHG emissions in 2025 12
Energy demand and GHG emissions on IM Mitigation potential of IM in 2025
Environmental & Energy Policies in Malaysia (1) 15
Mitigation Options 16
(1) Buildings (residential & commercial sector) (2) Transport (passenger & freight) (3) Industry & Power sector
Environmental & Energy Policies in Malaysia (2) 21
Policy package for Low‐Carbon Region 22
A policy package towards low‐carbon Iskandar Malaysia Needs for further research
Methodology 24
A procedure to create a local LCS scenarios Quantitative estimation tool “Extended Snapshot Tool” Collection and Estimation of Information

4
Executive Summary
Figure 1. GHG emissions and mitigations by means. “efficiency improvement” means improvement of energy efficiency of energy using equipments or buildings.
This report aims to show the possibility of de‐
veloping Iskandar Malaysia (IM) into Low‐
Carbon Region. he methodology involves (i) de‐
velop the current inventory of GHG emissions
of IM, and (ii) quantify socio‐economic activity
level in 2025 according to IM Comprehensive De‐
velopment Plan 2025.
According to the proposed development, the
amount of GHG emissions increase is estimated
based on (1) 2025 BaU (Business as Usual—
without mitigation measures) and (2) 2025 CM
(With Counter Mitigation measures) assumptions
of employed technologies as well as the potential
to reduce the GHG emissions by low‐carbon
measures available by 2025. The Main find‐
ings are as follows.
1. Current annual greenhouse gas (GHG) emis‐
sions of IM are approximately 12.6 million t‐
CO2.
2. Under the scenario of Without mitigation
measures, the GHG emissions will increase to
45.5 million t‐CO2, or 3.6 times higher than
2005.
3. By adopting the mitigation options available
by 2025, the emissions can be decreased ap‐
proximately 60% and suppressed to 19.6 mil‐
lion t‐CO2.
The current per capita emission for IM area is
9.3 t‐CO2 (2005). This current per capita emission
in IM is greater than national average of Malaysia
(5.0 t). In 2025 it will increase to 15.1 t‐CO2/year
and 6.5 t‐CO2/year without and with countermea‐
sures, respectively.
In order to mitigate the emission to lower
level, several measures such as diffusion of low‐
carbon technologies, energy efficient buildings
and increased use of public transport and renew‐
able energy should be introduced.
12552
3840
19598
45484 4592
10831
750
4465
623786
0
5,000
10,000
15,000
20,000
25,000
30,000
35,000
40,000
45,000
50,000
2005 2025 BaU 2025 CM
GHG emission
s/redu
ctions (k
t‐CO
2)
Logistics improvement
Transport demand management
Fuel shifting
Efficiency improvement (buildings)
Efficiency improvement (transport)
Efficiency improvement (industry)
Efficiency improvement (power sector)
GHG emissions
Emission
s reductio
ns

5 5
Figure 2. Policy package for Low‐Carbon Region
2005 2025 2025/2005
Population 1,353,202 3,005,815 2.2
No. of households 317,762 751,454 2.4
GDP (mil RM) 37,641 176,224 4.7
GDP per capita (RM/capita) 27,817 58,628 2.1
Gross output (mil RM) 121,431 474,129 3.9
Floor space for commercial (mil m2) 6.8 19.3 2.8
Passenger transport demand (mil p‐km) 3,816 8,677 2.3
Freight transport demand (mil t‐km) 1,652 5,204 3.1
Table 1. Estimated socio‐economic indicators in 2025 in IM.
Buildings (residential and commercial sector)
Transport and Land Use Industry Subsidy in investment
to energy efficient equipments
Promotion of technology transfer
Low interest loans to investment to energy efficient equipments
Environmental performance standard and evaluation of
buildings
Adjustment of tax rate of fixed asset tax
Low interest loans in investment to energy efficient buildings
Environmental performance standard of equipments
Environmental labeling
Education and information ser‐
vice
Green purchasing policy
Subsidy to introduce photo‐voltaic power generation system
Urban planning
Transport planning
Tax rate adjustment to fixed asset
Investment in public transport
Environmental performance standard of vehicles
Tax rate adjustment to energy
efficient vehicles
Promotion of bio fuel
A comprehensive policy to lead the imple‐
mentation of the measures is also required. Fig‐
ure 2 shows recommended policies and related
mitigation options.
If those policies are planned from the early
stage, IM will be able to develop not only as a
premier growth centre but also as a model for
Low‐Carbon Region.

6
About Iskandar Malaysia
In order to plan for a low‐carbon society (LCS)
in Malaysia, it is more effective to look into the
urban areas as they are engines of economic
growth as well as main contributors to CO2 emis‐
sion. In the case of Malaysia, the natural resource
management through spatial planning approach
integrates environmentally sustainable develop‐
ment concepts. These strategies are incorporated
into the National Physical Plan and then trans‐
lated into structure plans. These plans also iden‐
tify and manage environmentally sensitive areas
(ESAs) including forest and green lung reserves.
Major urban conurbations are identified and
three economic growth areas are demarcated in
Peninsular Malaysia as regions or sub‐regions
where it will develop to be globally competitive.
The South Johor Economic Region (SJER), which
commonly known as the Iskandar Malaysia (IM),
is one of these economic growth centers to be de‐
veloped as an integrated global node that encom‐
passes Singapore and Indonesia (cf. Figure 1)
The Iskandar Malaysia covers an area of about
2,216.3 km2, about 3 times the size of Singapore
and two times the size of Seoul Metropolitan
Area. IM covers the entire district of Johor Bahru,
and several sub‐districts (mukim) of Pontian (cf.
Figure 2). The Planning Area falls under the juris‐
diction of five local planning authorities, namely
Johor Bahru City Council, Johor Bahru Tengah
Municipal Council, Pasir Gudang Local Author‐
ity, Kulai Municipal Council and Pontian District
Council.
As shown in Figure 3, there are a total of five
flagship zones proposed as key focal points for
developments:
a) Flagship Zone A: Johor Bahru City Centre
(new financial district, central business dis‐
trict, Danga Bay integrated waterfront city,
Tebrau Plentong mixed development, cause‐
way)
b) Flagship Zone B: Nusajaya (Johor state admin‐
istrative centre, medical hub, educity, interna‐
tional destination resort and southern indus‐
trial logistic cluster )
c) Flagship Zone C: Western Gate Development
(Port of Tanjung Pelepas (PTP), 2nd Link
(Malaysia/Singapore), Free Trade Zone,
RAMSAR World Heritage Park and Tanjung
Piai)
d) Flagship Zone D: Eastern Gate Development
(Pasir Gudang Port and industrial zone, Tan‐
jung Langsat Port and Technology Park and
Kim‐Kim regional distribution centre)
e) Flagship Zone E: Senai‐Skudai (Senai Interna‐
tional Airport and Senai cargo hub)
Each of these flagships has a major urban cen‐
tre. Among these urban centers are Johor Bahru
City (financial district), proposed Nusajaya urban
centre (new State administrative centre), Pasir
Gudang/Tg. Langsat (port and industrial town‐
ship) and Senai‐Skudai/Kulai (transport and
cargo hub). Four of the focal points will be lo‐
cated in the Nusajaya‐Johor Bahru‐Pasir Gudang
Figure 1: Iskandar Malaysia and the surround‐ing region – Singapore and Riau of Indonesia
Iskandar Malaysia

7 7
Since Malaysia gained independence in 1957,
concerted efforts have been taken by the govern‐
ment to improve the quality of life of the people .
Mainly through commercial agricultural pro‐
grams in 1960 and 1970s; industrial development
programs in the 1980 and 1990s and value added
and ICT industrial development programs in the
2000s. Rapid urbanization and industrialization
in the last few decades have contributed to the
affluence lifestyle change in Malaysia. The rapid
development tempo has contributed to marked
increase in the demand for urban land use; sea,
land and air transportation demand and other
urban infrastructure and utility development to
meet the demand for better quality of life of ur‐
ban residents. These changes have direct impact
on climate change in the form of environmental
hazards and disasters which are evident in recent
years with more frequent occurrences of flood‐
ing, landslides and forest fire in Malaysia.
The State of Johor is undergoing a rapid in‐
dustrialization process and has huge investments
in manufacturing and infrastructure develop‐
ment and hence has high demand for energy con‐
sumption. The rapid economic growth places a
heavy demand and stress on resources means
that a continued dependence on energy, in par‐
ticular on fossil fuel is important to propel fur‐
ther growth. Although the Johor State has been
blessed with relatively large tracts of natural
tropical forests, (almost 60% of its total land
area), some of the forest areas may be converted
into agriculture and other urban use to generate
job opportunities for the growing population.
The pressure for more forested land and peat
land to beonverted into plantations is becoming
more serious with escalating crude palm oil
(CPO) prices and the hype over bio fuel, oil palm
ventures. The fact remains that peat and forest
are vital carbon sinks and that disturbed peat or
forest will be a significant source of carbon emis‐
sions.
Figure 2: Local planning authorities in IM
Figure 3: Flagship zones and compact cities development in IM
Necessity of development as Low‐Carbon Region for IM

8
Background
In simple terms, a low‐carbon society is a soci‐
ety that consumes sustainable and relatively low‐
carbon energy as compared with our present day
practice to avoid adverse climate change. Hence
conscious efforts need to be taken by community,
industry, institution and government to change
their behavior towards energy consumption and
supply. The Society will adopt a lifestyle that
make more use of alternative renewable energy,
less dependence on fossil fuel and practice 3Rs
(reduce, reuse and recycle) in their everyday life.
The working definition for policy research
and action of a low‐carbon society (National
Institute for Environmental Studies, 2006) should
have the following attributes:
i. Take actions that are compatible with the
principles of sustainable development, ensur‐
ing that the development needs of all groups
within society are met.
ii. Make an equitable contribution towards the
global effort to stabilize the atmospheric con‐
centration of CO2 and other greenhouse gases
at a level that will avoid dangerous climate
change, through deep cuts in global emis‐
sions.
iii. Demonstrate a high level of energy efficiency
and use low‐carbon energy sources and pro‐
duction technologies.
iv. Adopt patterns of consumption and behav‐
iour that are consistent with low levels of
greenhouse gas emissions.
In order for Malaysia, is fast developing na‐
tion to achieve LCS it would involve a holistic
balance socio‐ economic and ecological conserva‐
tion with the widely use of low‐carbon technolo‐
gies and changes to lifestyles and institutions.
What is a “Low Carbon Society” ?
Principles for a Low‐Carbon Society
Under the initiatives of the UK‐Japan Low‐
Carbon Society movement and the recent Bali
meeting in February 2008, the world needs to
cooperate to make concerted efforts to establish a
low‐carbon society by “reducing global emis‐
sions by half from the current level by 2050.”
Under the principle of common but differenti‐
ated responsibility, developed nations will take
the lead on climate change mitigation and devel‐
oping countries will adopt the necessary technol‐
ogy and expertise to reduce the often inefficient
and carbon intensive development path of the
pasts.
All countries, organizations, and entities have
to take action based on the following philoso‐
phies.
1) Carbon Minimization In All Sectors “A low‐carbon society” in the ultimate sense
would be a society that emits greenhouse gases
only in an amount which can be absorbed by na‐
ture (Carbon Neutral Society). To achieve this
goal, we have to have a social system where all
sectors, such as industries, governments, and citi‐
zens, will naturally or automatically give special

9 9
consideration to their selection and decisions in
order to minimize carbon‐dioxide emissions
(carbon minimization).
2) Toward a simpler life style that real‐
ize richer quality of life People would need to forgo the mass‐
consumption society, mainly formed by devel‐
oped countries, and build a new society in which
value is placed on family or community ties,
health, interactions with mother nature and the
“Mottainai” spirit to improve the quality of life.
This type of consumer choice would lead to a
revolution in the social system, moving toward a
low‐carbon and rich society.
3) Coexistence with Nature
We recognize human and its society as a part
of the global ecosystem. In order to secure the
CO2 absorption essential for a low‐carbon society
and to adapt to the avoidable global warming, it
is important to maintain and restore rich, diverse
natural environments, such as forests. To achieve
this symbiosis, local communities should place
importance on harmony and coexistence with
nature, and promote “nature‐friendly technolo‐
gies,” such as utilization of biomass.
The objectives of this study are,
a) To prepare a summary of a quantitative
scenario study on the establishment of a
sustainable low‐carbon society in Iskan‐
dar Malaysia
b) To create awareness among local
authorities, the State government, stake‐
holders and the community urgent and
decisive actions to be taken to realize a
robust growth and low‐carbon Malaysia.
Objectives of this study

10
Socio‐Economic Scenario in 2025
In the urban and energy demand modeling on GHG emissions of Iskandar Malaysia in the year
2025, several quantitative assumptions have to be made (Table 4).
Assumptions of the future society
Average no. of people per household 4.00 per household Labour participation ratio [Male] 5‐64: 90%, 65+: 30% [Female]15‐64: 60%, 65+: 20%
Demographic composition [Male] 0‐14: 12.0%, 15‐64: 33.9%, 65+: 4.5%
[Female] 0‐14: 11.6%, 15‐64: 33.0%, 65+: 5.4%
Exports Primary industry: approximately 1.0% p.a increase
Secondary industry: approximately 6.5% p.a increase
Tertiary industry: approximately 13.2% p.a increase
Labour productivity 113,808 RM per labour force from CDP
Private consumption 10% p.a increase
Government consumption 10% p.a increase
Fixed capital formation 155,172 mil RM per 5 years (2021‐2025) from CDP
Modal share [Railway]10%, [Bus]20%,
[Motorcar]40%, [Motorcycle]15%,
[Walk]10%, [Bicycle] 5%
Table 4. Quantitative assumption in 2025
Scenario quantification
The future socio‐economic indicators in 2025
based on the scenario description are estimated
by using a macroeconomic model. The following
are our estimated results about economy, estab‐
lishments, and transport.
Economy: Modelling results based on a mac‐
roeconomic model shows that Gross Domestic
Product (GDP) (real) of Iskandar Malaysia in
2025 is expected to be approximately RM 176 bil‐
lion (4.7 times of the performance in 2005). An
input‐output analysis based on final demands in
the macro economy is used to estimate the future
industrial structure in IM. The findings showed
the share of the primary industry will decrease
from 3% (2005) to 2% (2025). In addition, the
share of the secondary industry will decrease
from 51% (2005) to 33% (2025). On the other
hand, the share of the tertiary industry will in‐
crease from 46% (2005) to 65% (2025). Labour
participation ratio of productive‐age women will
increase from 46 % (2005) to 60 % (2025), and the
ratio of aged population will increase by 5 %
from 2005 to 2025.
Establishments: Number of households in IM
will increase from 318 thousand (2005) to 751
thousand (2025), and average household size IM
will decrease from 4.26 (2005) to 4.00 (2025). The
total floor space of commercial buildings in IM
will increase from 6.8 million square meters
(2005) to 19.3 million square meters (2025).

11 11
Transport: Passenger transport demand in IM
will increase from 3.8 billion passenger‐
kilometres (2005) to 7.8 billion passenger‐
kilometres (2025). On the other hand, freight
transport demand in IM will increase from 1.7
billion tonne‐kilometres (2005) to 5.3 billion
tonne‐kilometres (2025).
2005 2025 2025/2005
Population 1,353,200 3,005,815 2.2
No. of households 317,762 751,454 2.4
GDP (mil RM) 37,641 176,224 4.7
GDP per capita (RM/capita) 27,817 58,628 2.1
Gross output (mil RM) 121,431 474,129 3.9
Primary industry (mil RM) 1,860 5,375 2.9
Secondary industry (mil RM) 83,502 263,444 3.2 Tertiary industry (mil RM) 36,069 205,309 5.7
Floor space for commercial (mil m2) 6.8 19.3 2.8 Offices 1.3 1.7 2.9 Shops 5.7 16.3 2.9 Hospitals & Schools 0.6 1.2 2.1
Passenger transport demand (mil p‐km) 3,816 8,677 2.3 Freight transport demand (mil t‐km) 1,652 5,303 3.1
Table 5. Estimation result of scenario quantification in 2025, IM
75
59
250
89
59
11
12
7
13
6
77
5
2
0
50
100
150
200
250
300
350
400
450
500
2005 2025
Outpu
t (Bill. RM)
Agriculture
Manufacturing
Construction
Transport related
Wholesale and Retail
Tourism and Hospitality
Other Services
474
121
Figure 5. Output by industry

12
GHG Emissions in 2025 Energy demand and GHG emissions of IM
The macro‐economic model is used to esti‐
mate future energy demand and GHG emissions
for the year 2025 based on the scenario quantifi‐
cation. The estimated results about energy de‐
mand and GHG emissions are shown in Figure 6,
Figure 7 and Figure 8.
Energy demand in IM is projected to increase
from 3.3 million toe (toe: tonne oil equivalent) in
2005 to 10.9 million toe in 2025 for the BaU case
(BaU: business as usual). Energy demand of in‐
dustry is expected to be 6.6 million toe and will
maintain the largest share of 61%, followed by
transport (2.2 million toe; 20%), and residential
and commercial (2.1 million toe; 19%) in 2025.
Energy demand by energy sources (Figure 7)
showed that In 2025, there will be a total of 5.0
million toe (toe: tonne oil equivalent) of petro‐
leum consumed in the BaU scenario. In addition,
there will be also a marked increase in demand
for natural gas i.e. 3.9 million toe or 3.2 times the
Figure 9. Per capita GHG emissions
Figure 6. Final energy demand by sector Figure 7. Energy demand by primary energy
Figure 8. GHG emissions by sector
1,733
3,494359
790
572
1,442
834
240 1,091 649382
978685
6,635253
0
2,000
4,000
6,000
8,000
10,000
12,000
2005 2025 BaU 2025 CM
Energy dem
and (ktoe) .
Freight transport
Passenger transport
Industry
Commercial
Residential
3,286
10,936
5,915
1,209 3,699
691
4,978
1,729
3,854
279179
60
61
351,032
1,844
289
0
2,000
4,000
6,000
8,000
10,000
12,000
2005 2025 BaU 2025 CM
Energy dem
and (ktoe) .
CoalHydro powerSolar & wind powerBiomassNatural gasPetroleum
6,035
10,8971,615
4,070
1,481
2,9727,715
1,468
3,802
7,195
2,419
24,832
1,672
1,015
447
0
5,000
10,000
15,000
20,000
25,000
30,000
35,000
40,000
45,000
50,000
2005 2025 BaU 2025 CM
GHG emissions (k
tCO
2) .
Freight transport
Passenger transport
Industry
Commercial
Residential
12,552
45,484
19,598
15.1
9.3
6.5
0
2
4
6
8
10
12
14
16
18
2005 2025 BaU 2025 CM
t‐CO
2/capita

13 13
consumption in 2005. On the other hand, bio‐
mass, solar power, and wind power will be
newly introduced for primary energy in 2025 CM
case (CM: countermeasure). The share of renew‐
able energy is expected to be 8% of the total en‐
ergy demand.
Based on the energy demand by source, the
GHG emissions in IM are projected to increase
from 12.6 million tonnes of CO2 in 2005 to 45.5
million tonnes of CO2 under the BaU scenario.
The modelling results also showed GHG emis‐
sions from industry will be about 4.1 times the
total as compared with year 2005 and the share
will be around 54% of the total GHG emissions.
GHG emissions from passenger transport are
also found to be about 1.6 times the amount in
2005 and the share will be 4% of the total GHG
emissions. GHG emissions per capita will in‐
crease from 9.3 tonnes of CO2 per capita in 2005
to 15.1 tonnes of CO2 per capita in 2025 BaU sce‐
nario.
Coal Petroleum Natural gas Biomass Solar & Wind Electricity Total
2005 Residential 0 47 0 0 0 193 240
Commercial 0 53 2 0 0 328 382
Industry 50 679 623 0 0 381 1,733 Passenger Transport 0 357 2 0 0 0 359 Freight Transport 0 568 4 0 0 0 572 Total 50 1,704 632 0 0 901 3,286 Share 2% 52% 19% 0% 0% 27% 100%
2030BaU Residential 0 213 1 0 0 877 1,091 Commercial 0 135 4 0 0 839 978 Industry 228 2,594 2,367 0 0 1,446 6,635 Passenger Transport 0 585 4 200 0 1 790 Freight Transport 0 1,432 10 0 0 0 1,442 Total 228 4,960 2,386 200 0 3,163 10,936 Share 2% 45% 22% 2% 0% 29% 100%
2030CM Residential 0 16 52 0 130 452 649 Commercial 0 18 25 0 49 592 685 Industry 100 346 2,275 0 0 774 3,494 Passenger Transport 0 70 116 65 0 2 253 Freight Transport 0 230 384 213 0 6 834 Total 100 680 2,852 279 179 1,825 5,915 Share 2% 11% 48% 5% 3% 31% 100%
Table 6. Final energy demand by sector (unit: ktoe) : 2030BaU is a modeling result without any measures to improve energy efficiency or CO2 intensity. In 2030CM, higher energy efficiency and fuel shift to less CO2 intensive fuel is assumed. Detailed energy demand and supply table is shown in page 28 to 30.

14
Mitigation potential of IM in 2025
The model results estimated that total GHG
emissions in IM is to be reduced from 45.5 mil‐
lion tonnes CO2 in the BaU case to 19.6 million
tonnes CO2 in the CM case by adoption of coun‐
termeasures for mitigating GHG emissions in
2025. Based on the model simulation, the reduc‐
tions of GHG emissions by types of countermea‐
sures contributed by several measures.
Among the measures, efficiency improvement
for industry accounts for the largest proportion,
43.2% of the total reductions, followed by effi‐
ciency improvement for efficiency improvement
for power sector (18.3%), efficiency improvement
for buildings (17.8%), fuel shifting (15.3%), logis‐
tics improvement (3.1%), energy efficiency for
transport (3.0%) and transport demand manage‐
ment (2.5%).
Among the categories of countermeasures,
local governments should take effective meas‐
ures in transport demand management, and
penetration of renewable energy. In order to real‐
ize a low carbon society, IM has to have new and
bold policies to encourage and promote busi‐
nesses and citizens to take these countermea‐
sures.
Figure 10. Breakdown of emissions reduction potential
12552
3840
19598
45484 4592
10831
750
4465
623786
0
5,000
10,000
15,000
20,000
25,000
30,000
35,000
40,000
45,000
50,000
2005 2025 BaU 2025 CM
GHG emission
s/redu
ctions (k
t‐CO
2)
Logistics improvement
Transport demand management
Fuel shifting
Efficiency improvement (buildings)
Efficiency improvement (transport)
Efficiency improvement (industry)
Efficiency improvement (power sector)
GHG emissions
Emission
s reductio
ns

15
15
Climate Change Policy in Malaysia The Climate Change policy in Malaysia has been
in the pipe line of being constructed for a long period of time now. Datuk Douglas Uggah Embas, the Min‐ister of Natural Resources and Environment Malay‐sia, said that this is because Malaysia wants to ensure a broad‐based support, during the United Nations (UN) climate summit in Poland in December 2008. The Climate Change Performance Index, a report is‐sued annually by German Watch and Climate Action Network Europe, ranked Malaysia in the bottom 10 of the list. It was in the company of big greenhouse gas polluters like the United States, Australia, Canada and Saudi Arabia. Malaysia a developing nation should take more initiative towards making changes to lessen the effects of climate change.
Energy and Environment Energy and the environment are interrelated is‐
sues and it must be addressed together. They are fast becoming the focus of widespread attention as a global priority issues. It is increasingly important for the public to control their usage of energy resources from the perspective of environmental preservation and to increase their efficiency of energy consump‐tion. Energy production and consumption, however, puts undeniable pressure on the environment, which leads towards the alarming issue of Climate Change.
Principal Energy Objectives National energy policies ensure that adequate and
available supplies are reasonably priced to support national economic development objectives. These measures place a priority on oil and gas resources serving the needs of the nation, while taking into ac‐count the need for conservation and environmental protection.
Guiding these policies are three principal energy objectives that are instrumental for future energy sec‐tor development:
• The Supply Objective: To ensure the provision of adequate, secure, and cost‐effective energy sup‐plies through developing indigenous energy re‐
sources both non‐renewable and renewable en‐ergy resources using the least cost options and diversification of supply sources both from within and outside the country;
• The Utilization Objective: To promote the effi‐cient utilization of energy and to discourage wasteful and non‐productive patterns of energy consumption; and
• The Environmental Objective: To minimize the negative impacts of energy production, transpor‐tation, conversion, utilization and consumption on the environment. Government strategies at achieving national en‐
ergy objectives include the following: • Secure supply ‐ Diversification of fuel type and sources, technology, maximize use of indigenous energy resources, adequate reserve capacity to cater for contingencies [adequate reserve margin for generation, upgrading transmission and distri‐bution networks and distributed generation (islanding);
• Sufficient supply ‐ Forecast demand, right energy pricing and formulate plans to meet demand.
• Efficient supply ‐ Promote competition in the electricity supply industry.
• Cost‐effective supply ‐ Promote competition and provide indicative supply plan to meet demand based on least cost approach using power com‐puter software such as WASP;
• Sustainable supply ‐ Promote the development of renewable and co‐generation as much as possible.
• Quality supply (low harmonics, no surges and spikes, minimal variation in voltage) ‐ Match qual‐ity with customer demand with variable tariffs;
• Efficient utilization of energy ‐ Bench marking, auditing, financial and fiscal incentives, technol‐ogy development, promotion of ESCOs, Labelling, Ratings, correct pricing, energy managers; and
• Minimizing Negative Environmental Impacts ‐ Monitor the impacts, improve efficiency of utiliza‐tion and conversion and promote renewable.
( Continue to page 21)
Environmental & Energy Policies in Malaysia (1)

16
Mitigation Options (1)
Buildings (residential & commercial sector)
According to the South Johor Economic Re‐
gion Comprehensive Development Plan 2006‐
2025, population of the region in 2005 is 3 mil‐
lion. Since energy demand of residential sector
is thought to be determined based on number of
household rather than population, we assumed
average occupants of a household in 2025 by us‐
ing the assumptions of household size in 2025
(four members per household), then the number
of households will increase to 751,454 in 2025
from 317,762 in 2005. In the BaU case, energy
consumption increases to 1,091 ktoe and GHG
emissions 7,715 kt‐CO2, 4.5 times and 5.3 times
greater than 2005, respectively. The emissions
can be mitigated in the CM case, 4,743 kt‐CO2 or
61% lower than BaU case. The largest mitiga‐
tion potential is found in efficiency improvement
(buildings) (54%).
Residential sector
Commercial sector
Energy demand of commercial sector is esti‐
mated based on the floor space of the buildings. Driven by growth of tertiary industry, in 2025, it
will increase 2.8 times greater than 2005. In the
BaU case, energy consumption increases to 978
ktoe and GHG emissions 7,195 kt‐CO2, 2.6 times
and 3.0 times greater than 2005, respectively. The emissions can be mitigated in the CM case,
3,802 kt‐CO2 or 47% lower than BaU case. The
largest mitigation potential is found in efficiency
improvement (buildings) (56%).
Policy promoting mitigation measures of buildings and construction
In order to promote mitigation measures of
the building and construction sector, required
policies related to building design, energy effi‐
cient equipment and use of renewable energy
should be explored. Figure 14 shows the example
of the policies; performance standard or guide‐
lines of buildings, tax rate adjustment, subsidy,
labeling and green purchasing policy of the gov‐
ernment itself. In addition, it is equally important
for financial and funding companies to have the
corporate social responsibilities to promote in‐
vestments that bring about energy efficiency im‐
provement and promote the use of renewable
energy.
Figure 12. Floor space of commercial
Figure 11. Number of households
318
751
0
200
400
600
800
1000
2005 2025
No. of h
osue
hold (ʹ000)
1.75.7
16.3
0.6
1.2
0.6
0
5
10
15
20
25
2005 2025
Floor spa
ce of com
mercial(m
ill. m
2 )
Hospitals & Schools
Shops
Offices

17 17
Efficiencyimprovement(buildings)
56%
Fuel shifting5%
Efficiencyimprovement(power sector)
39%
Efficiencyimprovement
(buildings) 54%
Fuel shifting20%
Efficiencyimprovement(power sector)
17%
Figure 13. Changes from base year (left) and breakdown of emission mitigation by means (right) in residential sector
Figure 14. Changes from base year (left) and breakdown of emission mitigation by means (right) in commercial sector
Figure 15. Mitigation measures and policies for buildings (residential & commercial)
(from oil to natural gas & solar power)
(high insulation level)
(from oil to natural gas & solar power)
(high insulation level)
Energy‐efficient buildings
Energy efficiency im‐provement of equipments
Renewable energy (PV)
Energy efficiency improvement
Lowering CO2
intensity
Environmental performance standard and evaluation of
buildings
Adjustment of tax rate of fixed asset tax
Low interest loans in invest‐ment to energy efficient build‐
Environmental performance standard of equipments
Environmental labeling
Education and information
service
Green purchasing policy
Subsidy to introduce photovoltaic power generation system
Mitigation of GHG emissions from Residential and Commercial sector
0.0
1.0
2.0
3.0
4.0
5.0
6.0
No. of household Energy demand GHG emissions
Value in 2005 = 1
2005 2025 BaU 2025 CM
0.0
0.5
1.0
1.5
2.0
2.5
3.0
3.5
Floor space Energy demand GHG emissions
Value in 2005 = 1
2005 2025 BaU 2025 CM
18
Mitigation Options (2)
Transport (passenger & freight)
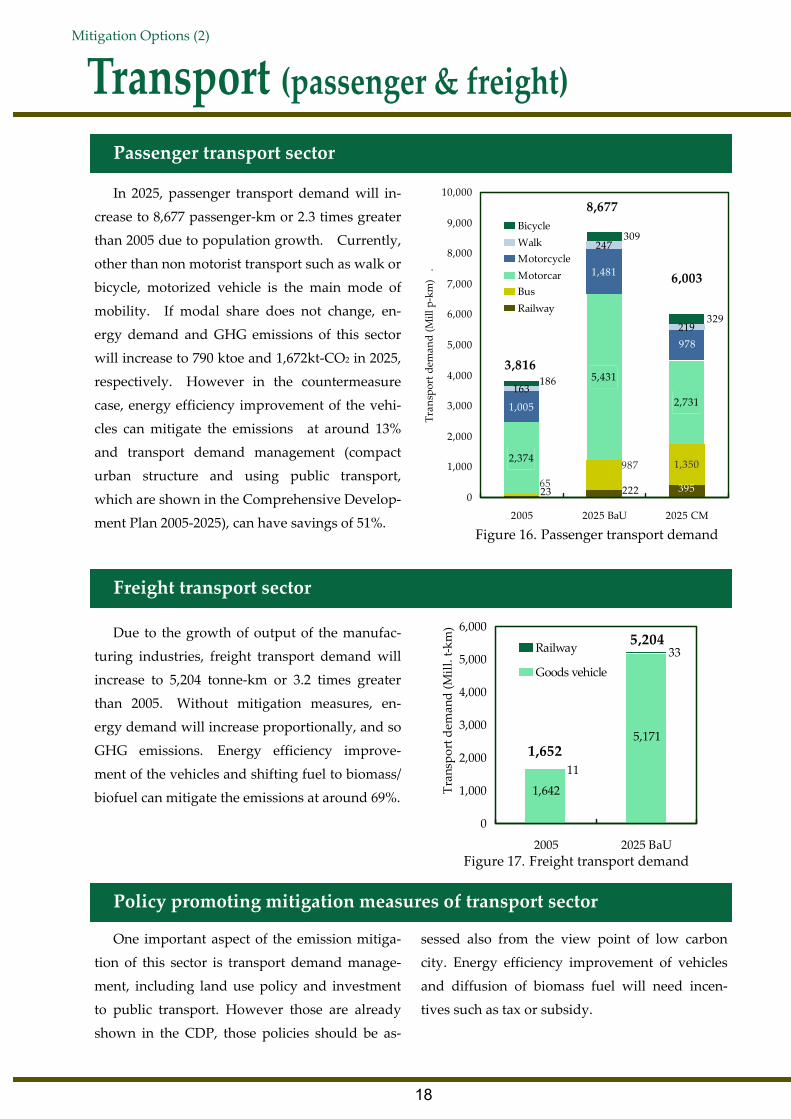
In 2025, passenger transport demand will in‐
crease to 8,677 passenger‐km or 2.3 times greater
than 2005 due to population growth. Currently,
other than non motorist transport such as walk or
bicycle, motorized vehicle is the main mode of
mobility. If modal share does not change, en‐
ergy demand and GHG emissions of this sector
will increase to 790 ktoe and 1,672kt‐CO2 in 2025,
respectively. However in the countermeasure
case, energy efficiency improvement of the vehi‐
cles can mitigate the emissions at around 13%
and transport demand management (compact
urban structure and using public transport,
which are shown in the Comprehensive Develop‐
ment Plan 2005‐2025), can have savings of 51%.
Passenger transport sector
Freight transport sector
Due to the growth of output of the manufac‐
turing industries, freight transport demand will
increase to 5,204 tonne‐km or 3.2 times greater
than 2005. Without mitigation measures, en‐
ergy demand will increase proportionally, and so
GHG emissions. Energy efficiency improve‐
ment of the vehicles and shifting fuel to biomass/
biofuel can mitigate the emissions at around 69%.
Policy promoting mitigation measures of transport sector
One important aspect of the emission mitiga‐
tion of this sector is transport demand manage‐
ment, including land use policy and investment
to public transport. However those are already
shown in the CDP, those policies should be as‐
sessed also from the view point of low carbon
city. Energy efficiency improvement of vehicles
and diffusion of biomass fuel will need incen‐
tives such as tax or subsidy.
2,374
5,431
2,7311,005
1,481
163
247
219
39522223
1,350987
65
978
329
309
186
0
1,000
2,000
3,000
4,000
5,000
6,000
7,000
8,000
9,000
10,000
2005 2025 BaU 2025 CM
Tran
sport d
eman
d (M
ill p‐km) .
BicycleWalkMotorcycleMotorcarBusRailway
3,816
8,677
6,003
Figure 16. Passenger transport demand
1,642
5,171
11
33
0
1,000
2,000
3,000
4,000
5,000
6,000
2005 2025 BaU
Transport d
emand (M
ill. t‐km)
Railway
Goods vehicle
1,652
5,204
Figure 17. Freight transport demand

19 19
Logisticsimprovement
30%
Fuel shifting47%
Efficiencyimprovement(transport)
23%
0.0
0.5
1.0
1.5
2.0
2.5
3.0
3.5
Freight transport demand Energy demand GHG emissions
Value in 2005 = 1
2005 2025 BaU 2025 CM
Transport demandmanagement
39%Efficiency
improvement(power sector)
0.2%Fuel shifting
36%Efficiency
improvement(transport)
13%
Figure 19. Changes from base year (left) and breakdown of emission mitigation amount by means (right, kt‐CO2) in freight transport sector
Figure 18. Changes from base year (left) and breakdown of emission mitigation amount by means (right, kt‐
Figure 20. Mitigation measures and policies for transport and land use
(high fuel efficiency)
Mitigation of GHG emissions from Transport
Compact city Renewable energy (Bio fuel)
Transport demand management
Urban planning
Transport planning
Tax rate adjustment to fixed asset
Investment in public transport
Lowering CO2 in‐tensity
Public transport (bus & train)
Energy efficiency improvement
Environmental performance standard of vehicles
Tax rate adjustment to energy
efficient vehicles
Promotion of bio fuel
Energy efficient vehicles
0.0
0.5
1.0
1.5
2.0
2.5
Passenger transportdemand
Energy demand GHG emissions
Value in 2005 = 1
2005 2025 BaU 2025 CM
(from oil to natural gas & biofuel)
(from car to bus & railway)
(from oil to natural gas & biofuel)
(high fuel efficiency)
20
0.0
0.5
1.0
1.5
2.0
2.5
3.0
3.5
4.0
4.5
Output Energy demand GHG emissions
Value in 2005 = 1
2005 2025 BaU 2025 CM
Efficiencyimprovement(power sector)
15%
Fuel shifting 8%Efficiencyimprovement(industry)
77%
Mitigation Options (3)
Industry & Power sector
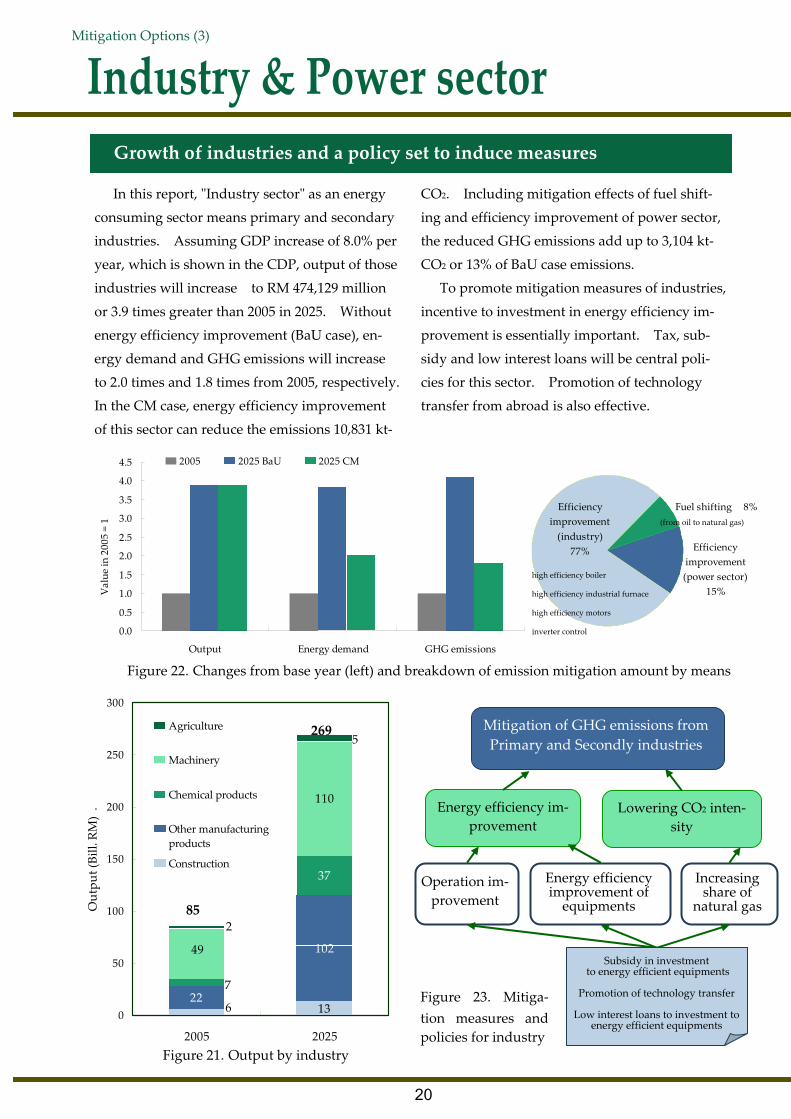
In this report, ʺIndustry sectorʺ as an energy
consuming sector means primary and secondary
industries. Assuming GDP increase of 8.0% per
year, which is shown in the CDP, output of those
industries will increase to RM 474,129 million
or 3.9 times greater than 2005 in 2025. Without
energy efficiency improvement (BaU case), en‐
ergy demand and GHG emissions will increase
to 2.0 times and 1.8 times from 2005, respectively. In the CM case, energy efficiency improvement
of this sector can reduce the emissions 10,831 kt‐
CO2. Including mitigation effects of fuel shift‐
ing and efficiency improvement of power sector,
the reduced GHG emissions add up to 3,104 kt‐
CO2 or 13% of BaU case emissions.
To promote mitigation measures of industries,
incentive to investment in energy efficiency im‐
provement is essentially important. Tax, sub‐
sidy and low interest loans will be central poli‐
cies for this sector. Promotion of technology
transfer from abroad is also effective.
Growth of industries and a policy set to induce measures
Figure 22. Changes from base year (left) and breakdown of emission mitigation amount by means
Figure 23. Mitiga‐tion measures and policies for industry
(from oil to natural gas)
high efficiency boiler
high efficiency industrial furnace
high efficiency motors
inverter control
Operation im‐provement
Mitigation of GHG emissions from Primary and Secondly industries
Energy efficiency improvement of equipments
Increasing share of
natural gas
Energy efficiency im‐provement
Lowering CO2 inten‐sity
Subsidy in investment to energy efficient equipments
Promotion of technology transfer
Low interest loans to investment to
energy efficient equipments
22
102
110
136
37
7
49
5
2
0
50
100
150
200
250
300
2005 2025
Outpu
t (Bill. RM) .
Agriculture
Machinery
Chemical products
Other manufacturingproducts
Construction
269
85
Figure 21. Output by industry
21 21
Power generation and renewable energy
In this report, mitigation amount due to effi‐
ciency improvement of power generation has
been computed in sectors consuming electricity.
Sum of those are 4,592 kt‐CO2, or 18.3% of the
whole mitigation potential. However power gen‐
eration is a state‐level strategy rather than city‐
level energy policy, it cannot be ignored also
from the view point of the low carbon city. If
GHG emissions from the power sector per elec‐
tricity generation is lower, burden of mitigation
measures of a region can also be lowered. This
time we assumed only fuel efficiency improve‐
ment. Using fuel with less CO2 emissions or car‐
bon capture and storage are other options, for
example. Promotion of technology transfer
Promotion of investment to im‐
prove energy efficiency
(Continue from page 15)
The key policies guiding energy‐related activities in Malaysia are: • Petroleum Development Act 1974 – Established Petronas as the national oil company and vested it with the responsibility for exploration, develop‐ment, refining, processing, manufacturing, mar‐keting and distribution of petroleum products.
• National Energy Policy 1979 – Set the overall en‐ergy policy with broad guidelines on long‐term energy objectives and strategies to ensure efficient, secure and environmentally sustainable supplies of energy.
• National Depletion Policy 1980 – Introduced to safeguard the exploitation of natural oil reserves because of the rapid increase in the production of crude oil.
• Four Fuel Diversification Policy 1981 – Designed to prevent over‐dependence on oil as the main energy resource, its aim was to ensure reliability and security of the energy supply by focusing on four primary energy resources: oil, gas, hydro‐power and coal.
• Fifth Fuel Policy (Eighth Malaysia Plan 2001‐2005) – In the Eighth Malaysian Plan, Renewable Energy was announced as the fifth fuel in the en‐ergy supply mix. Renewable Energy is being tar‐
geted to be a significant contributor to the coun‐tryʹs total electricity supply. With this objective in mind, greater efforts are being undertaken to en‐courage the utilization of renewable resources, such as biomass, biogas, solar and mini‐hydro, for energy generation.
• Energy Efficiency and Renewable Energy (Ninth Malaysia Plan 2006‐2010) ‐ The Ninth Plan strengthens the initiatives for energy efficiency and renewable energy put forth in the Eighth Ma‐laysia Plan that focused on better utilization of energy resources. An emphasis to further reduce the dependency on petroleum provides for more efforts to integrate alternative fuels. The implementation of energy efficiency measures
can lead to a reduction of Malaysia’s current GHG emissions. Thus, the potential viability of energy effi‐ciency and renewable energy needs to be seriously looked into as a way of achieving cost, energy and environmental savings for the nation.
Reference ENERGY EFFICIENCY POLICY, PROGRAMS AND INDICATORS IN MALAYSIA, Energy Efficiency Indicator Workshop Moscow 12‐15 Sep 05 Malaysia To Address Climate Adaptation Measures Sep 06, 2007, UNDP Malaysia Pusat Tenaga Malaysia, http://www.ptm.org.my/
Environmental & Energy Policies in Malaysia (2)

22
Policy package for Low‐Carbon
Comprehensive policy, plan or action is neces‐
sary to realize Low‐Carbon Region. Figure 24
shows the policies aforementioned in the mitiga‐
tion measures of each sector. It takes decades to
create a low‐carbon city because energy con‐
sumption has strong inertia and it is needed to
construct infrastructure and renew the stock to
change the current status. Therefore, it is impor‐
tant to consider creating Low‐Carbon Region in
the goals of development at earlier stage. Hence
it is imperative to set a GHG emissions target as
one of the goals of Iskandar Malaysia develop‐
ment.
A policy package towards low‐carbon Iskandar Malaysia
Needs for further research
In this preliminary report, simple modeling
method is adopted due to the constraints of data
and information availability. Based on this re‐
port, more concrete and detail research to investi‐
gate strategy to realize Low‐Carbon Region on
IM is desired.
Pertinent research information required for
more sophisticated modeling work includes;
more detailed and disaggregated information
especially energy consumption from transport
demand, availability of renewable energy re‐
sources in Iskandar Malaysia and the Johor State
and GHG emissions from land use and land use
change. With this information, it will be possible
to show more valid estimation of GHG emissions
and reductions, which enables the assessment of
each mitigation measures and priority of the poli‐
cies being carried out.

23 23
Figure 24. Policy package for Low‐Carbon Region
Region
Mitigation of GHG emissions from Iskandar Malaysia
Energy efficiency improvement
Lowering CO2 intensity
Transport demand control
Incentive to introduce energy efficient equipments and buildings
Buildings (residential and commercial sector)
Transport and Land Use Industry
Low‐Carbon Region Policy Package
Controlling urban growth and choice of transport mode
Subsidy in investment to energy efficient equip‐
ments
Promotion of technology transfer
Low interest loans to invest‐
Environmental performance standard and evaluation of
buildings
Adjustment of tax rate of fixed asset tax
Low interest loans in invest‐ment to energy efficient
buildings
Environmental performance standard of equipments
Environmental labeling
Education and information
service
Green purchasing policy
Subsidy to introduce photo‐voltaic power generation
system
Urban planning
Transport planning
Tax rate adjustment to fixed asset
Investment in public trans‐port
Environmental performance standard of vehicles
Tax rate adjustment to en‐ergy efficient vehicles
Promotion of bio fuel

24
Methodology
In order to create a local low‐carbon society sce‐nario, We developed a method based on the idea of ʺback castingʺ, which sets a desirable goal first, and then seek the way to achieve it. Figure 25 shows over‐view of the method.
(1) Setting framework Framework of a LCS scenario includes; target area,
base year, target year, environmental target, number of scenarios. Among them, the base year is compared with target year. The target year should be far enough to realize required change, and near enough to image the vision for the people in the region. In this study, we set the target year of IM, 2025. This is also a suit‐able time span for a LCS study for the reasons above. As an environmental target, we targeted CO2 from energy use because it will be a main source of GHG emissions from IM in 2025.
(2)Assumptions of socio‐economic situations Before conducting quantitative estimation, qualita‐
tive future image should be written. It is an image of lifestyle, economy and industry, land use and so on. We could use the assumptions showed in the CDP.
(3)Quantification of socio‐economic assumptions To estimate Snapshot based on future image of (2),
values of exogenous variables and parameters are set. Using those input, ExSS calculates socio‐economic indices of the target year such as population, GDP, output by industry, transport demand, and so on.
(4)Collection of low‐carbon measures To collect counter measures which are thought to
be available in the target year. For example, high en‐ergy‐efficiency devices, transport structure change such as public transport, use of renewable energy, energy saving behavior and carbon sink. Technical data is required to estimate their effect to reduce GHG emissions. In this research we employed the measure showed in preceding study in the Shiga prefecture, Japan because of information availability and similar‐ity of industrial structure and population size of Shiga and IM region.
(5)Setting introduction of counter measures Technological parameters related to energy de‐
mand and CO2 emissions, in short energy efficiency, are defined. Since there can be various portfolios of the measures, one must choose appropriate criteria. For example, cost minimization, acceptance to the stakeholders, or probability of technological develop‐ment.
(6)Estimation of GHG emission in the target year Based on socio‐economic indices and assumption
of measuresʹ introduction, GHG emissions are calcu‐lated.
(7)Proposal of policies Propose policy set to introduce the measures de‐
fined. Available policies depend on the situation of the municipality or the country which it belongs. ExSS can calculate emission reduction of each counter measure.
Therefore, it can show reduction potential of meas‐ures which especially needs local policy. It can also identify measures which have high reduction poten‐tial and therefore important.
A Procedure to create a local LCS scenario (1) Setting Framework
(3) Quantification of socio‐economic assumptions
(4) Collection of low carbon measures
(2) Description of socio‐economic assumptions
(6) Estimation of GHG emissions in the target year
(5) Setting introduction of measures in target year
(7) Confirming measures set and suggestion of policy recommendations
Figure 25. Procedure to create a local LCS scenario

25
25
Figure 26 shows the structure of the Extended Snapshot Tool (ExSS); seven blocks with input pa‐rameters, exogenous variables and variables between modules. ExSS is a system of simultaneous equations. Given a set of exogenous variables and parameters, solution is uniquely defined. In this simulation model, only CO2 emission from energy consumption is calcu‐lated, even though, ESS can be used to estimate other GHG and environmental loads such as air quality. In many LCS scenarios, exogenously fixed population data are used. However, people migrate more easily, when the target region is relatively a smaller area such as a state, district, city or town. Population is decided by demand from outside of the region, labor participa‐tion ratio, demographic composition and relationship of commuting with outside of the region. To deter‐mine output of industries, input‐output approach with “export‐base approach” is combined in line with the theory of regional economics.
Industries producing export goods are called ʺbasic industryʺ. Production of basic industries induces other industries i.e. non‐basic industries, through demand
of intermediate input and consumption of their em‐ployees. Number of workers must fulfill labor de‐mand of those productions. Given assumptions of where those workers live and labor participation ratio, population living in the region is computed. This model enables us to consider viewpoints of regional economic development to estimate energy demand and CO2 emissions. For future estimation, assumption of export value is especially important if the target region is thought to (or, desired to) develop led by particular industry, such as automotive manufactur‐ing.
Passenger transport demand is estimated from the population and freight transport demand whereby it is a function of output by manufacturing industries. Floor area of commerce is determined from output of tertiary industries. Other than driving force, activity level of each sector, energy demand by fuels deter‐mined with three parameters. One is energy service demand per driving force, energy efficiency and fuel share. Diffusion of counter measures changes the value of these parameters, and so GHG emissions.
Quantitative estimation tool “Extended Snapshot Tool”
Macro‐economy and Industry Module
Labor Module
Population and Household Number Module
Time‐use and Consumption Module
Transport Module
Commercial Building Module
Energy Demand & GHG Emissions Module GHG emissions
Labor demandWage
Number of workers
Average working time
PopulationPrivate consumption
Number of household
Output
Passenger and freight transport demand
Floor area of commercial buildings
Energy demand
Income
•Export•Import ratio
•Commuting OD •Labor participation ratio•Demographic composition•Average number of family occupants
•Breakdown of consumption
•Floor area per output
•Population distribution•Trip per parson•Transport distance•Modal share
•Energy service demand generation unit•Energy efficiency•Fuel share•Emission factor
•Government expenditure•Labor productivity
Exogenous variables and parameters
Main endogenous variablesModule
InputFlow of endogenous variables
Figure 26. Overview of calculation system of Extended Snapshot Tool

26
The estimated results of the future socio‐economic indicators and energy demand in 2025 are based on the modelling of the socio‐economic variables and energy balance table in 2025. Most of the socio‐economic indicators and energy balance table on Is‐kandar Malaysia are obtained from published statis‐
tics and secondary sources. Assumptions are used where information for macroeconomic analysis is not available for the Iskandar Malaysia region.
The followings are the procedures for estimating socio‐economic indicators and energy balance table
(final demand sector).
Collection and estimation of information
SECTOR PROCEDURE TO MAKE IM ENERGY BALANCE TABLE REFERENCES
Energy Supply Sector
Indigenous Production Ministry of Energy, Water and Communications, Malaysia: National Energy Balance 2005 Malaysia
Imports Exports Error term
Energy Demand Sector
Transformation Sector Utility generation Refineries Losses & own use Statistical Discrepancy
Industry Sector Agriculture
Energy consumption for each industry in IM = Energy consumption for each industry in Malaysia * Value of gross output for each sector in IM / Value of gross output for each sector in Malaysia
Ministry of Energy, Water and Communications, Malaysia: National Energy Balance 2005 Malaysia, Dept. of Statistics, Malaysia(2005): Input‐Output tables, Malaysia 2000
Mining Food Products and Beverages Chemicals and Chemical Products Electric and Electronic Products and Machinery Fabricated Metal Products and Machinery Other Non‐Metallic Rubber and Plastics Products Construction
Residential & Commercial Sector
Residential Sector Energy consumption for residential sector in IM = Average energy consumption per household in IM * No. of households in IM
Ministry of Energy, Water and Communications, Malaysia(2005): National Energy Balance 2005 Malay‐sia, IDR Master Plan(2005), Dept. of Statistics, Malay‐sia(2006): State/District Data Bank 2006
Commercial Sector
Energy consumption for commercial sector in IM (excl. electricity) = Energy consumption for commercial sector in Malaysia * No. of employed people for services in IM / No. of employed people for services in Malaysia Energy consumption for commercial sector in IM (electricity) = Energy consumption for commercial sector in Malaysia * No. of employed people for services in IM / No. of employed people for services in Malaysia * Energy consumption for residential sector in IM / Energy consumption for residential sector in Malaysia * No. of household in IM / No. of households in Malaysia
IDR Master Plan(2005), Dept. of Statistics, Malaysia(2006): State/District Data Bank 2006
Transport Sector
Passenger transport
Motorcar Energy consumption for motorcars in IM = Energy consumption for motorcars in Malaysia * No. of motorcars in IM / No. of motorcars in Malaysia
Dept. of Statistics, Malaysia(2006): State/District Data Bank 2006
Motorcycle Energy consumption for motorcycles in IM = Energy consumption for motorcycles in Malaysia * No. of motorcycles in IM / No. of motorcycles in Malaysia
Dept. of Statistics, Malaysia(2006): State/District Data Bank 2006
Bus Energy consumption for buses in IM = Energy consumption for buses in Malaysia * No. of buses in IM / No. of buses in Malaysia
Dept. of Statistics, Malaysia(2006): State/District Data Bank 2006
Railways Energy consumption for railways in IM = Energy consumption for railways in Malaysia * Passenger traffic volume of railways in IM / Passenger traffic volume of railways in Malaysia
Dept. of Statistics, Malaysia(2006): Year Book of Statis‐tics, Malaysia 2006
Ship Unconsidered
Aviation Unconsidered Freight transport
Goods vehicle Energy consumption for goods vehicles in IM = Energy consumption for goods vehicles in Malaysia * No. of goods vehicles in IM / No. of goods vehicles in Malaysia
Dept. of Statistics, Malaysia(2006): State/District Data Bank 2006
Railways Energy consumption for railways in IM = Energy consumption for railways in Malaysia * Freight traffic volume of railways in IM / Freight traffic volume of railways in Malaysia
Dept. of Statistics, Malaysia(2006): Year Book of Statis‐tics Malaysia 2006
Ship Unconsidered Aviation Unconsidered
Ministry of Energy, Water and Communications, Malaysia: National Energy Balance 2005 Malaysia

27
27
SOCIO‐ECONOMIC INDICATOR UNIT PROCEDURE TO ESTIMATE IM SOCIO‐ECONOMIC INDICATORS 2005 REFERENCES
Population person
Population in IM is cited from Comprehensive Development Plan for South Johor Economic Region 2006‐2025.
Dept. of Statistics, Malaysia(2006): Malaysia Economic Statistics ‐ Time Series 2005, Dept. of Statistics, Malaysia(2006): State/District Data Bank 2006, Khazanah Nasional(2006): Comprehensive Development Plan for South Johor Economic Region 2006‐2025
Population by age cohort and sex in IM = Population in IM * age cohort ratio * Sex ratio Age cohort ratio: [0‐14] 30.5%, [15‐64]66.4%, [65+]3.1%, Sex ratio: [male]50.5%, [female]49.5%
Labour participation ratio % Labour participation ratio in IM = Labour participation ratio in Johor Dept. of Statistics, Malaysia(2006): State/District Data Bank 2006
No. of employed people person
No. of employed people in IM = Population by sex in IM (15+) * Labour participation ratio by sex in IM Dept. of Statistics, Malaysia(2006): State/
District Data Bank 2006 No. of employed people by industry in IM =No. of employed people by each industry in Malaysia * Paid wage of each industry in IM / Paid wage of total industry in IM
Commuting origin‐destination (OD) matrix % Commuting OD matrix in IM is cited from researchers’ estimation adjusted by CS Ho 1992
studies. CS Ho 1992 studies
No. of households household
No. of households in IM 2000 is cited from Population & Housing Census of Malaysia 2000; Population Distribution by Local Authority Areas and Mukims Dept. of Statistics, Malaysia(2001): Popula‐
tion & Housing Census of Malaysia 2000; Population Distribution by Local Authority Areas and Mukims
No. of households in IM 2005 = No. of households in IM 2000 * No. of places of residence in IM 2005 / No. of places of residence in IM 2000
Place of residence residence
No. of places of residence in IM 2000 is cited from Population & Housing Census of Malaysia 2000; Population Distribution by Local Authority Areas and Mukims
Dept. of Statistics, Malaysia(2001): Popula‐tion & Housing Census of Malaysia 2000; Population Distribution by Local Authority Areas and Mukims, Valuation and Property Services Department, Ministry of Finance, Malaysia(2006): Property Market Report 2005
No. of places of residence in IM 2005 is estimated from year 2000 based on Property Market Report 2005.
Gross Regional Domestic Product (GRDP)
RM (current price) Percentage of GRDP by industry in IM is cited from IDR Master Plan.
Dept. of Statistics, Malaysia(2006): Malaysia Economic Statistics ‐ Time Series 2005, Johor State Economic Planning Unit(2006), IDR Master Plan(2005)
Value of gross output RM (current price)
Value of gross output for manufacturing industry in IM is cited from IDR Master Plan(2005). Dept. of Statistics, Malaysia(2005): Input‐Output tables, Malaysia 2000, Johor State Economic Planning Unit(2006), IDR Master Plan(2005)
Value of gross output by industry in IM (except manufacturing industry) = Intermediate input by industry in IM + Value added by industry in IM
Intermediate input RM (current price)
Intermediate input of manufacturing industry in IM = Intermediate input of manufacturing industry in Johor * 0.606 Dept. of Statistics, Malaysia(2005): Input‐
Output tables, Malaysia 2000, Johor State Economic Planning Unit(2006)
Intermediate input by industry in IM (except manufacturing industry) = Intermediate Input by industry in Malaysia * Value added by industry in IM / Value added by industry in Malaysia
Value added RM (current price)
Value added of manufacturing industry in IM = Value added of manufacturing industry in Johor * 0.606
Dept. of Statistics, Malaysia(2005): Input‐Output tables, Malaysia 2000
Total value added of industries in IM = Value added of manufacturing industry in IM / Percentage of regional GDP of manufacturing industry in IM Value added by industry in IM (except manufacturing industry) = Total value added of industries in IM * Percentage of regional GDP by industry in IM
Paid wage RM (current price)
Paid wage of manufacturing industry in IM = Paid wage of manufacturing industry in Johor * 0.606
Dept. of Statistics, Malaysia(2005): Input‐Output tables, Malaysia 2000 Paid wage by industry in IM (except manufacturing industry)
= Paid wage by industry in Malaysia * Value added by industry in IM / Value added by industry in Malaysia
Private consumption expenditure RM (current price)
Private consumption expenditure in IM = Private consumption expenditure in Malaysia * Population in IM / Population in Malaysia
Dept. of Statistics, Malaysia(2005): Input‐Output tables, Malaysia 2000
Government consumption expenditure
RM (current price)
Government consumption expenditure in IM = Government consumption expenditure in Malaysia * Population in IM / Population in Malaysia
Dept. of Statistics, Malaysia(2005): Input‐Output tables, Malaysia 2000
Gross fixed capital formation RM (current price)
Gross fixed capital formation in IM = Private investment expenditure in IM + Government investment expenditure in IM
Dept. of Statistics, Malaysia(2005): Input‐Output tables, Malaysia 2000
Private investment expenditure RM (current price)
Private investment expenditure in IM = Private investment expenditure in Malaysia * Population in IM / Population in Malaysia
Johor State Economic Planning Unit(2006)
Government investment expenditure
RM (current price)
Government investment expenditure in IM = Government investment expenditure in Malaysia * Population in IM / Population in Malaysia
Johor State Economic Planning Unit(2006)
Floor space of building stocks m2 Floor space of building stocks by building type is cited from Property Market Report 2005. Valuation and Property Services Depart‐ment, Ministry of Finance, Malaysia(2006): Property Market Report 2005
No. of vehicles vehicle No. of vehicles in IM = No. of vehicles in Malaysia * No. of households in IM / No. of households in Malaysia
Dept. of Statistics, Malaysia(2006): State/District Data Bank 2006
Trip per person per day trip/person/day Trip per person per day = 2.25
Modal share in passenger % Modal share in passenger in IM is estimated from JICA and Malaysia Traffic Survey.
JICA(1997): A Study on Integrated Urban Transportation Strategies for Environmental Improvement in Kuala Lumpur, Ministry of Work, Malaysia(2006): Road Traffic Volume Malaysia 2006
Average trip distance km Average trip distance in IM is estimated from JICA(1997). JICA(1997): A Study on Integrated Urban Transportation Strategies for Environmental Improvement in Kuala Lumpur
Passenger transport volume: Passenger vehicles (motorcar, motorcycle, bus)
passenger‐km Passenger transport demand of passenger vehicles in IM (passenger‐km) = Population in IM * Trip per person per day * 365 *Average trip distance
Passenger transport volume: Railways passenger‐km
Passenger transport demand of railways in IM (passenger‐km) = Passenger transport demand of railways in Malaysia (passenger‐km) * main stations of KTM in IM / main stations of KTM in Malaysia
Dept. of Statistics, Malaysia(2006): Year Book of Statistics Malaysia 2006, Keretapi Tanah Melayu (KTM)
Modal share in freight % Modal share in freight is estimated from freight transport demand.
Freight transport volume: Goods vehicles tonne‐km
Freight transport demand of goods vehicles in IM (vehicle‐km) = No. of goods vehicles in IM * Average travel distance per goods vehicle per year (km) in Fulton and Eads(2004) Fulton, L. and G. Eads(2004): IEA‐SMP
Model Documentation and Reference Case Projection Freight transport demand of vehicles in IM (tonne‐km)
= Freight transport demand of goods vehicles in IM (vehicle‐km) * Average load (tonne per vehicle) in Fulton and Eads(2004)
Freight transport volume: Railways tonne‐km
Freight transport demand of railways in IM (tonne‐km) = Freight transport demand of railways in Malaysia (tonne‐km) * main stations of KTM in IM / main stations of KTM in Malaysia
Dept. of Statistics, Malaysia(2006): Year Book of Statistics, Malaysia 2006, Keretapi Tanah Melayu (KTM)
CO2 emission factor kt‐C/ktoe CO2 emission factor by energy (except electricity) is cited from Ministry of the Environment, Japan.
Ministry of Energy, Water and Communica‐tions, Malaysia(2005): National Energy Balance 2005 Malaysia CO2 emission factor of electricity in IM is based on National Energy Balance 2005 Malaysia.

28
Energy balance table of IM
in 2005 ( final demand sector ) (Unit: ktoe)
IM IO table 2005 (Unit: mill.RM)
Agriculture
Mining
Food Productsand Bevarages
Chemicals andChemicalProducts
Electric andElectronicProducts and
FabricatedMetal Productsand Machinery
Other Non‐Metallic
Rubber andPlasticsProducts
Construction
Transportrelated
Wholesale andRetail
Tourism andHospitality
Professionaland Business
Medical andEducation
Other Services
Publicadministration
Totalintermediateinput
Privateconsumption
Governmentconsumption
Fixed capitalformation
Export
Import
Total finaldemand
Total use(domesticproduction)
Agriculture
175
01686
232
514
561
472
72
91059
51
110
4238
797
065
443
‐3684
‐2379
1860
Mining
00
0139
2107
832521
214
01
03
02
03074
50
154
0‐3233
‐3074
0Fo
od Produ
cts an
d Be
varages
105
03673
518
62
23
61
72283
539
410
6665
958
00
3743
‐2138
2563
9228
Che
micals an
d Chemical Produ
cts
740
250
2063
833
506
291
910
5413
1953
9104
92
5191
181
00
4327
‐3046
1461
6651
Electric and Electronic Prod
ucts and M
achine
110
02
14343
7548
97152
306
3515
3023
8147
422721
467
0441
22503
‐19329
4082
26803
Fabricated M
etal Produ
cts an
d Machine
ry43
0166
196
2963
6442
257
100
1302
429
109
119
7365
53109
12426
1017
01618
17719
‐10749
9606
22032
Other N
on‐M
etallic
170
247
116
653
331
1282
791214
17121
111
9962
2539
4413
1093
071
3445
‐3644
965
5378
Rubb
er and Plastics Prod
ucts
135
0544
469
236
352
390
746
103
824
174
9521
1469
154187
811
00
4069
‐1972
2908
7095
Con
struction
170
36124
61116
4467
243
51147
8221
4239
391129
330
2098
3168
‐113
5185
6315
Tran
sport related
140
120
79186
205
9143
109
2127
239
138
3116
3016
3444
530
09
4693
‐1449
3782
7226
Who
lesale and Retail
610
288
325
1817
1776
231
306
335
172
47297
3036
3910
5770
157
0129
5303
05588
11358
Tourism and H
ospitality
20
1218
4941
1614
35418
400
156
2619
1118
1235
1043
00
6984
08027
9261
Profession
al and Business
120
77136
190
268
6954
388
355
1195
926
575
170
185
106
4707
2173
825
1716
‐4796
‐820
3887
Med
ical and Edu
catio
n54
0112
124
151
147
35116
55109
462
202
8241
651
1756
100
875
014
‐906
831840
Other Services
100
244
197
231
319
118
132
64170
394
546
134
76132
422807
832
730
133
‐2140
‐1103
1705
Public adm
inistration
00
30
00
00
01
10
00
120
260
1810
00
‐1044
766
793
Total intermed
iate in
put
731
07458
4738
21729
18173
3567
5715
4433
4723
3340
6099
1139
691
823
432
83790
10195
2840
4590
78259
‐58243
154127
237916
Com
pensation of Employ
ee202
0471
386
1489
1042
722
258
1227
1122
1695
1183
641
1073
168
344
12023
Ope
ratin
g Su
rplus
924
01271
1482
3542
2685
1057
1097
609
1342
6228
1921
2042
68696
824975
Other value add
ed3
029
4544
132
3126
4639
9458
647
178
644
Total v
alue add
ed1129
01771
1913
5075
3859
1811
1381
1882
2503
8018
3162
2748
1148
882
360
37641
Total inp
ut (d
omestic produ
ction)
1860
09228
6651
26803
22032
5378
7095
6315
7226
11358
9261
3887
1840
1705
793
121431
Industry
Coal
Petroleu
mProd
ucts
(total)
Natural gas
LNG
Rene
wables
Electricity
Total
Ratio of A
llSector
Gasoline
Nap
htha
Jet F
uel
Kerosen
eDiesel O
ilHeavy Oil
Lubricating
Oil
LPG
Petrol.
Hyd
roPe
trol. C
oke
Agriculture
0.0
3.0
0.1
0.0
0.0
0.0
3.0
0.0
0.0
0.0
0.0
0.0
0.0
0.0
0.0
0.0
3.0
0%Con
struction
0.0
0.0
0.0
0.0
0.0
0.0
0.0
0.0
0.0
0.0
0.0
0.0
0.0
0.0
0.0
0.0
69.1
2%Mining
0.0
31.8
0.1
0.0
0.0
0.2
20.4
9.8
0.0
1.3
0.1
0.0
23.2
0.0
0.0
14.1
0.0
0.0
Food Produ
cts a
nd Bevarages
0.0
158.4
0.4
0.0
0.0
0.9
101.5
48.8
0.0
6.4
0.3
0.0
222.9
0.0
0.0
136.1
517.4
16%
Che
micals a
nd Che
mical Produ
cts
0.0
147.3
0.4
0.0
0.0
0.8
94.4
45.4
0.0
6.0
0.3
0.0
51.1
0.0
0.0
31.2
229.6
7%Electric and Electronic Prod
ucts and M
achine
ry0.0
22.6
0.1
0.0
0.0
0.1
14.5
7.0
0.0
0.9
0.0
0.0
125.7
0.0
0.0
76.8
225.0
7%Fabricated M
etal Produ
cts an
d Machine
ry0.0
39.4
0.1
0.0
0.0
0.2
25.2
12.1
0.0
1.6
0.1
0.0
54.3
0.0
0.0
33.2
126.9
4%Other N
on‐M
etallic
49.7
34.2
0.1
0.0
0.0
0.2
21.9
10.5
0.0
1.4
0.1
0.0
25.9
0.0
0.0
15.8
125.5
4%Ru
bber and Plastics Prod
ucts
0.0
242.4
0.7
0.0
0.0
1.4
155.4
74.7
0.0
9.8
0.4
0.0
120.4
0.0
0.0
73.5
436.3
13%
Total
49.7
679.0
1.9
0.0
0.0
3.8
436.2
208.4
0.0
27.4
1.2
0.0
623.4
0.0
0.0
380.7
1,732.9
53%
Residential
Coal
Petroleu
mProd
ucts
(total)
Natural gas
LNG
Rene
wables
Electricity
Total
Ratio of A
llSector
Gasoline
Nap
htha
Jet F
uel
Kerosen
eDiesel O
ilHeavy Oil
Lubricating
Oil
LPG
Petrol.
Hyd
roPe
trol. C
oke
0.0
46.8
0.0
0.0
0.0
0.0
0.0
0.0
0.0
46.8
0.0
0.0
0.3
0.0
0.0
192.9
240.0
7%
Commercial
Coal
Petroleu
mProd
ucts
(total)
Natural gas
LNG
Rene
wables
Electricity
Total
Ratio of A
llSector
Gasoline
Nap
htha
Jet F
uel
Kerosen
eDiesel O
ilHeavy Oil
Lubricating
Oil
LPG
Petrol.
Hyd
roPe
trol. C
oke
0.0
52.8
0.0
0.0
0.0
0.0
0.0
18.7
0.0
34.1
0.0
0.0
1.5
0.0
0.0
327.6
381.9
12%
Transport
Coal
Petroleu
mProd
ucts
(total)
Natural gas
LNG
Rene
wables
Electricity
Total
Ratio of A
llSector
Gasoline
Nap
htha
Jet F
uel
Kerosen
eDiesel O
ilHeavy Oil
Lubricating
Oil
LPG
Petrol.
Hyd
roPe
trol. C
oke
Passen
ger v
ehicle
0.0
322.8
200.0
0.0
0.0
0.0
122.8
0.0
0.0
0.0
0.0
0.0
2.2
0.0
0.0
0.0
325.0
10%
Motorcar
0.0
287.6
178.2
0.0
0.0
0.0
109.4
0.0
0.0
0.0
0.0
0.0
2.0
0.0
0.0
0.0
289.6
9%Motorcycle
0.0
35.2
21.8
0.0
0.0
0.0
13.4
0.0
0.0
0.0
0.0
0.0
0.2
0.0
0.0
0.0
35.4
1%Bu
s0.0
33.9
21.0
0.0
0.0
0.0
12.9
0.0
0.0
0.0
0.0
0.0
0.2
0.0
0.0
0.0
34.1
1%Ra
il0.0
0.0
0.0
0.0
0.0
0.0
0.0
0.0
0.0
0.0
0.0
0.0
0.0
0.0
0.0
0.1
0.1
0%Sh
ipAviation
Goo
ds veh
icle
0.0
568.3
352.1
0.0
0.0
0.0
216.2
0.0
0.0
0.0
0.0
0.0
3.9
0.0
0.0
0.0
572.1
17%
Rail
0.0
0.0
0.0
0.0
0.0
0.0
0.0
0.0
0.0
0.0
0.0
0.0
0.0
0.0
0.0
0.1
0.1
0%Sh
ipAviation
Total
0.0
925.0
573.1
0.0
0.0
0.0
351.8
0.0
0.0
0.0
0.0
0.0
6.3
0.0
0.0
0.2
931.4
28%
All Sector
49.7
1,703.6
575.0
0.0
0.0
3.8
788.1
227.1
0.0
108.3
1.2
0.0
631.6
0.0
0.0
901.4
3,286.2
100%
Non‐m
anufacturing
Man
ufacturing
Passenger
Freigh
t

29
29
IM IO table 2025 (Unit: mill.RM)
Agriculture
Mining
Food Productsand Bevarages
Chemicals andChemicalProducts
Electric andElectronicProducts and
FabricatedMetal Productsand Machinery
Other Non‐Metallic
Rubber andPlasticsProducts
Construction
Transportrelated
Wholesale andRetail
Tourism andHospitality
Professionaland Business
Medical andEducation
Other Services
Publicadministration
Totalintermediateinput
Privateconsumption
Governmentconsumption
Fixed capitalformation
Export
Import
Total finaldemand
Total use(domesticproduction)
Agriculture
504
010730
1305
1230
2574
1258
143
476803
585
118
023460
403
65540
‐19093
‐18085
5375
Mining
10
1785
6236
381
6718
454
07
033
025
08647
5154
‐8805
‐8647
0Fo
od Produ
cts an
d Be
varages
304
023368
2913
144
118
131
3714667
62163
4611
41623
958
28076
‐11941
17092
58715
Che
micals an
d Chemical Produ
cts
214
01592
11606
1923
1115
1335
2424
114
2196
343
114
439
972
21435
181
28066
‐12260
15987
37422
Electric and Electronic Prod
ucts and M
achine
330
114
33084
16626
445
404
648
5879
193
284
331556
453462
467
441
51930
‐44475
8364
61826
Fabricated M
etal Produ
cts an
d Machine
ry124
01059
1103
6835
14191
1179
266
2758
712
561
767
914
273
556
111
31408
871
1618
38826
‐24193
17123
48531
Other N
on‐M
etallic
500
1568
654
1507
729
5880
211
2571
28627
713
1241
263
260
4016341
1052
7118611
‐11411
8323
24664
Rubb
er and Plastics Prod
ucts
390
03462
2637
545
774
1789
1989
219
1369
898
610
266
59724
1515744
760
08915
‐6511
3164
18908
Con
struction
500
227
699
140
255
202
178
515
84762
529
266
177
415
404537
332098
6941
‐231
8841
13378
Tran
sport related
400
762
446
429
451
416
115
230
3531
1235
889
386
68321
169336
530
09
5714
‐3593
2660
11996
Who
lesale and Retail
177
01833
1827
4191
3912
1060
814
709
286
244
1910
376
152
408
1017908
157
129
40501
040787
58694
Tourism and H
ospitality
50
76101
113
9171
3774
694
2067
1000
326
81119
184874
1272
53340
054612
59486
Profession
al and Business
350
490
766
438
590
316
145
821
590
6173
5949
7184
719
1957
108
26283
2173
825
39654
‐19649
22265
48547
Med
ical and Edu
catio
n156
0711
699
349
324
160
310
116
180
2388
1297
1030
174
685
18580
319
875
1250
‐3242
‐797
7783
Other Services
290
1550
1106
533
703
539
351
135
282
2036
3508
1680
320
1391
4314207
1015
7311519
‐8818
3789
17996
Public adm
inistration
10
170
00
00
02
30
60
1020
601810
‐1063
748
807
Total intermed
iate in
put
2112
047449
26659
50120
40030
16358
15229
9391
7840
17261
39177
14225
2925
8688
440
297905
10195
2840
4590
333885
‐175286
526796
824701
Com
pensation of Employ
ee584
02994
2171
3434
2296
3313
687
2600
1862
8759
7597
8010
4539
1777
350
50974
Ope
ratin
g Su
rplus
2671
08089
8338
8171
5916
4849
2924
1289
2228
32186
12338
25511
288
7350
8122157
Other value add
ed8
0183
253
100
290
144
6898
65488
373
801
30181
93092
Total v
alue add
ed3264
011266
10763
11706
8501
8306
3679
3987
4156
41433
20309
34322
4857
9308
367
176224
Total inp
ut (d
omestic produ
ction)
5375
058715
37422
61826
48531
24664
18908
13378
11996
58694
59486
48547
7783
17996
807
474129
Industry
Coal
Petroleu
mProd
ucts
(total)
Natural gas
LNG
Renewables
Electricity
Total
Ratio of A
llSector
Gasoline
Nap
htha
Jet F
uel
Kerosene
Diesel O
ilHeavy Oil
Lubricating
Oil
LPG
Petrol.
Hyd
roPe
trol. C
oke
Agriculture
0.0
8.0
0.2
0.0
0.0
0.0
7.8
0.0
0.0
0.0
0.0
0.0
0.0
0.0
0.0
0.0
8.0
0%Mining
0.0
0.0
0.0
0.0
0.0
0.0
0.0
0.0
0.0
0.8
0.8
0.8
0.0
0.0
0.0
0.0
2.4
0%Con
struction
0.0
61.3
0.2
0.0
0.0
0.3
39.3
18.9
0.0
2.5
0.1
0.0
44.6
0.0
0.0
27.3
133.2
0.0
Food Produ
cts a
nd Bevarages
0.0
916.1
2.5
0.0
0.0
5.2
587.2
282.4
0.0
37.1
1.7
0.0
1,289.1
0.0
0.0
787.3
2,992.4
28%
Che
micals a
nd Che
mical Produ
cts
0.0
753.2
2.1
0.0
0.0
4.3
482.7
232.2
0.0
30.5
1.4
0.0
261.5
0.0
0.0
159.7
1,174.4
11%
Electric and Electronic Prod
ucts and M
achine
ry0.0
47.3
0.1
0.0
0.0
0.3
30.3
14.6
0.0
1.9
0.1
0.0
263.5
0.0
0.0
160.9
471.8
4%Fabricated M
etal Produ
cts an
d Machine
ry0.0
78.8
0.2
0.0
0.0
0.4
50.5
24.3
0.0
3.2
0.1
0.0
108.8
0.0
0.0
66.4
254.1
2%Other N
on‐M
etallic
227.8
142.5
0.4
0.0
0.0
0.8
91.3
43.9
0.0
5.8
0.3
0.0
107.9
0.0
0.0
65.9
544.0
5%Ru
bber and Plastics Prod
ucts
0.0
587.2
1.6
0.0
0.0
3.3
376.4
181.0
0.0
23.8
1.1
0.0
291.7
0.0
0.0
178.2
1,057.1
10%
Total
227.8
2,594.4
7.3
0.0
0.0
14.7
1,666.8
796.2
0.0
104.6
4.7
0.0
2,367.1
0.0
0.0
1,445.6
6,634.9
62%
Residential
Coal
Petroleu
mProd
ucts
(total)
Natural gas
LNG
Renewables
Electricity
Total
Ratio of A
llSector
Gasoline
Nap
htha
Jet F
uel
Kerosene
Diesel O
ilHeavy Oil
Lubricating
Oil
LPG
Petrol.
Hyd
roPe
trol. C
oke
0.0
212.9
0.0
0.0
0.0
0.0
0.0
0.0
0.0
212.9
0.0
0.0
1.4
0.0
0.0
876.7
1,091.0
10%
Commercial
Coal
Petroleu
mProd
ucts
(total)
Natural gas
LNG
Renewables
Electricity
Total
Ratio of A
llSector
Gasoline
Nap
htha
Jet F
uel
Kerosene
Diesel O
ilHeavy Oil
Lubricating
Oil
LPG
Petrol.
Hyd
roPe
trol. C
oke
0.0
135.2
0.0
0.0
0.0
0.0
0.0
47.9
0.0
87.2
0.0
0.0
3.9
0.0
0.0
839.0
978.1
9%
Transport
Coal
Petroleu
mProd
ucts
(total)
Natural gas
LNG
Renewables
Electricity
Total
Ratio of A
llSector
Gasoline
Nap
htha
Jet F
uel
Kerosene
Diesel O
ilHeavy Oil
Lubricating
Oil
LPG
Petrol.
Hyd
roPe
trol. C
oke
Passen
ger v
ehicle
0.0
567.9
351.9
0.0
0.0
0.0
216.0
0.0
0.0
0.0
0.0
0.0
3.9
0.0
0.0
0.0
571.8
5%Motorcar
0.0
526.4
326.2
0.0
0.0
0.0
200.2
0.0
0.0
0.0
0.0
0.0
3.6
0.0
0.0
0.0
530.0
5%Motorcycle
0.0
41.5
25.7
0.0
0.0
0.0
15.8
0.0
0.0
0.0
0.0
0.0
0.3
0.0
0.0
0.0
41.8
0%Bu
s0.0
17.5
10.8
0.0
0.0
0.0
6.6
0.0
0.0
0.0
0.0
0.0
0.1
0.0
0.0
0.0
17.6
0%Ra
il0.0
0.0
0.0
0.0
0.0
0.0
0.0
0.0
0.0
0.0
0.0
0.0
0.0
0.0
0.0
0.9
0.9
0%Sh
ipAviation
Goo
ds veh
icle
0.0
1,431.7
887.1
0.0
0.0
0.0
544.6
0.0
0.0
0.0
0.0
0.0
9.7
0.0
0.0
0.0
1,441.4
13%
Rail
0.0
0.0
0.0
0.0
0.0
0.0
0.0
0.0
0.0
0.0
0.0
0.0
0.0
0.0
0.0
0.2
0.2
0%Sh
ipAviation
Total
0.0
2,017.1
1,249.8
0.0
0.0
0.0
767.3
0.0
0.0
0.0
0.0
0.0
13.7
0.0
0.0
1.1
2,031.9
19%
All Sector
227.8
4,959.6
1,257.2
0.0
0.0
14.7
2,434.1
844.2
0.0
404.8
4.7
0.0
2,386.1
0.0
0.0
3,162.5
10,736.0
100%
Non‐m
anufacturing
Man
ufacturing
Passenger
Freigh
t
Energy balance table of IM
in 2025 BaU ( final demand sector ) (Unit: ktoe)

30
Industry
Coal
Petroleu
mProd
ucts
(total)
Natural gas
LNG
Renewables
Electricity
Total
Ratio of A
llSector
Gasoline
Nap
htha
Jet F
uel
Kerosene
Diesel O
ilHeavy Oil
Lubricating
Oil
LPG
Petrol.
Hyd
roPe
trol. C
oke
Agriculture
0.0
1.1
0.0
0.0
0.0
0.0
1.0
0.0
0.0
0.0
0.0
0.0
3.2
0.0
0.0
0.0
4.2
0%Mining
0.0
0.0
0.0
0.0
0.0
0.0
0.0
0.0
0.0
0.0
0.0
0.0
0.0
0.0
0.0
0.0
0.0
0%Con
struction
0.0
7.4
0.0
0.0
0.0
0.0
4.7
2.3
0.0
0.3
0.0
0.0
43.5
0.0
0.0
14.6
65.5
0.0
Food Produ
cts a
nd Bevarages
0.0
121.5
0.3
0.0
0.0
0.7
77.9
37.4
0.0
4.9
0.2
0.0
1,048.1
0.0
0.0
421.5
1,591.0
26%
Che
micals a
nd Che
mical Produ
cts
0.0
105.2
0.3
0.0
0.0
0.6
67.4
32.4
0.0
4.3
0.2
0.0
461.5
0.0
0.0
85.5
652.2
11%
Electric and Electronic Prod
ucts and M
achine
ry0.0
5.7
0.0
0.0
0.0
0.0
3.6
1.8
0.0
0.2
0.0
0.0
143.6
0.0
0.0
86.2
235.5
4%Fabricated M
etal Produ
cts an
d Machine
ry0.0
9.7
0.0
0.0
0.0
0.1
6.2
3.0
0.0
0.4
0.0
0.0
82.5
0.0
0.0
35.6
127.7
2%Other N
on‐M
etallic
99.8
17.2
0.0
0.0
0.0
0.1
11.0
5.3
0.0
0.7
0.0
0.0
103.5
0.0
0.0
35.3
255.7
4%Ru
bber and Plastics Prod
ucts
0.0
78.1
0.2
0.0
0.0
0.4
50.0
24.1
0.0
3.2
0.1
0.0
389.3
0.0
0.0
95.4
562.7
9%To
tal
99.8
345.6
1.0
0.0
0.0
2.0
222.1
106.1
0.0
13.9
0.6
0.0
2,275.2
0.0
0.0
773.9
3,494.5
57%
Residential
Coal
Petroleu
mProd
ucts
(total)
Natural gas
LNG
Renewables
Electricity
Total
Ratio of A
llSector
Gasoline
Nap
htha
Jet F
uel
Kerosene
Diesel O
ilHeavy Oil
Lubricating
Oil
LPG
Petrol.
Hyd
roPe
trol. C
oke
0.0
17.7
0.0
0.0
0.0
0.0
0.0
0.0
0.0
17.7
0.0
0.0
57.3
0.0
144.2
502.0
721.2
12%
Commercial
Coal
Petroleu
mProd
ucts
(total)
Natural gas
LNG
Renewables
Electricity
Total
Ratio of A
llSector
Gasoline
Nap
htha
Jet F
uel
Kerosene
Diesel O
ilHeavy Oil
Lubricating
Oil
LPG
Petrol.
Hyd
roPe
trol. C
oke
0.0
90.3
0.0
0.0
0.0
0.0
0.0
32.0
0.0
58.3
0.0
0.0
34.8
0.0
193.7
415.2
734.0
12%
Transport
Coal
Petroleu
mProd
ucts
(total)
Natural gas
LNG
Renewables
Electricity
Total
Ratio of A
llSector
Gasoline
Nap
htha
Jet F
uel
Kerosene
Diesel O
ilHeavy Oil
Lubricating
Oil
LPG
Petrol.
Hyd
roPe
trol. C
oke
Passen
ger v
ehicle
0.0
64.6
40.0
0.0
0.0
0.0
24.6
0.0
0.0
0.0
0.0
0.0
107.7
0.0
60.3
0.0
232.6
4%Motorcar
0.0
58.6
36.3
0.0
0.0
0.0
22.3
0.0
0.0
0.0
0.0
0.0
97.6
0.0
54.6
0.0
210.8
3%Motorcycle
0.0
6.1
3.8
0.0
0.0
0.0
2.3
0.0
0.0
0.0
0.0
0.0
10.1
0.0
5.7
0.0
21.8
0%Bu
s0.0
5.3
3.3
0.0
0.0
0.0
2.0
0.0
0.0
0.0
0.0
0.0
8.8
0.0
5.3
0.0
19.4
0%Ra
il0.0
0.0
0.0
0.0
0.0
0.0
0.0
0.0
0.0
0.0
0.0
0.0
0.0
0.0
0.0
0.8
0.8
0%Sh
ipAviation
Goo
ds veh
icle
0.0
255.3
158.2
0.0
0.0
0.0
97.1
0.0
0.0
0.0
0.0
0.0
425.5
0.0
236.4
0.0
917.2
15%
Rail
0.0
0.0
0.0
0.0
0.0
0.0
0.0
0.0
0.0
0.0
0.0
0.0
0.0
0.0
0.0
0.1
0.1
0%Sh
ipAviation
Total
0.0
325.2
201.5
0.0
0.0
0.0
123.7
0.0
0.0
0.0
0.0
0.0
542.0
0.0
302.0
0.9
1,170.2
19%
All Sector
99.8
778.9
202.5
0.0
0.0
2.0
345.8
138.1
0.0
89.9
0.6
0.0
2,909.3
0.0
639.9
1,692.0
6,119.8
100%
Non‐m
anufacturing
Man
ufacturing
Passenger
Freigh
t
Energy balance table of IM
in 2025 CM ( final demand sector ) (Unit: ktoe)

31 31
LOW CARBON REGION 2025
ISKANDAR MALYSIA
SPONSORED BY
VICE CHANCELLOR COUNCIL &
JAPAN SOCIETY FOR THE PROMOTION OF SCIENCE
GROUP VII: THE PLANNING OF URBAN ENERGY AND ENVIRONMENTAL SYSTEMS
MALAYSIA
HO Chin Siong (Universiti Teknologi Malaysia)
Supian Ahmad (Universiti Teknologi Malaysia)
Muhammad Zaly Shah Muhammad Hussein (Universiti Teknologi Malaysia)
CHAU Loon Wai (Universiti Teknologi Malaysia)
JAPAN
Yuzuru MATSUOKA (Kyoto University)
Gakuji KURATA (Kyoto University)
Takeshi FUJIWARA (Okayama University)
Koji SHIMADA (Ritsumeikan University)
Kei GOMI (Kyoto University)
Kohsuke YOSHIMOTO (Kyoto University)
Janice Jeevamalar Simson (Kyoto University)
January 2009

LOW‐CARBON CITY 2025
SUSTAINABLE ISKANDAR MALAYSIA Universiti Teknologi Malaysia Kyoto University Okayama University Ritsumeikan University
January 2009