maggi
TRANSCRIPT

A
PROJECT REPORT ON
“TO UNDERSTAND THE USAGE PATTERN AND COMSUMER ATTITUDE TOWARDS
TOMATO SAUCES WITH MAGGI SAUCES AS A PRODUCT”
SUBMITTED IN THE PARTIAL FULFILLMENT OF THE REQUIREMENT OF TWO-YEAR FULL TIME COURSE OF BACHELOR’S DEGREE IN BUSINESS
ADMINISTRATION
Under the guidance of SUBMITTED BY:-Prof. Manoj Arora Pratik VohraAssistant Professor of Business Administration Class Roll no: 1629
Gobindgarh Public College1

(Affiliated to Panjab University, Chandigarh)
CERTIFICATE
This is to certify that project entitled “TO UNDERSTAND THE USAGE PATTERN AND
COMSUMER ATTITUDE TOWARDS TOMATO SAUCES WITH MAGGI SAUCES AS A
PRODUCT” has been submitted to Punjab University, Chandigarh in the partial fulfillment of the
requirements for the degree of bachelor of business administration is a bonafide research work
carried out by PRATIK VOHRA under my supervision and that no part of his r project has been
submitted earlier to me.
The `assistance and help receiving during the course of investigation has been fully acknowledGED
Prof.
ACKNOWLEDGEMENT2
I am highly indebted to Prof Manoj Arora, for his valuable inputs at the various stages of the project
and for providing valuable advice in designing and implementing various research tools to collect
relevant data.
I am thankful to those individuals who gave in their precious time in filling the questionnaire and
providing their immense cooperation without which the project would not have been possible.
I am very grateful to Prof. Rishi kesh Mourya (HOD) for having given me an opportunity to undertake
this project.
Finally, I would like to state that the project not only fulfilled an academic requirement, but would also
help me in future endeavors in the years to come.
]
DECLARATION
3
I hereby declare that the project titled “TO UNDERSTAND THE USAGE PATTERN AND
COMSUMER ATTITUDE TOWARDS TOMATO SAUCES WITH MAGGI SAUCES AS A
PRODUCT” is an original piece of research work carried out by me under the guidance and
supervision of Mr. MANOJ ARORA. The information has been collected from genuine & authentic
sources. The work has been submitted in partial fulfillment of the requirement of bachelor of Business
Administration to Punjab University Chandigarh.
4
PREFACE As MICHEL DE MONTAIGNE observed: --
“There never was in the world two opinions alike, no more than two hairs or two grains; the
most universal quality is diversity.”
The nineties are a celebration of diversities. Its people differ not only in usual ways- by age & gender,
by race & nationality, by education & occupation, by marital status & living arrangements but also in
their activities, their preferences, purchases, opinions & attitudes.
So, with all of the diversity that surrounds us, the profusion of goods & services offered to us &
freedom of choice available to us, one may wonder how individual marketers actually reach us with
their highly specific marketing messages. The answer lies in the fact that in spite of the diversities
amongst us there are many similarities amongst us - constants that can be found amongst many people
of the world.
One of the few common denominators amongst all of us, despite our differences, is that above all we
are consumers & for the marketers it is important to recognize -- why and how individuals make
their consumption decisions and what attitudes they possess about a particular brand.
So, this research has been organized to explore the attitude & behavior of the consumers towards
Maggi Tomato Sauces as a whole & further through analysis, suggestions are given.
INDEX5
1 INTRODUCTION
2. PROJECT DESIGN
3. RESEARCH METHODOLOGY USED
4. DATA ANALYSIS
5. CONCLUSIONS AND SUGGESTIONS
6. SWOT ANALYSIS FOR MAGGI SAUCES
BIBLIOGRAPHY
ANNEXURE
6
EXECUTIVE SUMMARY
This project aims to describe the usage pattern, attitude & behavior of the consumers towards Tomato
based sauces with special emphasis on Maggi Tomato Sauce as a whole.
The project has the following Research Questions:
Image perception of the brand & the product.
Usage Pattern of consumers (in different income groups) towards Maggi Sauces.
Efficacy of advertising of Maggi Sauces.
Purchase Behavior of Consumers.
Brand Loyalty towards Maggi Sauces.
Identifying purchaser-user relationship.
Identifying the barriers to the purchase of Maggi Sauces.
An insight about other players in Tomato Sauce market.
The data for different regions is a primary one which is being collected by surveying 200-230
households in Khanna market that included the survey of various female households in
different localities.
The survey method comprises of a structured questionnaire which helps to analyze the above
mentioned objectives on the basis of this data collected from different areas.
7
HISTORY OF NESTLE
The history of Nestlé began in Switzerland in 1867 when Henri Nestlé, the pharmacist, launched his
product Farine Lactée Nestlé, a nutritious gruel for children. Henri used his surname, which means
‘little nest’, in both the company name and the logotype. The nest, which symbolizes security, family
and nourishment, still plays a central role in Nestlé’sprofile.
Since it began over 130 years ago, Nestlé’s success with product innovations and business acquisitions
has turned it into the largest Food Company in the world. As the years have passed, the Nestlé family
has grown to include chocolates, soups, coffee, cereals, frozen products, yogurts, mineral water and
other food products. Beginning in the 70s, Nestlé has continued to expand its product portfolio to
include pet foods, pharmaceutical products and cosmetics too.
Today, Nestlé markets a great number of products, all with one thing in common:
The high quality for which Nestlé has become renowned throughout the world.
1867- Henri Nestlé founded the company in Vevey, Switzerland.
1898-Nestlé purchases its first factory outside of Switzerland – Viking Melk factory in Norway.
1905- Nestlé merges with Anglo-Swiss Condensed Milk Company.
1929- Nestlé merges with Peter-Cailler-Kohler Chocolates Suisse’s S.A.
1938- Nestlé launches Nescafe – the world’s first instant coffee.
1947- Nestlé merges with Alimentana S.A. with the brand Maggi.
1962- Nestlé purchases Findus.
1974- Nestlé becomes a significant shareholder in the Cosmetics Company L’Oreal.
1977- Nestlé purchases Alcon, manufacturer of eye care products and kits.
8

1985- Nestlé purchases the Food Company Carnation.
1988- Nestlé purchases the confectionary company Rowntree Mackintosh and the pasta company
Buitoni-Perugina.
1992- Nestlé purchases the mineral water Company Perrier.
1998- Nestlé purchases Spillers pet foods business.
1999- Nestlé acquires Preparadosy Congelados Alimenticios LA, La Cocinera, which produces ready-
made frozen meals, pizzas, snacks and refrigerated products under the La Cocinera and Fricongel
brand names.
2000- Nestlé sells the Findus brand in all countries except for Italy and Switzerland.
2001- Nestlé merges with Ralston Purina, the premier pet food Company in North America, and with
unique expertise in the dry dog food area.
9

NESTLE IN INDIA:
Good Food, Good Life Since The Turn of The Century
NESTLE INDIA LIMITED
Nestle India Limited is a 51% subsidiary of Nestle S.A., Switzerland – a Company that can trace its
origins back to 1866. The original business of the Company was based on milk and dietetic foods for
children. Numerous other food products have since been added to the line: Chocolate, instant
beverages (the NESCAFE process was developed in 1938) culinary, refrigerated and frozen products,
ice cream, mineral water and pet foods to make Nestle the World Food Company of the 20th century
Nestle has been international from the very beginning with 509 factories today in 83 countries and
certain global brands such as NESCAFE available in over a 100 countries. Nestle is the most
multinational of all multinationals in every positive sense- only 2% of its turnover comes from the
local Swiss Company.
The Company is present in India with the following main brands
MILKMAID, EVERYDAY, CERELAC, NESTUM, LACTOGEN, NESTOGEN, MAGGI,
NESCAFE, NESCAFE SUNRISE, NESTEA, MILO, KITKAT, NESTLE CLASSIC, MILKY
BAR, CURNCH, ALLEN'S, POLO, NESTLE PURE MILK.
Local Sourcing Of Raw Materials: Nestle Factories in India
Nestle has been associated with India since the beginning of the century - importing and trading In
Condensed Milk and Infant Food. Manufacturing in India began in 1962, with the setting up of its First
factory at Moga, Punjab. Commissioned in 1992, the Samalkha Factory manufactures weaning cereals,
culinary products and milk products and water. Nestle does not own agricultural farms of in India, in
line with its international policy aimed at encouraging and benefiting the local farmer.
10

Nestlé’s first unit at Moga, Punjab, deals with manufacturing of milk products, infant milk food and
weaning cereals, culinary products and beverages. This factory has since involved into one of Nestlé’s
ten largest Factories worldwide. Nestle has since contributed to all strengthening of the Indian
industrial Infrastructure by setting up state-of-the-art factories in Cherambadi (TamilNadu),
Nanjangud (Karnataka), Ponda (Goa) and Bicholim (Goa).
The second factory at Choladi, Tamilnadu to produce beverages (tea) was set up in 1967. To part-
finance this project NIL went public in 1968. The third plant at Nanjangud, Karnataka, set up in 1989,
manufactures instant coffee and health beverages. Nestle India Manufactures Liquid Milk, Sweetened
Condensed Milk, Milk Powder, Dairy Whitener, Dessert Mixes, Weaning Cereals, Infant Milk
Formulae, Junior Foods, Noodles, Sauces, Soups, Super Seasoning, Pickles Instant Coffee, Tea,
Health Beverages, Chocolates, Confectionary, Wafers and Waffles.
The Company depends on locally produced raw materials to manufacture world class quality foods by
applying state-of-the- art manufacturing and processing technology. As a consequence, Nestle has not
only got the best out of natural resources in the region where it operates but has helped to upgrade the
quality and quantity of milk, coffee and coca available, for the economic benefit of the farmer as well
as the health and nutrition of the consumer.
A sterling example is the Nestle Agricultural Services contribution to the upliftment of the Moga Milk
District in Punjab over three and a half decades.
Environmentally Conscious Company:
Nestle India puts over a hundred thousand tonnes of food in the marketplace every Year, marking its
presence in most value added segments of the Indian food industry. Liquid Milk, Milk products, Infant
Milk Formulae, Weaning Cereals, Culinary Products, Instant Coffee, Tea, Health Beverages,
Chocolates and Confectionery, Wafers and Waffles.
Solid Base for the future such responsible corporate citizenship has created goodwill for the Company
in every community where it operates. Nestle plans to build on this and continue to play a leading role
in the Indian Food Industry. Given Nestle India’s past performance, Nestle S.A. is confident that it can
11
ably support Nestle India’s vision to reach a turnover of Rs. 10,000 Crores in the very first decade of
the 21st century.
12
Nestle India Limited – A Brief Profile
PAST & PRESENT
1959: On 28th March, the Company was incorporated at Khanna. The company was promoted by
Nestle Alimentana S.A. through a wholly owned subsidiary, Nestle Holdings Ltd., Nassau, Bahama
Islands.
1978: During the period 4, 00,114 equity shares and 382,751 existing equity shares held by Nestlé’s
Holdings, Ltd., Nassau, Bahama Islands (Nestle) were offered to the resident Indian nationals at a
premium of Rs. 2.50 per share.
1987: During the year installation of a new factory at Nanjangud (Karnataka), for the manufacture of
instant coffee was in progress.
1989: The name of the company was changed from `Food Specialties Ltd.' to `Nestle India Ltd.'
on 24th March.
1990: During the year company entered into chocolate business by introducing Nestle premium
chocolates.
1993: Samalkha factory was commissioned during the year and underwent expansion for cereal based
products.
1994: During the year company launched a number of new products viz., Cerelac Soya, Milk maid,
Dessert Mixes, Maggo Tonit's Special Cooking Bases, Maggi 1-2-3 noodles, Contadina snack dressing
and the chocolate items, milky base marbles and bar one peanut. And also launched Bonus and Polo.
1995: During the year company commenced construction of a new factory at Bicholim, Goa. At the
same year, instant noodles factory was installed and commissioned at
Samalkha factory. - During the year company launched Kit Kat manufactures at the new factory at
Ponda, Goa.
13
- During the same year the Nanjangud factory was commissioned and the unit was to manufacture
MILO - the World's Largest Selling Chocolate energy food drink.
- The Chennai-based Indian Food Fermentations tied up with Nestle India Ltd., to market its Dosa and
vada batter in consumer pack, in the country. The company has signed an agreement to this effect
recently. Nestle would sell the ready-to-use dosa, vada, sambhar and unique masala dosa batter in
consumer packs, under its own brand name in the country.
1996: During the year company launched MILO-Chocolate energy food drink in South India and a
range of culinary products like, Dosa and Sambhar mixes, pickles and new varieties of soups under the
brand "Maggi".
1997: NIL is one of the top players in the processed food & beverages industry and the largest
producer of instant coffee with a 49 per cent market share.
- After the success of Kit Kat and Polo, Nestle India had launched its first product in the hard boiled
sugar confectionery market, Allen's Splash.
- Nestlé’s wafer chocolate brand, Kit Kat, which created a major dent in the market with its launch, its
international milk drink brand Milo had garnered a mere three per cent share (value terms) in the Rs
500 crore market, a year after its launch in India.
- Nestle India Ltd. (NIL) leads the list of the country's top 15 coffee exporters for the ongoing calendar
year in terms of both quantum and value for the period January 1 - October 23.
1998: Nestle SA and the BM Khaitan group set up a joint venture, Nutritional Food Products India
Ltd, in 1990, which was amalgamated with NIL in 1993.
- Nestle had set up a parallel distribution network across the country.
1999: The Company has also set up a special cold chain for product distribution in select retail outlets.
- Nestle India entered into a 10-year agreement with Campco in February, 1990 for manufacture and
supply of bulk quantity of chocolates and cocoa products.
2000: Nestle entered the domestic bottled water business and launched the product under the brand
name `Pure Life'.
14

- The Company launched its ultra heat treated liquid milk, `Nestle Pure Milk', in Bangalore, Chennai,
Hyderabad and Kochi.
- The Company launched Perrier and celebrated "Perrier Invitation Golf-2000".
- Nestle India Ltd. launched Nescafe Gold and Nescafe Gold Decaffeinated.
- Nestle India launched a range of gift packs under the Fox confectionery brand name for the festival
seasons.
The Company launched its second premium mineral water brand ‘San Pellegrino’ in India.
2001: Nestle India Ltd. launched `Pure Life', its mass-market bottled water, adding one more premium
brand to the already saturated Rs 600-crore bottled water segment.
- Nestle Bar-One was relaunched after renovating it to make it smoother, creamier and better meets
consumer needs.
2002: Nestle Group increased its holding in Nestle India to 53.27%
-Tied up with Nilgiris to co-brand various dairy products like dahi, paneer, ghee and possibly milk
-Launched a throat lozenge branded Acti-V to compete against Procter & Gamble's Vicks cough
drops.
-Regained top coffee exporter position in India.
2003: Rolled out Nestle Development Nutrition Plan for infant weaning and launched its infant food
CERELAC 123 as a range of products graded to the needs of infants in each stage of the plan
-Nestle SA, Switzerland, buys 1.01 million shares in its Indian arm 'Nestle India'. With this purchase,
the parent holding in its Indian arm goes up to 59.8 per cent from 58.7 per cent
-Signed a 100 per cent buyback pact with Bengal Nestor's India Ltd (BNIL) for its ultra heat treated
milk and other dairy products.
2004: Nestle India bags Tetra Pak's annual dairy and beverage industry award.
15

Products/Projects/Important Brands:
Soluble coffee: Nescafe, Taster's Choice, Ricoré, Ricoffy
Roast & ground coffee: Nespresso, Bonka, Zoë gas, and Loumidis
Water: Nestlé Pure Life, Nestlé Aquarel, Perrier, Vittel, Contrex, S. Pellegrino, Valvert, Panna,
Levissima, Vera, First Bismarck, Viladrau, Arrowhead, Poland Spring, Zephyrhills, Santa Maria, La
Vie
Other beverages: Nestea, Nesquik, Nescau, Milo, Carnation, Libby's, Caro
Dairy products (shelf stable): Nestlé, Nido, Nespray, Ninho, Carnation, Milkmaid, La Lechera,
Moça, Klim, Gloria, Svelty, Molico, Nestlé Omega Plus, Bear Band, Coffee-mate / (chilled): Nestlé,
LC1, Chamyto, La Laitière, Sveltesse, Yoco, Svelty, Molico
Breakfast cereals: Nestlé
Infant foods: Nestlé, Nan, Lactogen, Beba, Nestogen, Cérélac, Neslac, Nestum, Guigoz
Performance nutrition: Power Bar
Clinical nutrition: Nutren, Peptamen, Modulen, Build-up, Nesvita
Culinary products (bouillons, soups, seasonings, prepared dishes, canned food, pasta, sauces):
Maggi, Buitoni, Crosse & Blackwell, Libby's, Thomy, Winiary
Frozen foods: Magi, Buitoni, Stouffer's
Ice cream: Nestlé, Frisco, Motta, Camy, Savory, Peters
Refrigerated products (yogurts, desserts, pasta, sauces): Nestlé, Buitoni, Herta
16

Chocolate and confectionery: Nestlé, Crunch, Cailler, Galak/Milkybar, Kit Kat, Quality Street,
Smarties, Baci, After Eight, Baby Ruth, Butterfinger, Lion, Aero, Polo, Fruitips, etc.
Food Services and professional products: Chef, Davigel, Minor's, Santa Rica
Pet care: Friskies, Fancy Feast, Alpo, Mighty Dog, Gourmet, Mon Petit, Felix
Flavours for the food industry: Food Ingredients Specialties’ (FIS)
Pharmaceutical products: Alcon, Galderma
Cosmetics: L’Oreal (Nestle owns 49% of Gesparal, an investment vehicle 51% owned by the French
Bettencourt family, headed by Liliane Bettencourt. Gesparal in turn owns 53.7% of L'Oreal, with the
rest quoted on the Paris Bourse.)
17

Financial Results and Operations
Nestle India Limited June 06, 2009
Domestic sales growth sustained
Nestle India's domestic sales have grown at a steady pace right through 2008 in the face of difficult
trading conditions. This proves yet again Nestlé’s portfolio's diversity and its resilience to withstand
cyclical shocks. It also demonstrates the strength of its brands, which have not faced the kind of
onslaught from regional low-priced players that have proliferated. Domestic sales in the last five years
have grown at a CAGR of 8.3%, which is commendable indeed.
Sales growth in CY08 was driven chiefly by 26.7% growth in prepared dishes and cooking aids and
22% jump in chocolate sales. The former category includes the Maggi range of culinary foods. Nestle
innovated substantially here to launch small pack sizes to stimulate trials and consumption.
Its Nescafe coffee was made available in a unique 'redimix' sachet form, which has fared very well.
The premium bottled water brand Pure Life has performed below its expectations and a full review of
the business is underway. The chocolates and confectionery segment grew on the back of the excellent
innovations like Chocó stick and Milky bar Choo, both low priced offerings that have become a hit
with children.
Sales Value Growth (Rs.)
Sales CY03 CY05 CY06 CY07 CY08 CY09Net Sales 15379.0 14671.0
15848.0 18268.0 18268.0 20950.0
% growth 11.9% -4.6% 8.0% 15.3% 6.6% 7.5%Exports 3670.0 2283.0 2655.0 3099.0 2362.0 2011.0
% growth 15.8% -37.8% 16.3% 16.7% -23.8% -14.9%
Domestic 13156.0 13156.0 14119.0 16111.0 18115.0 20144.0
%growth 18.7% 0.0% 7.3% 14.1% 12.4% 11.2%
18
Sales Volume Growth
Category CY06 CY07 CY08 CY09Milk products
-10.9% 9.4% 11.7% 7.0%
Other food
-42.4% 13.5% 9.8% 8.0%
Soluble beverage powders
12.4% 31.6% -6.9% 7.0%
Prepared dishes & cooking aids
n.a. 19.7% 26.7% 12.8%
Chocolate & confectionery
n.a. 21.5% 22.0% 9.7%
In the milk products category, Nestlé's UHT Milk fared well. Nestle has extended into other milk
products such as ready-to-drink flavored milk, plain and fruit-flavored yogurt and butter. Nestlé's milk
product portfolio now truly looks well placed to challenge the likes of Britannia and Amul nationally.
In the year 2008 too, Nestlé's value-added milk products showed increased contribution, while
innovations like Chocostick and Milky Bar Choo as well as the renewed aggression in other brands
like Munch showed sustain growth in these categories. The coffee franchise too showed growth as
price cuts stimulate demand and a life-style shift towards drinking coffee in urban India augurs well
for coffee consumption and showed up sustained volume growth secularly.
19
Strategic Achievements
Nestle has succeeded in emulating the success of other FMCG products into its portfolio, of offering
small pack-sizes and convenience of use as a USP at very affordable prices. This strategy has been
cast across product categories such as soups, coffee, flavored milk and chocolates.
To improve penetration and availability, it pushed the 'out-of-home' channel of sales of products like
Nestea, Nescafe Frappe, Italian Tomato Sauce mix, Maggi Hot Cup soups, and Nescafe vending
machines were the chief products driven through this channel. Much of the strong volume growth seen
in these categories is attributable to this change
in tack. According to company sources, Nestlé's early successes with its brand extensions and new
delivery channels will lead to sustained growth in the years to come.
Exports
Exports have tended to sputter last year and the performance in Q1CY09 is also not encouraging
enough to believe that Nestle wishes to turn things around. One of the chief causes for the decline in
exports is the 7.4% drop in sales volume. This was on account of
Discontinuation of tea exports and a higher base in CY08. Lower realization in instant coffee exports
to Russia (roughly three-fourth of its exports) on account of lower coffee prices also impacted sales
negatively.
20

Benign raw material prices help, but for how long?
Nestle has benefited from benign raw material prices for the last few years. Observe that milk, (42% of
commodity material costs for Nestle) has seen prices decline by close to 10% in the last four years.
Green coffee, which is 12% of such costs, is down 60% in the same period, while other important
products like sugar and wheat flour are also down between 1% to 7%.Milk prices are apparently
already up this year and we suspect that commodities like coffee and cocoa may have seen their lows
in 2008.
The first quarter results reflect inflationary pressures straight away on the raw material front.
Marketing and distribution costs under check
Nestlé's advertising costs have moved down by 100 basis points in the last two years as a percentage
of sales while freight & distribution costs are down 70 basis points. S & D costs account for 13-14%
of net sales in the same period. Since these have remained flat in absolute terms in the last three years,
even as sales have grown by 23%, the accretion to the bottomline is about Rs.160mn in two years just
on this count. Continuous investment in IT infrastructure, supply chain efficiencies and optimum
logistics management has aided the company.
21
Selling & Distribution costs
Particulars CY06 CY07 CY08 CY09A & P costs
8.3% 8.7% 7.9% 7.7%
Freight & Distr. Costs
5.5% 5.7% 5.1% 5.0%
Total S & D costs
13.8% 14.5% 13.0% 12.7%
Capital efficiency remains exemplary
Nestlé's return ratios speak for themselves. The company has been able to grow the RoCE and RoEs
even from present high levels owing to continuing contraction of its balance sheet size. Sharp
reduction in working capital, low capital expenditures in relation to the growth in sales in the last three
years, has seen Nestlé's ROE almost double to 90% from an already healthy 43% in CY03. Since
Nestle provides perhaps excessively and aggressively for contingencies and write-offs, we believe the
net profit and PBIT before exceptional would offer true representation.
Ratios CY06 CY07 CY08 CY09RoE # 43.3% 58.7% 72.6% 89.7%RoCE 52.6% 72.0% 70.9% 107.2%Dividend payout # 0.9 1.3 0.9 0.9PBIT Margin 14.4% 15.6% 15.7% 19.4%
Capital Expenditure22

Nestlé's annual capital expenditure has averaged Rs.420mn in the last five years (CY03-09), which is
lower than what it spent in the previous five years. (Rs.680mn). Since capacity utilization figures are
not available category-wise, it is difficult to get a fix on it. However, when viewed in light of the 27%
growth in sales in the last five years it does appear that Nestle would need to spend slightly more on
capex in the next three years. An indication to that effect may come from a slightly lower or flattened
dividend payout in this period.
Valuations
Nestle trades at the top end of the valuation range among peer group stocks. Further, the parents'
sporadic but regulated buy-back of the Indian subsidiary's stock each year has meant that the stock has
been well-supported by fundamental and technical factors. Given the obvious merits of its business,
the exemplary performance ratios and its resilience to the slow-down in the FMCG sector, impart high
durability, greater visibility and less volatility to its earnings and it is indeed worthy of its premium
valuations. Nestlé’s sales are targeted to grow by 7.5% in CY08 (taking into consideration some
inflationary pressures on raw materials and hence allowed margin expansion of just 60 basis points).
However this should be enough for the gross profit to grow by 23% and net profits before exceptionals
to rise by 27%. Nestlé’s EPS would rise to Rs.30.10.
23

ABOUT THE BRAND
What exactly a brand is?
The brand is defined as a ‘name, term, sign, symbol, or design, or a combination of them, intended to
identify the goods or services of one seller or group of sellers and to differentiate them from those of
the competitors’.
In essence, a brand identifies the seller or maker. It can be a name, trademark, logo, or other symbol. It
is essentially a seller’s promise to deliver a specific set of features, benefits, and services consistently
to the buyers.
A Brand conveys upto six levels of meaning:-
Attributes
Benefits(functional and emotional benefits)
Values
Culture
Personality
User
Brand is basically a market term, a major selling tool & is one of the essential and most important
components of the total product personality. A brand name not only facilitates advertising and
promotion but also functions as demand stimulant.
Nowadays consumers have become extremely brand conscious and this may be attributed to the
intensive brand promotion undertaken by the marketers.
Nowadays when one goes in the market to buy Tomato Sauces, he/she would not ask for just one
tomato sauce but over the years due to the impact of the image created about the particular brand in the
mind of the consumers, they insist for the particular brand say Maggi, Kissan
Heinz, etc.
24

Thus it is the image associated with the particular brand, in a way decides the success of the whole
gamut of the marketing and promotional efforts done by the company, as it helps in creating brand
loyality towards a brand.
So, a good brand name should be distinctive, easy to pronounce, recognize and remember. Above all it
should be appealing.
MAGGI – A BRAND DESCRIPTION
HISTORY OF MAGGI
ACHIEVEMENTS
MAGGI has become a household name in Singapore, synonymous with quality food as well as being a
leading culinary expert, boasting cooking aids that provide invaluable help to housewives in whipping
up tasty and convenient meal solutions for their families. Most have grown up with fond memories of
MAGGI 2-Minute Noodles. In fact, many can still recall the MAGGI 2-Minute Noodles commercial
on television years ago that depicted two school children running home to enjoy a bowl of scrumptious
MAGGI noodles. The jingle is still embedded deep in the minds of consumers -”Fast to cook, good to
eat” and has made MAGGI noodles a must for every home.
With the regional R&D Centre in Singapore focusing on development of Asian cuisine, MAGGI’s
portfolio of products can be developed at a faster pace to suit the needs of consumers. The MAGGI
range of products has evolved from noodles and sauces to include cooking aids and recipe mixes to
cater to the changing lifestyles of Singaporeans. These include products which are nutritious for health
conscious Singaporeans.
25

HISTORY
Over a century ago, back in 1884, a genius called Julius Maggi invented a powdered pea and bean
soup, to provide nutritious, easy to prepare food for busy women who worked in factories and didn’t
have time to prepare healthy meals. This product was able to provide much needed nutrition for the
people. Julius Maggi followed this first MAGGI product two years later with the invention of ready-
to-use soups and liquid seasoning. Then Julius Maggi perfected bouillon concentrates, first in
capsules, followed by cubes.
Since then, the MAGGI range has extended substantially. In Singapore, the first products produced
were MAGGI Tomato Ketchup and Chilli Sauce, launched in 1969. This was followed two years
later with the popular MAGGI 2-Minute Noodles. Today, these three products are the market leaders
in their respective categories.
26

THE PRODUCT
MAGGI offers a total experience in culinary delights to consumers - with authentic tasting products,
which are of the highest quality. The extensive MAGGI range includes MAGGI Noodles,
Bouillon/Chicken Stock in powder and liquid, Dipping and Cooking Sauces, Cooking Aids and Recipe
Mixes.
In the bag noodles segment, MAGGI dominates, enjoying a high penetration rate of 77 percent
in homes of Singaporeans while in the sauces category, MAGGI has almost 50 percent market
share.
The MAGGI Recipe Mixes include the MAGGI “Hari Hari Favorites” range which enables busy
adults and working mothers of today to cook up a mouth-watering feast of timeless culinary classics.
The variety of recipe mixes offered within the range is the ideal solution to creating authentic Malay
and Chinese favourites with ease and convenience.
In this way, MAGGI has also helped preserve the culinary heritage of traditional cuisine for people
to cook these dishes in their own homes any day of the week.
27

RECENT DEVELOPMENTSIn 2002, MAGGI’s presence in the noodles category was strengthened by the launch of MAGGI Hot
Bowl Noodles and MAGGI Famous Cup Noodles to meet the increased demand for convenience.
MAGGI also caters to new trends with its range of vegetarian products - MAGGI 2-Minutes Noodles
in Vegetarian flavor and MAGGI Shiitake Mushroom Oyster Flavored Sauce. In the premium sauces
category, MAGGI launched the delicious MAGGI Thai Chilli Sauce and MAGGI Paste Mixes.
Another area of product portfolio expansion is the cooking aids segment, a growing segment relevant
to needs of today’s busy Singaporeans.
MAGGI is the first in the recipe mixes category in Singapore to obtain the Healthier Choice Symbol,
awarded by the Singapore Health Promotion Board. It boasts four tasty flavours; Sweet & Sour Fish,
Chilli Prawn, Braised Chicken Mushroom and Black Pepper Beef.
28
PROMOTION
In 2002, MAGGI was an exhibitor at Food Expo, a major consumer of products from local food
companies or companies with local/Asian food offerings.
This event also served as a launch pad for MAGGI Hot Bowl Noodles, generating high trial and
awareness. MAGGI does both wet and dry sampling at high traffic outlets and locations using affinity
group targeting, especially for new products to drive awareness and trial e.g. sampling of MAGGI Hot
Bowl Noodles to tertiary students in hostels. Secondary schools are not left out – MAGGI sponsors
home economics classes and cooking competitions.
The objective is to teach students to prepare simple, yet tasty and nutritious meals at home. The
themes and recipes are carefully selected to ensure relevance to the needs of the various participants.
Recipe cards are produced and distributed during these sessions for easy reference, while MAGGI
sampling packs are given away after the sessions for participants to whip up some MAGGI magic at
home.
BRAND VALUES
MAGGI offers consumers simple solutions for today’s consumers who are under various pressures
such as time, budget, declining traditional cooking skills and the constant search for variety. The
MAGGI range has established a reliable bond with consumers by giving ideas and advice that makes it
easier to provide interesting meals. MAGGI products make providing tasty and interesting meals
simple and easy. They make food more of an enjoyable sensory experience.
29

THINGS YOU DIDN’T KNOW ABOUT MAGGI
• The MAGGI brand is over 100 years old and is recognized worldwide for its culinary range of
products.
• The MAGGI brand traces its roots all the way back to Switzerland in 1836. In 1947, the MAGGI
Company merged with Nestlé. Nestlé strengthened the distribution and financial base of MAGGI
and enabled it to become a leading world food brand.
• The first product that Julius Maggi launched was MAGGI’S Leguminous Flour and then MAGGI
Seasoning, which is still available today.
• MAGGI’s presence in the noodles category was strengthened by the 2002 launch of MAGGI Hot
Bowl Noodles and MAGGI Famous Cup Noodles. MAGGI revitalized this segment with the
introduction of exciting, authentic local flavours adding a clean, springy bite to the product.
30

MAGGI SAUCE– A BRIEF BRAND PROFILE
Maggi sauces manufactured by NESTLE INDIA LTD were launched in October 1985 and created
consumer history. For the first time, a food product was launched nationally across 300 countries.
Maggi sauces are available in 4 flavours:-
Maggi Tomato ketchup launched in 1985.
Maggi Hot n Sweet launched in 1985.
Maggi Chilli Garlic launched in 1986.
Maggi Masala Chilli launched in 1987.
Maggi Sauces are available in the following packings and with the following Price points:-
200g --25/- for penetration
600g -- 57/- is the core grammage a house wife ends us buying
1.2 kg --89/- for consumers to upgrade from 600g to 1.2kg at less than double the price
10g-- 2/- for penetration (Economy pack and the sachet)
31
MARKET CHARACTERISITCS
MAJOR PLAYERS & PERFORMANCE TRENDS
RED HOT! THE KETCHUP WAR GETS SAUCIER
“India is primarily a dip-consuming nation, be it curd with parathas or chutney with dosas’.” The shift
from home-made dips to tomato ketchup in urban households appears to be a natural process. Urban
and semi-urban households are also showing a trend towards a breakfast habit of eggs, hence
augmenting the demand for ketchup (to be consumed along with the eggs).
According to research carried out by HLL, there is an increased usage of ketchup by younger adults
and teenagers -- and not just children -- both at home and outside.
The action in the Rs 1 billion tomato ketchup market in India is getting redder, hotter, and sweeter.
The Rs 250-crore category is currently dominated by multinationals like Nestle, HLL and Heinz.
While Nestle, HLL and Heinz are present in the Rs 120-crore ketchup category through their
brands Maggi, Kissan and Heinz respectively, HLL's Kissan is the only dominant branded player in
the Rs 100-crore jams’ category.
The tomato ketchup segment is currently witnessing a robust 20 to 25 per cent growth. Pegged to
see a 40 per cent growth over the next five years, the approximate size of the purees, jams and
sauces market in 2005 is projected at Rs 10 billion.
According to the new relief, all food preparations based on fruits and vegetables are exempt from
excise duty making wide range of products of common use like pickles, sauces, ketchup and juices
cheaper.
Even the rural markets are not left untouched. After years of growth derived primarily from the urban
markets, the FMCG companies have now realized that India lies in its rural villages. So much so that
32

rural marketing has become the latest marketing mantra of most FMCG majors. With extensive
competition not only from MNCs but also from the numerous regional players and the lure of an
untapped market has driven the marketers to chalk out bold new strategies for targeting the rural
consumer in a big way.
FACTORS IMPACTING DEMAND
Demand for sauces is affected by a number of different factors. In the mayonnaise and sauce markets,
consumption and pricing of certain meats, chips, and vegetables influence manufacturers’ sales. The
state of the overall economy, which determines how much money consumers have in their wallets,
also has a significant impact on demand for dressings and sauces, in more ways than one. Economic
trends will not only dictate how much consumers can spend when shopping for their weekly groceries,
but also how often consumers will visit fast food and other restaurants.
33

MAJOR PLAYERS IN SAUCE INDUSTRY
The companies that will be cooking up new recipes of growth include Hindustan Lever (HLL),
Nestle, Heinz and Nafed among others. Another player that has made a high impact in the sauces
segment is Tops Foods, which sells products such as pickles and sauces under the Tops brand.
Volfarm, a known and established name in this sector has been slowly wiped out after the introduction
of these new entrants in the particular segment.
HLL has increasingly made its Kissan tomato ketchup portfolio ethnic with variants like Kissan
Tomato Pudina, Kissan Tomchi, Kissan Tom-Imli and others, while competitor Nestlé’s Maggi tomato
ketchup has variants in chilli-garlic and hot-n-sweet.
34

COMPETITION – PERFORMANCE TRENDS
According to an extensive retail audit conducted by Samsika for the organised ketchup market in July
1997, Maggi ketchups had a 53 per cent market share in Bombay, of which the plain ketchup (200 gm,
600 gm, 1,200 gm pack sizes) accounted for 36.5 per cent, the rest being with Maggi Hot & Sweet
(200 gm and 600 gm). (Nestle, claims a whopping 85 per cent market share in the Maggi Noodles
category).
KISSAN
HLL‘s Kissan, with all its variants, has a 48 per cent market share nationally, both in terms of
volume and value. HLL, however, puts the national volume at 17,000 tonnes
MAGGI
Nestle, for its part, claims a 53 per cent national share in what it says is the 13,000-tonne market.
HEINZ
In the tomato ketchup Foodservice market, Heinz holds a European market share of 30 to 45%. With
38,600 employees, the multinational operates 200 plants globally. The company’s products are
organized into six core businesses and among these ketchup, sauces, and condiments comprise of 27%
of fiscal year 2001 sales.
Ketchup and Condiments: - Ketchup has always been the company’s “flagship” brand. With global
ketchup sales in excess of $1.3 billion, Heinz has over 50% of the
domestic ketchup market and approximately 34% of the global market. However, Heinz ketchup
faces challenges from other brand name ketchups, private label ketchups, and salsa. The increased
35

popularity of salsa and other ethnic condiments as well as the lower cost structures for private label
brands will threaten Heinz’s market share.
Tops, the Rs 15-crore company has a wide range of products ranging from 21 varieties of pickles to
jams, Chinese traditional noodles to juices and ketchups. We expect to double our growth figures this
year and aim at targeting about 20 per cent share of the Rs 250-crore jams and ketchup market.” The
company aspires to reach a target of Rs 100 crore by 2006 and is all out to focus entirely on the huge
domestic market.
36
BRAND POSITIONING STRATEGY
According To Rosse Reaves
“Positioning is the art of selecting out a number of unique selling propositions, the one which
will get maximum sales.”
According Philips Kotler
“Market Positioning is arranging for a product to occupy a clear, distinctive and desirable place
in the market and in the minds of target customer.”
Thus, basic components of positioning can be referred to as:-
(1) Product class or the structure of the market in which the brand will compete.
(2) Consumer Segmentation
(3) Consumer Perception of Brand in relation to competitors.
37

STRATEGY STATEMENT OF MAGGI SAUCES
TARGET MARKET: Upscale household (income 2500+) with particular emphasis on children.
POSITIONING PRODUCT LINE:
KETCHUP - : A Tasty, High Quality ketchup which goes best with all eats.
HOT AND SWEET, CHIILLI GARLIC, MASALA CHILLI: -
Uniquely spiced ketchup to suit the adult palate.
PRICE: At par with competitive brands.
DISTRIBUTION OUTLETS: All towns and all types of outlets both in urban and rural areas.
COMMUNICATION STRATEGY: Chahiye Yahi Chahiye is the last theme commercial run last
year on TV. Strategy is to raise preference for the brand vis a vis competition.
PROMOTION STRATEGY: Target kids via promos like water bottle, Tiffin pack or do value
promos including noodles free, extra grammage or price offs (5 or 10/- off on packs) for the
housewife.
RESEARCH & DEVELOPMENT: Done Internationally.
38

OBJECTIVES OF THE STUDY
PROJECT AIM:
To understand the usage patterns and attitudes of the consumers towards the
Tomato based Sauces product category with focus on MAGGI SAUCES.
Objectives of the Study:
The present study was undertaken to describe the following objectives:--
1) To have a better understanding of the consumer attitude and behavior towards Maggi
Sauces.
2) To study the influence of Price, Quality, Availability, Promotional Schemes on the
purchase behavior of the consumers.
3) To study the image perception of the consumer towards Maggi Sauces.
4) To explore the impact of physical attribute of the Maggi Sauces on the
Consumer.
39
Scope Of The Study
This study is conducted by the method of field survey of the females in the different zones, in the
Khanna market.
Since this study enables to discover the usage pattern and attitude of the consumers in the Khanna
market towards the Maggi Tomato Sauces, this is basically an exploratory, conclusive kind of a study.
40
Limitations Of The Study:
As the questionnaire was quite comprehensive so respondents were often complaining that it
was taking a lot of time.
Time constraint because of which sample size has been restricted to just 200-250.
The study surrounded the Khanna city only.
The respondents were not ready to tell their actual income
The individuals were not ready to fill questionnaire due to lack of time
41
Sampling Unit
The universe for this project was Khanna city. The decision to have number of samples/ respondents
had to be decided keeping in mind the following factors:--
The time available.
The objectives which are to be fulfilled through this study.
The type of target customers for research.
The respondents were selected randomly for the study purpose.
Data Collection
In this research, Primary data is collected by administering questionnaire to the respondents. The
consumer survey is conducted by calling upon the respondents door to door in all areas, in which the
survey is to be conducted.
Thus, a thorough field survey is done in this research study.
Sample Size
Keeping in mind the above stated factors; the sample size was kept between 200-230 respondents and
in order to have proper representation of the sample the 14 localities are chosen from khanna city, in
which survey is to be conducted. Out of this, around 200 responses have been used in the final
analysis.
42
RESEARCH METHODOLOGY
The research was carried out in two phases:--
DATA COLLECTION: The first phase comprises of designing the instrument, i.e., designing the Questionnaire.
DESIGNING THE QUESTIONNAIRE
The decision about the format of the questionnaire was very important and crucial since it has to fulfill
all the research objectives, so that all the questions and problems are answered and at the same time
tabulation and analysis should be easier and subjective bias should be eliminated.
Following criteria was kept in mind while designing the questionnaire:--
1) The information sought should be clear and precise.
2) Use of multiple choice or five point ranking questions were used in the questionnaire, so that it is
easy to administer and less time consuming.
3) The wording of the questions was kept simple so that both researcher and the respondent can
understand easily.
4) The use of open ended questions along with the close ended questions were also introduced to have
the complete in-depth study of the consumer attitude can be made to the extent possible.
5) Proper scope has been provided in the questionnaire for the quantification of the results.
6) The time factor was also very important since the research has to be done in the stipulated time
along with the tabulation and analysis of the results.
43

The questionnaire, which is used to conduct research, is a structured, non-disguised type of
questionnaire.
Advantages of using structured, non-disguised questionnaires are:-
It helps in gathering relevant information.
It can be administered easily.
The precise and specific information is collected.
44

DATA - ANALYSIS
Profile of the respondents:-
Females in different age groups
Using Tomato based sauces having individual preferences for:-
Branded Sauces
Unbranded Sauces (brought from the market)
Unbranded Sauces (Home Made)
(I) USAGE PATTERN FOR SAUCES :-
1. TOMATO SAUCE USERS:-
Sample Size:-200
(a) Percentage of customers using Tomato Based Sauces at their homes: - 100%
(b) Percentage of customers using only Branded Tomato based Sauces: - 98%
(c) Percentage of customers using Unbranded Tomato based Sauces: - 5.5%
(d) Percentage of customers using Branded and Unbranded Sauces: - 23.5%
(e) Percentage of customers using Home- Made Sauces: - 50%
45

(II) REASONS FOR USING HOME-MADE SAUCES
5.50%
22%
6.50%
1%
0% 5% 10% 15% 20% 25%
Relative Percentage of respondents
Cheaper
Hygeine
Taste
Others
Rea
son
s
Why Home-Made Sauces
Out of 200 respondents, only 50 households prefer Home- Made sauces because they are more
hygienic as compared to the ones available in the market.
Duration Of Making Home-Made Sauces
18%
62%
8%
10%
2%
26%
0% 10% 20% 30% 40% 50% 60% 70%
Once in 6 months
Occasion
Weekends
Seasonal
Branded not available
Depend on cost of Tomatoes
Du
rati
on
Relative percentage of customers
46

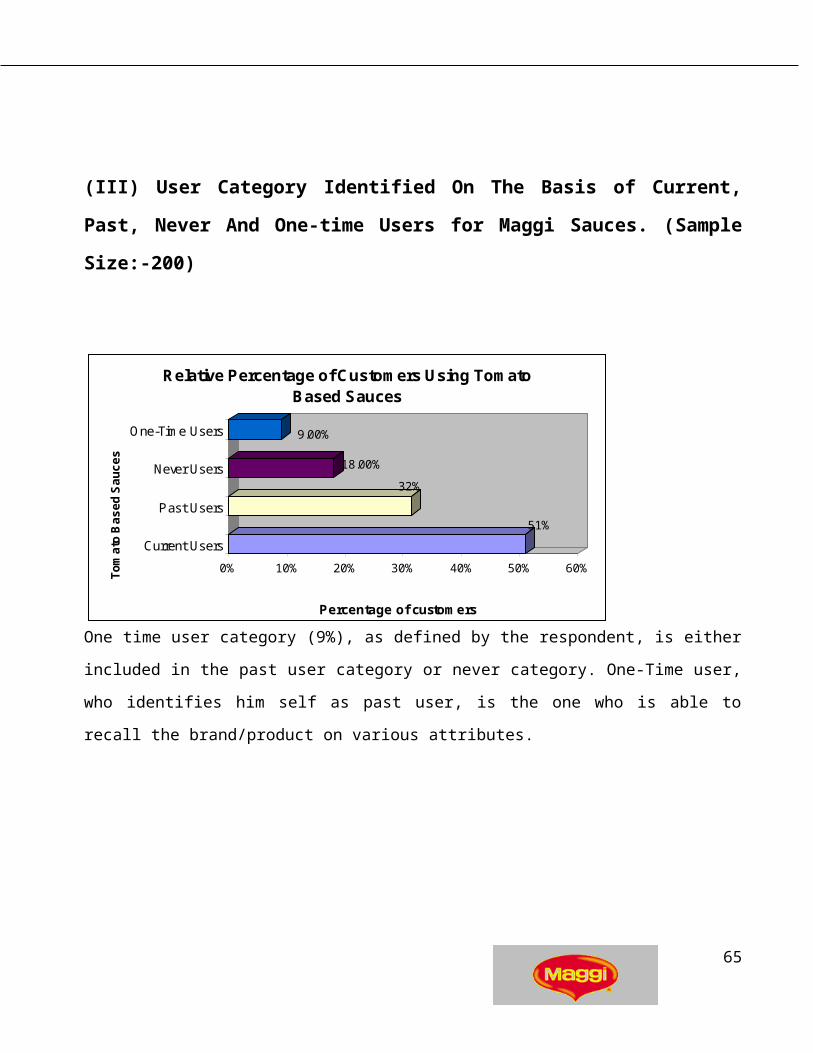
(III) User Category Identified On The Basis of Current, Past, Never And One-time
Users for Maggi Sauces. (Sample Size:-200)
51%
32%
18.00%
9.00%
0% 10% 20% 30% 40% 50% 60%
Percentage of customers
Current Users
Past Users
Never Users
One-Time Users
To
ma
to B
as
ed
Sa
uc
es
Relative Percentage of Customers Using Tomato Based Sauces
One time user category (9%), as defined by the respondent, is either included in the past user category
or never category. One-Time user, who identifies him self as past user, is the one who is able to recall
the brand/product on various attributes.
47
(IV) User Category Identified On The Basis of Income Groups (Size: - 200)
20%
46%
15.50%
19.00%
0% 10% 20% 30% 40% 50%
Percentage of customers
5000-10000
10000-15000
15000-25000
25000 +
Inco
me
Gro
up
s
Relative Percentage of Customers in Different income groups
Categorization on the basis of income groups (Rs.) is as follows: -
Lower income Group- 5000 to 10000; Middle income group-10000 to 15000
Higher Middle income group- 15000 to 25000; Upper Middle Income Group-25000 & above
48

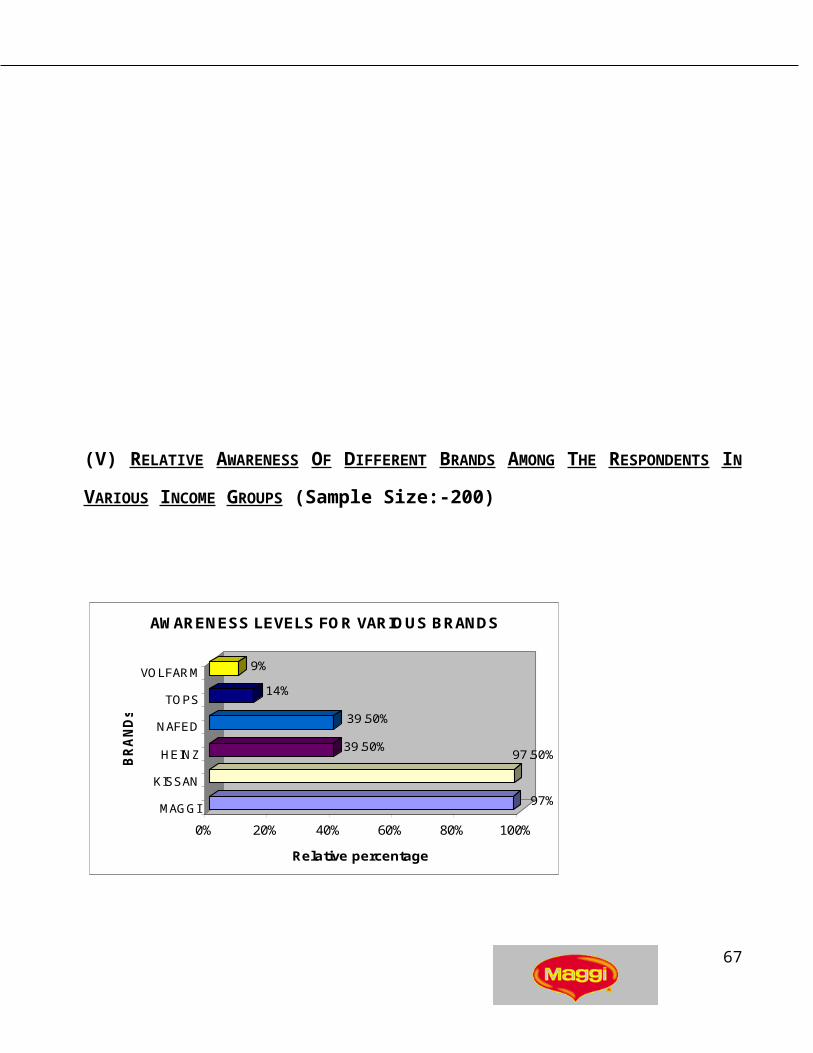
(V) RELATIVE AWARENESS OF DIFFERENT BRANDS AMONG THE RESPONDENTS IN
VARIOUS INCOME GROUPS (Sample Size:-200)
97%
97.50%39.50%
39.50%
14%
9%
0% 20% 40% 60% 80% 100%
Relative percentage
MAGGI
KISSAN
HEINZ
NAFED
TOPS
VOLFARM
BR
AN
Ds
AWARENESS LEVELS FOR VARIOUS BRANDS
Highest awareness is for Kissan as well as Maggi Sauces among the respondents.
49

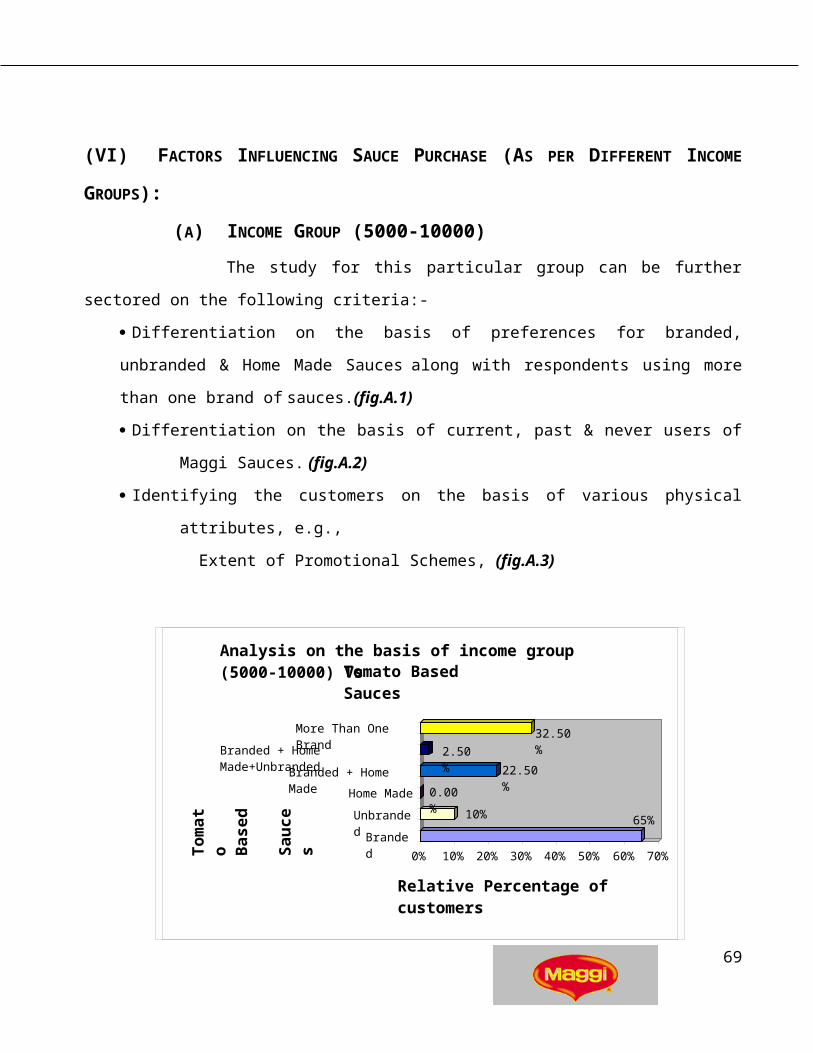
(VI) FACTORS INFLUENCING SAUCE PURCHASE (AS PER DIFFERENT INCOME
GROUPS):
(A) INCOME GROUP (5000-10000)
The study for this particular group can be further sectored on the following criteria:-
Differentiation on the basis of preferences for branded, unbranded & Home Made Sauces along
with respondents using more than one brand of sauces.(fig.A.1)
Differentiation on the basis of current, past & never users of Maggi Sauces. (fig.A.2)
Identifying the customers on the basis of various physical attributes, e.g.,
Extent of Promotional Schemes, (fig.A.3)
NO OF RESPONDENTS: 38;
( fig.A.1)
As can be seen from the graph, the branded user category is the highest (65%) whether it’s for Maggi
or any other brand of Tomato Sauces, followed by, users consuming more than one brand of Sauces.
65%10%
0.00%
22.50%
2.50%
32.50%
0% 10% 20% 30% 40% 50% 60% 70%
Relative Percentage of customers
Branded
Unbranded
Home Made
Branded + Home Made
Branded + Home Made+Unbranded
More Than One Brand
Tom
ato B
ased
Sau
ces
Analysis on the basis of income group (5000-10000) Vs Tomato Based Sauces
50

Analysis on the basis of income group(5000-10000) Vs Tomato User Category-Current,Past,Never
40%
40%
20.00%
0% 10% 20% 30% 40% 50%
Current Users
Past Users
Never Users
Use
r C
ateg
ory
Relative Percentage of Customers
NO OF RESPONDENTS -38;
( fig.A.2)
Both the current users as well as the past users are in equal proportion as customers shift from Maggi
to another brand because of non- availability and vice-versa for other brand.
51

Extent of Promotional Schemes Vs.Income Group(5000-10000)
15%
17.5%
12.50%
20.00%
30.00%
0% 5% 10% 15% 20% 25% 30% 35%
No Influence At All
Influences to some Extent
Moderately Influences
Fairly Influences
Strongly Influences
Influ
ence
of p
rom
otio
ns
Relative Percentage of Customers
NO OF RESPONDENTS -38;
(fig.A.3)
Promotional Schemes have a strong influence on the purchase of Sauces as a product.
52

(B) INCOME GROUP (10000-15000)
The study for this particular group can be further sectored on the following criteria:
Differentiation on the basis of preferences for branded, unbranded & Home Made
Sauces along with respondents using more than one brand of sauces.(fig.B.1)
Differentiation on the basis of current, past & never users of Maggi Sauces. (fig.B.2)
Identifying the customers on the basis of various physical attributes, e.g.,
Extent of Promotional Schemes, (fig.B.3)
NO OF RESPONDENTS 90;
(fig.B.1)
Branded tomato sauces maintain their position at 71.43% followed by prevalence of more than one
brands.
71.43%0%
1.09%
20.88%
0%
3%
3%
59.34%
0%
10%
20%
30%
40%
50%
60%
70%
80%
Relative percentage of customers
Branded
Unbranded
Home Made
Branded + Home Made
Unbranded + Home Made
Branded + Unbranded
Branded + Unbranded + Home Made
More Than 1 Brand
Use
r C
ate
go
ry
User Category Vs Income Category (10000-15000)
53

NO OF RESPONDENTS -90
Maggi Sauce continues to occupy its market position in comparison to other players as far as current
users are concerned.
NO OF RESPONDENTS -90;
(fig.B.3)
The promotional Schemes have a strong influence on this category as well with a relative percent of
24.18%, however, this percentage is less as compared to the one in the income group of 5000-10000.
45.05%
35.16%
19.78%
10.99%
0% 10% 20% 30% 40% 50%
Relative Percentage of customers
Current User
Past Users
Never Users
One-time Users
Usage Category
Usage Category Vs Income
Category (10000-15000)
Extent of Promotional Schemes vs. Income Group (10000-15000)
16.48%
17.58%
15.38%
25.27%
24.18%
0% 5% 10% 15% 20% 25% 30%
No Influence at All
Influences to some Extent
Moderately Influences
Fairly Influences
Strongly Influences
Infl
uen
ce
of
P r o m o ti o n s
Relative Percentage of Customers
54
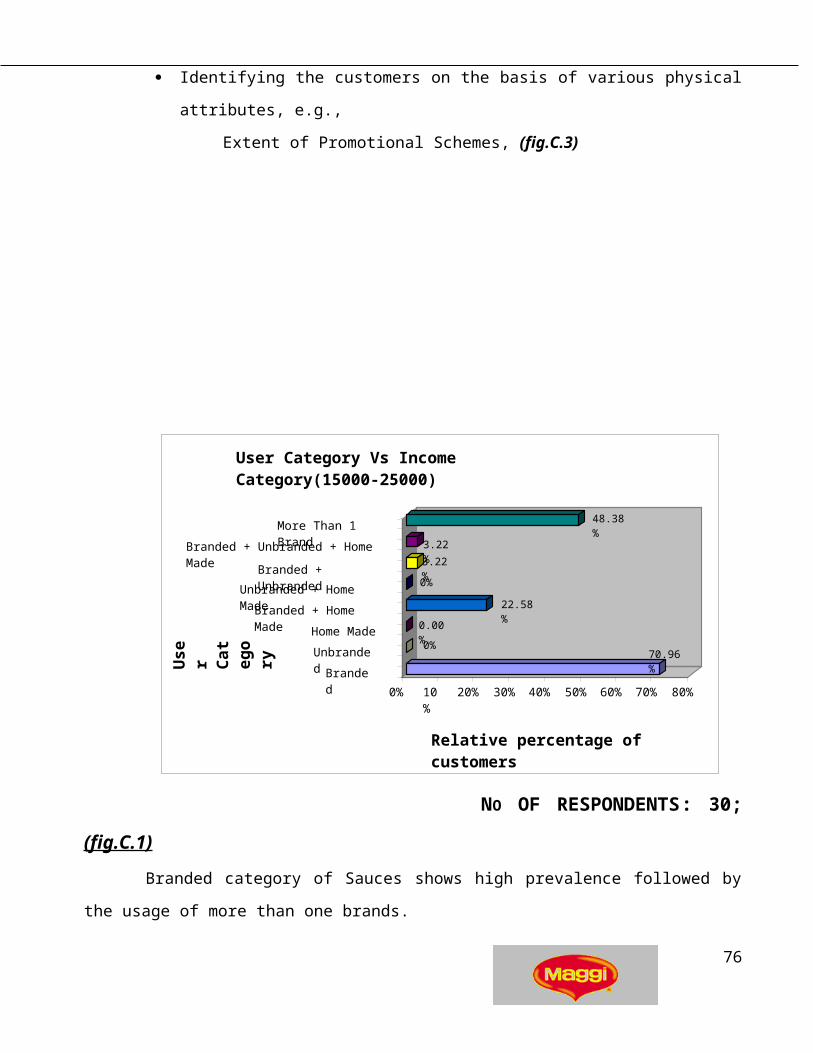
(C) INCOME GROUP (15000-25000)
The study for this particular group can be further sectored on the following criteria:-
Differentiation on the basis of preferences for branded, unbranded & Home Made
Sauces along with respondents using more than one brand of sauces.(fig.C.1)
Differentiation on the basis of current, past & never users of Maggi Sauces. (fig.C.2)
Identifying the customers on the basis of various physical attributes, e.g.,
Extent of Promotional Schemes, (fig.C.3)
70.96%0%
0.00%
22.58%
0%
3.22%
3.22%
48.38%
0%
10 %
20%
30%
40%
50%
60%
70%
80%
Relative percentage of customers
Branded
Unbranded
Home Made
Branded + Home Made
Unbranded + Home Made
Branded + Unbranded
Branded + Unbranded + Home Made
More Than 1 Brand
Us
er
Ca
teg
ory
User Category Vs Income Category(15000-25000)
55
NO OF RESPONDENTS: 30;
(fig.C.1)
Branded category of Sauces shows high prevalence followed by the usage of more than one brands.
56

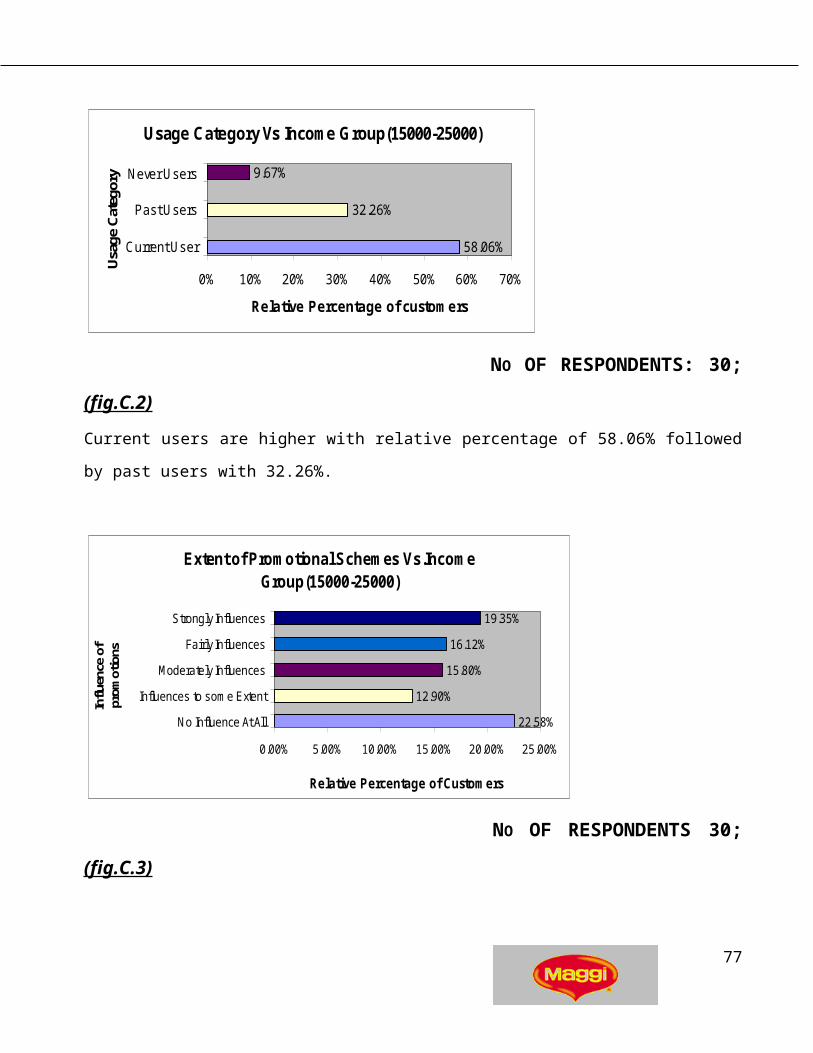
Usage Category Vs Income Group(15000-25000)
58.06%
32.26%
9.67%
0% 10% 20% 30% 40% 50% 60% 70%
Current User
Past Users
Never Users
Usa
ge C
ateg
ory
Relative Percentage of customers
NO OF RESPONDENTS: 30;
(fig.C.2)
Current users are higher with relative percentage of 58.06% followed by past users with 32.26%.
Extent of Promotional Schemes Vs.Income Group(15000-25000)
22.58%
12.90%
15.80%
16.12%
19.35%
0.00% 5.00% 10.00% 15.00% 20.00% 25.00%
No Influence At All
Influences to some Extent
Moderately Influences
Fairly Influences
Strongly Influences
Influ
ence
of
prom
otio
ns
Relative Percentage of Customers
NO OF RESPONDENTS 30;
(fig.C.3)
Price, here has no influence at all over this category, i.e. customers look forward to the quality rather
than the cost of the product.
57

(D) INCOME GROUP (25000+)
The study for this particular group can be further sectored on the following criteria:-
Differentiation on the basis of preferences for branded, unbranded & Home Made
Sauces along with respondents using more than one brand of sauces (fig.D.1)
Differentiation on the basis of current, past & never users of Maggi Sauces. (fig.D.2)
Identifying the customers on the basis of various physical attributes, e.g.,
Extent of Promotional Schemes, (fig.D.3)
68.40%0%
2.63%
26.30%
0%
0%
0%
60.50%
0.00% 10.00% 20.00% 30.00% 40.00% 50.00% 60.00% 70.00%
Relative percentage of customers
Branded
Unbranded
Home Made
Branded + Home Made
Unbranded + Home Made
Branded + Unbranded
Branded + Unbranded + Home Made
More Than 1 Brand
Use
r C
ateg
ory
User Category Vs Income Category(2500+)
NO OF RESPONDENTS: -36
( fig.D.1 ) Preference for branded sauces continues in this
category as well, however, there is high percentage of customers using more than one brand along
with the usage of home Made sauces.
58

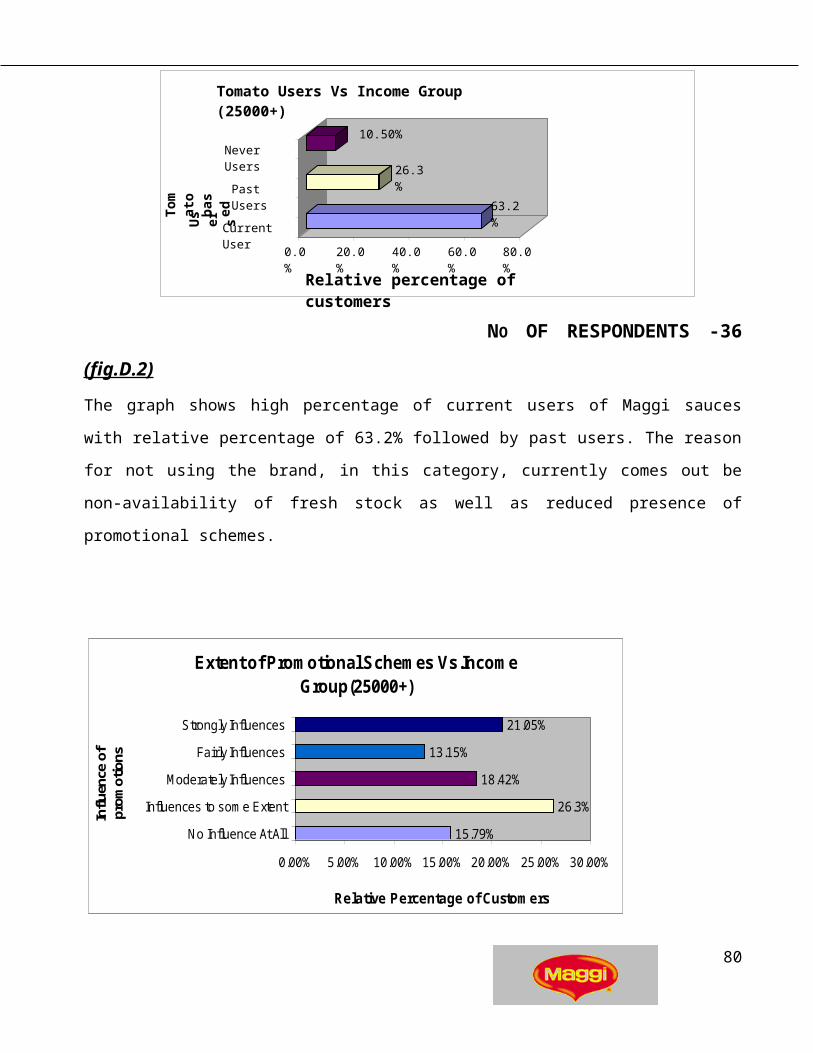
NO OF RESPONDENTS -36 (fig.D.2)
The graph shows high percentage of current users of Maggi sauces with relative percentage of 63.2%
followed by past users. The reason for not using the brand, in this category, currently comes out be
non-availability of fresh stock as well as reduced presence of promotional schemes.
Extent of Promotional Schemes Vs.Income Group(25000+)
15.79%
26.3%
18.42%
13.15%
21.05%
0.00% 5.00% 10.00% 15.00% 20.00% 25.00% 30.00%
No Influence At All
Influences to some Extent
Moderately Influences
Fairly Influences
Strongly Influences
Influ
ence
of
prom
otio
ns
Relative Percentage of Customers
NO OF RESPONDENTS -36
63.2%
26.3%
10.50%
0.0% 20.0% 40.0% 60.0% 80.0%
Relative percentage of customers
Current User
Past Users
Never Users
To mat
o
bas
ed
Us
er sTomato Users Vs Income Group (25000+)
59
Since there is reduced visibility of promotional schemes, therefore, these schemes influence to a
certain extent.
(VII) SCENARIO OVERALL KHANNA (in relation to category of Users)
NO. OF RESPONDENTS: 194
As can be seen from the graph, there is a strong favour for the branded category. Also, the
customers have the preference for more than one brand of sauces.
SCENARIO OVERALL KHANNA (in relation to category of Users - Current, Past
& never users)
60

NO. OF RESPONDENTS: 194
Maggi Sauces are being used by majority of the households (51.03%).
One-Time users include those categories of sauce users who can now be included in the never user
Category
(VIII) INFLUENCE OF DIFFERENT ATTRIBUTES ON PURCHASE OF SAUCES .
(A)PRICE
51.03%35.05%
17.01%
5.15%
0% 10% 20% 30% 40% 50% 60%
Relative Percentage of Users
Current Users
Past Users
Never users
One-Time Users
Us
er
Ca
teg
or
y
Maggi Sauce Users
61

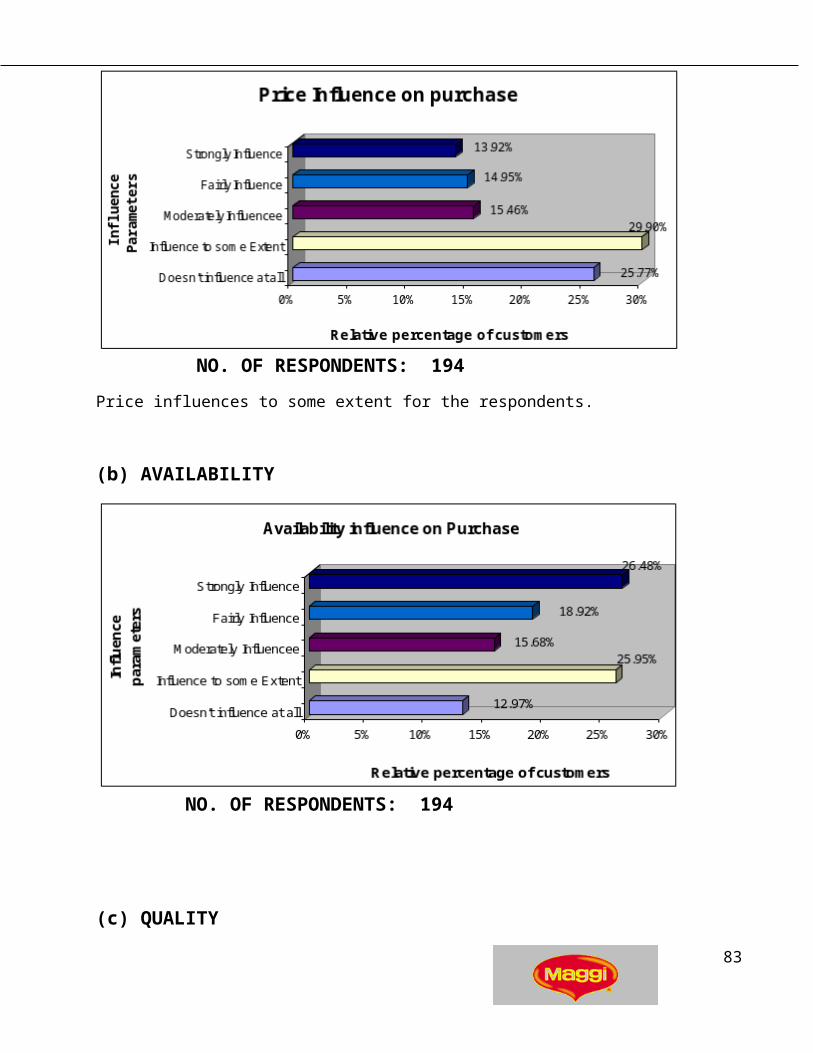
NO. OF RESPONDENTS: 194
Price influences to some extent for the respondents.
(b) AVAILABILITY
NO. OF RESPONDENTS: 194
(c) QUALITY
62

NO. OF RESPONDENTS: 194
Quality, as an attribute, has major contribution towards the selection of sauces as a product.
(d) FAMILY PREFERENCE
63

NO. OF RESPONDENTS: 194
Family has a strong influence over the purchase of sauces.
64
(e) VALUE FOR MONEY
NO. OF RESPONDENTS: 194 This attribute is associated with Quality and has major influence over the purchase.
65

(IX) PERCEPTION OF BRANDS
ATTRIBUTE SCORE GIVEN TO MAGGI BY CURRENT USERS
NO. OF RESPONDENTS: 105
Maggi Sauces enjoys maximum market for its Taste and Quality (62.35% and72.38%) respectively.
Also, it has somewhat preference for its spiceness and sweetness
66
MAGGI SOUPS/ PICKLE USERS
Percentage of Maggi Soups/Pickle Users
,
Users, 73.01%
Non- Users, 26.98%
NO. OF RESPONDENTS: 189
In comparison to Maggi Sauces, Maggi Soups as well as pickles are liked by majority of the
respondents whether or not they are using Maggi Sauces.
67

ATTRIBUTE SCORE GIVEN TO KISSAN BY CURRENT USERS
NO. OF RESPONDENTS: 96
Kissan, on the other hand, is liked by majority of the respondents on all of its aspects be it Quality,
Taste, Spiceness or Sweetness.
68
KISSAN SQUASH/ JAM USERS
Percentage of Kissan Squash/Jam Users
, Users, 78.72% Non- Users,
21.27%
NO. OF RESPONDENTS: 188
Kissan squashes/ jams are also being consumed in maximum households when compared to Kissan
sauces. (According to the data obtained only 96 respondents agreed to the consumption of Kissan
sauces whereas Kissan squashes/ jams are being purchased by 188 respondents).
(X) INFLUENCE OF PURCHASER-USER RELATIONSHIP
69

NO. OF RESPONDENTS: 166
The decision to purchase Maggi Tomato ketchup is highly influenced by the respondent herself as
well as the children. Also, the decision to purchase Chilli Garlic and Hot & Sweet sauces are highly
influenced by her husband.
70

VarientsDecisionInfluencers Self Husband Children Others
Tomato Ketchup
31.93% 21.08% 31.32% 12.05%
Hot & Sweet 11.45% 12.05% 31.32% 3.01%Chilli Garlic 1.20% 4.82% 4.82% 3.61%Masala Chilli 2.41% 4.21% 3.01% 3.01%Imli 1.81% 3.01% 3.61% 2.41%
(XI) SAUCE CONSUMPTION: BRAND SATISFYING VARIOUS PURPOSES
NO. OF RESPONDENTS: 166
Maggi Tomato Ketchup is utilized for various purposes for satisfying various needs followed by Maggi Hot and Sweet sauces.
71

Varients
DecisionInfluencers
Breakfast
Cooking
Snacks To Elders
To Children
Special Occasions
Tomato Ketchup
46.99% 24.09%40.36%
32.53% 32.53% 35.54%
Hot & Sweet8.43% 9.04%
13.25%
1.20% 4.82% 13.85%
Chilli Garlic1.20% 6.02% 5.42% 0.60% 0.60% 7.23%
Masala Chilli1.20% 3.01% 5.42% 2.41% 0.60% 9.04%
Imli0% 4.82% 6.02% 1.81% 2.41% 8.43%
(XII) CHILDREN LIKING FOR MAGGI SAUCES .
NO. OF RESPONDENTS: 167
72

NOT APPLICABLE refers to the households where either the children are too young to give their
preference or they are included in the adult category.
(XIII) REASONS FOR HAVING PREFERENCE TOWARDS MAGGI SAUCES
NO. OF RESPONDENTS: 167
Children prefer Maggi Sauces because they associate Maggi Sauces with Maggi Noodles whereas
68.26% like it because of its good taste.
(XIV) IMPACT OF ADVERTISEMENTS ON THE PURCHASE OF MAGGI SAUCES
73

NO. OF RESPONDENTS: 167
Maggi advertisements are potential enough to leave an impression in the minds of the customers as
approximately 77% respondents are able to recall the advertisements.
(XV) PRODUCT RECALL: IMPACT OF THE ADVERTISEMENT
NO. OF RESPONDENTS: 167
Approximately 42% respondents recalled Maggi Tomato ketchup whereas 17% said it was the
advertisement for Maggi Hot & Sweet.
74

(XVI) COMMUNICATION BY ADVERTISEMENTS: UNAIDED RECALL OF PUNCH LINE
NO. OF RESPONDENTS: 167
Though 77% of the respondents were able to recall the advertisements, 66 %( approx.)
Were not able to recall the communication made by that advertisement.
(XVII) SOURCES OF AWARENESS OF ADVERTISEMENTS
Punch-Line recall
,
Not Able to recall,
65.27%
Able to recall, 34.73%
75
NO. OF RESPONDENTS: 167
Respondents who visualized the advertisement of Maggi sauces on TV are: - 84% (approx.)
Respondents who visualized the advertisement of Maggi sauces in Press are: - 7% (approx.)
Respondents who visualized the advertisement of Maggi sauces on Hoardings are: - 6% (approx.)
(XVIII) I MPACT OF THESE ADVERTISEMENTS
NO. OF RESPONDENTS: 167
Impact was favourable for the products, especially, Maggi Tomato Ketchup & Maggi Hot & Sweet
as 70% of the respondents agreed to buy more after seeing these advertisements.
Impact of Advertisements on Buying
,
Favourable, 69.46%
Unfavourable, 30.84%
76
(XIX) PREFERENCE FOR VARIOUS PROMOTIONAL SCHEMES
NO. OF RESPONDENTS: 167
Discounts/ Price-off is the most worthy Promotional Scheme, as told by the respondents. Following
this is more quantity at same price.
(XX) INFLUENCE OF VARIOUS PROMOTIONAL SCHEMES ON PURCHASE
30.54%
49.70%
39.52%
0% 10% 20% 30% 40% 50%
Relative percentage of preference
Gifts
Discounts/price-off
More Quantity at same price
P r o m o ti o n a l
Sc
he
me
s
Preference for Promotional Schemes
77

Influence of Promotional Schemes on Purchase
,
Buying More, 73.05%
Not Buying More,
26.95%
NO. OF RESPONDENTS: 167
The promotional Schemes have the favourable response on the respondents, as 73% of the
respondents agree to buy more.
(XXI) SOURCES OF AWARENESS OF PROMOTIONAL SCHEMES
89.82%40.72%
43.11%
13.17%
1.80%
4.19%
3.59%
0% 20% 40% 60% 80% 100%
Relative percentage of respondents
T.V.
Newspaper
Shopkeeper
Magazine
Hoarding
Radio
P.O.P
So
urc
es
Sources of Awareness of Promotional Schemes
NO. OF RESPONDENTS: 167
Approximately 90% of the respondents find TV as one of the most important promotional tool.
78

Whereas, only 40% find newspaper as the informative promotional tool.
(XXII) BRAND LOYALITY TOWARDS MAGGI SAUCES
Percentage of Brand Loyals
,
Brand Loyal, 58.08%
Brand Switchers,
41.91%
NO. OF RESPONDENTS: 167
Maggi sauces continue to hold its position as 58% of the respondents continue to buy Maggi Sauces
even if there is a promotional scheme on some other brand. Also, the respondents who said that they
will be shifting to other brands because of the promotional schemes, will shift only if the other brand is
Kissan
79
(XXIII) PRIDE ASSOCIATED WITH MAGGI SAUCES
Pride Associated with Maggi Sauces
,
,
Can't Say, 6.59%
Not feeling Pride, 18.56%
Respondents feeling Pride,
74.85%
NO. OF RESPONDENTS: 167
75% of the respondents feel pride in serving Maggi Sauces to their guests and associate
this with prestige issue.
80

(XXIV) REASONS FOR NOT PURCHASING MAGGI SAUCES (AS GIVEN BY THE
NEVER USERS)
16.67%
16.67%
5%
33.30%16.67%
0%
3.33%
3.33%
6.66%
13.30%
6.66%
0% 5% 10% 15% 20% 25% 30% 35%
Relative percentage of respondents
Prices too high
Poor Quality
Non-Availability
Poor Taste
satisfied w ith Current brand
Never felt need of trying maggi
Not liked by family
Bad w ord of mouth
Thickness
No Specif ic reason
Its perfect
Rea
son
s
Reasons for not using maggi Sauces (as given by never users)
81

Among the Never users and One-time users, 33% does not like the taste of Maggi Sauces (mainly
because of the presence of garlic and onions in it). Also, 17% feel it has poor packaging. (They
associate Quality with packaging) whereas 17% are satisfied with the current brand they use.
82
REASONS FOR NOT PURCHASING MAGGI SAUCES (AS GIVEN BY THE PAST USERS)
37.50%12.50%
6.25%
12.50%
5%
2.50%
1%
2.50%
5%
12.50%
0% 5% 10% 15% 20% 25% 30% 35% 40%
Relative percentage of respondents
Prices too high
Poor Quality
Non-Availability
Poor Taste
satisf ied w ith Current brand
Never felt need of trying maggi
Not liked by family
Bad w ord of mouth
Thickness
No Specif ic reason
Re
as
on
s
Reasons for Not Purchasing maggi Sauces(As given by past Users)
Among the Past Users, 38% feel that the prices of Maggi Sauces are too high in comparison to the
current brand they use whereas 7% have shifted because of the non-availability of Maggi Sauces.
83

CONCLUSION
According to Marten Harper,
“To manage a business well is to manage its future, and to manage the future is to manage
information.”
In today’s competitive world, it is very difficult for the companies to sustain and in order to keep their
hands on the pulse of both business and consumers there is a strange need to have information. In the
fast moving consumer goods (FMCG) industry, it is not only difficult to get information but also very
important. The most crucial part is to manage this objective in mind, the research was conducted in the
14 localities of the D khanna market and the following conclusions are drawn from the study:-
There is a considerable degree of brand loyalty (almost 60%) towards Maggi Sauces that
in it indicates that people have strong admiration towards tastes and quality of Maggi
sauces.
The advertisement of Maggi Hot n Sweet Sauce has a strong recall in the minds of
consumers and the famous statement “Its Different” and “2-minutes”are still fresh in their
minds.
There is a very strong impact of the advertisements of Maggi on the minds of consumers
as approximately 100% consumers are aware of Maggi Sauces.
In case of preference for promotional schemes approximately half of the consumers have
stated their liking towards Price-Off followed by Gifts and Incentives.
It has been observed in most of the cases that the decision to purchase sauces is the joint
family decision whereby children are playing a major role for purchasing sauces.
Promotional Schemes have a strong degree of influence on the purchasing decision of
consumers in all the income groups.
84

Kissan is a strong competitor for Maggi Sauces. Also, threat is posed off from some
domestic players on account of low price and more distribution and availability
Heinz repositioning strategy is also playing a major threat to Maggi Sauces.
There is an emerging trend among the consumers for using more than one brand of
sauces (as told by more than half of the respondents), one for household and other for
special occasions and consumers use Maggi Sauce for this purpose as its add to their
prestige.
75% consumers feel pride in serving Maggi sauces to their guests, a strong image for the
company.
Past Users of Maggi Sauces (35%) feel that Maggi sauces should be relaunched with
reduced prices, better packaging, and improved quality along with more no. of
promotional schemes.
85

SUGGESTIONS
Market oriented thinking is a necessity in todays competitive world. In many places, there are too
many goods chasing too few customers. Most of the companies are competing to enlarge their share of
existing market. In the end, the companies’ best satisfy their customers will be winners. It is special
responsibility of marketers to understand the needs and wants of market place and to help their
companies translate them into solutions that win the customer’s approval. Today’s smart companies
are not merely looking for sales; they are investing in long term, mutually satisfying customer
relationships based on delivering quality, service and value. Keeping this objective in mind following
suggestions can be made: -
Nestle should stress more on advertising its products, i.e. Maggi Masala Chilli, Maggi Chilli Garlic
and Maggi Tomato Ketchup.
They should also improve the availability of their products; introduce the varients without onions
and garlic.
They can relaunch their products by reducing the prices supported with more of promotional
schemes, free-samples/sachets.
86

SWOT ANALYSIS FOR MAGGI SAUCES
STRENGTHS
Strong brand identity among consumers; especially through Maggi Noodles.
Available in varieties of flavours.
WEAKNESSES
A low overall marketing effort.
Has placed its components at higher prices in comparison to Kissan which is the major threat
to Maggi Sauces.
Poor packaging
Less number of promotional schemes.
Non-availability of fresh stock in the market.
Price-Quantity trade-off is not taken care off.
87

OPPORTUNITIES
Widely untouched rural market.
Associations with major fast food chains (MNCs)/food shows.
Associations with companies dealing in cooking ware, like, microwave oven.
Should introduce more flavours, like ones without onion and garlic.
Make the bottle handy with widened mouth so that it can become mobile.
Create more uses and more demands
THREATS
Loyality reducing among customers.
Threat from local and low priced entrants/substitutes.
Threat from Home Made Sauces.
Unable to create repeated purchases.
88

QUESTIONNAIREOBJECTIVE: - To study the brand preference of Maggi Tomato Ketchup.
1. Name: …………………………………………
2. Sex:
Male
Female
3. Family Monthly Income:
5000-10000
10000-15000
15000-25000
25000 and above
4. Location: ……………………………………
5. Age:
15-25
25-35
35-45
45 and above
89

6. Family type:
Joint
Nuclear
7. Do you consume tomato ketchup?
Yes
No
8. Which type of sauce do you prefer?
Branded
Home made
Unbranded
Branded+ home made
Tomato based sauces
9. Which brand you prefer the most?
Maggi
Kissan
Heinz
Tops
Volfram
10. Have you ever used Maggi Tomato Ketchup?
Yes
No
90

11. If no, it is because:
Lack of awareness
Lack of availability
You find it expensive
You don’t like the product.
12. You came to know about Maggi Tomato Ketchup from :
Newspaper advertisements
Radio
T.V. advertisements
Word of mouth
Hoarding
Magazine
Shopkeeper
13. Have you tried new variants of Maggi Tomato Ketchup after viewing the advertisements?
YESNo
14. What is the level of discounts /offers available with Maggi Tomato Ketchup?
High
Medium
Low
91

15. Which of the offers available influence you the most to purchase Maggi Tomato Ketchup?
Discounts offer
Buy one get one
Combo packs
Other ………………………………………………………………………………………
16. Is Maggi Tomato Ketchup easily available to you?
Yes
No
17. From where do you usually purchase Maggi Tomato Ketchup?
Nearby store
Retail store
Whole seller
18. Which flavor of Maggi Sauces you like the most?
Tomato Ketchup
Hot & Sweet
Chilly garlic
Hot & sweet
Masala chilly
Imli
92

19. What is the size of Tomato Ketchup you usually purchase?
Pichkoo Pack
200 g
600 g
1kg
20. Tick the level of importance according to your preference:
Attribute Very important moderately important Least important?
Price
Quality
Availability
Family preference
Value for moneyThickness
Signature:
93
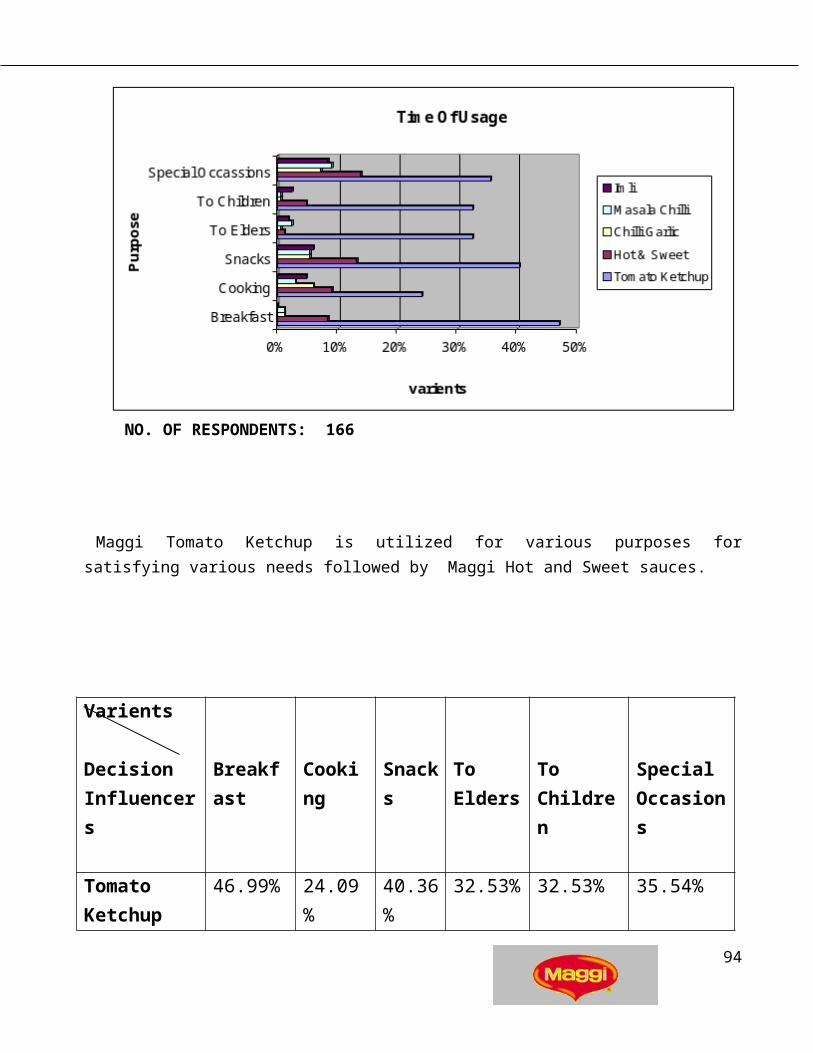
BIBLIOGRAPHY
www.nestleindia.com
www.rediff/rediffonthenet/businessews/saucier.htm
www.marketreports.co.uk./marketreports/business/condimentsandsauces.htm
www.gdfoods.com/toppingitup/food&Bev/cateterer.html
www.maggime.com (accessed on 15th March’04)
Kotler philip“Marketing Management”, PHI (11th Ed) PP. 396,404-5.
94

95