makassar,indonesia - connecting repositories · makassar itself in 2013 was 1.408.072 and the...
TRANSCRIPT
YOKOHAMA CI TY UNI VERSI TY
22r2,Seto,Kanazawa-ku,Yokohama,236-0027,JAPAN
TEL:045-787L2311 FAX.045-787-2316
URL’http://www・yOkohama蠣Cu.aC.jP/
August11,201
Prof.Dr.Barkey
LP2MUniversitasHasanuddin
Makassar,Indonesia
Invitationtothe6thIACSCsvmposlum
DearDr.Barkey,
YokohamaCityUniversityispleasedtoinviteyoutoparticipateinthe6thIACSC(Intemationz
Academic Consortium R)r Sustainable Cities)Symposium to be heldin Yokohama,Japan,O
Septemberlland12.
172eme:Globalpartnershipandlocalinitiativestbrsustainablecities
迦些こYokohamaPortOpenlngMemorialHa11,1-6,Honmachi,Naka-Ward,Yokohama,Japan
Wusite:http
ReRristrationfbes:60USD(paymentonsite)
Wewouldbeverypleasedifyoucouldattendandgivearesearchpresentationatthesymposium,O
thetopic“LanduseplamingfbrMamminasataMetropolitanWaterSecurityandLow-Emissio
Development,SouthSulawesi,Indonesia”.
Yokohama City Universitywillfully support your roundtripfrom Makassar to Yokohama O
SeptemberlOandSeptember15,butcannotcoverotherexpensesrelatedtothesymposium(e.室
accommodation,registrationfbes).
Wetrulyhopethatyouwillbeabletoacceptthisinvitation,andremainatyourdisposalshouldyou
haveanyquestions.
Sincerely,
IACSCSecretariat
Representative
書窄′%ichiHara
SecretariatofInternationalAcademicConsortiumfbrSustainableCities&
Pr(函ctManager,GlobalCooperationInstituteforSustainableCities
%kohamaCityUniversity
22-2,Seto,Kanazawa-ku,Ybkohama,236-0027,JAPAN
ltl:+81-45-787-8943
1
LAND USE PLANNING FOR MAMMINASATA
METROPOLITAN WATER AVAILABILITY, SOUTH
SULAWESI, INDONESIA
Roland Alexander Barkey1, Muh. Faisal M.2
1Research & Development Center for Natural Heritage, Biodiversity and Climate Change,
Hasanuddin University, Makassar, Indonesia
2Faculty of Forestry, Hasanuddin University, Makassar, Indonesia
ABSTRACT
Introduction. Land use is a dominant factor for water availability and carbon emission in one
region such as a watershed. Mamminasata metropolitan consists of three regencies (Maros,
Sungguminasa, and Takalar) and the city of Makassar. Water availability for Mamminasata is mostly
determined by Jeneberang Watershed and controlled by Bili-Bili Dam. This study estimates the change
in land use and the water volume runoff in 2030. Prediction methods of land use in 2030 were
calculated using Markov Chain Cellular Automata. Soil conservation service (SCS CN) method was
used to calculate the volume of runoff that determined the availability of water. Rainfall data for this
study was obtained from BMKG: the Indonesian Institute for Meteorology, Climate, and Geophysics.
Rainfall prediction was done by using three change scenarios (HADCM, CSIRO-MK3.5 and
GFDL2.1).
Results. The results show prediction of land use change in 2030 (from 2014) was very significant.
The HADCM model scenario indicates an increase in water runoff 5%, CSIRO-MK3.5 model predicts
a decrease of 12.83%, and GFDL model a decrease of 19.83% by 2030. To support the availability of
water for Mamminasata metropolitan, land use at the Bili-Bili Dam catchment area should be planned
and managed carefully.
KEYWORDS: land use planning, runoff, climate change scenario.
2
INTRODUCTION
Mamminasata metropolitan which consists of the city of Makassar, Maros, Gowa, and
Takalar regencies was established based on the Decree of the Governor of South Sulawesi in 2003.
The spatial planning of Mamminasata metropolitan has been legalized through Presidential Regulation
Number 55 of 2011. Mamminasata comprises all districts of the city of Makassar and Takalar regency,
12 of 14 districts in Maros, and 6 of 16 districts in Gowa. The exception was done by remembering
that the district locations are far away from metropolitan area. The size of Maminasata area is 2.462.3
km2 (246.230 ha). In 2013 the number of population was about 2.06 million people, the population of
Makassar itself in 2013 was 1.408.072 and the present prediction has exceeded 1.7 million people.
The city of Makassar is the capital of South Sulawesi province and of course becomes the
center of economic growth for Mamminasata. The location of the city of Makassar and its position as
the provincial capital makes it a center for services and trades. About 31.82 % of South Sulawesi
provincial economy is in the city of Makassar (BPS Kota Makassar, 2014).
The Jeneberang River is the main supplier of water need in Mamminasata metropolitan.
About 80% of water supply for the city of Makassar comes from this river (CSIRO, 2012). To support
the availability of water, Bili-Bili Dam has been built and it can catch water from two sub watersheds:
Malino sub-watershed and Lengkese sub-watershed. The location of Jeneberang and Bili-Bili Dam
catchment area can be seen in Figure 1.The hydrological function of the Jeneberang watershed has
been decreased since several years ago. The decrease of this hydrological function can be seen from
the decrease of index value of land cover as an indicator of healthy watershed (Departemen Kehutanan,
2009). At the downstream of the Jeneberang River, there is a rice field area of which the estimated
size is 24.000 ha. This rice field area is located at the adjacent city of Makassar. At the rainy season
this area is damaged by a serious flood. But at the dry season it dries and irrigation network cannot
function. Likewise the city of Makassar lacks of water seriously both for domestic and industrial needs.

3
Figure 1. Location of Relative Bili-Bili Catchment area toward Jeneberang Watershed and
Mamminasata metropolitan
Deforestation and forest degradation occur intensely enough at the upstream of the
Jeneberang watershed. Efforts for rehabilitation have been done since ten years ago, but minimum
result. The flow of deforestation and land degradation is faster than the rehabilitation effort. This fact
causes more problems related to water management of the Jeneberang watershed.
The other problem caused by deforestation and forest degradation or general change of land
cover is the increase of erosion causing higher sedimentation at the Jeneberang River. The
sedimentation is higher and higher due to landslide at the crater of Mount Bawakaraeng in 2004 which
makes the upstream of the Jeneberang watershed. This causes the decrease of water quality which
affects the availability of drinking water for urban area of Mamminasata metropolitan especially the
city of Makassar. Erosion and sedimentation also cause the shallowness of Bili-Bili Dam lowering the
availability of water for Mamminasata urban area.
The land use planning is one of the important efforts in improving the quality of the
Jeneberang watershed. The land use protects the surface of land that can increase the flow of water
infiltration or decrease runoff can increase quantity and quality of water of the Jeneberang River. This
is the rationale of this study. The projection of land cover/land use in 2030 can give an illustration
about the problem to come, therefore efforts to overcome it is by engineering the land cover/land use
especially at the upstream of the Jeneberang watershed. The intervention scenario considering the
4
Spatial Plan of Gowa regency was used in this study.
The availability of water was determined by the amount and distribution of rain fall. The
climate change to occur was put into consideration. In this study three models were also used for rain
fall scenario in 2030.
METHODS
There were three methods used in this study: land cover projection or land use, runoff
calculation, and rain fall scenario in 2030 according to three global climate models. Alternative land
cover was determined based on land utility plan in spatial plan of Gowa regency.
Design and Research Variables
This study was based on mapping which belongs to non experimental research by using
survey method and geographic information system (GIS) analysis. The data were processed through
spatial analysis based on overlay spatial technique. The spatial information used consists of land cover
map, slope map, rainfall map, forest status map, and land suitability map.
The primary data were obtained through: (1) satellite image interpretation activity to obtain
land cover maps, (2) direct observation done at the field to land use and land conservation techniques
at each land unit, and (3) slope map was processed from data ASTER DEM 2011. The use of land
samples was selected purposively based on accessibility of land unit.
Data Collection
The procedures of data collection began by downloading image of Landsat 7 of 1998 and
Landsat 8 of 2014 provided by the United States Geological Survey (USGS). The Landsat images of
1988 and 2014 were used in the making of land cover map. Interpretation was done by using visual
method. The type of land cover was determined based on patterns and characteristics (features, colors,
and textures) at the image.
The test of image interpretation accuracy was done by comparing the results of image
interpretation of Landsat 8 of 2014 and survey results of the same year. This process was called overall
accuracy assessment with the following equation:
OA = X/N X 100%
In which: X = total value of diagonal matrix
N = total samples of matrix
The level of accuracy of the image interpretation which can be accepted 85% (Lillesand &
Kiefer, 1997). This means that at least 85 of each 100 sample points determined must be compatible
with the field situation.

5
Data on actual rain fall were obtained from BMKG (Indonesian Institute for Meteorology,
Climate, and Geophysics) for three rain fall measurements around the research location. As for rain
fall for scenario in 2030 was obtained from global climate model (GCM) with horizontal resolution 4
km (Kirono, McGregor, Nguyen, Katzfey, & Kent, 2010) is presented in Table 1. This rain fall model
was then analyzed to obtain rain fall scenario of 2030.
Table 1. Global Climate Model Used
No Global Climate
Model Group Model, Country
Basic Horizontal
Resolution (km)
Scenario
Horizontal
Resolution (km)
1 CSIRO-MK3.5 Commonwealth Scientific and
Industrial Research
Organisation, Australia
200 14
2 GFDL 2.1 Geophysical Fluid Dynamics
Lab., USA
300 14
3 HADCM3 Hadley Centre, UK 300 14
Source: Kirono et al. (2010) with modification
Data slope were made from Aster DEM image resolution 30 meters prepared by the United
States Geological Survey (USGS). Slop classes was adjusted based on slope parameter. Data on types
of soil were obtained from land system RePPProt (Regional Physical Project for Transmigration) of
Coordination Board of Survey and National Mapping 1987). Slope length (L) was measured from a
location on land surface in which erosion began to occur to a location where sedimentation occurred
or up to the location where flow of water on land surface got into the channel (Sutapa, 2010).
Data Analysis
Scenario of land use was done by using Markov Chain Cellular Automata method. The use
of land in 2030is projected based on change between the years of 1998 and 2014.The calculation of
kappa value was used to test the accuracy of Markov model projection. The result of the projection
is the input to determine the amount of runoff water volume in the future.
The rain fall prediction analysis was done through two periods of different assumption
between past and future, in which in this case the comparison is between the years 1980-2000 (1990s)
and 2020-2040 (2030s). The 1990s was further called period I and the 2030s is called period II. This
means that the rain fall obtained in the 2030s is always relative to the 1990s. The scenario flow of rain
fall in the 2030s is shown in Figure 2.
The level of runoff water volume was predicted by analyzing determinant factors of soil
hydrology that is P (rain fall/precipitation), soil texture, classification of curve figure for

6
vegetation/land cover at each unit of land. The equation used in the prediction of the amount of runoff
water volume was based on SCS CN as follows:
Q = sum of surface runoff (mm)
P = precipitation (mm)
S = maximum retention water potential (mm)
From empirical equation, S can be assumed by using equation: S= (25400/CN)-254 in which CN =
curve number depending on soil characteristics and hydrological conditions and previous water
condition (Arsyad, 2010).
Level of water volume can be determined based on the above formula
Figure 2. Flow of rain fall scenario in 2030
RESULTS & DISCUSSION
The results of rain fall scenario in 2030 shows that the change which is not so drastic
compared to the use of land in 2014. This can be seen in Table 2. Natural vegetation decreases
significantly. This indicates that there was a great population pressure. The dry land agriculture also
decreased greatly indicating the increase need of non agricultural land.
Global Climate Model
Rainfall Model
Past Period Year
1990’s
Data 1980-2000
(Monthly Rainfall)
Period II, Year 1990’s
(Past)
Data 1980-2000
(Monthly Rainfall)
Level of Change calculated from
(Period I-Period II)/Period I
Monthly Actual
Rainfall
Monthly Rainfall
Model
Monthly Rainfall
2030’s
Change
Trend

7
Land conversion increased greatly and settlement is predicted to develop evenly in areas
which have been the area of settlement. The role of human being in triggering the increase of land
occupation and limited work opportunities, and low skills result in small income of farmers. This often
encourages some farmers to open up a forest and other unproductive land as farm land. Therefore the
use of land in the future is inversely proportional to the land ability, so that it affects the whole system
of ecology in the catchment area of Bili-Bili dam.
Table 2. Change of Land Cover in 1998, 2014 and 2030
No Land Cover
Year
1998 2014 2030
Extent (Ha) (%) Extent (Ha) (%) Extent (ha) (%)
1 Secondary Dry Land Forest 9,999.48 26.0 8,590.18 22.4 4,418.73 11.5
2 Planted Forest 540.62 1.4 562.7 1.5 770.37 2.0
3 Bare Land 1,302.88 3.4 2,056.97 5.4 4,981.09 13.0
4 Crop Estate 355.26 0.9 304.89 0.8 143.12 0.4
5 Settlement 177.08 0.5 293.51 0.8 1,407.45 3.7
6 Mix Dry Land Agriculture 17,529.33 45.6 16,746.10 43.6 12,467.66 32.5
7 Paddy Field 5,027.52 13.1 6,223.60 16.2 9,958.28 25.9
8 Scrub and Busses 2,075.12 5.4 2,234.78 5.8 3,114.77 8.1
9 Water Body 1,400.60 3.7 1,395.15 3.6 1,146.43 3.0
Total 38,407.90 100 38,407.90 100 38,407.90 100
Global climate scenario shows the decrease of rain fall in the future for models GFDL2.1 and CSIRO-
MK3.5 and increase for model HADCM in 2030 can be seen in Table 4. Table 3 shows rain fall change
scenario at three climate stations.
Table 3. Scenario of Rain Fall at Three Climate Stations in the 2030s.
Station Area (ha) Actual
Precipitation
Precipitation Scenario in the 2030s (mm)
Model MK3.5 Model GFDL 2.1 Model
HADCM
Bontobili 7,693.49 3,655 3,495.71 3,089.68 3,791.66
Malino 26,148.58 3,641.05 3,453.59 3,700.2 3,814.01
Paledingan 4,565.83 4,247.28 3,985.19 3,794.71 4,220.73
The research results of runoff volume for the three global climate models (GFDL2.1, CSIRO-MK3.5,
and HADCM) in 2030 can be seen in Table 4. The estimation of the level of runoff water volume

8
change in the future shows a significant change if it is compared to runoff water volume prediction at
present. There are two models of climate change showing the decrease of runoff volume. The models
are GFDL2.1 and CSIRO-MK3.5. This is due to the effect of the change of forest land use to farm
land having small retention value at the upper and middle streams. The two models of climate scenario
have the decrease of rain fall intensity so that the decrease of runoff water volume is predicted to occur
in the future.
Table 4. Prediction of Runoff Volume in 2030 and Its Change from 2014.
Zone
Runoff Volume
in the 2014
(mm)
Prediction of Runoff Volume (mm) in the 2030s
GFDL21 Change MK3.35 Change HDCM Change
Upstream 8,118.20 7,720.26 -397.94 7,664.13 -454.07 8,260.12 141.92
Middle
Stream 11,801.55 10,821.40 -980.16 11,171.32 -630.23 12,063.26 261.70
Down
Stream 3,876.13 3,271.22 -604.91 3,677.33 -198.79 3,973.33 97.20
Total 23,795.88 21,812.88 -1,983.00 22,512.78 -1,283.10 24,296.71 500.83
Figure 3. Maps of Runoff Volume Change at Present and in the Future

9
Land use planning for Bili-Bili Dam Catchment Area
Land use planning is based on the smallest retention value (critical condition) which has been obtained
previously (Appendix A and Appendix B). The consideration of retention value of land cover is done
for the year 2014 and year 2030 and retention value of land use planning. The consideration of land
cover in the preserved forest area and conservation area is also used in the simulation, remembering
that preserved forest as a distributor of water regulation for catchment area of Bili-Bili dam.
Land use planning to be recommended must be in line with Spatial Plan of Gowa regency.
Therefore, it is necessary to know spatial pattern which has been planned by the government of Gowa
regency. Based on data of the Regional Development Planning Board (BAPPEDA) of Gowa regency,
spatial plan for the regency has been obtained. The said spatial plan was then made in line with
catchment area of Bili-Bili dam. Data on spatial plan of Gowa regency at catchment area of Bili-Bili
dam can be seen at Appendix C and Appendix D.
Land cover or land use plan is a part of this research. The existence of land use is meant to
make the best decision of land utility based on the balance of ecological and economic benefits. Land
use plan was built to increase runoff volume in one year cycle can be seen in Appendix E. This plan
is an intervention to projection of land cover/land use in 2030.In order to get wanted plan, intervention
is needed for planning years from the year 2014 to the year 2030. Map of land use plan for the year
2030 can be seen in Appendix F.
The results of land use intervention in 2030 can increase runoff volume as is presented in
Table 5.
Table 5. Prediction of Runoff Volume in 2030 Based on Land Use Plan
Prediction of Runoff Volume in the 2030s Based on Land Use Plan
Zone MK3.5
Before After Increase
Upstream 7,664.13 7,760.96 96.83
Middle Stream 11,171.32 11,454.55 283.23
Down Stream 3,677.33 3,997.66 320.32
Total 22,512.78 23,213.17 700.39
Zone GFDL2.1
Before After Increase
Upstream 7,720.26 7,817.09 96.84
Middle Stream 10,821.40 11,104.59 283.19
Down Stream 3,271.22 3,591.02 319.80
Total 21,812.88 22,512.70 699.82

10
Prediction of Runoff Volume in the 2030s Based on Land Use Plan
Zone HDCM Before Plan in 2030
Before After Increase
Upstream 8,260.12 8,356.99 96.86
Mid Stream 12,063.26 12,346.58 283.33
Down Stream 3,973.33 4,293.96 320.63
Total 24,296.71 24,997.53 700.83
Land use plan in 2030 can increase availability of water at Bili-Bili Dam as the main source of water
of Mamminasata metropolitan.
CONCLUSION
Land use projection in 2030 shows the change of forest land cover and change of mix dry land
agriculture to established land. If this is ignored without any intervention, it will cause the decrease of
availability of water for Mamminasata metropolitan which has been critical at present. Global Climate
Model provides scenario for the decrease of rain fall at the upstream area of the Jeneberang watershed.
This will increase the scarcity of water in Mamminasata metropolitan. Intervention to land use to
increase covers necessary to be done immediately to make sure the availability of water.

11
REFERENCES
Arsyad, S. (2010). Konservasi Tanah dan Air. Bogor: IPB Press.
BPS Kota Makassar. (2014). Makassar Dalam Angka. Makassar: Badan Pusat Statistik.
Departemen Kehutanan. (2009). Pedoman Monitoring dan Evaluasi Daerah Aliran
Sungai. Jakarta: Direktoral Jenderal Rehabilitasi Lahan dan Perhutanan Sosial.
Kirono, D., McGregor, J., Nguyen, K., Katzfey, J., & Kent, D. (2010). Regional Climate
Change Simulation and Training Workshop on Climate Change Over Eastern
Indonesia and Vietnam. Australia: CSIRO AusAID Research Alliance.
Lillesand, T. M., & Kiefer, R. W. (1997). Penginderaan Jauh dan Interpretasi Citra.
Yogyakarta: Gadjah Mada University Press.
Sutapa, I. (2010). Analisis Potensi Erosi pada Daerah Aliran Sungai (DAS) di Sulawesi
Tengah. SMARTek, 169-181.

12
APPENDIX
Appendix A. Potential Retention in 2014.
Zone Land Cover 2014 Retention
(mm) Description %
Upstream Secondary Dry Land Forest 295.844 Good Condition 17.48
Planted Forest 392.210 Good Condition 23.17
Bare Land 271.205 Medium Condition 16.02
Estate/Plantation 169.333 Critical Condition 10.01
Settlement 128.025 Critical Condition 7.56
Mix Dry Land Agriculture 79.471 Critical Condition 4.70
Paddy Field 97.820 Critical Condition 5.78
Shrub 258.521 Medium Condition 15.28
Total 1,692.429 100
Middle
Stream
Secondary Dry Land Forest 156.779 Rather Critical
Condition
15.94
Planted Forest 328.256 Good Condition 33.37
Bare Land 86.286 Critical Condition 8.77
Estate/Plantation 90.909 Critical Condition 9.24
Settlement 78.918 Critical Condition 8.02
Mix Dry Land Agriculture 114.576 Critical Condition 11.65
Paddy Field 128.060 Critical Condition 13.02
Total 983.784 100
Down
Stream
Secondary Dry Land Forest 119.293 Rather Critical
Condition
28.11
Bare Land 74.304 Critical Condition 17.51
Settlement 67.519 Critical Condition 15.91
Mix Dry Land Agriculture 75.890 Critical Condition s 17.88
Paddy Field 87.445 Critical Condition 20.60
Total 424.451 100

13
Appendix B. Potential Retention in 2030s.
Zone Land Cover 2030 Retention
(mm) Description %
Upstream
Secondary Dry Land Forest 337.844 Good Condition 20.11
Planted Forest 404.733 Good Condition 24.09
Bare Land 262.909 Medium Condition 15.65
Estate/Plantation 169.333 Critical Condition 10.08
Settlement 128.780 Critical Condition 7.66
Mix Dry Land Agriculture 75.056 Critical Condition 4.47
Paddy Field 95.333 Critical Condition 5.67
Shrub 206.194 Medium Condition 12.27
Total 1,680.182 100
Middle
Stream
Secondary Dry Land Forest 146.034 Rather Critical
Condition
15.02
Planted Forest 338.645 Good Condition 34.83
Bare Land 103.489 Critical Condition 10.64
Estate/Plantation 111.106 Critical Condition 11.43
Settlement 70.137 Critical Condition 7.21
Mix Dry Land Agriculture 113.918 Critical Condition 11.72
Paddy Field 88.971 Critical Condition 9.15
Total 972.301 100
Down
Stream
Secondary Dry Land Forest 111.327 Rather Critical
Condition
21.83
Bare Land 78.964 Critical Condition 15.48
Settlement 68.367 Critical Condition 13.41
Mix Dry Land Agriculture 75.501 Critical Condition 14.80
Paddy Field 91.654 Critical Condition 17.97
Shrub 84.175 Critical Condition 16.51
Water 0.000 0.00
Total 509.989 100

14
Appendix C. Land Utility Plan for Bili-Bili Dam Catchment Area as Stated in Gowa Regency Spatial
Plan.
No Land Utility Area (ha) Percentage
1 Conservation Forest 3,187.64 8.30%
2 Protected Forest 3,423.56 8.91%
3 Limited/Conditional Production Forest 6,157.07 16.03%
4 Production Forest 6,252.05 16.28%
5 Agroforestry Area 1,742.76 4.54%
6 Horticulture Area 2,786.35 7.25%
7 Crop Estate Area 4,759.17 12.39%
8 Wet Land Agriculture Area 3,180.05 8.28%
9 Dry Land Agriculture Area 1,405.16 3.66%
10 Regency Protected Area 2,297.05 5.98%
11 Water Area 2,805.65 7.30%
12 Settlement Area 411.83 1.07%
Total 38,408.34 100.00%

15
Appendix D. Land Utility Plan for Bili-Bili Dam Catchment Area.
16
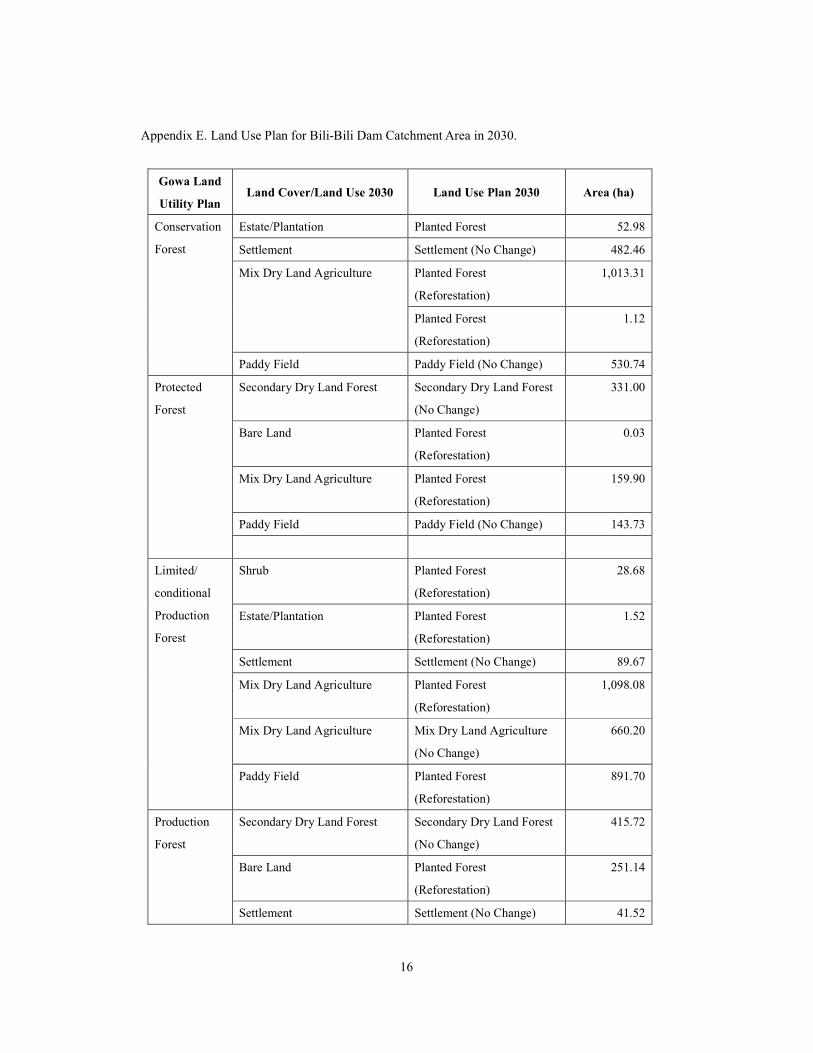
Appendix E. Land Use Plan for Bili-Bili Dam Catchment Area in 2030.
Gowa Land
Utility Plan Land Cover/Land Use 2030 Land Use Plan 2030 Area (ha)
Conservation
Forest
Estate/Plantation Planted Forest 52.98
Settlement Settlement (No Change) 482.46
Mix Dry Land Agriculture Planted Forest
(Reforestation)
1,013.31
Planted Forest
(Reforestation)
1.12
Paddy Field Paddy Field (No Change) 530.74
Protected
Forest
Secondary Dry Land Forest Secondary Dry Land Forest
(No Change)
331.00
Bare Land Planted Forest
(Reforestation)
0.03
Mix Dry Land Agriculture Planted Forest
(Reforestation)
159.90
Paddy Field Paddy Field (No Change) 143.73
Limited/
conditional
Production
Forest
Shrub Planted Forest
(Reforestation)
28.68
Estate/Plantation Planted Forest
(Reforestation)
1.52
Settlement Settlement (No Change) 89.67
Mix Dry Land Agriculture Planted Forest
(Reforestation)
1,098.08
Mix Dry Land Agriculture Mix Dry Land Agriculture
(No Change)
660.20
Paddy Field Planted Forest
(Reforestation)
891.70
Production
Forest
Secondary Dry Land Forest Secondary Dry Land Forest
(No Change)
415.72
Bare Land Planted Forest
(Reforestation)
251.14
Settlement Settlement (No Change) 41.52

17
Gowa Land
Utility Plan Land Cover/Land Use 2030 Land Use Plan 2030 Area (ha)
Mix Dry Land Agriculture Planted Forest
(Reforestation)
3,383.67
Paddy Field Planted Forest
(Reforestation)
1,766.68
Shrub Planted Forest
(Reforestation)
285.80
Agroforestry
Area
Secondary Dry Land Forest Agroforestry 5.09
Bare Land Agroforestry 64.45
Settlement Settlement (No Change) 73.75
Mix Dry Land Agriculture Agroforestry 543.36
Paddy Field Agroforestry 210.33
Paddy Field Paddy Field (No Change) 741.02
Shrub Agroforestry 0.33
Water Water 0.05
Horticulture
Area
Secondary Dry Land Forest Mix Dry Land Agriculture 169.70
Estate/Plantation Mix Dry Land Agriculture 18.19
Settlement Settlement 180.42
Mix Dry Land Agriculture Mix Dry Land Agriculture 816.67
Paddy Field Mix Dry Land Agriculture 1,398.36
Crop Estate
Area
Secondary Dry Land Forest Estate/Plantation 499.86
Bare Land Estate/Plantation 61.69
Estate/Plantation Estate/Plantation 69.68
Settlement Settlement 226.76
Mix Dry Land Agriculture Estate/Plantation 0.26
Mix Dry Land Agriculture Estate/Plantation 1,890.23
Paddy Field Estate/Plantation 1,074.59
Shrub Estate/Plantation 200.71
Water Water 3.12
Wet Land
Agriculture
Area
Secondary Dry Land Forest Paddy Field 21.15
Bare Land Paddy Field 146.38
Settlement n Settlement 357.29
Mix Dry Land Agriculture Paddy Field 398.17
Paddy Field Paddy Field 2,069.16

18
Gowa Land
Utility Plan Land Cover/Land Use 2030 Land Use Plan 2030 Area (ha)
Shrub Paddy Field 38.81
Dry Land
Agriculture
Area
Secondary Dry Land Forest Mix Dry Land Agriculture 1.76
Bare Land Mix Dry Land Agriculture 41.30
Settlement Mix Dry Land Agriculture 34.47
Mix Dry Land Agriculture Mix Dry Land Agriculture 0.35
Mix Dry Land Agriculture Mix Dry Land Agriculture 627.25
Paddy Field Mix Dry Land Agriculture 607.45
Shrub Mix Dry Land Agriculture 0.02
Regency
Protected
Area
Secondary Dry Land Forest Secondary Dry Land Forest 360.65
Bare Land Planted Forest
(Reforestation)
42.88
Settlement Settlement 18.42
Mix Dry Land Agriculture Planted Forest
(Reforestation)
1,265.49
Mix Dry Land Agriculture Planted Forest
(Reforestation)
0.18
Paddy Field Paddy Field 299.30
Shrub Planted Forest
(Reforestation)
109.06
Water Area
Water Water 1.15
Water Water 957.03
Water Water 286.73
Water Water 76.66
Water Water 22.12
Water Water 1,141.70
Settlement
Area
Mix Dry Land Agriculture Settlement 0.25
Bare Land Settlement 0.05
Estate/Plantation Settlement 0.75
Settlement Settlement 161.05
Mix Dry Land Agriculture Mix Dry Land Agriculture 196.86
Paddy Field Settlement 35.98
Shrub Settlement 0.18
Total 29,198.33

19
Appendix F. Land Use Plan in 2030.