march 2016 inflation report - internetowy serwis … · inflation report – march 2016 2 ... 1.5...
TRANSCRIPT
Monetary Policy Council
March 2016
Inflation Report

Inflation Report – March 2016
2
The Inflation Report presents the Monetary Policy Council's assessment of the macroeconomic developments
influencing inflation. The projection of inflation and GDP presented in Chapter 4 was prepared at the
Economic Institute of Narodowy Bank Polski. In terms of the contents, works on the projection were
supervised by Andrzej Sławiński, General Director of the Economic Institute. The projection was prepared
with the use of the NECMOD macroeconomic model. The NBP Management Board approved the
submission of the projection to the Monetary Policy Council. The inflation projection is one of the inputs to
the Monetary Policy Council's decision-making process.
The time frame of the analysis presented in the Report is conditioned by the availability of macroeconomic
data. In turn, the periodisation of the analysis (breakdown into sub-periods) is conditioned by the
development of particular variables. The cut-off date for the data in this Report was 1 March 2016.
This Inflation Report is a translation of Narodowy Bank Polski Raport o inflacji in Polish. In case of
discrepancies, the original prevails.
3
Summary 5
External developments 7
1.1 Economic activity abroad 7
1.2 Inflation developments abroad 9
1.3 Global commodity markets 10
1.4 Monetary policy abroad 11
1.5 International financial markets 12
Box 1: Impact of the monetary policy tightening in the United States on emerging markets 13
Domestic economy 17
2.1 Consumer prices 17
2.2 Demand and output 18
2.3 Financial situation in the enterprise sector 23
2.4 Labour market 24
2.5 Asset markets 25
Box 2: Long-term interest rates in Poland and the term premium 28
2.6 Lending and money supply 30
2.7 Balance of payments 32
Monetary policy in November 2015 – March 2016 35
Projection of inflation and GDP 49
4.1 Summary 50
4.2 External environment 54
4.3 Polish economy in 2016-2018 57
Box 3: The impact of changes in oil prices on the revision to the inflation projection 68
4.4 Current versus previous projection 69
4.5 Forecast uncertainty sources 73
The voting of the Monetary Policy Council members in October 2015 – January 2016 81
Contents

Inflation Report – March 2016
4

Summary
5
Summary
Economic growth in Poland's major trading partners remains moderate, while uncertainty about the
global economic outlook has recently increased. In the euro area, economic recovery has been ongoing for
over two years, driven primarily by rising consumer demand amid improving labour market conditions.
A factor containing the scale of recovery in the euro area and increasing concerns about its outlook is
weaker economic activity in some of the emerging economies. In the United States, growth continues to
outpace that in the euro area, yet it slowed in 2015 H2. In the emerging economies being Poland’s major
trading partners, weak economic conditions continue. Russia and Ukraine remain in recession, and
growth in economic activity in China continues to decelerate gradually.
Deteriorating economic conditions in the emerging economies dragged on demand for many
commodities. This – given high supply of some of them – has led to a sharp fall in prices in global
commodity markets. The fall in commodity prices amid relatively weak global economic growth supports
the sustained very low inflation in the immediate environment of the Polish economy. In particular, in the
euro area, price growth has been close to zero, and in Central and Eastern Europe it remains negative. In
the United States, inflation has risen significantly above zero in recent months, and core inflation has been
close to 2% for over a year. At the same time, in some developing countries – including Russia – inflation
continues at a very high level.
Against this background, monetary policies of the major central banks remain accommodative, albeit to a
varying degree. The European Central Bank (ECB) lowered the interest rates in March and increased the
scale of quantitative easing. In contrast, the Federal Reserve (Fed) in December 2015 raised its interest rates
by 0.25 percentage points. Further interest rate increases by the Fed are still possible, although uncertainty
about the future course of the US monetary policy has increased of late. In the recent period, monetary
policy has been further eased by the Bank of Japan which, among others, has lowered one of its interest
rates below zero, and by the People's Bank of China which has amplified liquidity provision to the
financial sector.
The Fed’s interest rate increase and a renewed rise in concerns about the global growth outlook boosted
uncertainty in international financial markets. Mounting concerns of investors were reflected in growing
yields on government bonds of the emerging economies and declining yields on government bonds issued
by the major economies, traditionally perceived as safe assets. This was accompanied by falling stock
market indices worldwide.
In Poland, deflation continues, although at present its pace is slower than in the previous quarters. The
decline in prices is mainly driven by external factors, primarily falls in global commodity prices and low
price growth in Poland’s external environment. The deflation is also supported by the absence of demand
and cost pressures at home. Continued stable economic growth and robust labour market are likely to lead
to a gradual rise in prices. As a result, in 2016 inflation should be higher than in 2015, while still being
curbed by the negative impact of the previous falls in commodity prices.
The Polish economy continues to grow at a stable pace, which even accelerated slightly in 2015 H2.
Growing consumer demand, supported by rising employment and wages as well as positive households’
Inflation Report – March 2016
6
sentiment, continues to be the main driver of economic growth. GDP growth is also fuelled by higher
corporate investment expenditure, a marked rise in household spending on housing and export growth. In
turn, decline in investment expenditure by local governments, related to lower scale of UE-financed
projects, has a dragging effect on GDP growth.
Robust labour market and favourable financial position of the enterprise sector, amid lower interest on
loans than in the previous years, support steady growth in lending in the economy.
The Monetary Policy Council has been keeping the NBP interest rates unchanged. Yet, market
participants’ expectations point to the possibility of interest rate cut in 2016. This notwithstanding, yields
on Polish government bonds have recently increased. Higher bond yields, the accompanying decline in
stock prices on the Warsaw Stock Exchange and the zloty depreciation – all were largely driven by
external factors, mainly heightened uncertainty in the international financial markets. Yet, domestic
factors also had a negative impact on the prices of Polish financial assets.
High price competitiveness of the Polish economy, coupled with economic recovery in the euro area, have
been conducive to a rise in Polish exports. At the same time, sound economic conditions in Poland are
supportive of import growth and translate into high income of foreign direct investors. As a result, 2016
H2 posted a slight deficit in the combined current and capital account. Nevertheless, the majority of
external imbalance indicators remain favourable, and the current account to GDP ratio has reached its
record high since 1995.
The Report is structured as follows: Chapter 1 presents the analysis of economic conditions in the external
environment of the Polish economy in terms of their impact on inflation developments in Poland. These
developments and the domestic factors that might affect them have been described in Chapter 2. Minutes
of the Monetary Policy Council decision-making meetings held in November 2015 – February 2016, together
with the Information from the meeting of the Monetary Policy Council in March 2016 are presented in Chapter
3. Minutes of the MPC meeting held in November will be published on 17 March 2016 and so will be
included in the next Report. The MPC voting records in meetings held in October 2015 – January 2016 can
be found in Chapter 5. This Report also includes three boxes: Impact of monetary policy tightening in the
United States on the emerging markets, Long-term interest rates in Poland and the term-premium and The impact of
changes in oil prices on the revision to the inflation projection.
Chapter 4 of the Report presents the projection of inflation and GDP based on the NECMOD model, which
is one of the inputs into the Council's decision-making process on the NBP interest rates. In line with the
March projection – prepared under the assumption of unchanged NBP interest rates and taking into
account data available until 23 February 2016 – there is a 50-per cent probability that the annual price
growth will be in the range of -0.9 – 0.2% in 2016 (compared to 0.4 – 1.8% in November 2015 projection),
0.2– 2.3% in 2017 (as against 0.4 – 2.5%) and 0.4 – 2.8% in 2018. At the same time, the annual GDP growth –
in line with this projection – will be, with a 50-per cent probability, in the range of 3.0 – 4.5% in 2016 (as
compared to 2.3 – 4.3% in the November 2015 projection), 2.6 – 4.8% in 2017 (as against 2.4 – 4.6%) and 2.1
– 4.4% in 2018.

1. External developments
7
External developments
1.1 Economic activity abroad
Economic growth in Poland's major trading
partners remains moderate (Figure 1.1). In
addition, uncertainty about the global economic
outlook has increased of late, mainly due to a
weaker activity in the largest emerging market
economies.
In the euro area, economic recovery has been
ongoing for over two years, driven primarily by
improving labour market conditions and good
consumer sentiment, which translate into higher
consumer demand. GDP growth is also supported
by a gradual increase in investment and
consumption expenditure of the general
government. Both are bolstered by an increase in
credit availability and lower government bond
yields resulting from expansionary monetary
policy of the EBC, including the asset purchases
conducted since 2015 Q1 (Figure 1.2). Despite the
moderate economic recovery in the euro area, GDP
returned to its pre-crisis level only in 2015 H2
(Figure 1.3).
Activity in the euro area is still constrained by
private and public debt, which remains high in
many euro area member states. As a result, growth
in investment and government expenditure
remains relatively low in these countries. Since
mid-2015, investment growth in the euro area has
additionally been limited by an increase in
uncertainty about the outlook for the largest
emerging market economies. Deteriorating
economic conditions in the major emerging market
economies affect also euro area’s exports, both to
these economies and to some Central and Eastern
European countries which are linked with the euro
area export sector through global supply chains. In
Figure 1.1 GDP growth in Poland’s major trading partners (y/y)
Source: NBP compilation based on data provided by national
statistical offices and Eurostat. Average annual GDP growth in Poland’s major trading partners, which
comprise 80% of Polish exports (euro area, United Kingdom, Czech Republic,
Russia, Sweden, Hungary, United States, Ukraine, Turkey and Romania),
weighed by share in Polish exports in the first 11 months of 2015.
Figure 1.2 Components of GDP growth in the euro area (y/y)
Source: Eurostat data.
Figure 1.3 Chained volume GDP in advanced economies (index,
2001 Q1 = 100)
Source: NBP compilation based on data provided by national
statistical offices, Bloomberg, IMF and Eurostat. Other advanced economies – economies comprising 80% of advanced
economies’ GDP, excluding the United States and the euro area (Australia,
Canada, Korea, Sweden, Switzerland and United Kingdom), GDP-weighted
average.
-8
-6
-4
-2
0
2
4
6
8
-8
-6
-4
-2
0
2
4
6
8
01q1 04q1 07q1 10q1 13q1
per cent
euro area
Major trading partners
Germany
-8
-6
-4
-2
0
2
4
6
-8
-6
-4
-2
0
2
4
6
01q1 04q1 07q1 10q1 13q1
per cent
Net exports
Inventories
Investment
Private consumption
Public consumption
100
110
120
130
140
150
100
110
120
130
140
150
01q1 04q1 07q1 10q1 13q1
euro area
United States
Other advanced economies

Inflation Report – March 2016
8
2015 H2, export growth in the euro area slowed
down, most markedly in Germany. Nonetheless,
economic growth in this country continued to
accelerate due to rising domestic demand.
The gradual economic recovery in the euro area,
particularly in Germany, contributed to a further
increase in GDP growth in Central and Eastern
European countries (Figure 1.4). This
notwithstanding, the main driver of economic
growth in this region was a further increase in
consumer demand. In some Central and Eastern
European countries, GDP growth was also
supported by an acceleration in investment
expenditure growth related to a higher use of EU
funds.
In the United States, economic growth slowed
down in 2015 H2, but it remains higher than in the
euro area. GDP growth was contained by lower
investment in the mining sector and – to a lesser
extent – by weaker industrial activity, particularly
of exporters, which was partly associated with a
strong appreciation of the United States dollar in
2015. However, GDP growth in the United States is
still supported by improving labour market
conditions, good consumer sentiment and real
estate prices remaining at the highest level since
2007. Another important factor behind the growth
in economic activity, especially investment, is still
low cost of credit for enterprises and households,
as the Federal Reserve's monetary policy remains
accommodative despite an increase in its interest
rates (see chapter 1.4 Monetary policy abroad).
In the emerging market economies that are
important trading partners of Poland, economic
conditions remain weak (Figure 1.5). Russia and
Ukraine are in recession. In turn, in China
economic growth continues to slow down
gradually. In 2015 it reached the lowest level in 25
years, yet still higher than in many other emerging
market economies. The primary cause of the
decline in GDP growth in China is lower
Figure 1.4 GDP growth the CEE countries (y/y)
Source: Eurostat data, NBP calculations. GDP-weighted annual growth in Bulgaria, Croatia, Czech Republic, Estonia,
Lithuania, Latvia, Romania, Slovakia, Slovenia and Hungary.
Figure 1.5 GDP growth in selected emerging market economies
(y/y)
Source: Bloomberg data.
Figure 1.6 GDP growth in China and its components (y/y)
Source: NBP compilation based on data provided by the Chinese
national statistical office.
-10
-5
0
5
10
-10
-5
0
5
10
01q1 04q1 07q1 10q1 13q1
per cent
-20
-15
-10
-5
0
5
10
15
20
-20
-15
-10
-5
0
5
10
15
20
01q1 04q1 07q1 10q1 13q1
per cent
China Russia Ukraine
-6
-3
0
3
6
9
12
15
-6
-3
0
3
6
9
12
15
2001 2004 2007 2010 2013
per cent
Net exportsConsumer expendituresInvestment expendituresGDP growth
1. External developments
9
investment growth, resulting mainly from
substantial oversupply in the real estate market
and relatively high private debt. Therefore,
economic growth can hardly be stimulated with
further expansion of corporate debt. This adds to a
gradual decline in export growth, which has been
an important factor behind the slowdown in China
for several years. Weaker export growth can be
explained with falling cost competitiveness of
China and relatively low economic growth abroad
following the global financial crisis. In addition,
the options to prop up economic growth in China
by means of higher fiscal expansion are limited,
given a rise in public debt in recent years (Figure
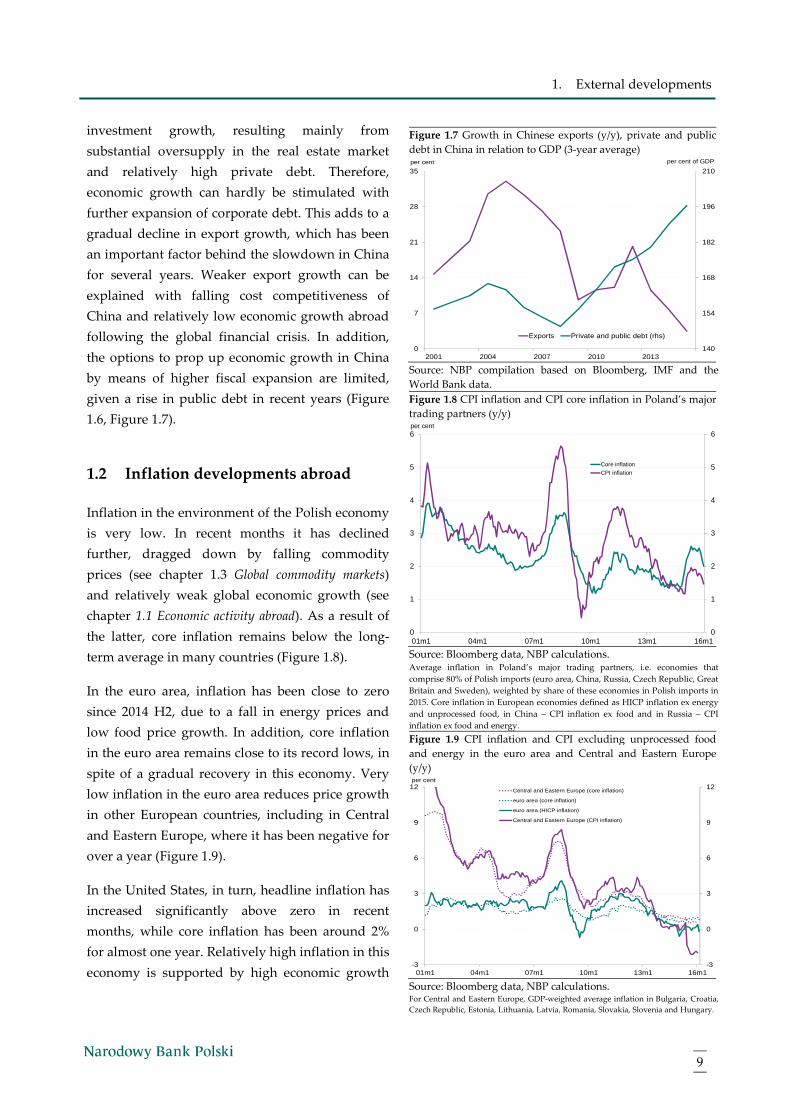
1.6, Figure 1.7).
1.2 Inflation developments abroad
Inflation in the environment of the Polish economy
is very low. In recent months it has declined
further, dragged down by falling commodity
prices (see chapter 1.3 Global commodity markets)
and relatively weak global economic growth (see
chapter 1.1 Economic activity abroad). As a result of
the latter, core inflation remains below the long-
term average in many countries (Figure 1.8).
In the euro area, inflation has been close to zero
since 2014 H2, due to a fall in energy prices and
low food price growth. In addition, core inflation
in the euro area remains close to its record lows, in
spite of a gradual recovery in this economy. Very
low inflation in the euro area reduces price growth
in other European countries, including in Central
and Eastern Europe, where it has been negative for
over a year (Figure 1.9).
In the United States, in turn, headline inflation has
increased significantly above zero in recent
months, while core inflation has been around 2%
for almost one year. Relatively high inflation in this
economy is supported by high economic growth
Figure 1.7 Growth in Chinese exports (y/y), private and public
debt in China in relation to GDP (3-year average)
Source: NBP compilation based on Bloomberg, IMF and the
World Bank data.
Figure 1.8 CPI inflation and CPI core inflation in Poland’s major
trading partners (y/y)
Source: Bloomberg data, NBP calculations. Average inflation in Poland’s major trading partners, i.e. economies that
comprise 80% of Polish imports (euro area, China, Russia, Czech Republic, Great
Britain and Sweden), weighted by share of these economies in Polish imports in
2015. Core inflation in European economies defined as HICP inflation ex energy
and unprocessed food, in China – CPI inflation ex food and in Russia – CPI
inflation ex food and energy.
Figure 1.9 CPI inflation and CPI excluding unprocessed food
and energy in the euro area and Central and Eastern Europe
(y/y)
Source: Bloomberg data, NBP calculations. For Central and Eastern Europe, GDP-weighted average inflation in Bulgaria, Croatia,
Czech Republic, Estonia, Lithuania, Latvia, Romania, Slovakia, Slovenia and Hungary.
140
154
168
182
196
210
0
7
14
21
28
35
2001 2004 2007 2010 2013
per cent of GDPper cent
Exports Private and public debt (rhs)
0
1
2
3
4
5
6
0
1
2
3
4
5
6
01m1 04m1 07m1 10m1 13m1 16m1
per cent
Core inflation
CPI inflation
-3
0
3
6
9
12
-3
0
3
6
9
12
01m1 04m1 07m1 10m1 13m1 16m1
per cent
Central and Eastern Europe (core inflation)
euro area (core inflation)
euro area (HICP inflation)
Central and Eastern Europe (CPI inflation)
Inflation Report – March 2016
10
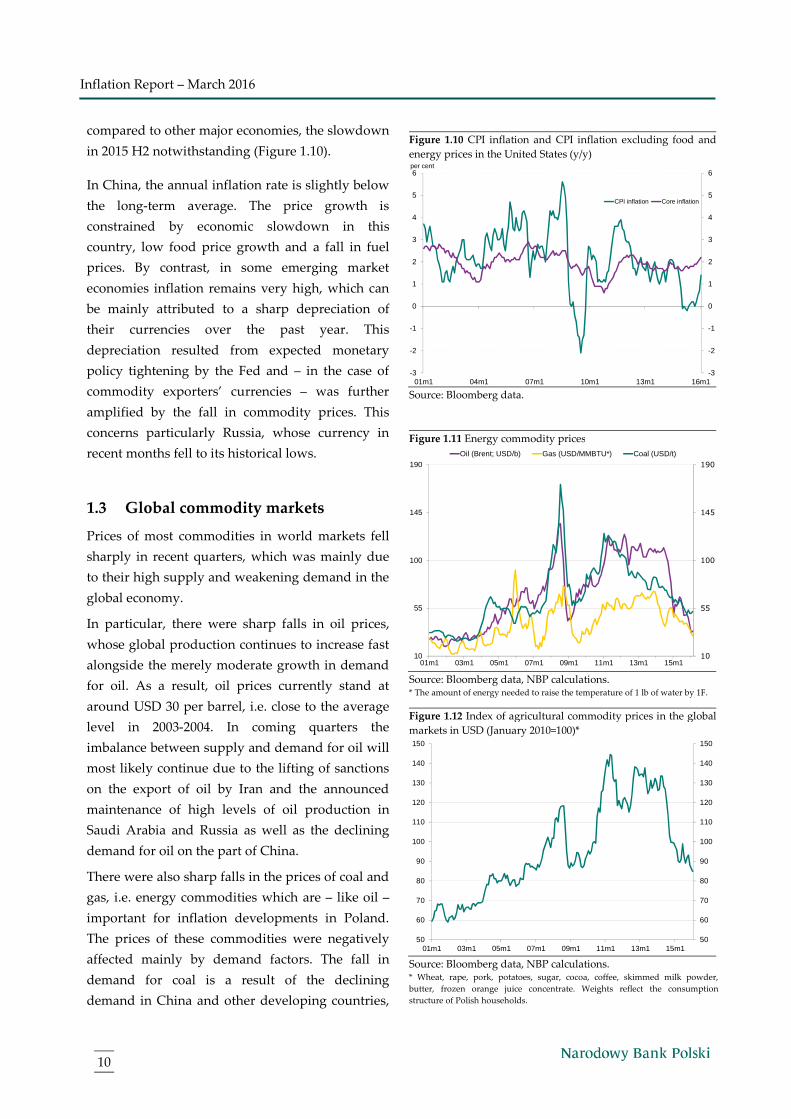
compared to other major economies, the slowdown
in 2015 H2 notwithstanding (Figure 1.10).
In China, the annual inflation rate is slightly below
the long-term average. The price growth is
constrained by economic slowdown in this
country, low food price growth and a fall in fuel
prices. By contrast, in some emerging market
economies inflation remains very high, which can
be mainly attributed to a sharp depreciation of
their currencies over the past year. This
depreciation resulted from expected monetary
policy tightening by the Fed and – in the case of
commodity exporters’ currencies – was further
amplified by the fall in commodity prices. This
concerns particularly Russia, whose currency in
recent months fell to its historical lows.
1.3 Global commodity markets
Prices of most commodities in world markets fell
sharply in recent quarters, which was mainly due
to their high supply and weakening demand in the
global economy.
In particular, there were sharp falls in oil prices,
whose global production continues to increase fast
alongside the merely moderate growth in demand
for oil. As a result, oil prices currently stand at
around USD 30 per barrel, i.e. close to the average
level in 2003-2004. In coming quarters the
imbalance between supply and demand for oil will
most likely continue due to the lifting of sanctions
on the export of oil by Iran and the announced
maintenance of high levels of oil production in
Saudi Arabia and Russia as well as the declining
demand for oil on the part of China.
There were also sharp falls in the prices of coal and
gas, i.e. energy commodities which are – like oil –
important for inflation developments in Poland.
The prices of these commodities were negatively
affected mainly by demand factors. The fall in
demand for coal is a result of the declining
demand in China and other developing countries,
Figure 1.10 CPI inflation and CPI inflation excluding food and
energy prices in the United States (y/y)
Source: Bloomberg data.
Figure 1.11 Energy commodity prices
Source: Bloomberg data, NBP calculations. * The amount of energy needed to raise the temperature of 1 lb of water by 1F.
Figure 1.12 Index of agricultural commodity prices in the global
markets in USD (January 2010=100)*
Source: Bloomberg data, NBP calculations. * Wheat, rape, pork, potatoes, sugar, cocoa, coffee, skimmed milk powder,
butter, frozen orange juice concentrate. Weights reflect the consumption
structure of Polish households.
-3
-2
-1
0
1
2
3
4
5
6
-3
-2
-1
0
1
2
3
4
5
6
01m1 04m1 07m1 10m1 13m1 16m1
per cent
CPI inflation Core inflation
10
55
100
145
190
10
55
100
145
190
01m1 03m1 05m1 07m1 09m1 11m1 13m1 15m1
Oil (Brent; USD/b) Gas (USD/MMBTU*) Coal (USD/t)
50
60
70
80
90
100
110
120
130
140
150
50
60
70
80
90
100
110
120
130
140
150
01m1 03m1 05m1 07m1 09m1 11m1 13m1 15m1
1. External developments
11
the restrictive climate policy and the fall in the
prices of alternative energy sources. In turn, the fall
in demand for natural gas is driven by its limited
use for heating purposes due to the relatively
warm winter in Europe (Figure 1.11).
Agricultural commodity prices also remain
relatively low, although in recent months their
decline was weaker and not all commodities were
affected. In particular – amid continuing high
supply – there were falls in the prices of meat,
dairy products and wheat.
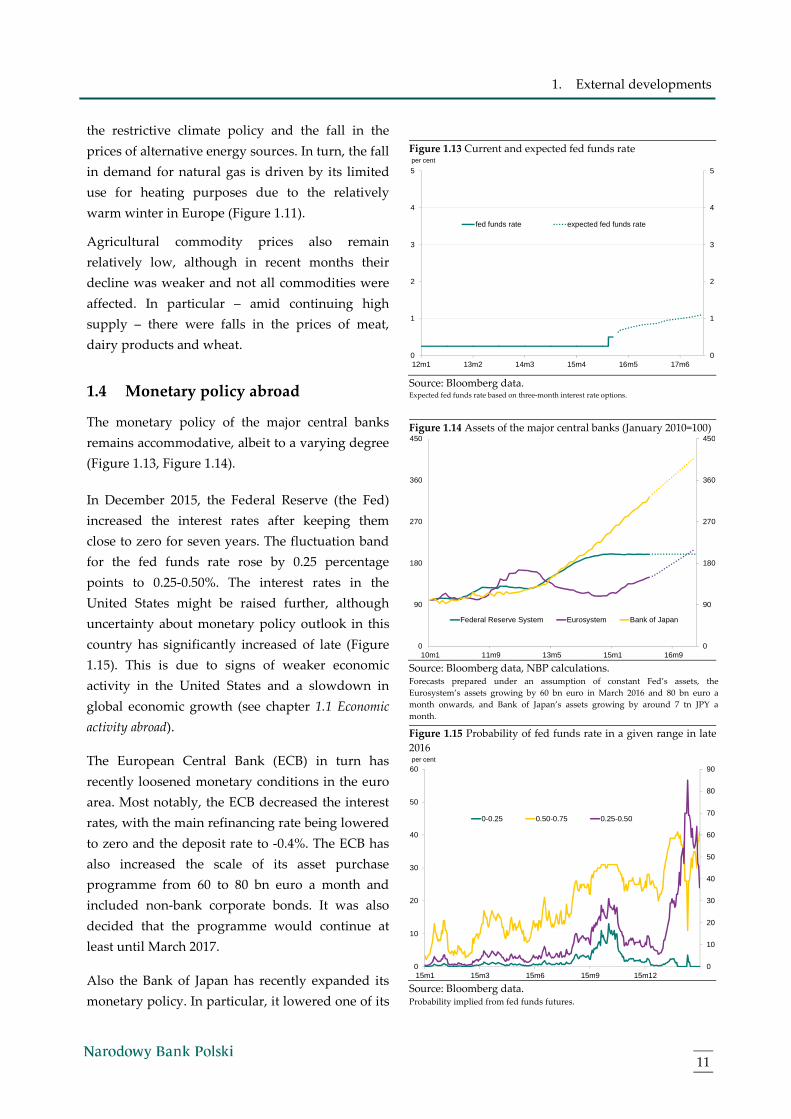
1.4 Monetary policy abroad
The monetary policy of the major central banks
remains accommodative, albeit to a varying degree
(Figure 1.13, Figure 1.14).
In December 2015, the Federal Reserve (the Fed)
increased the interest rates after keeping them
close to zero for seven years. The fluctuation band
for the fed funds rate rose by 0.25 percentage
points to 0.25-0.50%. The interest rates in the
United States might be raised further, although
uncertainty about monetary policy outlook in this
country has significantly increased of late (Figure
1.15). This is due to signs of weaker economic
activity in the United States and a slowdown in
global economic growth (see chapter 1.1 Economic
activity abroad).
The European Central Bank (ECB) in turn has
recently loosened monetary conditions in the euro
area. Most notably, the ECB decreased the interest
rates, with the main refinancing rate being lowered
to zero and the deposit rate to -0.4%. The ECB has
also increased the scale of its asset purchase
programme from 60 to 80 bn euro a month and
included non-bank corporate bonds. It was also
decided that the programme would continue at
least until March 2017.
Also the Bank of Japan has recently expanded its
monetary policy. In particular, it lowered one of its
Figure 1.13 Current and expected fed funds rate
Source: Bloomberg data. Expected fed funds rate based on three-month interest rate options.
Figure 1.14 Assets of the major central banks (January 2010=100)
Source: Bloomberg data, NBP calculations. Forecasts prepared under an assumption of constant Fed’s assets, the
Eurosystem’s assets growing by 60 bn euro in March 2016 and 80 bn euro a
month onwards, and Bank of Japan’s assets growing by around 7 tn JPY a
month.
Figure 1.15 Probability of fed funds rate in a given range in late
2016
Source: Bloomberg data. Probability implied from fed funds futures.
0
1
2
3
4
5
0
1
2
3
4
5
12m1 13m2 14m3 15m4 16m5 17m6
per cent
fed funds rate expected fed funds rate
0
90
180
270
360
450
0
90
180
270
360
450
10m1 11m9 13m5 15m1 16m9
Federal Reserve System Eurosystem Bank of Japan
0
10
20
30
40
50
60
70
80
90
0
10
20
30
40
50
60
15m1 15m3 15m6 15m9 15m12
per cent
0-0.25 0.50-0.75 0.25-0.50
Inflation Report – March 2016
12
interest rates below zero (to -0.10%), increased the
range of purchased assets and extended their
average maturity.
Monetary policy easing continued also in China,
where the central bank increased the liquidity
provision to the financial sector and cut the reserve
requirement ratio again. In addition, the Chinese
central bank is modifying the yuan’s currency
regime, allowing for greater fluctuations of its
currency against the US dollar, due to significant
costs of currency interventions. In the last two
years, the level of Chinese foreign exchange
reserves fell by around 20%. The change in the
yuan’s currency regime was also encouraged by
the IMF in the recommendations issued prior to
the decision to include this currency in the SDR
basket.
Monetary policy of other central banks was
increasingly divergent in recent months. This
reflected – on the one hand – differences in the
degree of monetary policy accommodation in the
core economies and – on the other hand – the
resilience of individual countries in the face of
these differences, as well as growing risk aversion
in the international financial markets and falling
commodity prices. In some countries, mainly in
Latin America, central banks have tightened their
monetary policy. In turn, in Europe and Asia
interest rates have been lowered or kept at
historical lows. In a majority of European
economies, interest rates are close to zero. In
addition, some central banks in Europe resort to
unconventional monetary policy. For instance, the
Riksbank is purchasing government bonds, while
the Czech National Bank is keeping an exchange
rate floor.
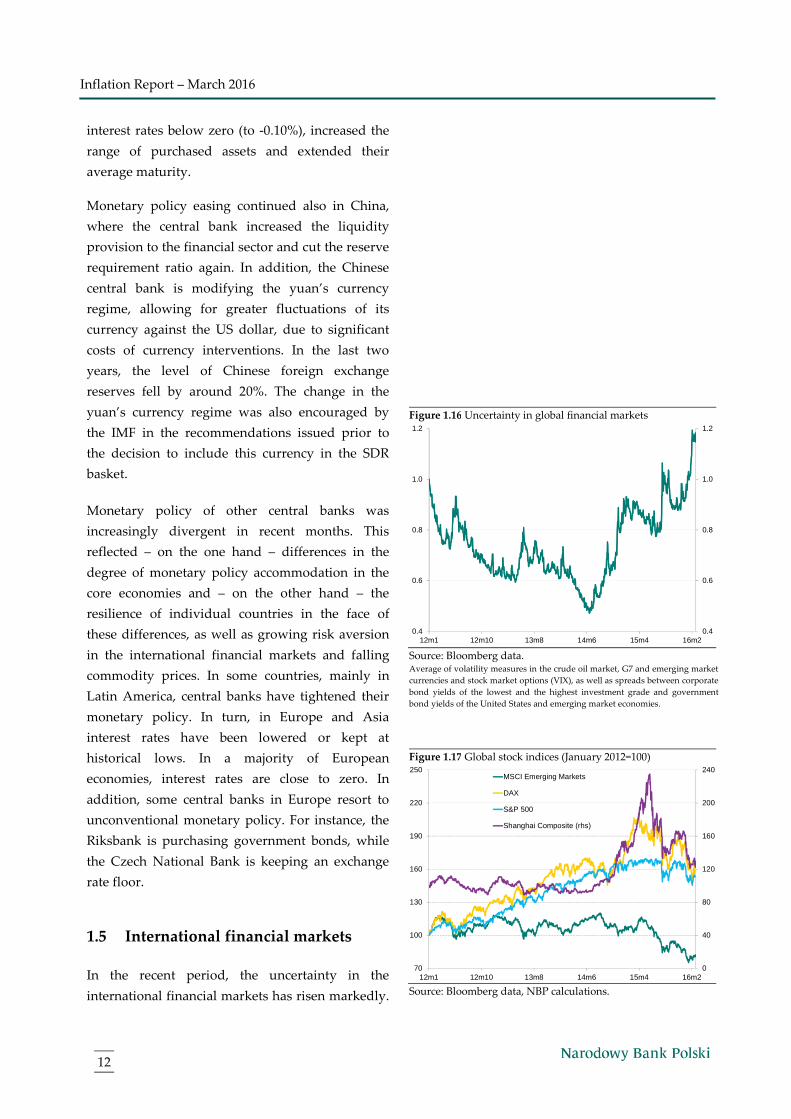
1.5 International financial markets
In the recent period, the uncertainty in the
international financial markets has risen markedly.
Figure 1.16 Uncertainty in global financial markets
Source: Bloomberg data. Average of volatility measures in the crude oil market, G7 and emerging market
currencies and stock market options (VIX), as well as spreads between corporate
bond yields of the lowest and the highest investment grade and government
bond yields of the United States and emerging market economies.
Figure 1.17 Global stock indices (January 2012=100)
Source: Bloomberg data, NBP calculations.
0.4
0.6
0.8
1.0
1.2
0.4
0.6
0.8
1.0
1.2
12m1 12m10 13m8 14m6 15m4 16m2
0
40
80
120
160
200
240
70
100
130
160
190
220
250
12m1 12m10 13m8 14m6 15m4 16m2
MSCI Emerging Markets
DAX
S&P 500
Shanghai Composite (rhs)

1. External developments
13
Initially, this was due to monetary policy
tightening in the United States (see Box 1: Impact of
the monetary policy tightening in the United States on
emerging markets). The uncertainty in global
financial markets was further amplified by
growing concerns about the economic outlook,
particularly in China and net commodity
exporters, but also in the United States. In the case
of China, an additional source of uncertainty was
future economic policy, particularly about
modification of the currency regime.
Elevated concerns were reflected in a rise in
emerging market government bond yields and a
fall in world stock market indices, both in
advanced and emerging market economies (Figure
1.16, Figure 1.17, Figure 1.18). In Europe, another
factor behind the sharp decline in stock indices
was smaller than expected scale of monetary
easing by the ECB in December 2015.
An increase in volatility in the international
financial markets as well as heightened uncertainty
about the global economic outlook and low global
inflation are reflected in falling yields on
government bonds of major economies, which are
perceived as safe assets.
Figure 1.18 Selected emerging market exchange rates in relation
to the United States dollar (January 2012=100, rise indicates
depreciation)
Source: Bloomberg data, NBP calculations.
Figure 1.19 10-year government bond yields in selected
advanced and emerging market economies
Source: Bloomberg data. For emerging market economies – GDP-weighted average of 10-year
government bond yields of Brazil, Russia, India, China, South Africa, Indonesia,
Malaysia, Philippines, Mexico, Peru, Colombia, Chile, Hungary, Romania and
Turkey.
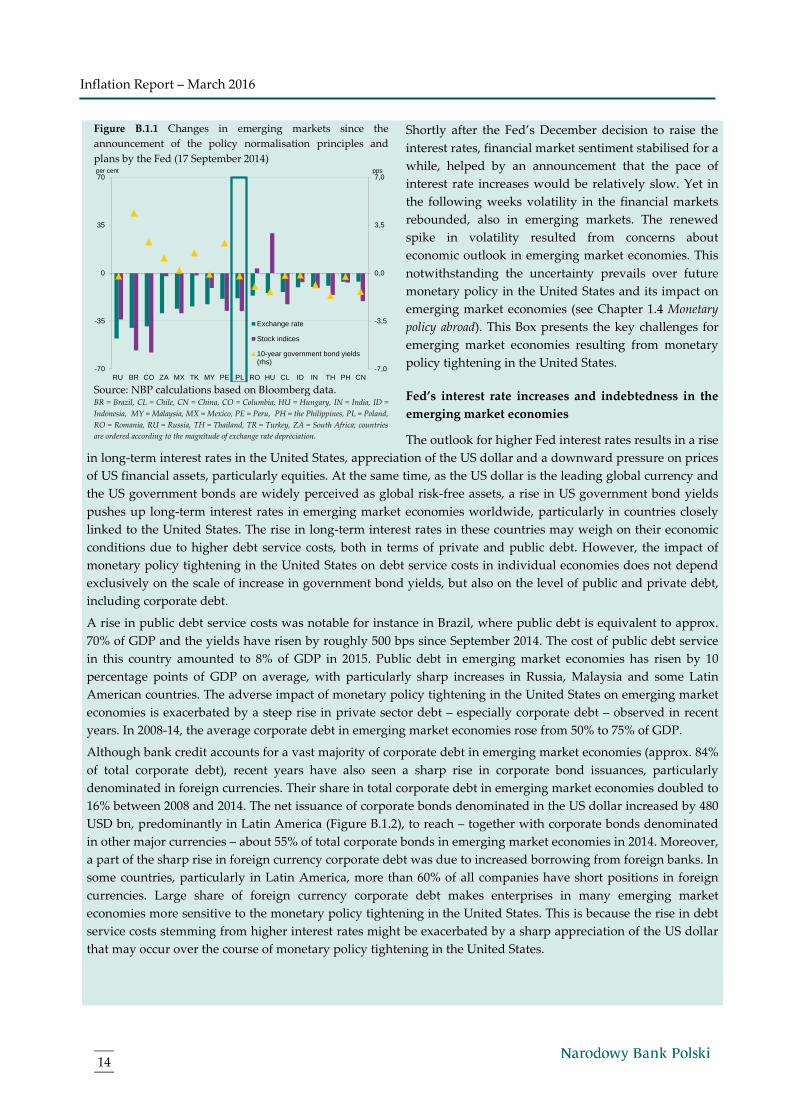
Box 1: Impact of the monetary policy tightening in the United States on emerging markets
In December 2015, the Fed increased its interest rates for the first time since 2006. The decision followed a
prolonged period of highly expansionary monetary policy in the United States, which for six years included also
financial asset purchases. As the Fed indicated a willingness to conclude the asset purchase programme (QE
taper tantrum) and – following that – pointed to likely interest rate increases, risk premia in international
financial markets rose sharply. The rise was particularly pronounced in emerging market economies, which
experienced the most remarkable capital outflows on record. Consequently, most emerging market currencies
weakened substantially against the US dollar, which resulted in a significant rise in inflation in these countries.
Moreover, prices of their financial assets, including equities as well as government and corporate bonds,
declined significantly (Figure B.1.1, Figure B.1.3).
85
90
95
100
105
110
85
90
95
100
105
110
12m1 12m10 13m8 14m6 15m4
Emerging market currencies
Chinese yuan
5.0
5.3
5.6
5.9
6.2
6.5
6.8
7.1
7.4
0.0
0.5
1.0
1.5
2.0
2.5
3.0
3.5
12m1 12m12 13m12 14m11 15m11
per cent
United StatesGermanyEmerging market economies (weighted average, rhs)
Inflation Report – March 2016
14
Shortly after the Fed’s December decision to raise the
interest rates, financial market sentiment stabilised for a
while, helped by an announcement that the pace of
interest rate increases would be relatively slow. Yet in
the following weeks volatility in the financial markets
rebounded, also in emerging markets. The renewed
spike in volatility resulted from concerns about
economic outlook in emerging market economies. This
notwithstanding the uncertainty prevails over future
monetary policy in the United States and its impact on
emerging market economies (see Chapter 1.4 Monetary
policy abroad). This Box presents the key challenges for
emerging market economies resulting from monetary
policy tightening in the United States.
Fed’s interest rate increases and indebtedness in the
emerging market economies
The outlook for higher Fed interest rates results in a rise
in long-term interest rates in the United States, appreciation of the US dollar and a downward pressure on prices
of US financial assets, particularly equities. At the same time, as the US dollar is the leading global currency and
the US government bonds are widely perceived as global risk-free assets, a rise in US government bond yields
pushes up long-term interest rates in emerging market economies worldwide, particularly in countries closely
linked to the United States. The rise in long-term interest rates in these countries may weigh on their economic
conditions due to higher debt service costs, both in terms of private and public debt. However, the impact of
monetary policy tightening in the United States on debt service costs in individual economies does not depend
exclusively on the scale of increase in government bond yields, but also on the level of public and private debt,
including corporate debt.
A rise in public debt service costs was notable for instance in Brazil, where public debt is equivalent to approx.
70% of GDP and the yields have risen by roughly 500 bps since September 2014. The cost of public debt service
in this country amounted to 8% of GDP in 2015. Public debt in emerging market economies has risen by 10
percentage points of GDP on average, with particularly sharp increases in Russia, Malaysia and some Latin
American countries. The adverse impact of monetary policy tightening in the United States on emerging market
economies is exacerbated by a steep rise in private sector debt – especially corporate debt – observed in recent
years. In 2008-14, the average corporate debt in emerging market economies rose from 50% to 75% of GDP.
Although bank credit accounts for a vast majority of corporate debt in emerging market economies (approx. 84%
of total corporate debt), recent years have also seen a sharp rise in corporate bond issuances, particularly
denominated in foreign currencies. Their share in total corporate debt in emerging market economies doubled to
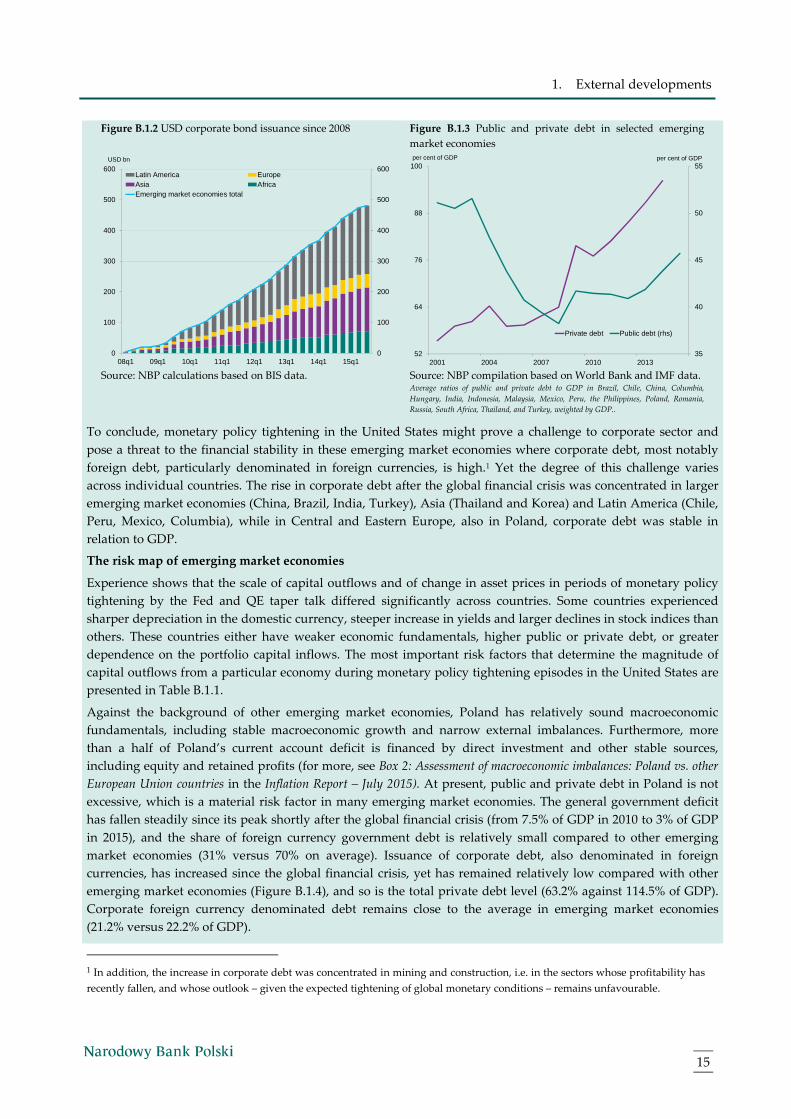
16% between 2008 and 2014. The net issuance of corporate bonds denominated in the US dollar increased by 480
USD bn, predominantly in Latin America (Figure B.1.2), to reach – together with corporate bonds denominated
in other major currencies – about 55% of total corporate bonds in emerging market economies in 2014. Moreover,
a part of the sharp rise in foreign currency corporate debt was due to increased borrowing from foreign banks. In
some countries, particularly in Latin America, more than 60% of all companies have short positions in foreign
currencies. Large share of foreign currency corporate debt makes enterprises in many emerging market
economies more sensitive to the monetary policy tightening in the United States. This is because the rise in debt
service costs stemming from higher interest rates might be exacerbated by a sharp appreciation of the US dollar
that may occur over the course of monetary policy tightening in the United States.
Figure B.1.1 Changes in emerging markets since the
announcement of the policy normalisation principles and
plans by the Fed (17 September 2014)
Source: NBP calculations based on Bloomberg data. BR = Brazil, CL = Chile, CN = China, CO = Columbia, HU = Hungary, IN = India, ID =
Indonesia, MY = Malaysia, MX = Mexico, PE = Peru, PH = the Philippines, PL = Poland,
RO = Romania, RU = Russia, TH = Thailand, TR = Turkey, ZA = South Africa; countries
are ordered according to the magnitude of exchange rate depreciation.
-7,0
-3,5
0,0
3,5
7,0
-70
-35
0
35
70
RU BR CO ZA MX TK MY PE PL RO HU CL ID IN TH PH CN
ppsper cent
Exchange rate
Stock indices
10-year government bond yields(rhs)
1. External developments
15
Figure B.1.2 USD corporate bond issuance since 2008 Figure B.1.3 Public and private debt in selected emerging
market economies
Source: NBP calculations based on BIS data.
Source: NBP compilation based on World Bank and IMF data. Average ratios of public and private debt to GDP in Brazil, Chile, China, Columbia,
Hungary, India, Indonesia, Malaysia, Mexico, Peru, the Philippines, Poland, Romania,
Russia, South Africa, Thailand, and Turkey, weighted by GDP..
To conclude, monetary policy tightening in the United States might prove a challenge to corporate sector and
pose a threat to the financial stability in these emerging market economies where corporate debt, most notably
foreign debt, particularly denominated in foreign currencies, is high.1 Yet the degree of this challenge varies
across individual countries. The rise in corporate debt after the global financial crisis was concentrated in larger
emerging market economies (China, Brazil, India, Turkey), Asia (Thailand and Korea) and Latin America (Chile,
Peru, Mexico, Columbia), while in Central and Eastern Europe, also in Poland, corporate debt was stable in
relation to GDP.
The risk map of emerging market economies
Experience shows that the scale of capital outflows and of change in asset prices in periods of monetary policy
tightening by the Fed and QE taper talk differed significantly across countries. Some countries experienced
sharper depreciation in the domestic currency, steeper increase in yields and larger declines in stock indices than
others. These countries either have weaker economic fundamentals, higher public or private debt, or greater
dependence on the portfolio capital inflows. The most important risk factors that determine the magnitude of
capital outflows from a particular economy during monetary policy tightening episodes in the United States are
presented in Table B.1.1.
Against the background of other emerging market economies, Poland has relatively sound macroeconomic
fundamentals, including stable macroeconomic growth and narrow external imbalances. Furthermore, more
than a half of Poland’s current account deficit is financed by direct investment and other stable sources,
including equity and retained profits (for more, see Box 2: Assessment of macroeconomic imbalances: Poland vs. other
European Union countries in the Inflation Report – July 2015). At present, public and private debt in Poland is not
excessive, which is a material risk factor in many emerging market economies. The general government deficit
has fallen steadily since its peak shortly after the global financial crisis (from 7.5% of GDP in 2010 to 3% of GDP
in 2015), and the share of foreign currency government debt is relatively small compared to other emerging
market economies (31% versus 70% on average). Issuance of corporate debt, also denominated in foreign
currencies, has increased since the global financial crisis, yet has remained relatively low compared with other
emerging market economies (Figure B.1.4), and so is the total private debt level (63.2% against 114.5% of GDP).
Corporate foreign currency denominated debt remains close to the average in emerging market economies
(21.2% versus 22.2% of GDP).
1 In addition, the increase in corporate debt was concentrated in mining and construction, i.e. in the sectors whose profitability has
recently fallen, and whose outlook – given the expected tightening of global monetary conditions – remains unfavourable.
0
100
200
300
400
500
600
0
100
200
300
400
500
600
08q1 09q1 10q1 11q1 12q1 13q1 14q1 15q1
USD bn
Latin America EuropeAsia AfricaEmerging market economies total
35
40
45
50
55
52
64
76
88
100
2001 2004 2007 2010 2013
per cent of GDPper cent of GDP
Private debt Public debt (rhs)
Inflation Report – March 2016
16
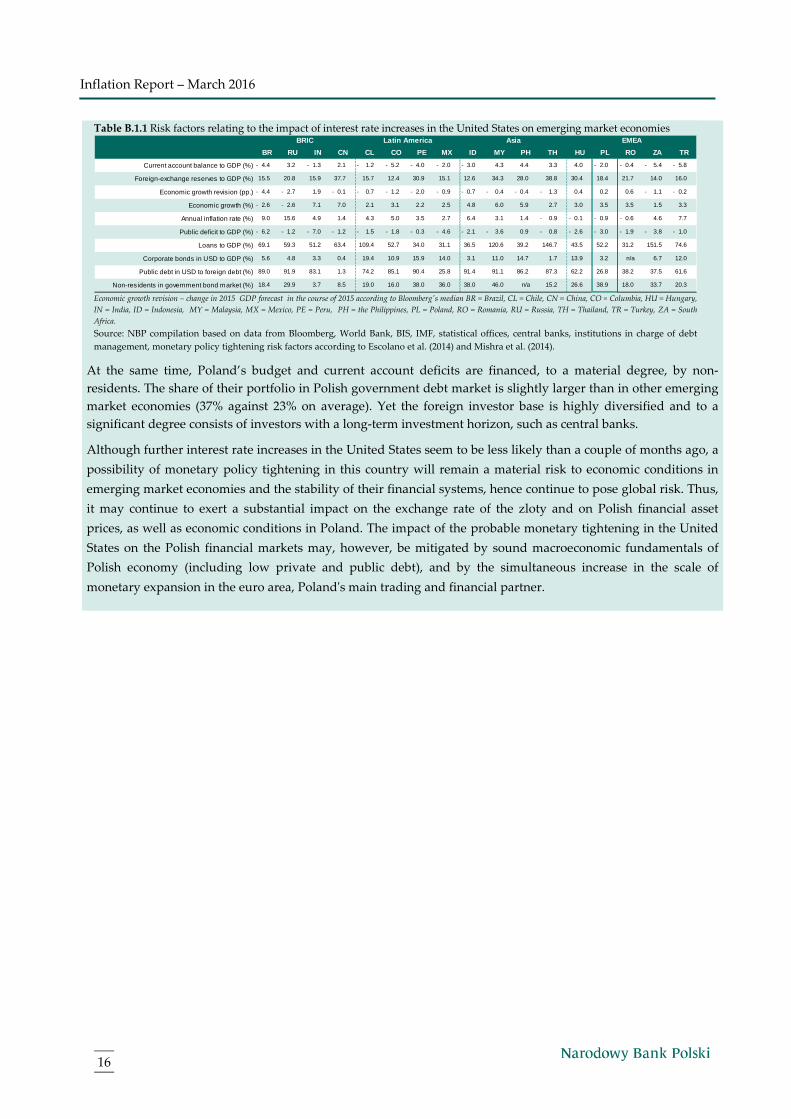
Table B.1.1 Risk factors relating to the impact of interest rate increases in the United States on emerging market economies
Economic growth revision – change in 2015 GDP forecast in the course of 2015 according to Bloomberg's median BR = Brazil, CL = Chile, CN = China, CO = Columbia, HU = Hungary,
IN = India, ID = Indonesia, MY = Malaysia, MX = Mexico, PE = Peru, PH = the Philippines, PL = Poland, RO = Romania, RU = Russia, TH = Thailand, TR = Turkey, ZA = South
Africa.
Source: NBP compilation based on data from Bloomberg, World Bank, BIS, IMF, statistical offices, central banks, institutions in charge of debt
management, monetary policy tightening risk factors according to Escolano et al. (2014) and Mishra et al. (2014).
At the same time, Poland’s budget and current account deficits are financed, to a material degree, by non-
residents. The share of their portfolio in Polish government debt market is slightly larger than in other emerging
market economies (37% against 23% on average). Yet the foreign investor base is highly diversified and to a
significant degree consists of investors with a long-term investment horizon, such as central banks.
Although further interest rate increases in the United States seem to be less likely than a couple of months ago, a
possibility of monetary policy tightening in this country will remain a material risk to economic conditions in
emerging market economies and the stability of their financial systems, hence continue to pose global risk. Thus,
it may continue to exert a substantial impact on the exchange rate of the zloty and on Polish financial asset
prices, as well as economic conditions in Poland. The impact of the probable monetary tightening in the United
States on the Polish financial markets may, however, be mitigated by sound macroeconomic fundamentals of
Polish economy (including low private and public debt), and by the simultaneous increase in the scale of
monetary expansion in the euro area, Poland's main trading and financial partner.
BR RU IN CN CL CO PE MX ID MY PH TH HU PL RO ZA TR
Current account balance to GDP (%) 4.4 - 3.2 1.3 - 2.1 1.2 - 5.2 - 4.0 - 2.0 - 3.0 - 4.3 4.4 3.3 4.0 2.0 - 0.4 - 5.4 - 5.8 -
Foreign-exchange reserves to GDP (%) 15.5 20.8 15.9 37.7 15.7 12.4 30.9 15.1 12.6 34.3 28.0 38.8 30.4 18.4 21.7 14.0 16.0
Economic growth revision (pp.) 4.4 - 2.7 - 1.9 0.1 - 0.7 - 1.2 - 2.0 - 0.9 - 0.7 - 0.4 - 0.4 - 1.3 - 0.4 0.2 0.6 1.1 - 0.2 -
Economic growth (%) 2.6 - 2.6 - 7.1 7.0 2.1 3.1 2.2 2.5 4.8 6.0 5.9 2.7 3.0 3.5 3.5 1.5 3.3
Annual inflation rate (%) 9.0 15.6 4.9 1.4 4.3 5.0 3.5 2.7 6.4 3.1 1.4 0.9 - 0.1 - 0.9 - 0.6 - 4.6 7.7
Public deficit to GDP (%) 6.2 - 1.2 - 7.0 - 1.2 - 1.5 - 1.8 - 0.3 - 4.6 - 2.1 - 3.6 - 0.9 0.8 - 2.6 - 3.0 - 1.9 - 3.8 - 1.0 -
Loans to GDP (%) 69.1 59.3 51.2 63.4 109.4 52.7 34.0 31.1 36.5 120.6 39.2 146.7 43.5 52.2 31.2 151.5 74.6
Corporate bonds in USD to GDP (%) 5.6 4.8 3.3 0.4 19.4 10.9 15.9 14.0 3.1 11.0 14.7 1.7 13.9 3.2 n/a 6.7 12.0
Public debt in USD to foreign debt (%) 89.0 91.9 83.1 1.3 74.2 85.1 90.4 25.8 91.4 91.1 86.2 87.3 62.2 26.8 38.2 37.5 61.6
Non-residents in government bond market (%) 18.4 29.9 3.7 8.5 19.0 16.0 38.0 36.0 38.0 46.0 n/a 15.2 26.6 38.9 18.0 33.7 20.3
BRIC Latin America Asia EMEA
2. Domestic economy
17
Domestic economy
2.1 Consumer prices
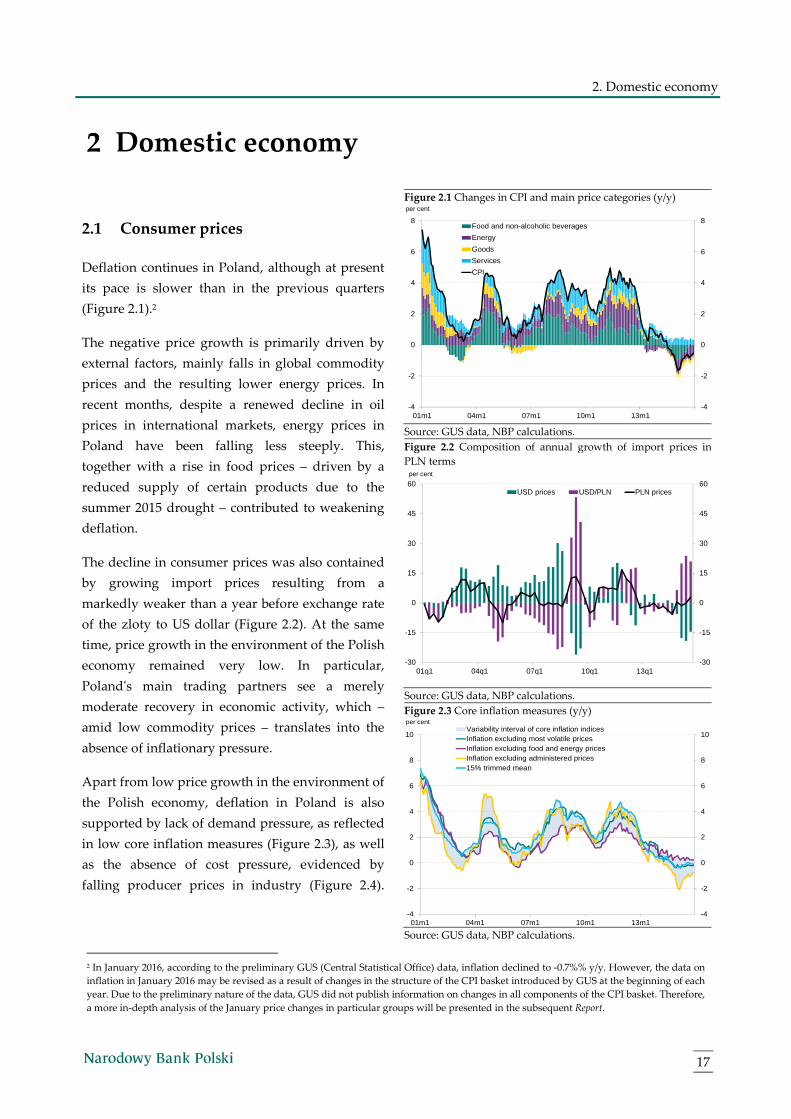
Deflation continues in Poland, although at present
its pace is slower than in the previous quarters
(Figure 2.1).2
The negative price growth is primarily driven by
external factors, mainly falls in global commodity
prices and the resulting lower energy prices. In
recent months, despite a renewed decline in oil
prices in international markets, energy prices in
Poland have been falling less steeply. This,
together with a rise in food prices – driven by a
reduced supply of certain products due to the
summer 2015 drought – contributed to weakening
deflation.
The decline in consumer prices was also contained
by growing import prices resulting from a
markedly weaker than a year before exchange rate
of the zloty to US dollar (Figure 2.2). At the same
time, price growth in the environment of the Polish
economy remained very low. In particular,
Poland's main trading partners see a merely
moderate recovery in economic activity, which –
amid low commodity prices – translates into the
absence of inflationary pressure.
Apart from low price growth in the environment of
the Polish economy, deflation in Poland is also
supported by lack of demand pressure, as reflected
in low core inflation measures (Figure 2.3), as well
as the absence of cost pressure, evidenced by
falling producer prices in industry (Figure 2.4).
Figure 2.1 Changes in CPI and main price categories (y/y)
Source: GUS data, NBP calculations.
Figure 2.2 Composition of annual growth of import prices in
PLN terms
Source: GUS data, NBP calculations.
Figure 2.3 Core inflation measures (y/y)
Source: GUS data, NBP calculations.
2 In January 2016, according to the preliminary GUS (Central Statistical Office) data, inflation declined to -0.7%% y/y. However, the data on
inflation in January 2016 may be revised as a result of changes in the structure of the CPI basket introduced by GUS at the beginning of each
year. Due to the preliminary nature of the data, GUS did not publish information on changes in all components of the CPI basket. Therefore,
a more in-depth analysis of the January price changes in particular groups will be presented in the subsequent Report.
-4
-2
0
2
4
6
8
-4
-2
0
2
4
6
8
01m1 04m1 07m1 10m1 13m1
per cent
Food and non-alcoholic beverages
Energy
Goods
Services
CPI
-30
-15
0
15
30
45
60
-30
-15
0
15
30
45
60
01q1 04q1 07q1 10q1 13q1
USD prices USD/PLN PLN prices
per cent
-4
-2
0
2
4
6
8
10
-4
-2
0
2
4
6
8
10
01m1 04m1 07m1 10m1 13m1
per centVariability interval of core inflation indicesInflation excluding most volatile pricesInflation excluding food and energy pricesInflation excluding administered prices15% trimmed mean
Inflation Report – March 2016
18
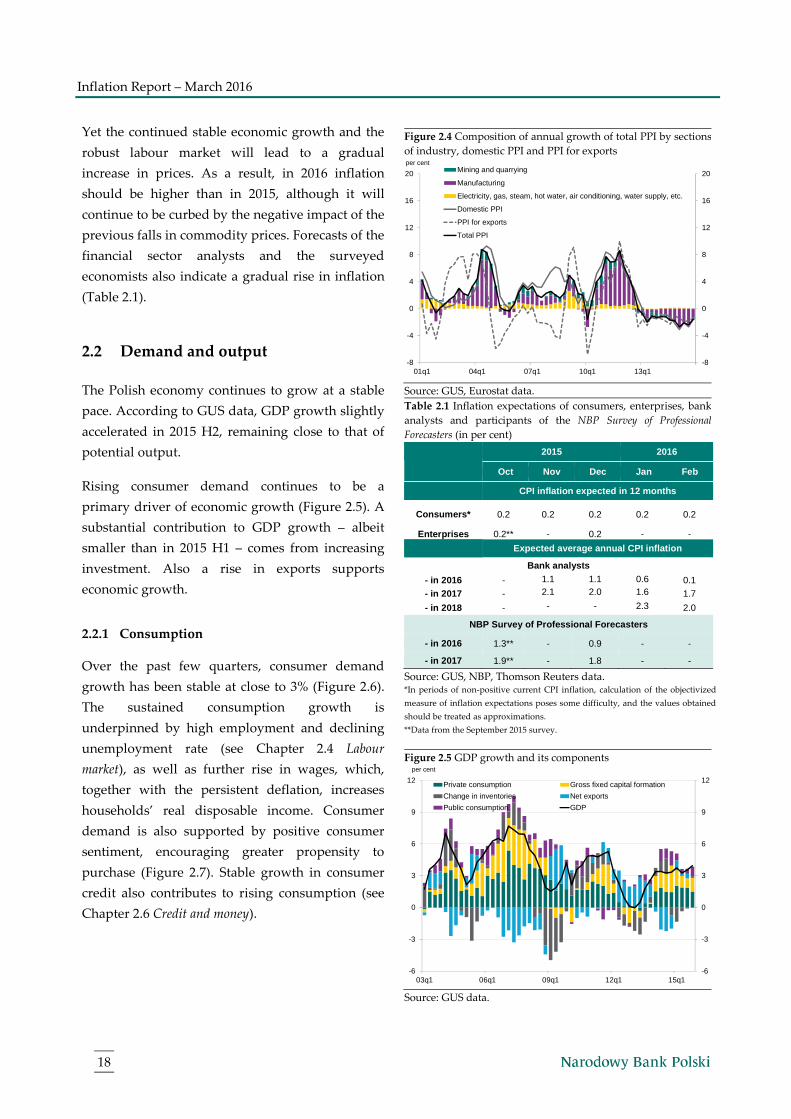
Yet the continued stable economic growth and the
robust labour market will lead to a gradual
increase in prices. As a result, in 2016 inflation
should be higher than in 2015, although it will
continue to be curbed by the negative impact of the
previous falls in commodity prices. Forecasts of the
financial sector analysts and the surveyed
economists also indicate a gradual rise in inflation
(Table 2.1).
2.2 Demand and output
The Polish economy continues to grow at a stable
pace. According to GUS data, GDP growth slightly
accelerated in 2015 H2, remaining close to that of
potential output.
Rising consumer demand continues to be a
primary driver of economic growth (Figure 2.5). A
substantial contribution to GDP growth – albeit
smaller than in 2015 H1 – comes from increasing
investment. Also a rise in exports supports
economic growth.
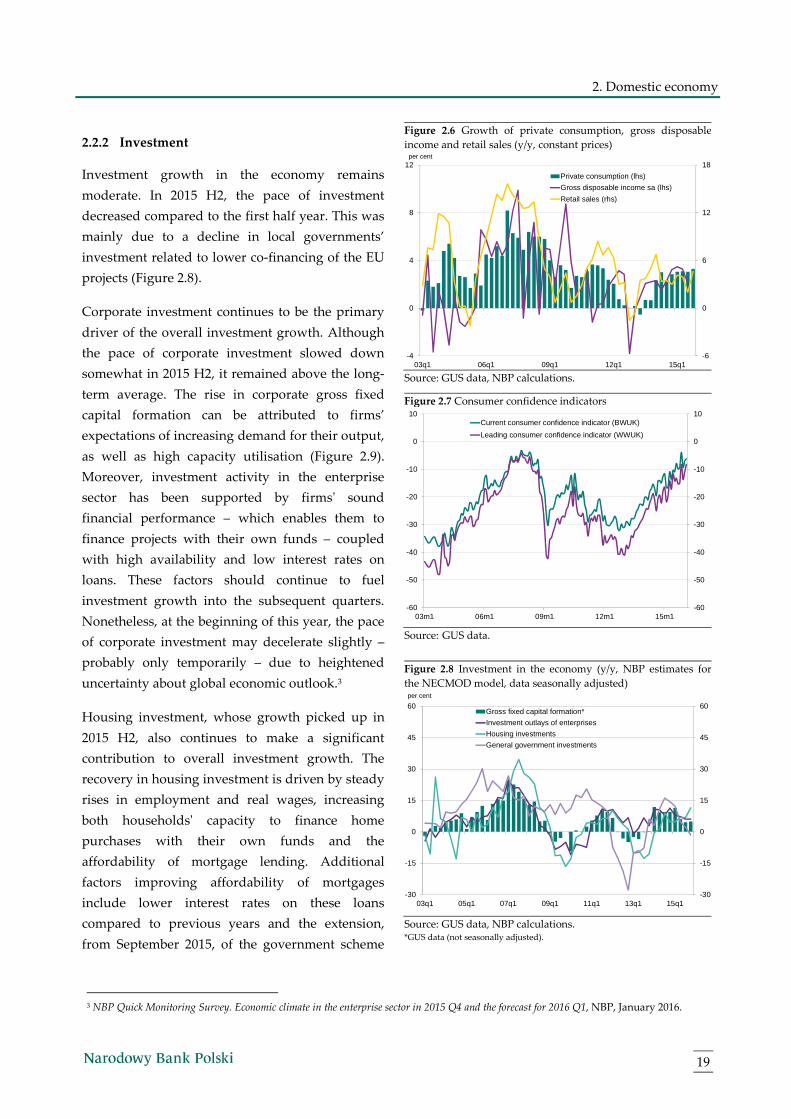
2.2.1 Consumption
Over the past few quarters, consumer demand
growth has been stable at close to 3% (Figure 2.6).
The sustained consumption growth is
underpinned by high employment and declining
unemployment rate (see Chapter 2.4 Labour
market), as well as further rise in wages, which,
together with the persistent deflation, increases
households’ real disposable income. Consumer
demand is also supported by positive consumer
sentiment, encouraging greater propensity to
purchase (Figure 2.7). Stable growth in consumer
credit also contributes to rising consumption (see
Chapter 2.6 Credit and money).
Figure 2.4 Composition of annual growth of total PPI by sections
of industry, domestic PPI and PPI for exports
Source: GUS, Eurostat data.
Table 2.1 Inflation expectations of consumers, enterprises, bank
analysts and participants of the NBP Survey of Professional
Forecasters (in per cent)
2015 2016
Oct Nov Dec Jan Feb
CPI inflation expected in 12 months
Consumers* 0.2 0.2 0.2 0.2 0.2
Enterprises 0.2** - 0.2 - -
Expected average annual CPI inflation
Bank analysts
- in 2016 - 1.1 1.1 0.6 0.1
- in 2017 - 2.1 2.0 1.6 1.7
- in 2018 - - - 2.3 2.0
NBP Survey of Professional Forecasters
- in 2016 1.3** - 0.9 - -
- in 2017 1.9** - 1.8 - -
Source: GUS, NBP, Thomson Reuters data. *In periods of non-positive current CPI inflation, calculation of the objectivized
measure of inflation expectations poses some difficulty, and the values obtained
should be treated as approximations.
**Data from the September 2015 survey.
Figure 2.5 GDP growth and its components
Source: GUS data.
-8
-4
0
4
8
12
16
20
-8
-4
0
4
8
12
16
20
01q1 04q1 07q1 10q1 13q1
per centMining and quarrying
Manufacturing
Electricity, gas, steam, hot water, air conditioning, water supply, etc.
Domestic PPI
PPI for exports
Total PPI
-6
-3
0
3
6
9
12
-6
-3
0
3
6
9
12
03q1 06q1 09q1 12q1 15q1
per cent
Private consumption Gross fixed capital formation
Change in inventories Net exports
Public consumption GDP
2. Domestic economy
19
2.2.2 Investment
Investment growth in the economy remains
moderate. In 2015 H2, the pace of investment
decreased compared to the first half year. This was
mainly due to a decline in local governments’
investment related to lower co-financing of the EU
projects (Figure 2.8).
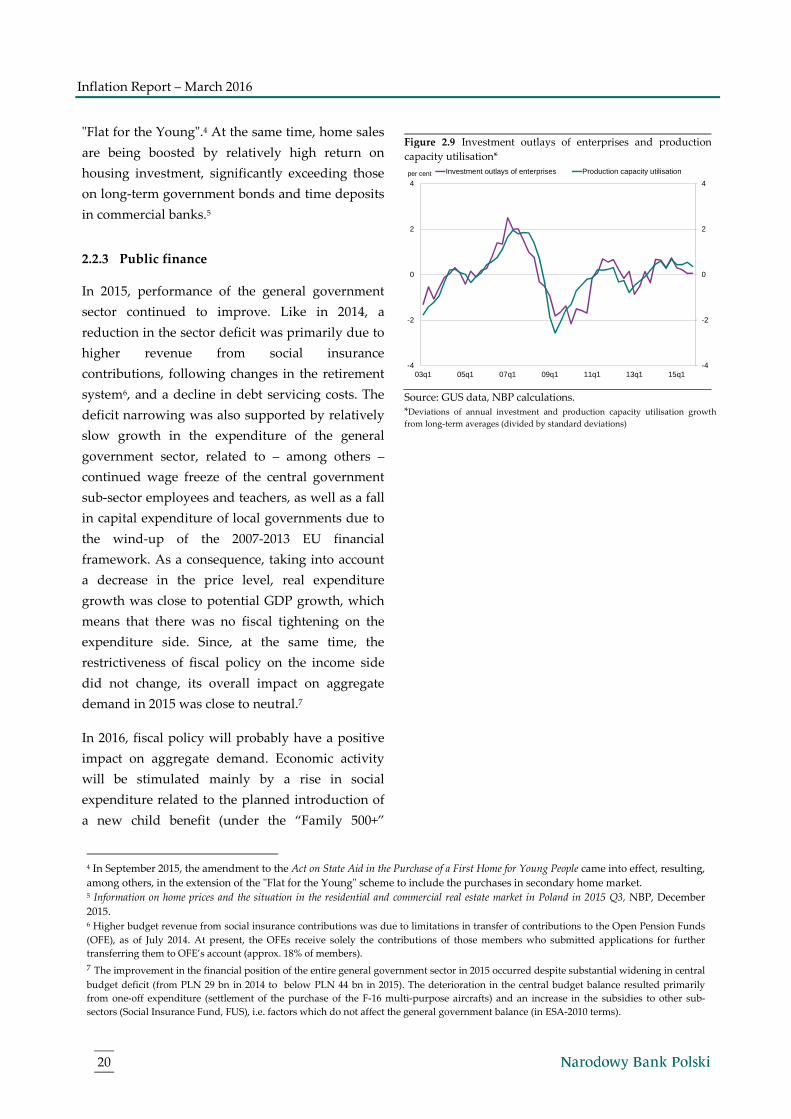
Corporate investment continues to be the primary
driver of the overall investment growth. Although
the pace of corporate investment slowed down
somewhat in 2015 H2, it remained above the long-
term average. The rise in corporate gross fixed
capital formation can be attributed to firms’
expectations of increasing demand for their output,
as well as high capacity utilisation (Figure 2.9).
Moreover, investment activity in the enterprise
sector has been supported by firms' sound
financial performance – which enables them to
finance projects with their own funds – coupled
with high availability and low interest rates on
loans. These factors should continue to fuel
investment growth into the subsequent quarters.
Nonetheless, at the beginning of this year, the pace
of corporate investment may decelerate slightly –
probably only temporarily – due to heightened
uncertainty about global economic outlook.3
Housing investment, whose growth picked up in
2015 H2, also continues to make a significant
contribution to overall investment growth. The
recovery in housing investment is driven by steady
rises in employment and real wages, increasing
both households' capacity to finance home
purchases with their own funds and the
affordability of mortgage lending. Additional
factors improving affordability of mortgages
include lower interest rates on these loans
compared to previous years and the extension,
from September 2015, of the government scheme
Figure 2.6 Growth of private consumption, gross disposable
income and retail sales (y/y, constant prices)
Source: GUS data, NBP calculations.
Figure 2.7 Consumer confidence indicators
Source: GUS data.
Figure 2.8 Investment in the economy (y/y, NBP estimates for
the NECMOD model, data seasonally adjusted)
Source: GUS data, NBP calculations. *GUS data (not seasonally adjusted).
3 NBP Quick Monitoring Survey. Economic climate in the enterprise sector in 2015 Q4 and the forecast for 2016 Q1, NBP, January 2016.
-6
0
6
12
18
-4
0
4
8
12
03q1 06q1 09q1 12q1 15q1
per cent
Private consumption (lhs)
Gross disposable income sa (lhs)
Retail sales (rhs)
-60
-50
-40
-30
-20
-10
0
10
-60
-50
-40
-30
-20
-10
0
10
03m1 06m1 09m1 12m1 15m1
Current consumer confidence indicator (BWUK)
Leading consumer confidence indicator (WWUK)
-30
-15
0
15
30
45
60
-30
-15
0
15
30
45
60
03q1 05q1 07q1 09q1 11q1 13q1 15q1
Gross fixed capital formation*
Investment outlays of enterprises
Housing investments
General government investments
per cent
Inflation Report – March 2016
20
"Flat for the Young".4 At the same time, home sales
are being boosted by relatively high return on
housing investment, significantly exceeding those
on long-term government bonds and time deposits
in commercial banks.5
2.2.3 Public finance
In 2015, performance of the general government
sector continued to improve. Like in 2014, a
reduction in the sector deficit was primarily due to
higher revenue from social insurance
contributions, following changes in the retirement
system6, and a decline in debt servicing costs. The
deficit narrowing was also supported by relatively
slow growth in the expenditure of the general
government sector, related to – among others –
continued wage freeze of the central government
sub-sector employees and teachers, as well as a fall
in capital expenditure of local governments due to
the wind-up of the 2007-2013 EU financial
framework. As a consequence, taking into account
a decrease in the price level, real expenditure
growth was close to potential GDP growth, which
means that there was no fiscal tightening on the
expenditure side. Since, at the same time, the
restrictiveness of fiscal policy on the income side
did not change, its overall impact on aggregate
demand in 2015 was close to neutral.7
In 2016, fiscal policy will probably have a positive
impact on aggregate demand. Economic activity
will be stimulated mainly by a rise in social
expenditure related to the planned introduction of
a new child benefit (under the “Family 500+”
Figure 2.9 Investment outlays of enterprises and production
capacity utilisation*
Source: GUS data, NBP calculations.
*Deviations of annual investment and production capacity utilisation growth
from long-term averages (divided by standard deviations)
4 In September 2015, the amendment to the Act on State Aid in the Purchase of a First Home for Young People came into effect, resulting,
among others, in the extension of the "Flat for the Young" scheme to include the purchases in secondary home market. 5 Information on home prices and the situation in the residential and commercial real estate market in Poland in 2015 Q3, NBP, December
2015. 6 Higher budget revenue from social insurance contributions was due to limitations in transfer of contributions to the Open Pension Funds
(OFE), as of July 2014. At present, the OFEs receive solely the contributions of those members who submitted applications for further
transferring them to OFE’s account (approx. 18% of members).
7 The improvement in the financial position of the entire general government sector in 2015 occurred despite substantial widening in central
budget deficit (from PLN 29 bn in 2014 to below PLN 44 bn in 2015). The deterioration in the central budget balance resulted primarily
from one-off expenditure (settlement of the purchase of the F-16 multi-purpose aircrafts) and an increase in the subsidies to other sub-
sectors (Social Insurance Fund, FUS), i.e. factors which do not affect the general government balance (in ESA-2010 terms).
-4
-2
0
2
4
-4
-2
0
2
4
03q1 05q1 07q1 09q1 11q1 13q1 15q1
Investment outlays of enterprises Production capacity utilisationper cent
2. Domestic economy
21
programme). The increase is, however, to be
partially offset by the imposition of new taxes – on
certain financial institutions and on retailers.8
Alongside that, growth in both current expenditure
of the general government units and public
investment expenditure will remain moderate, in
line with the 2016 Budget Act.9
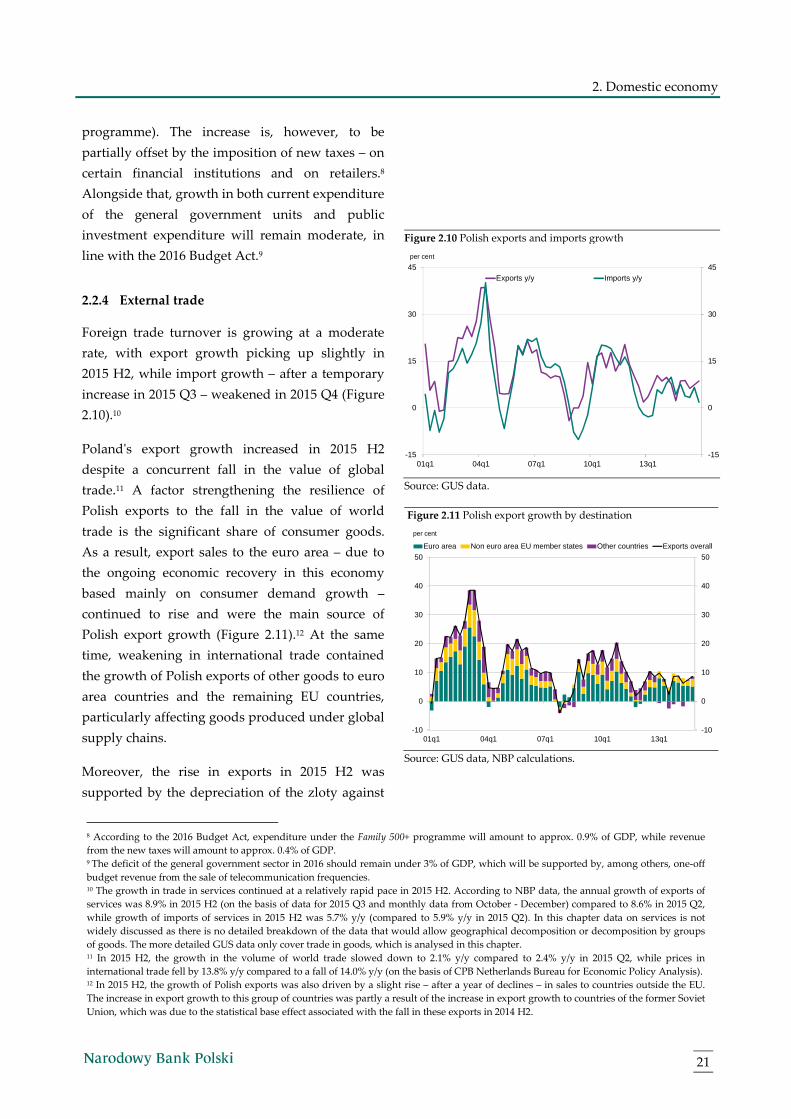
2.2.4 External trade
Foreign trade turnover is growing at a moderate
rate, with export growth picking up slightly in
2015 H2, while import growth – after a temporary
increase in 2015 Q3 – weakened in 2015 Q4 (Figure
2.10).10
Poland's export growth increased in 2015 H2
despite a concurrent fall in the value of global
trade.11 A factor strengthening the resilience of
Polish exports to the fall in the value of world
trade is the significant share of consumer goods.
As a result, export sales to the euro area – due to
the ongoing economic recovery in this economy
based mainly on consumer demand growth –
continued to rise and were the main source of
Polish export growth (Figure 2.11).12 At the same
time, weakening in international trade contained
the growth of Polish exports of other goods to euro
area countries and the remaining EU countries,
particularly affecting goods produced under global
supply chains.
Moreover, the rise in exports in 2015 H2 was
supported by the depreciation of the zloty against
Figure 2.10 Polish exports and imports growth
Source: GUS data.
Figure 2.11 Polish export growth by destination
Source: GUS data, NBP calculations.
8 According to the 2016 Budget Act, expenditure under the Family 500+ programme will amount to approx. 0.9% of GDP, while revenue
from the new taxes will amount to approx. 0.4% of GDP. 9 The deficit of the general government sector in 2016 should remain under 3% of GDP, which will be supported by, among others, one-off
budget revenue from the sale of telecommunication frequencies. 10 The growth in trade in services continued at a relatively rapid pace in 2015 H2. According to NBP data, the annual growth of exports of
services was 8.9% in 2015 H2 (on the basis of data for 2015 Q3 and monthly data from October - December) compared to 8.6% in 2015 Q2,
while growth of imports of services in 2015 H2 was 5.7% y/y (compared to 5.9% y/y in 2015 Q2). In this chapter data on services is not
widely discussed as there is no detailed breakdown of the data that would allow geographical decomposition or decomposition by groups
of goods. The more detailed GUS data only cover trade in goods, which is analysed in this chapter. 11 In 2015 H2, the growth in the volume of world trade slowed down to 2.1% y/y compared to 2.4% y/y in 2015 Q2, while prices in
international trade fell by 13.8% y/y compared to a fall of 14.0% y/y (on the basis of CPB Netherlands Bureau for Economic Policy Analysis). 12 In 2015 H2, the growth of Polish exports was also driven by a slight rise – after a year of declines – in sales to countries outside the EU.
The increase in export growth to this group of countries was partly a result of the increase in export growth to countries of the former Soviet
Union, which was due to the statistical base effect associated with the fall in these exports in 2014 H2.
-15
0
15
30
45
-15
0
15
30
45
01q1 04q1 07q1 10q1 13q1
Exports y/y Imports y/y
per cent
-10
0
10
20
30
40
50
-10
0
10
20
30
40
50
01q1 04q1 07q1 10q1 13q1
Euro area Non euro area EU member states Other countries Exports overall
per cent
Inflation Report – March 2016
22
the currencies of many Poland's trade partners,
including against the euro (Figure 2.12), which
contributed to maintenance of high profitability of
Polish exports (Figure 2.13).13 At the same time, the
share of export revenues in total revenues of
exporters has remained stable for a long time,
which may suggest that prices have limited effect
on the volume of foreign sales of Polish
enterprises.
The depreciation of the zloty was also conducive to
higher prices of imported products, which amid
stable economic growth in Poland and accelerating
exports triggered a rise in the value of imports in
2015 H2.14 At the same time, the growth in the
value of imports was limited by falling prices of
many commodities in global markets.
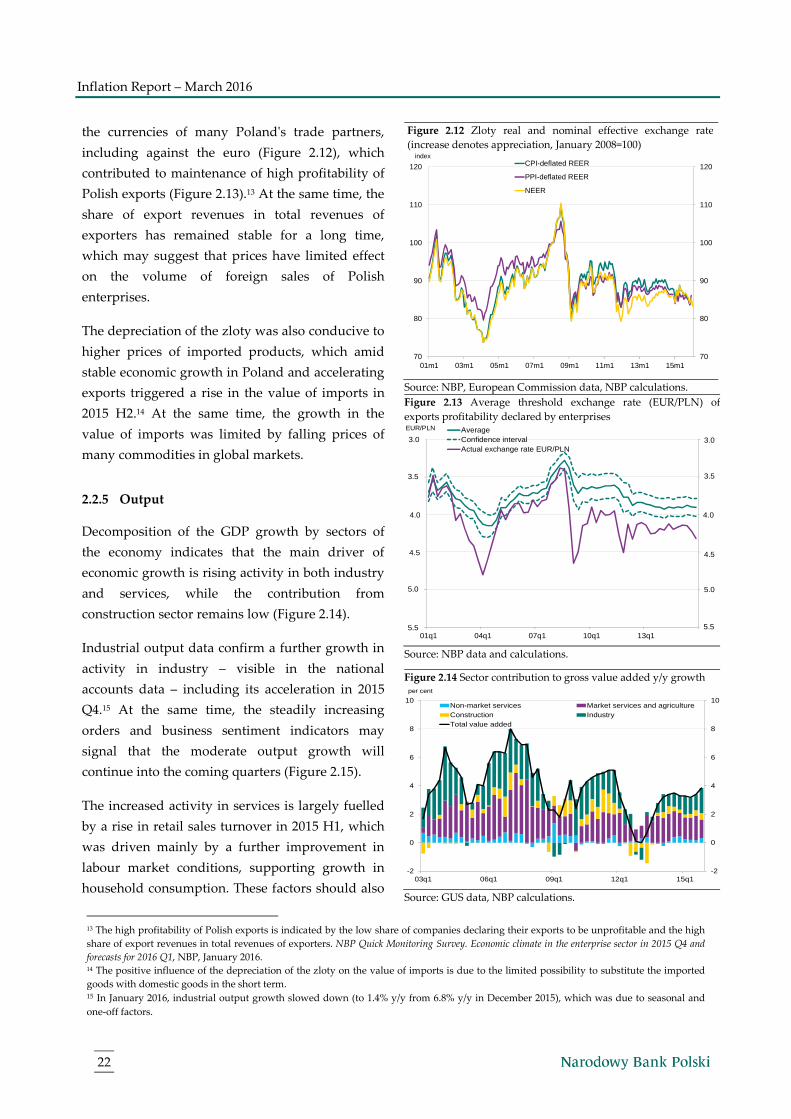
2.2.5 Output
Decomposition of the GDP growth by sectors of
the economy indicates that the main driver of
economic growth is rising activity in both industry
and services, while the contribution from
construction sector remains low (Figure 2.14).
Industrial output data confirm a further growth in
activity in industry – visible in the national
accounts data – including its acceleration in 2015
Q4.15 At the same time, the steadily increasing
orders and business sentiment indicators may
signal that the moderate output growth will
continue into the coming quarters (Figure 2.15).
The increased activity in services is largely fuelled
by a rise in retail sales turnover in 2015 H1, which
was driven mainly by a further improvement in
labour market conditions, supporting growth in
household consumption. These factors should also
Figure 2.12 Zloty real and nominal effective exchange rate
(increase denotes appreciation, January 2008=100)
Source: NBP, European Commission data, NBP calculations.
Figure 2.13 Average threshold exchange rate (EUR/PLN) of
exports profitability declared by enterprises
Source: NBP data and calculations.
Figure 2.14 Sector contribution to gross value added y/y growth
Source: GUS data, NBP calculations.
13 The high profitability of Polish exports is indicated by the low share of companies declaring their exports to be unprofitable and the high
share of export revenues in total revenues of exporters. NBP Quick Monitoring Survey. Economic climate in the enterprise sector in 2015 Q4 and
forecasts for 2016 Q1, NBP, January 2016. 14 The positive influence of the depreciation of the zloty on the value of imports is due to the limited possibility to substitute the imported
goods with domestic goods in the short term. 15 In January 2016, industrial output growth slowed down (to 1.4% y/y from 6.8% y/y in December 2015), which was due to seasonal and
one-off factors.
70
80
90
100
110
120
70
80
90
100
110
120
01m1 03m1 05m1 07m1 09m1 11m1 13m1 15m1
indexCPI-deflated REER
PPI-deflated REER
NEER
3,0
3,5
4,0
4,5
5,0
5,5
3,0
3,5
4,0
4,5
5,0
5,501q1 04q1 07q1 10q1 13q1
EUR/PLN AverageConfidence intervalActual exchange rate EUR/PLN
3.0 3.0
3.5 3.5
4.0
3.0 3.0
3.5 3.5
4.0 4.0
4.5 4.5
5.0 5.0
5.5 5.5
-2
0
2
4
6
8
10
-2
0
2
4
6
8
10
03q1 06q1 09q1 12q1 15q1
per cent
Non-market services Market services and agricultureConstruction IndustryTotal value added
2. Domestic economy
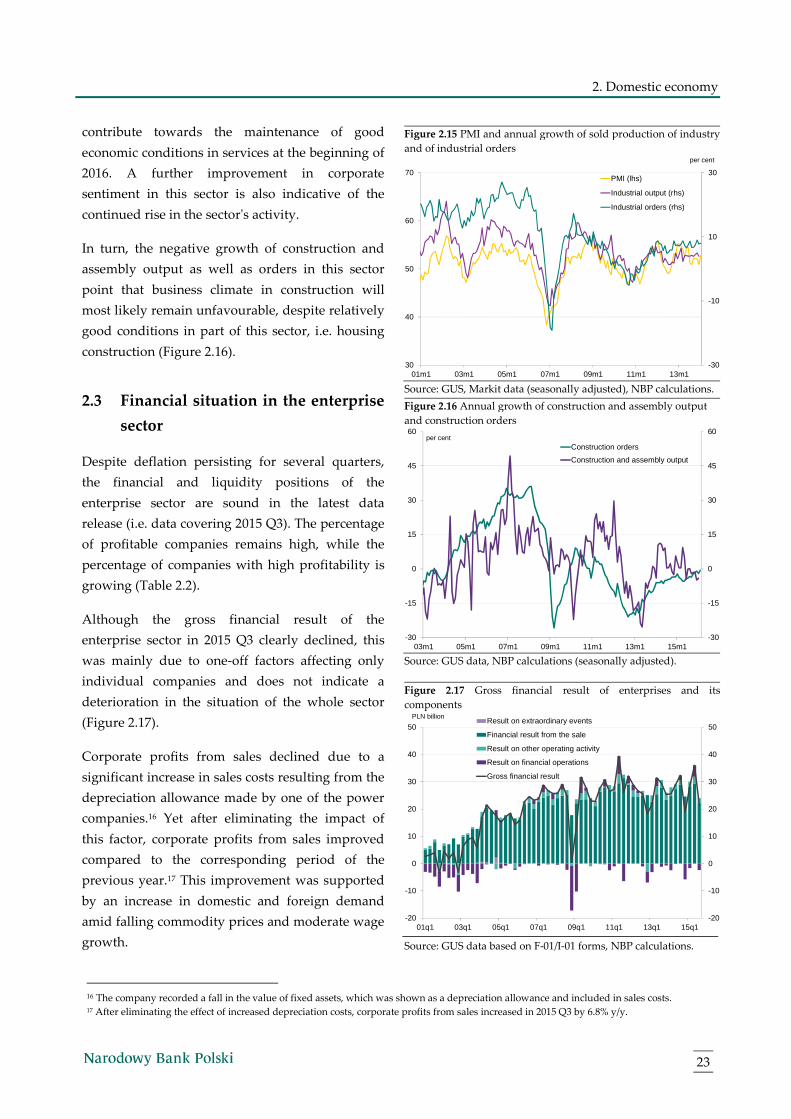
23
contribute towards the maintenance of good
economic conditions in services at the beginning of
2016. A further improvement in corporate
sentiment in this sector is also indicative of the
continued rise in the sector's activity.
In turn, the negative growth of construction and
assembly output as well as orders in this sector
point that business climate in construction will
most likely remain unfavourable, despite relatively
good conditions in part of this sector, i.e. housing
construction (Figure 2.16).
2.3 Financial situation in the enterprise
sector
Despite deflation persisting for several quarters,
the financial and liquidity positions of the
enterprise sector are sound in the latest data
release (i.e. data covering 2015 Q3). The percentage
of profitable companies remains high, while the
percentage of companies with high profitability is
growing (Table 2.2).
Although the gross financial result of the
enterprise sector in 2015 Q3 clearly declined, this
was mainly due to one-off factors affecting only
individual companies and does not indicate a
deterioration in the situation of the whole sector
(Figure 2.17).
Corporate profits from sales declined due to a
significant increase in sales costs resulting from the
depreciation allowance made by one of the power
companies.16 Yet after eliminating the impact of
this factor, corporate profits from sales improved
compared to the corresponding period of the
previous year.17 This improvement was supported
by an increase in domestic and foreign demand
amid falling commodity prices and moderate wage
growth.
Figure 2.15 PMI and annual growth of sold production of industry
and of industrial orders
Source: GUS, Markit data (seasonally adjusted), NBP calculations.
Figure 2.16 Annual growth of construction and assembly output
and construction orders
Source: GUS data, NBP calculations (seasonally adjusted).
Figure 2.17 Gross financial result of enterprises and its
components
Source: GUS data based on F-01/I-01 forms, NBP calculations.
16 The company recorded a fall in the value of fixed assets, which was shown as a depreciation allowance and included in sales costs. 17 After eliminating the effect of increased depreciation costs, corporate profits from sales increased in 2015 Q3 by 6.8% y/y.
-30
-10
10
30
30
40
50
60
70
01m1 03m1 05m1 07m1 09m1 11m1 13m1
per cent
PMI (lhs)
Industrial output (rhs)
Industrial orders (rhs)
-30
-15
0
15
30
45
60
-30
-15
0
15
30
45
60
03m1 05m1 07m1 09m1 11m1 13m1 15m1
per centConstruction orders
Construction and assembly output
-20
-10
0
10
20
30
40
50
-20
-10
0
10
20
30
40
50
01q1 03q1 05q1 07q1 09q1 11q1 13q1 15q1
PLN billion Result on extraordinary events
Financial result from the sale
Result on other operating activity
Result on financial operations
Gross financial result
`
Inflation Report – March 2016
24
At the same time, the enterprise sector recorded a
loss on other activities (i.e. financial and other
operational activities). However, the deterioration
of this result was largely driven by a fall in
dividend income in one enterprise.18
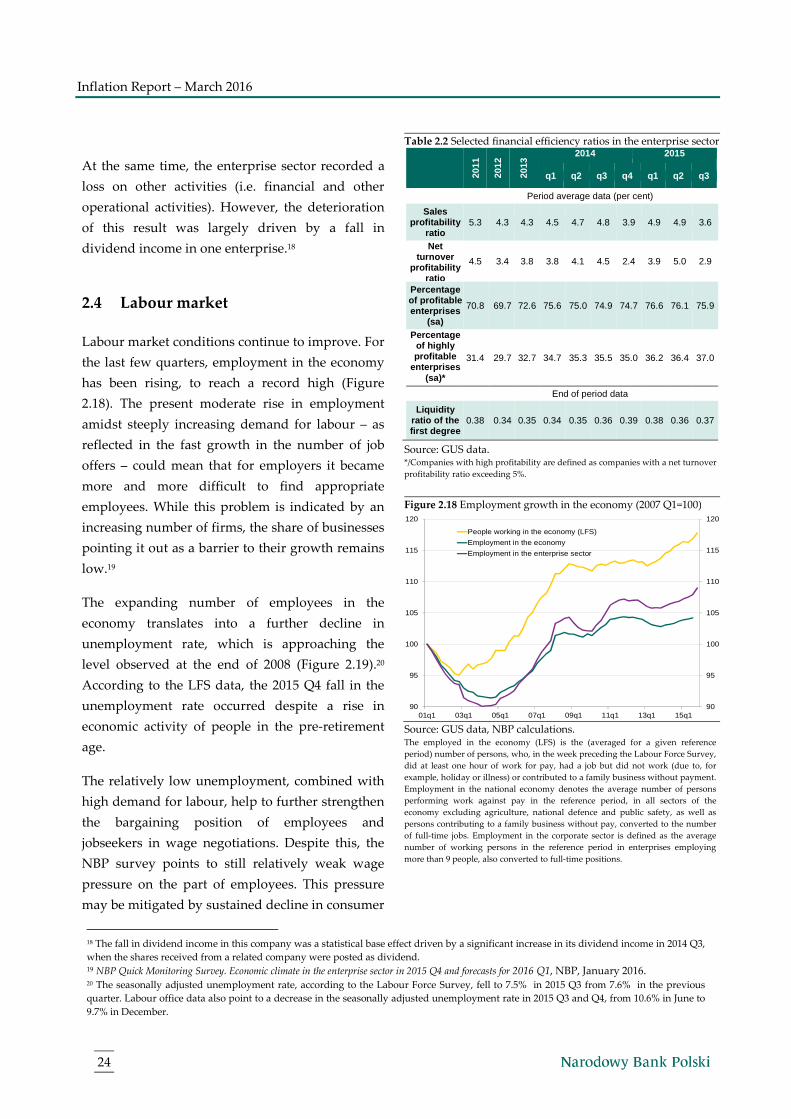
2.4 Labour market
Labour market conditions continue to improve. For
the last few quarters, employment in the economy
has been rising, to reach a record high (Figure
2.18). The present moderate rise in employment
amidst steeply increasing demand for labour – as
reflected in the fast growth in the number of job
offers – could mean that for employers it became
more and more difficult to find appropriate
employees. While this problem is indicated by an
increasing number of firms, the share of businesses
pointing it out as a barrier to their growth remains
low.19
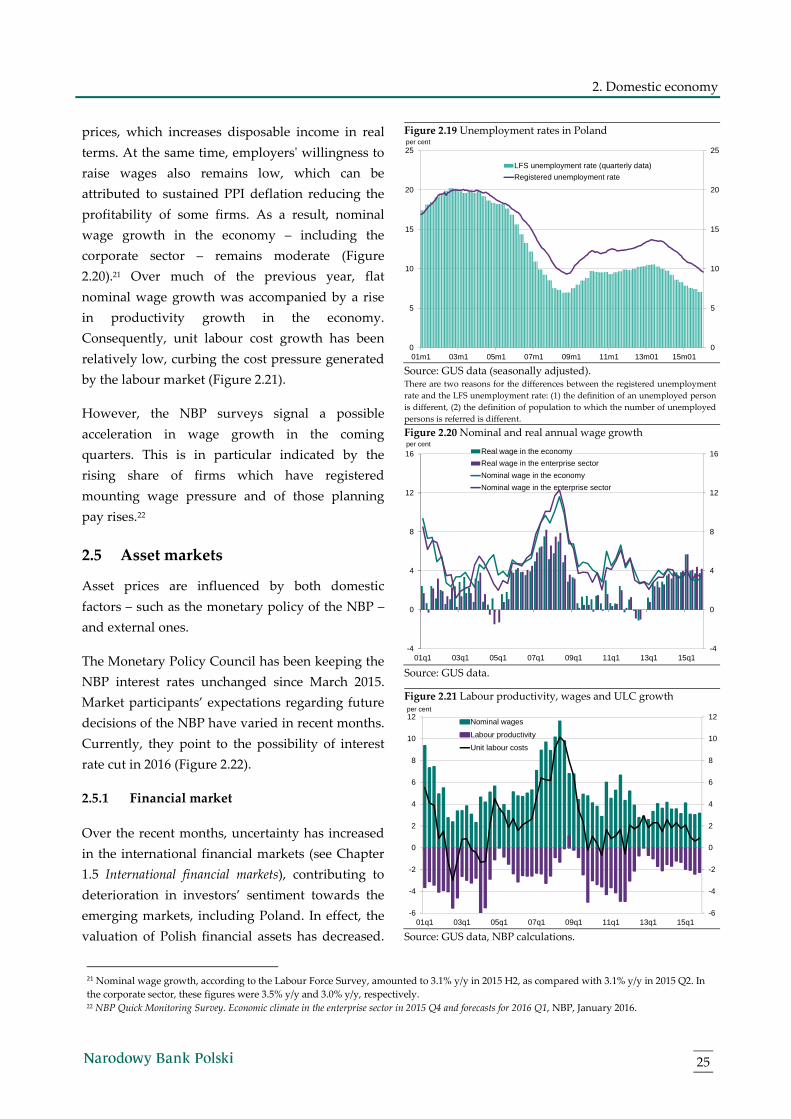
The expanding number of employees in the
economy translates into a further decline in
unemployment rate, which is approaching the
level observed at the end of 2008 (Figure 2.19).20
According to the LFS data, the 2015 Q4 fall in the
unemployment rate occurred despite a rise in
economic activity of people in the pre-retirement
age.
The relatively low unemployment, combined with
high demand for labour, help to further strengthen
the bargaining position of employees and
jobseekers in wage negotiations. Despite this, the
NBP survey points to still relatively weak wage
pressure on the part of employees. This pressure
may be mitigated by sustained decline in consumer
Table 2.2 Selected financial efficiency ratios in the enterprise sector
2011
2012
2013
2014 2015
q1 q2 q3 q4 q1 q2 q3
Period average data (per cent)
Sales profitability
ratio 5.3 4.3 4.3 4.5 4.7 4.8 3.9 4.9 4.9 3.6
Net turnover
profitability ratio
4.5 3.4 3.8 3.8 4.1 4.5 2.4 3.9 5.0 2.9
Percentage of profitable enterprises
(sa)
70.8 69.7 72.6 75.6 75.0 74.9 74.7 76.6 76.1 75.9
Percentage of highly profitable
enterprises (sa)*
31.4 29.7 32.7 34.7 35.3 35.5 35.0 36.2 36.4 37.0
End of period data
Liquidity ratio of the first degree
0.38 0.34 0.35 0.34 0.35 0.36 0.39 0.38 0.36 0.37
Source: GUS data. */Companies with high profitability are defined as companies with a net turnover
profitability ratio exceeding 5%.
Figure 2.18 Employment growth in the economy (2007 Q1=100)
Source: GUS data, NBP calculations. The employed in the economy (LFS) is the (averaged for a given reference
period) number of persons, who, in the week preceding the Labour Force Survey,
did at least one hour of work for pay, had a job but did not work (due to, for
example, holiday or illness) or contributed to a family business without payment.
Employment in the national economy denotes the average number of persons
performing work against pay in the reference period, in all sectors of the
economy excluding agriculture, national defence and public safety, as well as
persons contributing to a family business without pay, converted to the number
of full-time jobs. Employment in the corporate sector is defined as the average
number of working persons in the reference period in enterprises employing
more than 9 people, also converted to full-time positions.
18 The fall in dividend income in this company was a statistical base effect driven by a significant increase in its dividend income in 2014 Q3,
when the shares received from a related company were posted as dividend. 19 NBP Quick Monitoring Survey. Economic climate in the enterprise sector in 2015 Q4 and forecasts for 2016 Q1, NBP, January 2016. 20 The seasonally adjusted unemployment rate, according to the Labour Force Survey, fell to 7.5% in 2015 Q3 from 7.6% in the previous
quarter. Labour office data also point to a decrease in the seasonally adjusted unemployment rate in 2015 Q3 and Q4, from 10.6% in June to
9.7% in December.
90
95
100
105
110
115
120
90
95
100
105
110
115
120
01q1 03q1 05q1 07q1 09q1 11q1 13q1 15q1
People working in the economy (LFS)
Employment in the economy
Employment in the enterprise sector
2. Domestic economy
25
prices, which increases disposable income in real
terms. At the same time, employers' willingness to
raise wages also remains low, which can be
attributed to sustained PPI deflation reducing the
profitability of some firms. As a result, nominal
wage growth in the economy – including the
corporate sector – remains moderate (Figure
2.20).21 Over much of the previous year, flat
nominal wage growth was accompanied by a rise
in productivity growth in the economy.
Consequently, unit labour cost growth has been
relatively low, curbing the cost pressure generated
by the labour market (Figure 2.21).
However, the NBP surveys signal a possible
acceleration in wage growth in the coming
quarters. This is in particular indicated by the
rising share of firms which have registered
mounting wage pressure and of those planning
pay rises.22
2.5 Asset markets
Asset prices are influenced by both domestic
factors – such as the monetary policy of the NBP –
and external ones.
The Monetary Policy Council has been keeping the
NBP interest rates unchanged since March 2015.
Market participants’ expectations regarding future
decisions of the NBP have varied in recent months.
Currently, they point to the possibility of interest
rate cut in 2016 (Figure 2.22).
2.5.1 Financial market
Over the recent months, uncertainty has increased
in the international financial markets (see Chapter
1.5 International financial markets), contributing to
deterioration in investors’ sentiment towards the
emerging markets, including Poland. In effect, the
valuation of Polish financial assets has decreased.
Figure 2.19 Unemployment rates in Poland
Source: GUS data (seasonally adjusted). There are two reasons for the differences between the registered unemployment
rate and the LFS unemployment rate: (1) the definition of an unemployed person
is different, (2) the definition of population to which the number of unemployed
persons is referred is different.
Figure 2.20 Nominal and real annual wage growth
Source: GUS data.
Figure 2.21 Labour productivity, wages and ULC growth
Source: GUS data, NBP calculations.
21 Nominal wage growth, according to the Labour Force Survey, amounted to 3.1% y/y in 2015 H2, as compared with 3.1% y/y in 2015 Q2. In
the corporate sector, these figures were 3.5% y/y and 3.0% y/y, respectively. 22 NBP Quick Monitoring Survey. Economic climate in the enterprise sector in 2015 Q4 and forecasts for 2016 Q1, NBP, January 2016.
0
5
10
15
20
25
0
5
10
15
20
25
01m1 03m1 05m1 07m1 09m1 11m1 13m01 15m01
per cent
LFS unemployment rate (quarterly data)
Registered unemployment rate
-4
0
4
8
12
16
-4
0
4
8
12
16
01q1 03q1 05q1 07q1 09q1 11q1 13q1 15q1
per centReal wage in the economy
Real wage in the enterprise sector
Nominal wage in the economy
Nominal wage in the enterprise sector
-6
-4
-2
0
2
4
6
8
10
12
-6
-4
-2
0
2
4
6
8
10
12
01q1 03q1 05q1 07q1 09q1 11q1 13q1 15q1
per cent
Nominal wages
Labour productivity
Unit labour costs
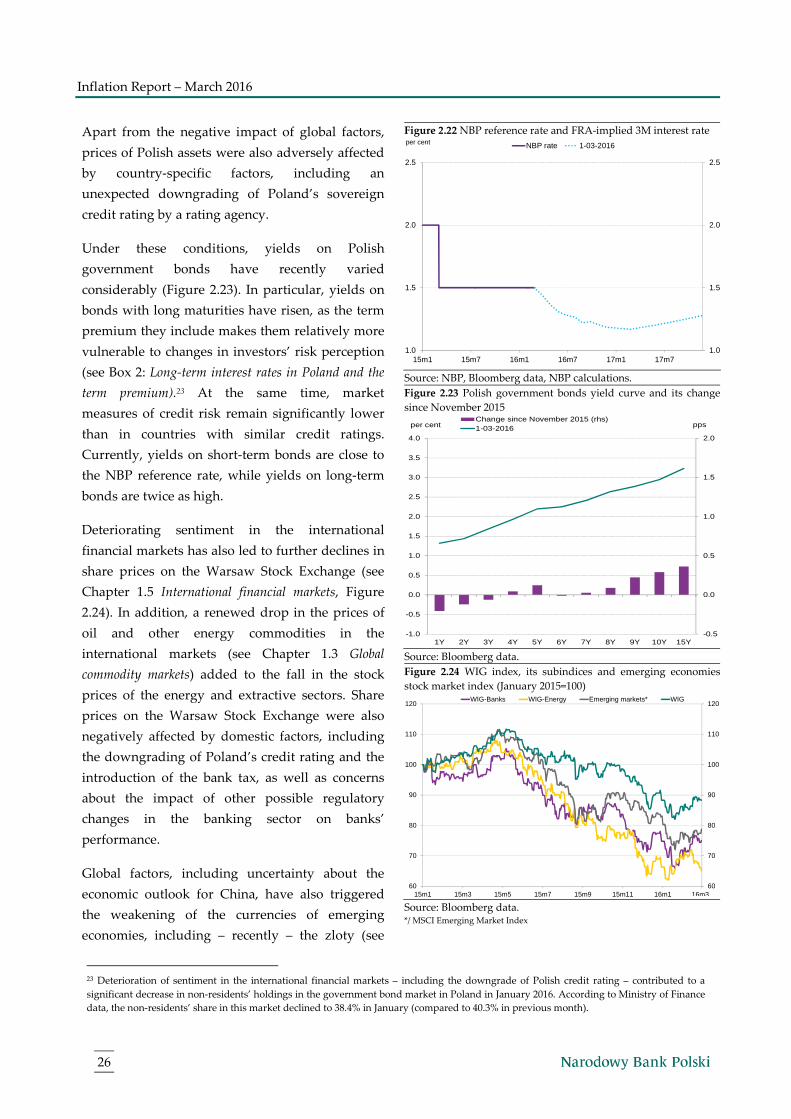
Inflation Report – March 2016
26
Apart from the negative impact of global factors,
prices of Polish assets were also adversely affected
by country-specific factors, including an
unexpected downgrading of Poland’s sovereign
credit rating by a rating agency.
Under these conditions, yields on Polish
government bonds have recently varied
considerably (Figure 2.23). In particular, yields on
bonds with long maturities have risen, as the term
premium they include makes them relatively more
vulnerable to changes in investors’ risk perception
(see Box 2: Long-term interest rates in Poland and the
term premium).23 At the same time, market
measures of credit risk remain significantly lower
than in countries with similar credit ratings.
Currently, yields on short-term bonds are close to
the NBP reference rate, while yields on long-term
bonds are twice as high.
Deteriorating sentiment in the international
financial markets has also led to further declines in
share prices on the Warsaw Stock Exchange (see
Chapter 1.5 International financial markets, Figure
2.24). In addition, a renewed drop in the prices of
oil and other energy commodities in the
international markets (see Chapter 1.3 Global
commodity markets) added to the fall in the stock
prices of the energy and extractive sectors. Share
prices on the Warsaw Stock Exchange were also
negatively affected by domestic factors, including
the downgrading of Poland’s credit rating and the
introduction of the bank tax, as well as concerns
about the impact of other possible regulatory
changes in the banking sector on banks’
performance.
Global factors, including uncertainty about the
economic outlook for China, have also triggered
the weakening of the currencies of emerging
economies, including – recently – the zloty (see
Figure 2.22 NBP reference rate and FRA-implied 3M interest rate
Source: NBP, Bloomberg data, NBP calculations.
Figure 2.23 Polish government bonds yield curve and its change
since November 2015
Source: Bloomberg data.
Figure 2.24 WIG index, its subindices and emerging economies
stock market index (January 2015=100)
Source: Bloomberg data. */ MSCI Emerging Market Index
23 Deterioration of sentiment in the international financial markets – including the downgrade of Polish credit rating – contributed to a
significant decrease in non-residents’ holdings in the government bond market in Poland in January 2016. According to Ministry of Finance
data, the non-residents’ share in this market declined to 38.4% in January (compared to 40.3% in previous month).
1.0
1.5
2.0
2.5
1.0
1.5
2.0
2.5
15m1 15m7 16m1 16m7 17m1 17m7
per cent NBP rate 1-03-2016
-0.5
0.0
0.5
1.0
1.5
2.0
-1.0
-0.5
0.0
0.5
1.0
1.5
2.0
2.5
3.0
3.5
4.0
1Y 2Y 3Y 4Y 5Y 6Y 7Y 8Y 9Y 10Y 15Y
Change since November 2015 (rhs)1-03-2016per cent pps
60
70
80
90
100
110
120
60
70
80
90
100
110
120
15m1 15m3 15m5 15m7 15m9 15m11 16m1
WIG-Banks WIG-Energy Emerging markets* WIG
16m3

2. Domestic economy
27
Chapter 1.5 International financial markets, Figure
2.25). The depreciation of the zloty was driven by
domestic factors as well. Consequently, the
nominal effective exchange rate of the zloty has
now fallen to its lowest level since 2012.
2.5.2 Residential real estate prices24
The housing market in Poland continues to
recover, as reflected in further increase in the
number of dwellings sold (Figure 2.27). Yet, no
marked growth in residential real estate prices is
accompanying this upward trend so far.
High housing demand is fuelled by continuously
favourable labour market conditions (Chapter 2.4
Labour market). Together with lower interest rates
on mortgage loans than in the previous years, and
the extended government-subsidized programme
“Flat for the Young” it improves affordability of
mortgages.25 Also the relatively high profitability
of rental housing as compared to the interest rate
level has a positive effect on residential property
sales.26
The rise in home sales in the primary market, amid
persistently low construction costs, encourages real
estate developers to launch new investment. This is
reflected in the increasing number of homes under
construction and building permits issued (Figure
2.27).27 As a result, growing housing demand is
accompanied by a rise in current and future
housing supply, which has a stabilizing effect on
house prices (Figure 2.26).28 Therefore, prices of
dwellings in most cities in Poland remain stable.29
Figure 2.25 Exchange rate of the Polish zloty (January 2015 = 100,
increase denotes appreciation)
Source: Bloomberg data.
Figure 2.26 Average prices of flats in six and ten major cities
Source: NBP calculations based on the NBP survey
Figure 2.27 Housing construction in Poland in third quarters
Source: GUS data, NBP calculations. */ Production index is a number of development projects started in the real estate
market less introduced into the market (12-month moving value).
24 For more information on the situation in the housing real estate market in Poland see the NBP report: Information on home prices and the
situation in the housing and commercial real estate market in Poland in 2015 Q2 (available on NBP’s website: www.nbp.pl, in Polish only). 25 The Act of 25 June 2015 on the amendment to the Act on state aid in the purchase of a first home for young people came into force in
September 2015 (Journal of Laws of 17.08.2015, item 1194). As a result, the government housing scheme “Flat for the Young” was extended
to include secondary market housing. 26 The profitability of home rental exceeds almost threefold the interest rate on 10-year Treasury bonds and almost twofold the average
interest rate on housing loans. See: Information on home prices and the situation in the housing and commercial real estate market in Poland in 2015
Q3, NBP, December 2015. 27 In 2015 Q3 the number of building permits issued rose by 14.8% y/y, whereas the number of dwellings under construction picked up by
11.8% y/y. 28 PM – primary market, SM – secondary market, hed. – hedonic price index. Transaction prices in the primary and secondary market – the
average weighted with the share of the housing stock in a given city in the total housing stock of all cities. The index for six cities includes:
80
90
100
110
80
90
100
110
15m1 15m3 15m5 15m7 15m9 15m11 16m1
CHF/PLN USD/PLN EUR/PLN
16m3
2 500
3 500
4 500
5 500
6 500
7 500
8 500
9 500
2 500
3 500
4 500
5 500
6 500
7 500
8 500
9 500
06q3 07q3 08q3 09q3 10q3 11q3 12q3 13q3 14q3 15q3
PLN/sq m
PM 6 cities PM 10 cities SM WarsawSM 6 cities SM 10 cities Warsaw hed.6 cities hed. 10 cities hed. PM Warsaw
-60
-40
-20
0
20
40
60
80
100
120
0
20
40
60
80
100
120
140
160
180
200
2005 2006 2007 2008 2009 2010 2011 2012 2013 2014 2015
thousands CompletedPermitsStartedProduction index* (rhs)
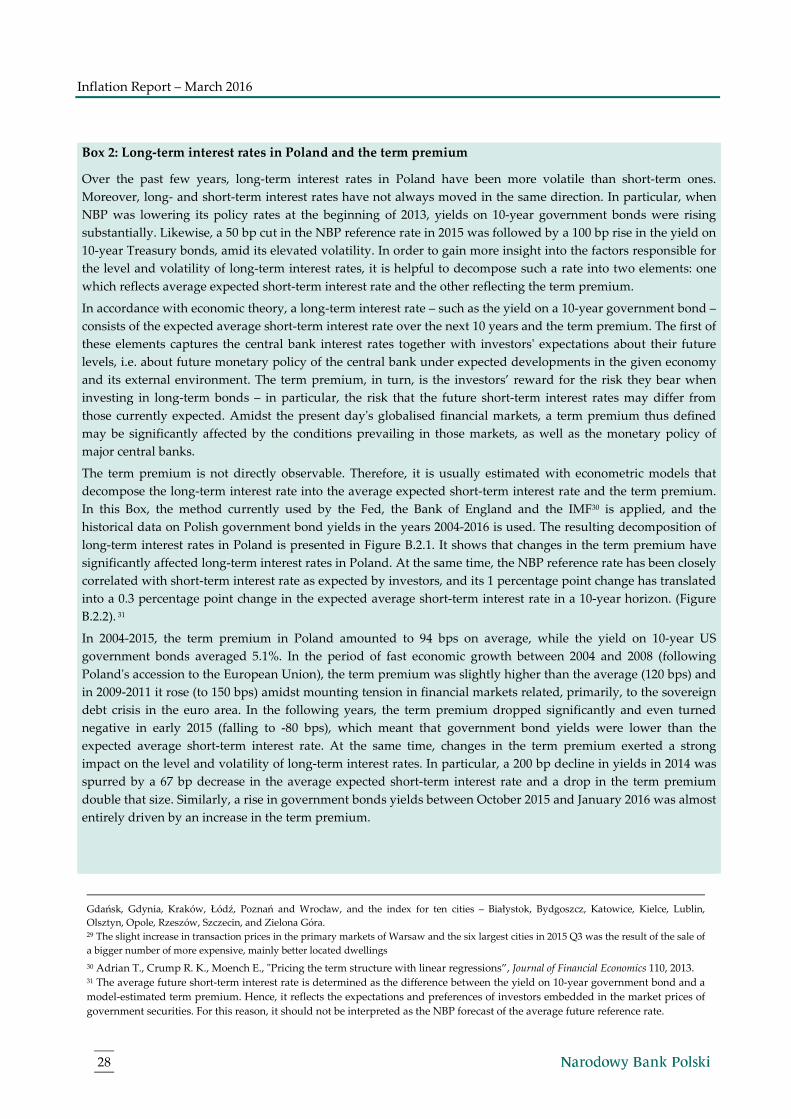
Inflation Report – March 2016
28
Box 2: Long-term interest rates in Poland and the term premium
Over the past few years, long-term interest rates in Poland have been more volatile than short-term ones.
Moreover, long- and short-term interest rates have not always moved in the same direction. In particular, when
NBP was lowering its policy rates at the beginning of 2013, yields on 10-year government bonds were rising
substantially. Likewise, a 50 bp cut in the NBP reference rate in 2015 was followed by a 100 bp rise in the yield on
10-year Treasury bonds, amid its elevated volatility. In order to gain more insight into the factors responsible for
the level and volatility of long-term interest rates, it is helpful to decompose such a rate into two elements: one
which reflects average expected short-term interest rate and the other reflecting the term premium.
In accordance with economic theory, a long-term interest rate – such as the yield on a 10-year government bond –
consists of the expected average short-term interest rate over the next 10 years and the term premium. The first of
these elements captures the central bank interest rates together with investors' expectations about their future
levels, i.e. about future monetary policy of the central bank under expected developments in the given economy
and its external environment. The term premium, in turn, is the investors’ reward for the risk they bear when
investing in long-term bonds – in particular, the risk that the future short-term interest rates may differ from
those currently expected. Amidst the present day's globalised financial markets, a term premium thus defined
may be significantly affected by the conditions prevailing in those markets, as well as the monetary policy of
major central banks.
The term premium is not directly observable. Therefore, it is usually estimated with econometric models that
decompose the long-term interest rate into the average expected short-term interest rate and the term premium.
In this Box, the method currently used by the Fed, the Bank of England and the IMF30 is applied, and the
historical data on Polish government bond yields in the years 2004-2016 is used. The resulting decomposition of
long-term interest rates in Poland is presented in Figure B.2.1. It shows that changes in the term premium have
significantly affected long-term interest rates in Poland. At the same time, the NBP reference rate has been closely
correlated with short-term interest rate as expected by investors, and its 1 percentage point change has translated
into a 0.3 percentage point change in the expected average short-term interest rate in a 10-year horizon. (Figure
B.2.2). 31
In 2004-2015, the term premium in Poland amounted to 94 bps on average, while the yield on 10-year US
government bonds averaged 5.1%. In the period of fast economic growth between 2004 and 2008 (following
Poland's accession to the European Union), the term premium was slightly higher than the average (120 bps) and
in 2009-2011 it rose (to 150 bps) amidst mounting tension in financial markets related, primarily, to the sovereign
debt crisis in the euro area. In the following years, the term premium dropped significantly and even turned
negative in early 2015 (falling to -80 bps), which meant that government bond yields were lower than the
expected average short-term interest rate. At the same time, changes in the term premium exerted a strong
impact on the level and volatility of long-term interest rates. In particular, a 200 bp decline in yields in 2014 was
spurred by a 67 bp decrease in the average expected short-term interest rate and a drop in the term premium
double that size. Similarly, a rise in government bonds yields between October 2015 and January 2016 was almost
entirely driven by an increase in the term premium.
Gdańsk, Gdynia, Kraków, Łódź, Poznań and Wrocław, and the index for ten cities – Białystok, Bydgoszcz, Katowice, Kielce, Lublin,
Olsztyn, Opole, Rzeszów, Szczecin, and Zielona Góra. 29 The slight increase in transaction prices in the primary markets of Warsaw and the six largest cities in 2015 Q3 was the result of the sale of
a bigger number of more expensive, mainly better located dwellings
30 Adrian T., Crump R. K., Moench E., "Pricing the term structure with linear regressions”, Journal of Financial Economics 110, 2013. 31 The average future short-term interest rate is determined as the difference between the yield on 10-year government bond and a
model-estimated term premium. Hence, it reflects the expectations and preferences of investors embedded in the market prices of
government securities. For this reason, it should not be interpreted as the NBP forecast of the average future reference rate.
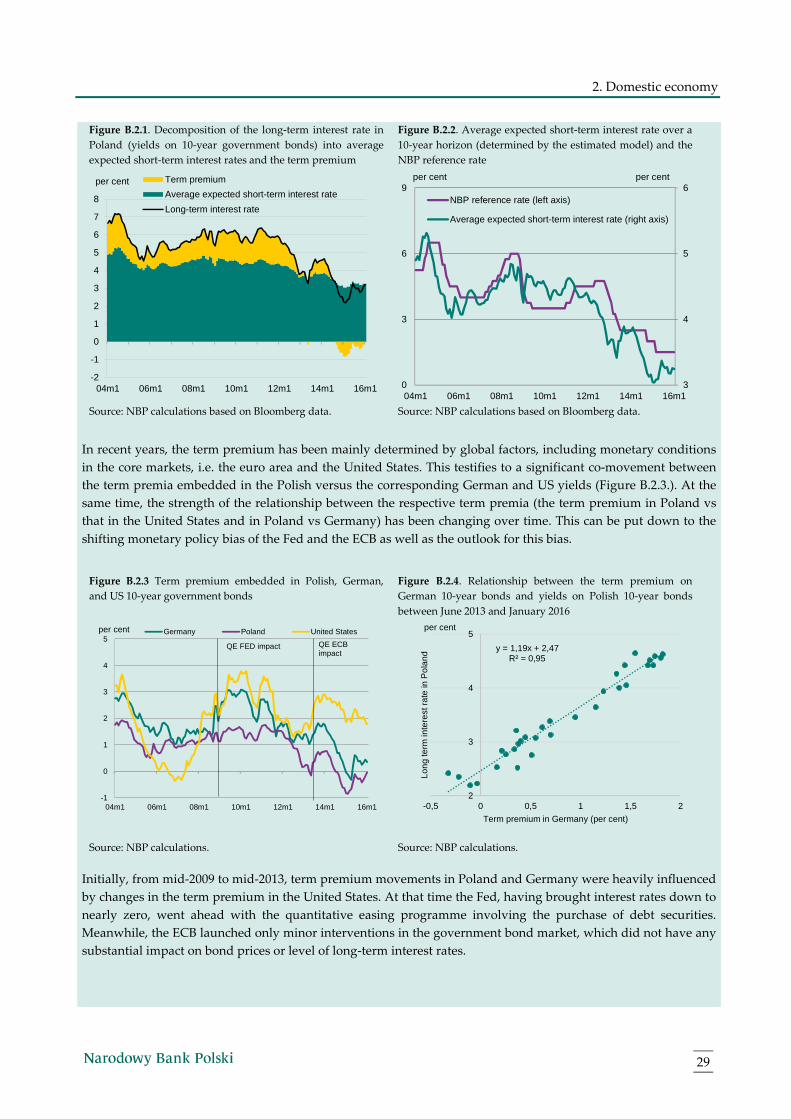
2. Domestic economy
29
Figure B.2.1. Decomposition of the long-term interest rate in
Poland (yields on 10-year government bonds) into average
expected short-term interest rates and the term premium
Figure B.2.2. Average expected short-term interest rate over a
10-year horizon (determined by the estimated model) and the
NBP reference rate
Source: NBP calculations based on Bloomberg data. Source: NBP calculations based on Bloomberg data.
In recent years, the term premium has been mainly determined by global factors, including monetary conditions
in the core markets, i.e. the euro area and the United States. This testifies to a significant co-movement between
the term premia embedded in the Polish versus the corresponding German and US yields (Figure B.2.3.). At the
same time, the strength of the relationship between the respective term premia (the term premium in Poland vs
that in the United States and in Poland vs Germany) has been changing over time. This can be put down to the
shifting monetary policy bias of the Fed and the ECB as well as the outlook for this bias.
Figure B.2.3 Term premium embedded in Polish, German,
and US 10-year government bonds
Figure B.2.4. Relationship between the term premium on
German 10-year bonds and yields on Polish 10-year bonds
between June 2013 and January 2016
Source: NBP calculations. Source: NBP calculations.
Initially, from mid-2009 to mid-2013, term premium movements in Poland and Germany were heavily influenced
by changes in the term premium in the United States. At that time the Fed, having brought interest rates down to
nearly zero, went ahead with the quantitative easing programme involving the purchase of debt securities.
Meanwhile, the ECB launched only minor interventions in the government bond market, which did not have any
substantial impact on bond prices or level of long-term interest rates.
-2
-1
0
1
2
3
4
5
6
7
8
04m1 06m1 08m1 10m1 12m1 14m1 16m1
per cent Term premium
Average expected short-term interest rate
Long-term interest rate
3
4
5
6
0
3
6
9
04m1 06m1 08m1 10m1 12m1 14m1 16m1
NBP reference rate (left axis)
Average expected short-term interest rate (right axis)
per cent per cent
-1
0
1
2
3
4
5
04m1 06m1 08m1 10m1 12m1 14m1 16m1
per cent Germany Poland United States
QE FED impact QE ECB impact
y = 1,19x + 2,47R² = 0,95
2
3
4
5
-0,5 0 0,5 1 1,5 2
Long
term
inte
rest
rat
e in
Pol
and
Term premium in Germany (per cent)
per cent
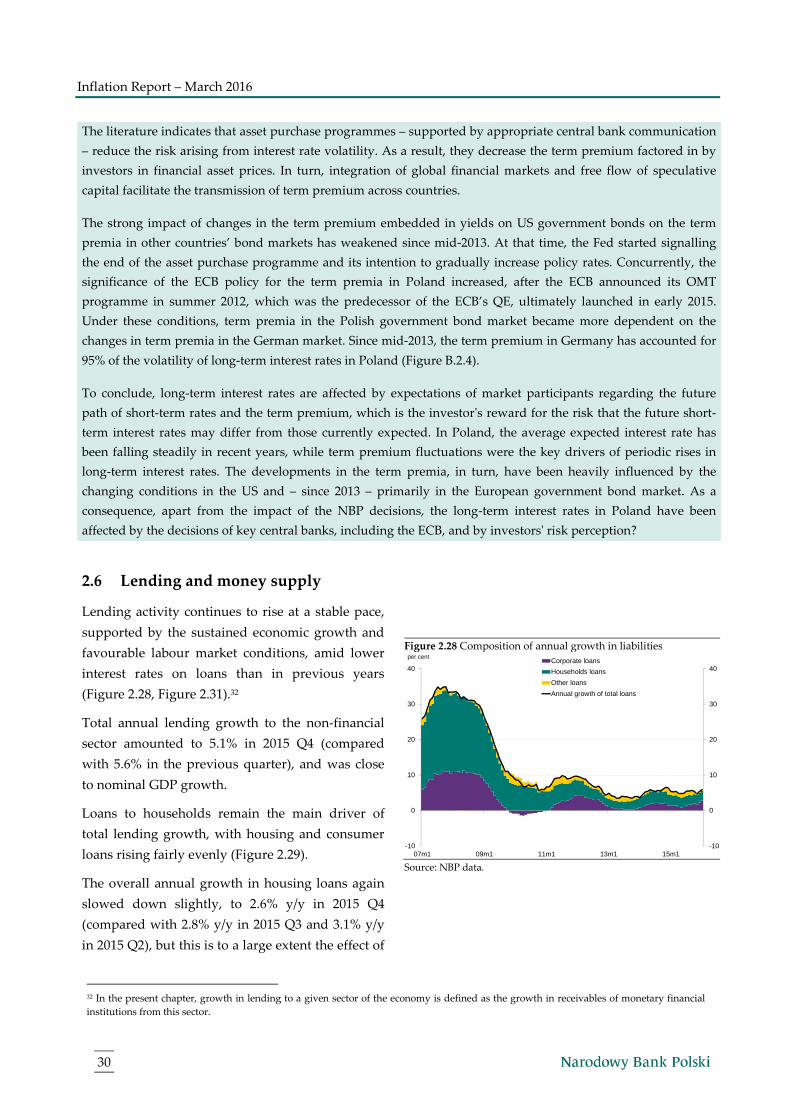
Inflation Report – March 2016
30
The literature indicates that asset purchase programmes – supported by appropriate central bank communication
– reduce the risk arising from interest rate volatility. As a result, they decrease the term premium factored in by
investors in financial asset prices. In turn, integration of global financial markets and free flow of speculative
capital facilitate the transmission of term premium across countries.
The strong impact of changes in the term premium embedded in yields on US government bonds on the term
premia in other countries’ bond markets has weakened since mid-2013. At that time, the Fed started signalling
the end of the asset purchase programme and its intention to gradually increase policy rates. Concurrently, the
significance of the ECB policy for the term premia in Poland increased, after the ECB announced its OMT
programme in summer 2012, which was the predecessor of the ECB’s QE, ultimately launched in early 2015.
Under these conditions, term premia in the Polish government bond market became more dependent on the
changes in term premia in the German market. Since mid-2013, the term premium in Germany has accounted for
95% of the volatility of long-term interest rates in Poland (Figure B.2.4).
To conclude, long-term interest rates are affected by expectations of market participants regarding the future
path of short-term rates and the term premium, which is the investor's reward for the risk that the future short-
term interest rates may differ from those currently expected. In Poland, the average expected interest rate has
been falling steadily in recent years, while term premium fluctuations were the key drivers of periodic rises in
long-term interest rates. The developments in the term premia, in turn, have been heavily influenced by the
changing conditions in the US and – since 2013 – primarily in the European government bond market. As a
consequence, apart from the impact of the NBP decisions, the long-term interest rates in Poland have been
affected by the decisions of key central banks, including the ECB, and by investors' risk perception?
2.6 Lending and money supply
Lending activity continues to rise at a stable pace,
supported by the sustained economic growth and
favourable labour market conditions, amid lower
interest rates on loans than in previous years
(Figure 2.28, Figure 2.31).32
Total annual lending growth to the non-financial
sector amounted to 5.1% in 2015 Q4 (compared
with 5.6% in the previous quarter), and was close
to nominal GDP growth.
Loans to households remain the main driver of
total lending growth, with housing and consumer
loans rising fairly evenly (Figure 2.29).
The overall annual growth in housing loans again
slowed down slightly, to 2.6% y/y in 2015 Q4
(compared with 2.8% y/y in 2015 Q3 and 3.1% y/y
in 2015 Q2), but this is to a large extent the effect of
Figure 2.28 Composition of annual growth in liabilities
Source: NBP data.
32 In the present chapter, growth in lending to a given sector of the economy is defined as the growth in receivables of monetary financial
institutions from this sector.
-10
0
10
20
30
40
-10
0
10
20
30
40
07m1 09m1 11m1 13m1 15m1
Corporate loans
Households loans
Other loans
Annual growth of total loans
per cent
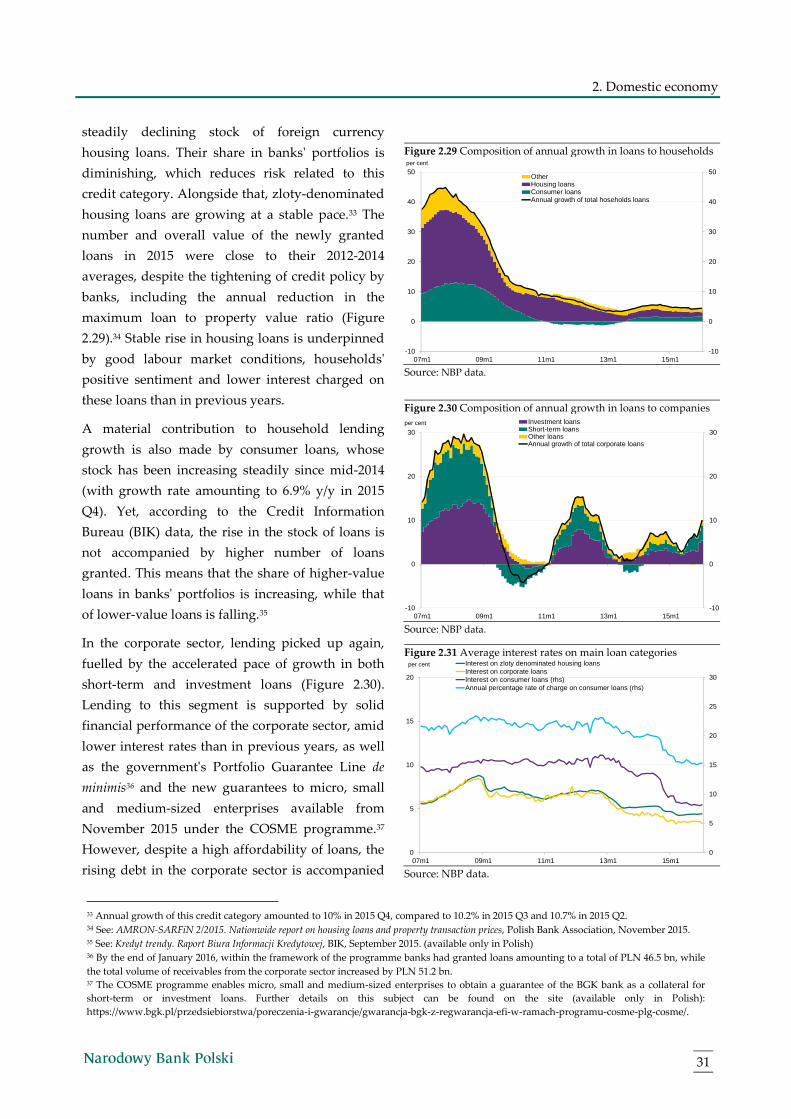
2. Domestic economy
31
steadily declining stock of foreign currency
housing loans. Their share in banks' portfolios is
diminishing, which reduces risk related to this
credit category. Alongside that, zloty-denominated
housing loans are growing at a stable pace.33 The
number and overall value of the newly granted
loans in 2015 were close to their 2012-2014
averages, despite the tightening of credit policy by
banks, including the annual reduction in the
maximum loan to property value ratio (Figure
2.29).34 Stable rise in housing loans is underpinned
by good labour market conditions, households'
positive sentiment and lower interest charged on
these loans than in previous years.
A material contribution to household lending
growth is also made by consumer loans, whose
stock has been increasing steadily since mid-2014
(with growth rate amounting to 6.9% y/y in 2015
Q4). Yet, according to the Credit Information
Bureau (BIK) data, the rise in the stock of loans is
not accompanied by higher number of loans
granted. This means that the share of higher-value
loans in banks' portfolios is increasing, while that
of lower-value loans is falling.35
In the corporate sector, lending picked up again,
fuelled by the accelerated pace of growth in both
short-term and investment loans (Figure 2.30).
Lending to this segment is supported by solid
financial performance of the corporate sector, amid
lower interest rates than in previous years, as well
as the government's Portfolio Guarantee Line de
minimis36 and the new guarantees to micro, small
and medium-sized enterprises available from
November 2015 under the COSME programme.37
However, despite a high affordability of loans, the
rising debt in the corporate sector is accompanied
Figure 2.29 Composition of annual growth in loans to households
Source: NBP data.
Figure 2.30 Composition of annual growth in loans to companies
Source: NBP data.
Figure 2.31 Average interest rates on main loan categories
Source: NBP data.
33 Annual growth of this credit category amounted to 10% in 2015 Q4, compared to 10.2% in 2015 Q3 and 10.7% in 2015 Q2. 34 See: AMRON-SARFiN 2/2015. Nationwide report on housing loans and property transaction prices, Polish Bank Association, November 2015. 35 See: Kredyt trendy. Raport Biura Informacji Kredytowej, BIK, September 2015. (available only in Polish) 36 By the end of January 2016, within the framework of the programme banks had granted loans amounting to a total of PLN 46.5 bn, while
the total volume of receivables from the corporate sector increased by PLN 51.2 bn. 37 The COSME programme enables micro, small and medium-sized enterprises to obtain a guarantee of the BGK bank as a collateral for
short-term or investment loans. Further details on this subject can be found on the site (available only in Polish):
https://www.bgk.pl/przedsiebiorstwa/poreczenia-i-gwarancje/gwarancja-bgk-z-regwarancja-efi-w-ramach-programu-cosme-plg-cosme/.
-10
0
10
20
30
40
50
-10
0
10
20
30
40
50
07m1 09m1 11m1 13m1 15m1
OtherHousing loansConsumer loansAnnual growth of total hoseholds loans
per cent
-10
0
10
20
30
-10
0
10
20
30
07m1 09m1 11m1 13m1 15m1
Investment loansShort-term loansOther loansAnnual growth of total corporate loans
per cent
0
5
10
15
20
25
30
0
5
10
15
20
07m1 09m1 11m1 13m1 15m1
Interest on zloty denominated housing loansInterest on corporate loansInterest on consumer loans (rhs)Annual percentage rate of charge on consumer loans (rhs)
per cent
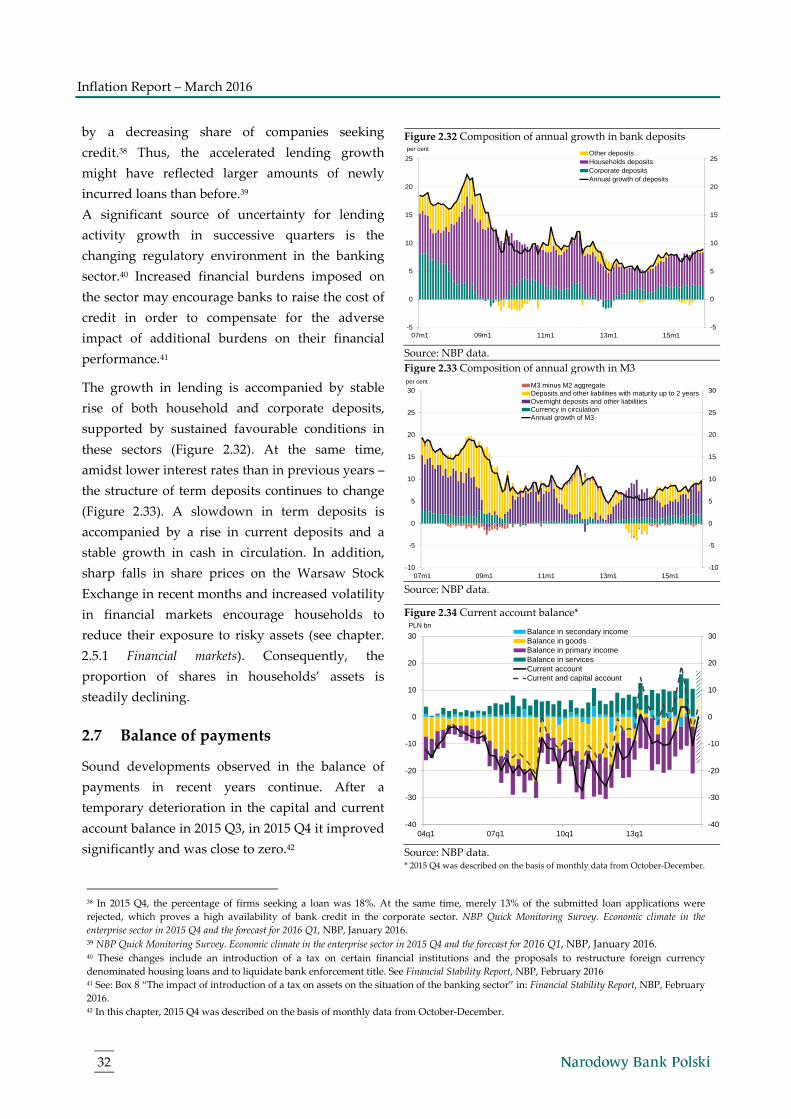
Inflation Report – March 2016
32
by a decreasing share of companies seeking
credit.38 Thus, the accelerated lending growth
might have reflected larger amounts of newly
incurred loans than before.39
A significant source of uncertainty for lending
activity growth in successive quarters is the
changing regulatory environment in the banking
sector.40 Increased financial burdens imposed on
the sector may encourage banks to raise the cost of
credit in order to compensate for the adverse
impact of additional burdens on their financial
performance.41
The growth in lending is accompanied by stable
rise of both household and corporate deposits,
supported by sustained favourable conditions in
these sectors (Figure 2.32). At the same time,
amidst lower interest rates than in previous years –
the structure of term deposits continues to change
(Figure 2.33). A slowdown in term deposits is
accompanied by a rise in current deposits and a
stable growth in cash in circulation. In addition,
sharp falls in share prices on the Warsaw Stock
Exchange in recent months and increased volatility
in financial markets encourage households to
reduce their exposure to risky assets (see chapter.
2.5.1 Financial markets). Consequently, the
proportion of shares in households’ assets is
steadily declining.
2.7 Balance of payments
Sound developments observed in the balance of
payments in recent years continue. After a
temporary deterioration in the capital and current
account balance in 2015 Q3, in 2015 Q4 it improved
significantly and was close to zero.42
Figure 2.32 Composition of annual growth in bank deposits
Source: NBP data.
Figure 2.33 Composition of annual growth in M3
Source: NBP data.
Figure 2.34 Current account balance*
Source: NBP data. * 2015 Q4 was described on the basis of monthly data from October-December.
38 In 2015 Q4, the percentage of firms seeking a loan was 18%. At the same time, merely 13% of the submitted loan applications were
rejected, which proves a high availability of bank credit in the corporate sector. NBP Quick Monitoring Survey. Economic climate in the
enterprise sector in 2015 Q4 and the forecast for 2016 Q1, NBP, January 2016. 39 NBP Quick Monitoring Survey. Economic climate in the enterprise sector in 2015 Q4 and the forecast for 2016 Q1, NBP, January 2016. 40 These changes include an introduction of a tax on certain financial institutions and the proposals to restructure foreign currency
denominated housing loans and to liquidate bank enforcement title. See Financial Stability Report, NBP, February 2016 41 See: Box 8 “The impact of introduction of a tax on assets on the situation of the banking sector” in: Financial Stability Report, NBP, February
2016. 42 In this chapter, 2015 Q4 was described on the basis of monthly data from October-December.
-5
0
5
10
15
20
25
-5
0
5
10
15
20
25
07m1 09m1 11m1 13m1 15m1
Other depositsHouseholds depositsCorporate depositsAnnual growth of deposits
per cent
-10
-5
0
5
10
15
20
25
30
-10
-5
0
5
10
15
20
25
30
07m1 09m1 11m1 13m1 15m1
per centM3 minus M2 aggregateDeposits and other liabilities with maturity up to 2 yearsOvernight deposits and other liabilitiesCurrency in circulationAnnual growth of M3
-40
-30
-20
-10
0
10
20
30
-40
-30
-20
-10
0
10
20
30
04q1 07q1 10q1 13q1
Balance in secondary incomeBalance in goodsBalance in primary incomeBalance in servicesCurrent accountCurrent and capital account
PLN bn
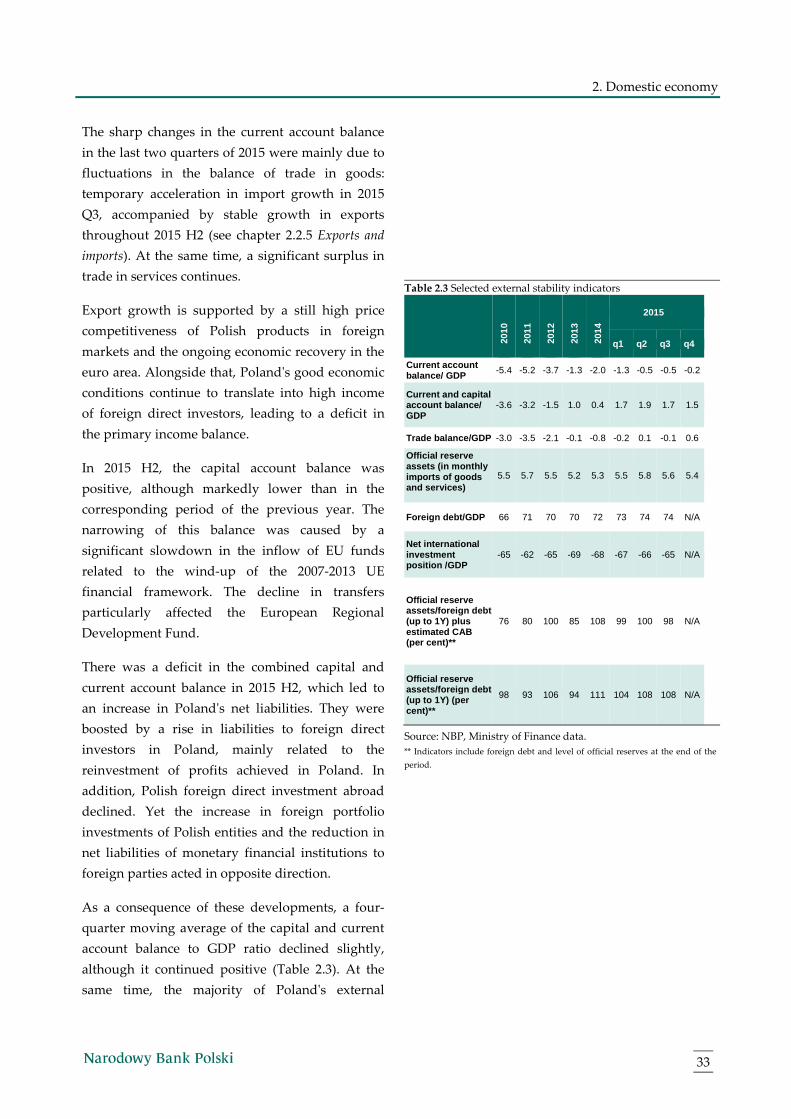
2. Domestic economy
33
The sharp changes in the current account balance
in the last two quarters of 2015 were mainly due to
fluctuations in the balance of trade in goods:
temporary acceleration in import growth in 2015
Q3, accompanied by stable growth in exports
throughout 2015 H2 (see chapter 2.2.5 Exports and
imports). At the same time, a significant surplus in
trade in services continues.
Export growth is supported by a still high price
competitiveness of Polish products in foreign
markets and the ongoing economic recovery in the
euro area. Alongside that, Poland's good economic
conditions continue to translate into high income
of foreign direct investors, leading to a deficit in
the primary income balance.
In 2015 H2, the capital account balance was
positive, although markedly lower than in the
corresponding period of the previous year. The
narrowing of this balance was caused by a
significant slowdown in the inflow of EU funds
related to the wind-up of the 2007-2013 UE
financial framework. The decline in transfers
particularly affected the European Regional
Development Fund.
There was a deficit in the combined capital and
current account balance in 2015 H2, which led to
an increase in Poland's net liabilities. They were
boosted by a rise in liabilities to foreign direct
investors in Poland, mainly related to the
reinvestment of profits achieved in Poland. In
addition, Polish foreign direct investment abroad
declined. Yet the increase in foreign portfolio
investments of Polish entities and the reduction in
net liabilities of monetary financial institutions to
foreign parties acted in opposite direction.
As a consequence of these developments, a four-
quarter moving average of the capital and current
account balance to GDP ratio declined slightly,
although it continued positive (Table 2.3). At the
same time, the majority of Poland's external
Table 2.3 Selected external stability indicators
2010
2011
2012
2013
2014
2015
q1 q2 q3 q4
Current account balance/ GDP -5.4 -5.2 -3.7 -1.3 -2.0 -1.3 -0.5 -0.5 -0.2
Current and capital account balance/ GDP
-3.6 -3.2 -1.5 1.0 0.4 1.7 1.9 1.7 1.5
Trade balance/GDP -3.0 -3.5 -2.1 -0.1 -0.8 -0.2 0.1 -0.1 0.6
Official reserve assets (in monthly imports of goods and services)
5.5 5.7 5.5 5.2 5.3 5.5 5.8 5.6 5.4
Foreign debt/GDP 66 71 70 70 72 73 74 74 N/A
Net international investment position /GDP
-65 -62 -65 -69 -68 -67 -66 -65 N/A
Official reserve assets/foreign debt (up to 1Y) plus estimated CAB (per cent)**
76 80 100 85 108 99 100 98 N/A
Official reserve assets/foreign debt (up to 1Y) (per cent)**
98 93 106 94 111 104 108 108 N/A
Source: NBP, Ministry of Finance data.
** Indicators include foreign debt and level of official reserves at the end of the
period.

Inflation Report – March 2016
34
imbalance indicators remained favourable, and the
ratio of the current account balance to GDP is the
highest since 1995.
3. Monetary policy in November 2015 – March 2016
35
Monetary policy in November 2015 – March
2016
At the meetings between November 2015 and March 2016 the Council kept the NBP interest rates unchanged
at the following levels: reference rate 1.50%, lombard rate 2.50%, deposit rate 0.50%, rediscount rate 1.75%.
What follows in the next part of the chapter are the previously published Minutes of the Monetary Policy
Council decision-making meetings held between November 2015 and February 2016 as well as the Information
from the meeting of the Monetary Policy Council in March 2016. Minutes of the Monetary Policy Council decision-
making meeting in March 2016 will be published on 17 March, and thus included in the next Report.
Minutes of the Monetary Policy Council decision-
making meeting held on 4 November 2015
Members of the Monetary Policy Council discussed
monetary policy against the background of
macroeconomic developments in Poland and abroad
as well as the results of the November projection of
inflation and GDP.
When discussing economic activity abroad, the
Council members underlined that the continued
recovery in developed countries had been
accompanied by a slowdown in GDP growth in the
largest emerging economies, and even recession in
some of them. They pointed out that in the United
States – despite the sustained recovery – recent
incoming data had been somewhat weaker. In this
context, Council members highlighted the decline in
GDP growth rate in 2015 Q3, slower improvement in
the labour market, lower growth of industrial output
and deterioration of business sentiment. However, it
was judged that the slowdown in economic activity
growth in the United States had been most likely
temporary.
Council members underlined that in the euro area
economic growth continued at a stable, although
moderate, rate. Economic growth had been
supported by improving consumer demand and
growing exports, partly related to the previously
observed weakening of the euro exchange rate. At
the same time it was pointed out, that investment
growth had remained low. Some Council members
judged that economic activity in the euro area was
supported by the expansionary monetary policy of
the European Central Bank. However, certain
Council members were of the opinion that the main
factor behind the growth in demand in the euro area
economy was the sharp fall in commodity prices,
which increased real disposable income, while the
impact of the ECB’s monetary policy on the economic
activity was negligible.
While discussing the economic outlook in the euro
area, some Council members pointed out that the
slowdown in growth in the emerging economies,
including China and Russia, was a risk factor for the
euro area economy. This slowdown had already
translated into a fall in euro area exports to these
economies. However, some Council members
emphasised that in the recent period the risk of a
sharp slowdown in economic growth in China had
declined, which was indicated by the better than
expected GDP data. Moreover, they pointed out that
the economic slowdown observed so far in China
had not had strong negative impact on economic
activity in the euro area. Certain of these members
Inflation Report – March 2016
36
also argued that – despite the slowdown – growth in
China would remain markedly higher than in the
developed economies, therefore it would not
significantly limit GDP growth in the euro area.
Moreover, certain Council members pointed out that
the influx of immigrants could support economic
activity through higher consumption and housing
investment. Growth in the euro area could be also
supported by investment financed by the European
Fund for Strategic Investments.
Referring to monetary policy of the major central
banks, Council members emphasised that
uncertainty about its outlook persisted. It was
pointed out that despite the somewhat worse data in
the United States, the Federal Reserve announced
interest rate hike in the coming months. On the other
hand, the ECB was signalling further monetary
policy easing due to the persistence of very low price
growth in the euro area.
Council members emphasised that expectations of
the ECB’s monetary easing and better than expected
data from China had contributed to an improvement
in sentiment in the financial markets. However, some
Council members judged that volatility in the
financial markets could once again increase along
with the beginning of Fed’s monetary policy
tightening, particularly in the context of continued
risks to the economic situation in the emerging
economies, including China.
Referring to the economic situation in Poland,
Council members pointed out that economic activity
continued to expand steadily and that domestic
demand remained the main driver of growth. It was
emphasised that the situation in the labour market
further improved, and employment in enterprises –
like the number of job vacancies – was relatively
high. At the same time, the unemployment rate was
close to the pre-crisis level. Moreover, some Council
members pointed to the acceleration in wage growth
in enterprises in the recent month. Council members
underlined that the robust labour market and the
increase in the wage fund supported stable
consumption growth. However, some Council
members judged that consumption growth remained
relatively low, which could be due to the sustained
increase in the household saving rate, observed
despite the low nominal NBP interest rates.
When addressing the business conditions in Poland,
Council members pointed to the stable growth in
industrial output and the continued good situation of
enterprises as indicated by business sentiment
surveys. It was emphasised that these surveys
suggested that despite the economic slowdown in
China, Polish enterprises had not so far experienced
considerable fall in sales. However, some Council
members argued that despite the good economic
situation, many enterprises were refraining from
investments. They judged that this could be due to
the continued uncertainty about the situation in the
global economy or the lack of conviction as to the
sustainability of the recovery in demand in Poland.
While analysing the situation on the credit market,
Council members pointed to the stable growth in
lending in the economy, with a slight deceleration in
lending to households and an increase in corporate
lending growth. Certain Council members stressed
that corporate demand for credit remained low due
to the significant share of companies’ own funds in
financing investments. It was also underlined that in
the housing credit market there were no signs of
growing imbalances.
While discussing inflation developments in the
economy, Council members emphasised that
consumer price growth remained negative. It was
pointed out that in October price growth was once
again lower than its forecast. However, it was judged
that low price growth remained to be a global
phenomenon and resulted mainly from the sharp fall
in commodity prices in the global markets. At the
same time, Council members emphasised that low
price growth was accompanied by stable GDP
growth and improving labour market conditions.
3. Monetary policy in November 2015 – March 2016
37
Certain Council members pointed out that the fall in
prices – largely driven by low commodity prices –
supported real incomes of consumers and limited
production costs of enterprises.
While discussing the November projection, it was
pointed out that the coming quarters were expected
to see further stable GDP growth, supported by
domestic demand. At the same time, it was
emphasised that the contribution of net exports to
growth would remain negative. Despite this, Council
members pointed to the lack of significant risk to the
external balance of the economy. Some Council
members judged that – in line with the projection –
GDP growth in 2016 could temporarily decrease. This
fall, however, would be associated with a
temporarily lower inflow of EU funds due to the
beginning of absorption of funds from the new
budgetary perspective. However, certain Council
members emphasised that the GDP growth forecast
for the coming years was slightly lower than in the
previous projection, which partly resulted from a
downward revision of forecast for corporate
investments.
While analysing the results of the projection, Council
members pointed out that due to stable GDP growth
continuing above the potential rate, the output gap
would gradually close. However, certain Council
members expressed the view that so far observed and
projected investment growth, would raise the
potential output. As a result, growth of potential
GDP could be faster than in the projection, which
along with the forecast growth of actual GDP might
not lead to the closure of the output gap in the
projection horizon. At the same time, certain Council
members emphasised that the lowering of the
equilibrium unemployment rate would be a factor
increasing the potential output of the economy and
would simultaneously limit wage pressure in the
economy.
While discussing the outlook for inflation in the
context of the projection, Council members judged
that in the coming quarters price growth would
slowly increase. Price growth would be supported by
stable growth in demand observed against the
background of an improving economic situation in
the euro area and the robust domestic labour market.
At the same time, certain Council members pointed
out that the period of deflation had prolonged, and
the expected return of inflation to the target in the
projection had receded. Certain Council members
expressed the opinion that since they expected low
commodity prices to persist in the global markets,
and due to the limited growth of demand in the
environment of the Polish economy, and therefore
also in Poland, there was a risk of price growth
continuing at a very low level for more prolonged
period.
While referring to the projection, Council members
pointed to the risk to the base scenario. The
continued uncertainty about the global outlook,
commodity prices and price growth in the
environment of the Polish economy were
emphasised. It was also stressed that due to the
appointment of the new government, there was
uncertainty about the future economic policy,
particularly the shape of fiscal policy in the next year.
While discussing interest rates, the Council assessed
that they should remain unchanged. While justifying
this decision, Council members argued that in the
coming quarters price growth would rise slowly,
which would be driven by stable economic growth
and the gradual closing of the output gap. Council
members emphasised that prolonged deflation in
Poland was mainly related to the factors beyond the
reach of domestic monetary policy, among others,
low commodity prices and low price growth abroad.
Certain Council members also expressed the opinion
that although GDP growth might remain below
potential, the source of the negative output gap
would continue to be external, and therefore it would
remain beyond the influence of domestic monetary
policy.
Inflation Report – March 2016
38
Some Council members argued that an additional
factor in favour of a stabilisation of interest rates was
the persisting uncertainty about the economic
outlook abroad and the monetary policy of the main
central banks, which could contribute to volatility in
the financial markets, including volatility of
exchange rates of the emerging economies. Some
Council members also stressed the uncertainty about
the shape of future economic policy, which should be
taken into account in monetary policy decisions in
order to ensure an optimal macroeconomic policy-
mix.
Certain Council members were of the opinion that
although interest rates should remain unchanged at
the current meeting, in the coming months it could
not be excluded that a slight lowering of the rates
might be needed. While justifying this view, these
members pointed to the risk of deflation persisting
longer than expected which would shift the prospects
of inflation returning to the target, and the risk of a
slowdown in economic growth.
The Council decided to keep the NBP interest rates
unchanged: the reference rate at 1.50%, the lombard
rate at 2.50%, the deposit rate at 0.50%, the rediscount
rate at 1.75%.
Minutes of the Monetary Policy Council decision-
making meeting held on 2 December 2015
Members of the Monetary Policy Council discussed
monetary policy against the background of current
and future macroeconomic developments in Poland
and abroad.
When discussing economic activity abroad, Council
members drew attention to the continued moderate
recovery in developed countries. They underlined
that consumer demand continued to be the main
growth factor in the euro area. In turn, investment
growth in this economy was still relatively low. It
was pointed out that the pace of recovery was also
hampered by the low demand in the emerging
markets. This factor was most likely responsible for
the slight drop in GDP growth in the euro area in
2015 Q3 and also the marked fall in German export
growth. However, Council members judged that in
the coming quarters the economic conditions in the
euro area would probably continue to gradually
improve. Growth in economic activity in this
economy – in the opinion of the Council members –
could additionally be supported by an increase in
consumption and housing investment connected
with the influx of immigrants. The possibility of a
further slowdown in growth of the emerging
economies remained a risk factor for the economic
situation in the euro area.
In the United States the economic outlook remains
moderately favourable. It was pointed out that the
slowdown in GDP growth in 2015 Q3 resulted
mainly from the drop in inventory and was probably
temporary. However, it was underlined that the low
growth in industrial output and retail sales suggested
that the pick-up in GDP growth in the coming
quarters might be moderate. Certain Council
members were of the opinion that also in the long
term economic growth in the United States might
remain moderate due to the slow growth in
productivity in the US economy. In this context, they
underlined that in comparison with previous phases
of the recovery, GDP growth in the United States is
currently low.
Council members drew attention to the continued
weak economic situation in the emerging economies.
However, it was pointed out that in some of these
economies there are signals of economic activity
stabilising. In this context, attention was drawn to the
reduction in scale of the GDP decline in Russia in
2015 Q3 and slower contraction in Russia's industrial
output, as well as the slightly better PMI in China.
Certain Council members judged that the risk of
severe shocks in the global economy remained, and
that the likelihood of their materialisation is
increased by the imbalances in many asset markets.
In the opinion of these Council members, significant
3. Monetary policy in November 2015 – March 2016
39
risk is posed by the possibility of financial crises in
the emerging markets related to the considerable
currency debts of these countries' enterprises. These
Council members assessed that the occurrence of
disturbances in the emerging markets - accompanied
by relatively low GDP growth in the United States -
could lead to deterioration in global economic
conditions.
Referring to monetary policy of the major central
banks, Council members emphasised that in the near
future the divergence between the monetary policies
of the Federal Reserve and the ECB would grow. The
Federal Reserve announced the beginning of the
cycle of interest rate hikes in the next months. In
turn, the ECB signaled further easing of monetary
policy. Council members emphasised that the
divergence of monetary policy between the major
central banks could lead to periodic increase in
financial market volatility, particularly considering
the continued uncertainty as to the scale and timeline
of the Fed's interest rate hikes. Risk aversion in the
financial markets could also increase in reaction to a
renewed rise of fears about the economic situation of
the emerging economies.
Certain Council members judged that global factors
would strongly affect the asset prices and exchange
rates of the emerging economies, including Poland.
At the same time, it was underlined that the
exchange rate of the zloty - despite a certain
weakening in the recent period - remained relatively
stable. In the opinion of some Council members, the
volatility of the zloty is limited by the positive
assessment of Poland by foreign investors, the effect
of which is a significant share of long-term investors
in structure of Poland's foreign debt.
While analysing the situation in Poland’s real
economy, Council members pointed to the continued
stable GDP growth, and even its’ slight acceleration
in 2015 Q3. The main growth factor continued to be
consumer demand, supported by growing
employment and positive household sentiment. At
the same time, in the view of some of the Council
members, growth of consumer spending remained
moderate due to the relatively low nominal wage
growth and a higher rate of voluntary saving than
earlier. It was pointed out that the growth in
investment also contributed to GDP growth,
although it had slowed down in 2015 Q3 -. Certain
Council members judged that the investment
slowdown in the economy could be connected with
the lower absorption of EU funds. In turn, according
to some Council members, the corporate propensity
to invest could be reduced by the uncertainty
regarding the economic situation abroad. It was
pointed out that net exports also had a positive
contribution to GDP growth in 2015 Q3. However,
certain Council members underlined that growth of
Poland's foreign trade had slowed down, while
import growth had decelerated more than exports.
While discussing the situation in the labour market,
Council members pointed out that the level of
employment was high and that the unemployment
rate was close to the pre-crisis level. Certain Council
members emphasised that, despite the very
favourable situation in the labour market, nominal
wage growth in the economy remained relatively
low. Other Council members also stressed that wage
levels in Poland remained low compared to West
European countries and pointed out that their
growth required an increase in innovation and
technological advancement of Polish production.
While analysing the situation on the credit market,
Council members pointed to a certain pick-up in
growth of corporate loans. Certain Council members
judged that the growth of loans to enterprises was
only modest, and in the case of SMEs, low. These
Council members pointed out that the corporate
loans to GDP ratio in Poland was considerably lower
than in the euro area. However, some Council
members underlined that currently the growth of
corporate loans - amidst low interest rates and their
high availability - was not restricted by supply
factors. At the same time, certain Council members

Inflation Report – March 2016
40
judged that an increased financial burden imposed
on the banking sector could most likely adversely
affect the credit supply in the future.
Referring to the outlook for economic growth, the
majority of Council members believed that in the
coming quarters GDP growth would remain
relatively stable. Certain Council members even
assessed that, provided GDP growth would not be
weakened by external shocks, growth in 2016 could
be higher than in 2015. The economic growth would
continue to be supported by strong consumer
demand and investment. However, it was pointed
out that investment growth might slow down. The
temporarily reduced inflow of EU funds in the initial
phase of the new budget perspective would
contribute to this process. In the opinion of certain
Council members, corporate investment growth
might be restricted by the relatively high level of
investment outlays of enterprises in relation to fixed
assets, and the moderate growth in demand, which
did not create incentives to expand production
capacity.
Council members judged that – besides domestic
demand – rising exports would also boost economic
activity in Poland. Certain Council members were of
the opinion that in connection with the current
economic recovery in the euro area, export growth
would be higher than GDP growth. At the same time,
it was pointed out that the weakening of foreign
trade related to the further slowdown in emerging
economies remained the main risk for domestic
economic activity. Certain Council members also
judged that possible financial crises in the emerging
economies and resulting weakening of the global
economy might be the source of negative shocks for
the Polish economy.
While discussing inflation developments in Poland,
Council members pointed out that the scale of
consumer price deflation was gradually declining.
Council members argued that in the coming quarters
price growth would continue to rise, driven by
further stable growth in economic activity and the
robust domestic labour market. However, some
Council members pointed out that the increase in
price growth was slow and weaker than expected.
Certain Council members highlighted that if wage
growth did not pick up, the return of inflation to the
target could lengthen. In this context, certain Council
members pointed out that the announced unfreezing
of wages in the public sector - in addition to the low
unemployment - may contribute to a pickup in wage
growth in 2016.
Council members discussed monetary policy
conducted in the years 2010-2015. It was assessed
that in this period the long-term stability of prices in
Poland had been maintained, despite the increased
volatility of price growth in certain years. It was
pointed out that inflation volatility was mainly the
effect of sharp changes in commodity prices in global
markets. At the same time is was emphasised that
monetary policy supported the stability of the zloty,
which during the term of office of the Council was
one of the least volatile currencies. It was also
underlined that the flexible response of monetary
policy to shocks contributed to the maintenance of
balanced economic growth and financial stability. In
this context, Council members pointed to, above all,
the low volatility of the output gap, the current
account surplus, and the maintenance of lending
growth at a stable level.
While discussing interest rates, the Council assessed
that they should remain unchanged. Council
members argued that in the coming quarters price
growth would pick up slowly, which would be
driven by stable economic growth and the gradual
closing of the output gap. Council members judged
that in the light of available data and forecasts, the
current level of interest rates is conducive to keeping
the Polish economy on a sustainable growth path and
sustaining macroeconomic balance.
Some Council members stressed that the persistence
of uncertainty regarding the domestic and external
3. Monetary policy in November 2015 – March 2016
41
developments also spoke in favour of interest rate
stability. In this context, they pointed above all to the
persistent risk of sharper weakening of growth in
emerging economies and the expected growing
divergence of monetary policies of the main central
banks, which could contribute to an increase in
volatility in financial markets. They also pointed to
the uncertainty regarding the shape of future
economic policy.
Certain Council members thought that the Council
should consider interest rate increases in the nearest
months. They argued that this would provide more
room for monetary easing in the event of strong
external shocks. These Council members argued that
in the absence of interest rate hikes, monetary policy
would become procyclical, contributing to a
deterioration of the current account balance and an
increase in Poland's foreign liabilities. The rising
dependence of the Polish economy on foreign finance
could, in turn, limit the possibility to conduct
countercyclical monetary policy in the future, due to
the concerns about a sharp change in the zloty
exchange rate and flows of foreign capital.
However, certain Council members were of the
opinion that although at the current meeting interest
rates should remain unchanged, in the coming
months – as the uncertainty about the determinants
of monetary policy abates - it could be justified to
lower them. These Council members pointed out that
price growth was slow and inflation forecasts for the
coming years were being revised downwards. These
Council members also judged that a possible easing
of monetary policy would contribute to a recovery of
lending to enterprises which – particularly in the case
of the SME sector – remained relatively weak.
However, the easing of monetary policy could be
pursued amid stable exchange rate. Other Council
members argued that lowering interest rates would
not contribute to acceleration of corporate lending –
which was restricted by demand factors – yet it could
have an adverse effect on the stability of the financial
system.
The Council decided to keep the basic NBP interest
rates unchanged: the reference rate at 1.50%, the
lombard rate at 2.50%, the deposit rate at 0.50% and
the rediscount rate at 1.75%.
Minutes of the Monetary Policy Council decision-
making meeting held on 14 January 2016
At the meeting, members of the Monetary Policy
Council discussed monetary policy against the
background of current and future macroeconomic
developments in Poland and abroad.
When discussing the economic situation abroad,
Council members pointed to the sustained recovery
in the euro area and in the United States. At the same
time, it was noted that euro area economic activity
growth remained moderate, and price growth in this
currency area was still close to zero. It was observed
that economic conditions in the United States
continued to be favourable, although GDP growth
would probably rise only slightly this year. At the
same time it was emphasised that given the steady
output growth in this economy since 2010, core
inflation was markedly higher than consumer price
growth, and the unemployment rate was running
relatively low. Council members highlighted, that
under these circumstances, monetary policy stances
of the ECB and the Federal Reserve diverged further.
The Federal Reserve had raised policy interest rates
after keeping them close to zero for seven years. In
this context, some Council members expressed the
opinion that any further tightening of monetary
policy by the Federal Reserve would be only gradual
and contingent upon the incoming information on
the economic conditions. In contrast, the ECB had
eased the monetary policy again by extending the
period for its asset purchases and decreasing the
deposit rate. However, the extent of the easing was
smaller than expected by the financial markets.
While discussing economic conditions in emerging
economies, Council members judged that these
continued to be weak. Council members pointed to
Inflation Report – March 2016
42
the continued recession and the persistently high
inflation in Russia and Brazil. It was assessed that
economic conditions in these countries were likely to
deteriorate even further. While discussing the
situation in China, Council members stressed that the
recently released data had not been conclusive: while
some of it had indicated stabilisation of economic
activity growth, there had also been signs of an even
deeper slump. Certain Council members held the
view that economic growth in China might
decelerate further, and high debt levels of economic
agents in this country posed a risk of a sharp
weakening of growth. Other Council members
pointed out that China's economic policy would
continue to aim for maintaining the stability of
economic growth and financial system, which should
mitigate the impact of any further weakening of the
Chinese economy. Council members assessed that
the economic outlook for China continued to be the
main source of uncertainty for the global economy.
The Council also pointed to developments in
commodity prices, including oil prices, as another
major source of uncertainty about the global
economic outlook. It was stressed that in the recent
period the price of this commodity had plunged to a
very low level, which would dampen global
consumer price growth in the subsequent quarters.
At the same time, it was underlined that amidst the
mounting conflict between two major oil producers,
i.e. Saudi Arabia and Iran, heightened uncertainty
prevailed as to the expected output level, and hence
also future prices of this commodity.
Council members emphasised the fact that sharp
declines in oil prices, changes in the expectations
about the future decisions of major central banks and
continued concerns about economic activity in China
had recently boosted asset price volatility in the
financial markets. It was observed that some of these
factors had increased investors risk aversion. This
was reflected in declining asset prices and weakening
currencies of emerging economies, including Poland.
While discussing the situation in Poland's real
economy, Council members pointed to the continued
stable economic activity growth. Retail sales data
were judged to indicate sustained consumer demand
expansion, at a rate close to that observed in the
previous quarters. Consumption growth continues to
be supported by rising employment and robust
consumer sentiment. With regard to investment, it
was observed that its growth was being fuelled by
the high degree of capacity utilisation in companies
amidst stable industrial output growth. At the same
time, it was pointed out that firms' propensity to
invest may be undermined by heightened
uncertainty about the domestic and external
environment of their activity. Certain Council
members believed that consumption and investment
growth remained merely moderate.
Council members pointed out that GDP growth in
the following quarters would be supported by
further decline in oil prices. At the same time, it was
underlined that lower prices of this commodity
would have an adverse impact on some businesses,
especially mining sector companies and firms whose
production was aimed at oil net exporting countries.
With reference to the situation in the labour market,
sustained employment growth and declining
unemployment were highlighted. Certain Council
members observed that improving labour market
conditions had not yet generated any tangible
increase in nominal wage growth in the economy. At
the same time, wage growth had recently accelerated
somewhat in the corporate sector, and the share of
firms planning pay rises had increased, which may
signal a gradual rise in wage pressure in the
economy, which - if it materialised - would support
the return of consumer price growth towards the
inflation target.
Council members discussed fiscal policy in the
context of the 2016 Draft Budget Act. Most members
judged that the fiscal policy as set out in the Draft
Budget Act did not entail an increase in public

3. Monetary policy in November 2015 – March 2016
43
finance imbalance in 2016. At the same time,
members deemed that due to lags in monetary policy
transmission, the shape of the 2017 fiscal policy was
of key importance for the current interest rates
decisions. In this context, it was pointed out that one-
off revenues will make an important source of
financing of the new budget expenditure in 2016.
Thus, in order to keep the deficit at a moderate level
in 2017, new, stable sources of budget revenue would
have to be found. Some Council members assessed
that the increased spending on social benefits –
including the introduction of the Family 500+
programme – might stimulate consumption growth.
Referring to the impact of the imposition of tax on
financial institutions, these members expressed the
view that it could lead to an increase in cost of
obtaining credit and a slowdown in lending. With
reference to the sales tax to be imposed on stores,
Council members stated that in the absence of
detailed information on this tax, it was difficult to
evaluate its consequences; however, it could possibly
add to price growth. Certain Council members
expressed the opinion that the changes in fiscal
policy may diminish the resilience of the Polish
economy to external shocks, thus narrowing down
the margin for a possible monetary policy easing.
When analysing the situation in the credit market,
Council members pointed out that stable, moderate
credit growth had been sustained. At the same time,
some Council members underlined that lending
growth in the following quarters might be hampered,
on the one hand, by the lowering of the ceiling on the
LtV ratio for mortgage loans, resulting from
Recommendation S, and, on the other hand, by a
possible rise in the borrowing cost after the
imposition of the bank tax.
While discussing inflation developments in Poland,
members of the Council indicated that the scale of
consumer price deflation in December declined only
slightly. Council members assessed that in the
coming quarters CPI would continue to rise slowly,
yet, due to a further fall in commodity prices, growth
of consumer goods and services prices was likely to
be significantly lower than previously estimated. It
was pointed out that price growth would be
supported by the closing of the output gap, amidst
the recovery in the euro area and the robust domestic
labour market. Council members also pointed out
that the continued deflation did not yet have any
adverse effect on decisions of economic agents. Some
Council members expressed the opinion that it was
necessary to closely monitor the impact of negative
price growth on decisions of economic agents, in
particular on financial situation of enterprises.
While discussing interest rates, the Council decided
that they should be kept unchanged. It was assessed
that the available data and forecasts suggested that
the current level of interest rates helped to keep the
Polish economy on a sustainable growth path and to
maintain macroeconomic stability. It was argued that
in the coming quarters price growth would slowly
pick up. It was also noted that the likely slowdown in
CPI growth as compared to the previous expectations
was driven by declining oil prices in the global
commodity markets, a factor beyond the influence of
the domestic monetary policy. It was further noted
that given the lags in the transmission mechanism of
monetary policy, current decisions on interest rates
would not affect price growth until the negative
impact of declining energy commodity prices on
inflation had already diminished. However, in the
medium term CPI growth would be supported by
steady growth in domestic economic activity. At the
same time the rise in price growth may be driven up
by the imposition of the sales tax on stores.
Some members of the Council emphasized that one
of the arguments in favour of stabilization of interest
rates was the continued uncertainty about the
external and domestic determinants of monetary
policy. It was also pointed out that this uncertainty
was reflected in movements of the prices of Polish
assets and the zloty. Certain Council members were
of the opinion that in these conditions the decisions
on interest rates should take into account their
Inflation Report – March 2016
44
impact on the financial markets. Moreover, some
Council members assessed that when deciding about
the level of interest rates they should factor in their
impact on the financial sector stability. In this
context, those members pointed out that interest rate
cuts could have a negative impact on the
performance of the banking sector, a factor which
could not be downplayed given the increased
financial burden imposed on the sector.
Certain members of the Council were of the opinion
that in the coming months it might be justified to
consider interest rate hikes. They argued that this
would leave more room for monetary policy
response to severe external shocks. In contrast, other
Council members were of the opinion that it might be
justified to cut the interest rates in the coming
months. Those members pointed to a merely modest
– in their opinion – growth in domestic demand and
a relatively high level of real interest rates, as well as
forecasted low price growth.
The Council decided to keep the NBP interest rates
unchanged: the reference rate at 1.50%, the lombard
rate at 2.50%, the deposit rate at 0.50% and the
rediscount rate at 1.75%.
Minutes of the Monetary Policy Council decision-
making meeting held on 3 February 2016
Members of the Monetary Policy Council discussed
monetary policy against the background of current
and future macroeconomic developments in Poland
and abroad.
When discussing economic activity abroad, it was
highlighted that recovery in the euro area was
progressing, supported by consumer demand growth
fuelled by improving labour market conditions.
However, certain Council members stressed that,
despite economic recovery, GDP growth in the euro
area remained relatively weak. Attention was drawn
to recent economic developments in the United
States, which remained favourable, notwithstanding
a slowdown in the second half of 2015. At the same
time, the Council members emphasized that
economic conditions in emerging market economies
were deteriorating. It was highlighted that GDP
growth in China continued to slow down and
underlined that it could decelerate further due to
significant imbalances in China and limited scope to
stimulate this economy. The Council members also
pointed out that Brazil, Russia and Ukraine remained
in a deep recession. Some Council members
emphasised that deteriorating economic conditions
in emerging market economies had already led to a
decline in export growth of Germany, Poland's main
trading partner, which could in turn result in weaker
growth of Polish exports.
It was underlined that deteriorating economic
conditions in emerging market economies could
result in lower growth in other economies. In
consequence, risk aversion in international financial
markets has risen and global financial asset prices
have fallen markedly. In this context, it was
highlighted that many emerging market currencies,
including the zloty, had also depreciated.
The Council members also noted that prices for crude
oil and other commodities were still very low. It was
assessed that low commodity prices were conducive
to slower price growth worldwide. Certain Council
members underlined that in some countries lower
commodity prices were translating into larger
purchasing power of households and higher
consumer spending. At the same time, some Council
members indicated that in commodity exporters, the
fall in commodity prices resulted in decelerating
economic growth, in some cases even in a recession.
These Council members stressed that declining
mining investment expenditures were one of the
main reasons behind the economic slowdown in the
United States in the second half of 2015.
Some Council members pointed to a recent rise in
uncertainty regarding the world economic outlook,
including not only the emerging market economies,
but also the United States. Therefore, the Federal
3. Monetary policy in November 2015 – March 2016
45
Reserve indicated that interest rates in the US might
be raised at a slower pace than previously expected.
The ECB, in turn, pointed to a likely increase in
monetary expansion in the coming months, as the
inflation forecasts for the euro area had been revised
downwards due to falling commodity prices. Some
Council members judged that the more expansionary
monetary policy outlook in the core economies might
have contained the fall in Polish financial asset prices
and the depreciation of the zloty.
While analysing the economic conditions in Poland,
attention was drawn to preliminary estimate of
national accounts for 2015 that pointed to an
acceleration in GDP growth in 2015 Q4. It was
underlined that domestic demand remained the main
driver of economic growth. It was highlighted that
investment and consumption growth had probably
accelerated slightly in 2015 Q4 on the back of
improving labour market conditions, envisaged by a
further fall in unemployment rate, continued high
employment and stable wage growth. The rise in
demand is also supported by positive consumer
sentiment, good financial standing of enterprises and
their high capacity utilization. However, certain
Council members noted that sentiment in industry
had deteriorated somewhat of late, but stressed that
it was not reflected in broader data on economic
activity. Some Council members indicated that
despite deteriorating conditions in the emerging
market economies, Polish exports continued to grow
and external trade balance remained positive.
Discussing the economic growth outlook, the
majority of the Council members judged that it
would most likely remain stable in the coming
quarters. They highlighted that consumer demand
growth in the near future could be supported by a
likely further improvement in labour market
conditions, the recent renewed fall in fuel prices and
a rise in disposable income of some households
resulting from family benefits (Family 500+
government programme, which is to be launched in
the coming months). Moreover, certain Council
members argued that the recent depreciation of the
zloty could improve price competitiveness of Polish
exports, leading to higher GDP growth. Some
Council members also pointed to high capacity
utilisation in the economy, which should support
replacement investments of enterprises, particularly
given ongoing high industrial production growth.
Corporate investment growth will also be supported
by good financial standing of enterprises. However,
as highlighted by some Council members, the fall in
commodity prices has an adverse effect on the
profitability of the Polish energy industry. Certain
Council members expressed concerns that rising risk
in the environment of the Polish economy might
prove a drag for economic growth in the coming
quarters.
During a discussion on inflation developments in
Poland, it was stressed that price growth remained
negative. It was highlighted that price growth most
likely would stay below zero for longer than
previously expected. The main reasons for that are
the fall in crude oil prices in the recent months and a
reduction in energy tariffs on sale and distribution of
gas and electricity for households effective from the
beginning of 2016. It was underlined that price
growth was also contained by the lack of inflation
pressure resulting from a negative output gap as well
as no wage pressure despite improving labour
market conditions. Moreover, certain Council
members were of the opinion that a Russian embargo
on Polish food exports was also contributing to lower
food prices in the domestic market.
Council members assessed that stable economic
growth should support a gradual rise in core
inflation, thus contributing to higher CPI growth. At
the same time, some Council members pointed to
upside risks to price growth in the coming months.
Some of them pointed to a rise in probability that the
output gap might close earlier than previously
expected given a likely acceleration in consumption
growth. In consequence, there is a risk that demand
pressure might occur. These Council members also
Inflation Report – March 2016
46
pointed to the risk that a positive output gap (which
is a difference between the observed GDP and its
estimate assuming no inflation pressure in the
economy) and a further improvement in labour
market conditions could result in an acceleration of
growth in unit labour costs. Other Council members
argued that following the introduction of family
benefits, wage pressure could grow, since – given the
improving labour market conditions and the
persistent mismatches in this market – the bargaining
position of lower-paid employees would increase.
Certain Council members underlined that the recent
depreciation of the zloty should contribute to higher
import prices, which could translate into higher
consumer price growth.
Referring to the interest rates, the Council decided
that they should remain unchanged at the current
meeting. The Council members indicated that lower
than previously expected price growth in the coming
months would be driven mainly by factors beyond
the influence of domestic monetary policy. However,
in the medium term, CPI growth would be supported
by steady increase in domestic economic activity. The
Council members confirmed their assessment that –
given the available data and forecasts – the current
level of interest rates helped to keep the Polish
economy on a sustainable growth path and to
maintain macroeconomic stability.
The majority of the Council members stressed that
continued uncertainty regarding the external and
domestic determinants of monetary policy was
another argument in favour of stabilization of
interest rates at the current meeting. The Council
members expressed an opinion that in these
conditions, decisions on the interest rates should take
into account their potential impact on the financial
markets. Moreover, some Council members assessed
that when deciding about the level of the interest
rates, they should factor in their impact on the
financial sector stability. At the same time, in the
opinion of certain Council members, there might be a
room for further monetary policy easing after risk
aversion in the international financial markets abates.
In turn, certain Council members judged that in the
coming months it might be justified to consider
beginning of interest rate increases, since, in their
view, inflation pressure could appear due to
favourable labour market conditions and the risk of a
significant acceleration in consumer demand growth.
The Council members also underlined that a more
comprehensive assessment of the outlook for price
developments and economic growth in the coming
quarters would be possible after the Council gets
acquainted with the March projection of inflation and
GDP. Certain Council members indicated that the
assessment of the impact of changes in fiscal policy
on demand and prices in the economy should also be
an important factor affecting monetary policy
decisions.
The Council decided to keep the NBP interest rates
unchanged: the reference rate at 1.50%, the lombard
rate at 2.50%, the deposit rate at 0.50%, the rediscount
rate at 1.75%.
Information from the meeting of the Monetary
Policy Council held on 10-11 March 2016
The Council decided to keep the NBP interest rates
unchanged: reference rate at 1.50%; lombard rate at
2.50%; deposit rate at 0.50%; rediscount rate at 1.75%.
Global economic growth remains moderate and the
uncertainty about its outlook has recently increased.
Economic recovery is under way in the euro area, yet
driven mainly by consumer demand amid weak
investment and export growth. In the United States,
GDP growth slowed down in the second half of 2015,
following several years of recovery, and there is a
risk of further economic weakening. In turn,
economic growth continues to decelerate in China,
while Russia and Brazil remain in recession.
Concerns that activity in the emerging market
economies might weaken further and the threat that
this might translate into lower activity in the

3. Monetary policy in November 2015 – March 2016
47
advanced economies currently pose the greatest risk
for global economic conditions.
Uncertainty about the global economy has affected
financial market sentiment abroad, leading to a
decline in the prices of many financial assets in recent
months. Prices of oil and other commodities,
including agricultural commodities, also remain low.
In consequence, consumer price growth in many
economies, including in the euro area, is close to
zero, and inflation forecasts for the coming years are
being revised down.
The European Central Bank lowered interest rates in
March and increased the scale of quantitative easing.
In the United States, despite an increase in interest
rate in December and indications of a further increase
in the coming quarters, uncertainty about the future
direction of monetary policy has risen.
In Poland, stable economic growth continues and
data for 2015 Q4 has even confirmed a slight
acceleration in GDP growth. Domestic demand
continues to be the key driver of GDP growth,
supported by stable consumption growth and rising
investment. The rise in demand is supported by
favourable labour market conditions, positive
consumer sentiment, sound financial standing of
enterprises and their high capacity utilization, as well
as lending growth.
As the output gap remains negative and nominal
wage growth is only moderate, there is no
inflationary pressure in the economy. Annual
consumer price growth and producer price growth
remain negative. Yet, the persistence of deflation
results mainly from the strong fall in global energy
commodity prices in recent quarters. Inflation
expectations are still very low. The persisting
deflation has not yet adversely affected decisions of
economic agents.
The Council became acquainted with the projection
of inflation and GDP prepared by the Economic
Institute, which is one of the inputs to the Council’s
decisions on NBP interest rates. In line with the
March projection based on the NECMOD model –
prepared under the assumption of unchanged NBP
interest rates and taking into account data available
until 23 February 2016 (projection cut-off date) –
there is a 50-percent probability that the annual price
growth will be in the range of -0.9 – 0.2% in 2016
(against 0.4 – 1.8% in the November 2015 projection),
0.2 – 2.3% in 2017 (compared to 0.4 – 2.5%) and 0.4 –
2.8% in 2018. At the same time, the annual GDP
growth – in line with this projection – will be with a
50-percent probability in the range of 3.0 – 4.5% in
2016 (against 2.3 – 4.3% in the November 2015
projection), 2.6 – 4.8% in 2017 (compared to 2.4 –
4.6%) and 2.1 – 4.4% in 2018.
In the Council’s assessment, price growth will remain
negative in the coming quarters due to the earlier
strong fall in global commodity prices. At the same
time, a gradual increase in core inflation is expected.
It will be supported by stable economic growth,
including an anticipated rise in consumer demand
growth driven by rising employment, forecasted
acceleration of wage growth and an increase in social
benefits. This notwithstanding, the downside risks to
the global economic conditions are a source of
uncertainty for the domestic economy.
The Council continues to assess that – given the
available data and forecasts – the current level of
interest rates is conducive to keeping the Polish
economy on the sustainable growth path and
maintaining macroeconomic balance.
The Council adopted Inflation Report – March 2016.

Inflation Report – March 2016
48

4. Projection of inflation and GDP
49
Projection of inflation and GDP
This inflation and GDP projection was prepared by the Economic Institute of Narodowy Bank
Polski and presents a forecast of economic developments under the assumption of the constant
NBP interest rates. In terms of the contents, work involved in the creation of this projection was
supervised by Andrzej Sławiński, Director General of the Economic Institute. The process was
coordinated by the Bureau of Macroeconomic Forecasts of the Economic Institute. Using the
macroeconomic model NECMOD43, the projection was prepared as the outcome of an iterative
process, in the course of which the paths of some variables were adjusted if they diverged from
NBP experts’ economic intuition based on their knowledge of economic processes. The
Management Board of NBP approved the projection to be submitted to the Monetary Policy
Council. The projection constitutes one of the inputs to the Monetary Policy Council's decision-
making process concerning the NBP interest rates.
The March projection based on the NECMOD model covers the period from 2016 Q1 to 2018 Q4.
The starting point for the projection is 2015 Q4.
The projection was prepared under the assumption of the constant NBP interest rates taking into
account the data available until 23 February 2016.
43 Current version of the documentation of the model is available at the NBP website
http://www.nbp.pl/homen.aspx?f=/en/publikacje/raport_inflacja/necmod.html
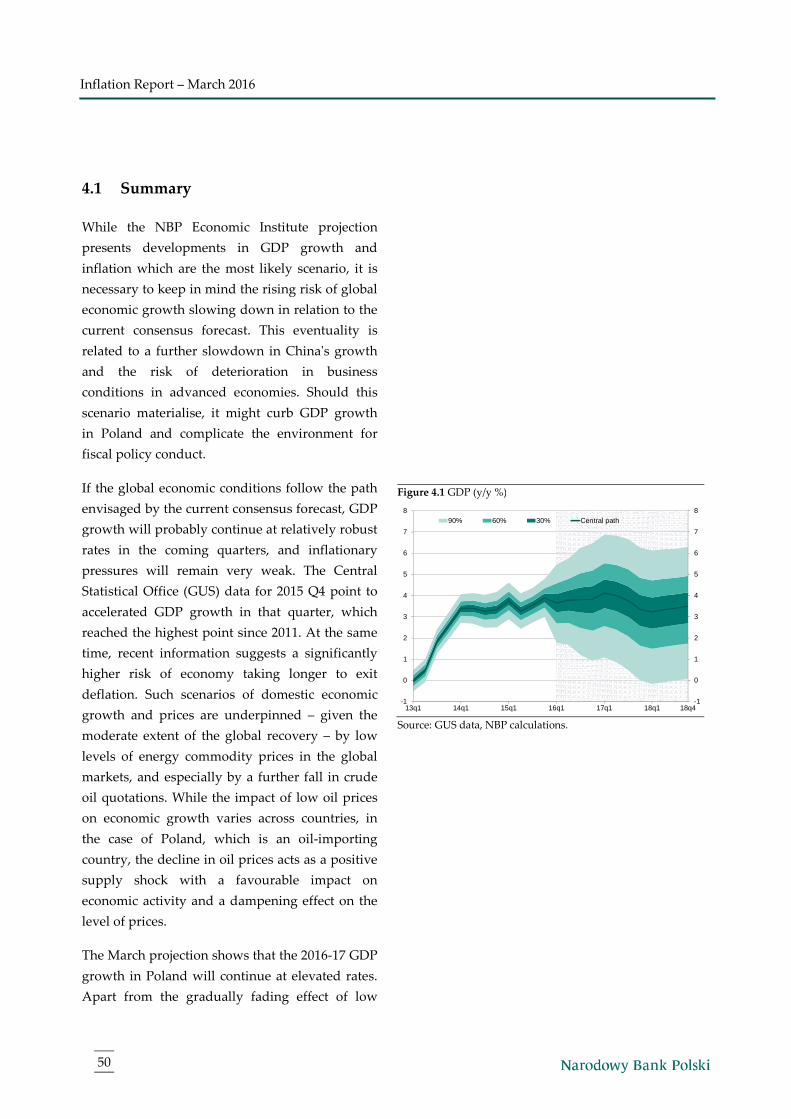
Inflation Report – March 2016
50
4.1 Summary
While the NBP Economic Institute projection
presents developments in GDP growth and
inflation which are the most likely scenario, it is
necessary to keep in mind the rising risk of global
economic growth slowing down in relation to the
current consensus forecast. This eventuality is
related to a further slowdown in China's growth
and the risk of deterioration in business
conditions in advanced economies. Should this
scenario materialise, it might curb GDP growth
in Poland and complicate the environment for
fiscal policy conduct.
If the global economic conditions follow the path
envisaged by the current consensus forecast, GDP
growth will probably continue at relatively robust
rates in the coming quarters, and inflationary
pressures will remain very weak. The Central
Statistical Office (GUS) data for 2015 Q4 point to
accelerated GDP growth in that quarter, which
reached the highest point since 2011. At the same
time, recent information suggests a significantly
higher risk of economy taking longer to exit
deflation. Such scenarios of domestic economic
growth and prices are underpinned – given the
moderate extent of the global recovery – by low
levels of energy commodity prices in the global
markets, and especially by a further fall in crude
oil quotations. While the impact of low oil prices
on economic growth varies across countries, in
the case of Poland, which is an oil-importing
country, the decline in oil prices acts as a positive
supply shock with a favourable impact on
economic activity and a dampening effect on the
level of prices.
The March projection shows that the 2016-17 GDP
growth in Poland will continue at elevated rates.
Apart from the gradually fading effect of low
Figure 4.1 GDP (y/y %)
Source: GUS data, NBP calculations.
-1
0
1
2
3
4
5
6
7
8
-1
0
1
2
3
4
5
6
7
8
13q1 14q1 15q1 16q1 17q1 18q1 18q4
90% 60% 30% Central path

4. Projection of inflation and GDP
51
commodity prices, this will be driven by higher
household consumption growth, related to the
implementation of the "Family 500+" programme.
Domestic economic growth will benefit from
rising disposable income, related to increasing
wages and low interest rates. On the other hand,
domestic demand may be curbed by a likely rise
in the cost of credit servicing due to the
imposition of tax on some financial institutions,
which will mitigate the impact of the above-listed
factors. The impact of changes in the global
economic environment on the future position of
the Polish economy is ambiguous. On the one
hand, a moderately-paced recovery is expected to
continue in the euro area, on the other – there are
mounting concerns about the sustainability of
growth in emerging market economies.
Given the above, GDP growth in 2016-2018 will
continue to be driven mainly by consumption,
while gross fixed capital formation will expand
more slowly as compared to the levels recorded
in recent quarters.
Households’ expenditure will be supported by a
steady improvement in their financial situation,
owing to the introduction of a new provision for
childhood care and the continuation of the
current positive trends in the labour market
(further decline in the unemployment rate,
accelerated wage growth). Consumer sentiment
will also be boosted by low inflation enhancing
households' purchasing power. As a result of the
above factors, private consumption growth will
exceed its long-term average in the projection
horizon, reaching the highest levels in 2016-2017.
The relatively strong domestic demand growth in
the projection horizon will also derive from
higher investment spending in the enterprise
sector, although the pace of growth in this
category will slow down as compared to the rates
seen in recent quarters. On the one hand,
Figure 4.2 CPI inflation (y/y, %)
Source: GUS data, NBP calculations.
-3
-2
-1
0
1
2
3
4
5
6
-3
-2
-1
0
1
2
3
4
5
6
13q1 14q1 15q1 16q1 17q1 18q1 18q4
90% 60% 30% Central path Inflation target
Inflation Report – March 2016
52
investment will be fuelled by the currently high
degree of capacity utilisation and expanding
consumer demand related to increased family
benefits. On the other hand, mounting
uncertainty in the global financial markets,
coupled with concerns about future levels of tax
burden may cause enterprises to make more
prudent decisions on new long-term investment
projects. Corporate investment may also be hurt
by the tax imposed on some financial institutions,
effective from February 2016, which could boost
the cost of banking services and cause a
tightening of lending criteria.
The path of economic growth assumed in the
projection will help to close the currently negative
output gap at the beginning of 2017, and then to
stabilise it at a positive – if close to zero – level.
Such behaviour of the output gap shows that after
several years of no demand pressure, economic
conditions in the projection horizon may now
contribute to higher inflation rate, although this
influence will be relatively small.
The prolonged period of deflation in the Polish
economy is – amidst the gradually closing output
gap – primarily driven by supply-side factors: a
slump in oil prices and high supply of
agricultural products. These conditions are
reflected in the persistently weak cost pressure in
the economy, a decline in import prices and
domestic producer prices (PPI), as well as
moderately rising unit labour costs. Over the
projection horizon, these phenomena will
gradually fade away. Yet, the developments in
the cost-side determinants of inflation show that
consumer price growth will remain markedly
below the NBP inflation target until the end of
2018. In particular, after the period of declines in
agricultural and energy commodities prices in the
global markets ends, early in the projection
horizon, their rise in the following years will be
slow. On the other hand, the persistently
4. Projection of inflation and GDP
53
moderate growth in the global economy
combined with the near-zero output gap will
constrain the extent of growth of import prices
and unit labour costs.
The uncertainty surrounding the current
projection is mainly determined by different, than
in the central scenario, macroeconomic
developments in the external environment of the
Polish economy. The possibility of a more
pronounced slowdown in the emerging market
economies, including, in particular, China, is the
key risk factor. Furthermore, concerns are arising
about the outlook for economic activity in the
United States and other developed economies.
The materialisation of these risk factors would
significantly affect domestic economic conditions,
especially if it dampened growth in the euro area
economy, not only via the trade channel, but also
through weaker consumer and business
sentiment.
On the other hand, it cannot be excluded that the
impact of asset purchases conducted by ECB and
of the implementation of the European
Commission’s Investment Plan on the euro area
economy will be stronger than currently expected.
In this scenario, investment demand might
support euro area economic growth in a greater
measure than currently, which would speed up
the entry of this economy into the recovery phase.
Another source of uncertainty for the projection is
the future shape of fiscal policy. Should the
government launch measures to curb budget
deficit growth in 2017-2018, resulting, among
others, from the implementation of the "Family
500+" programme, one can expect both an
increase in taxation and cutbacks to spending.
These changes would work towards higher
consumer price growth and lower GDP growth
than assumed in the baseline scenario.
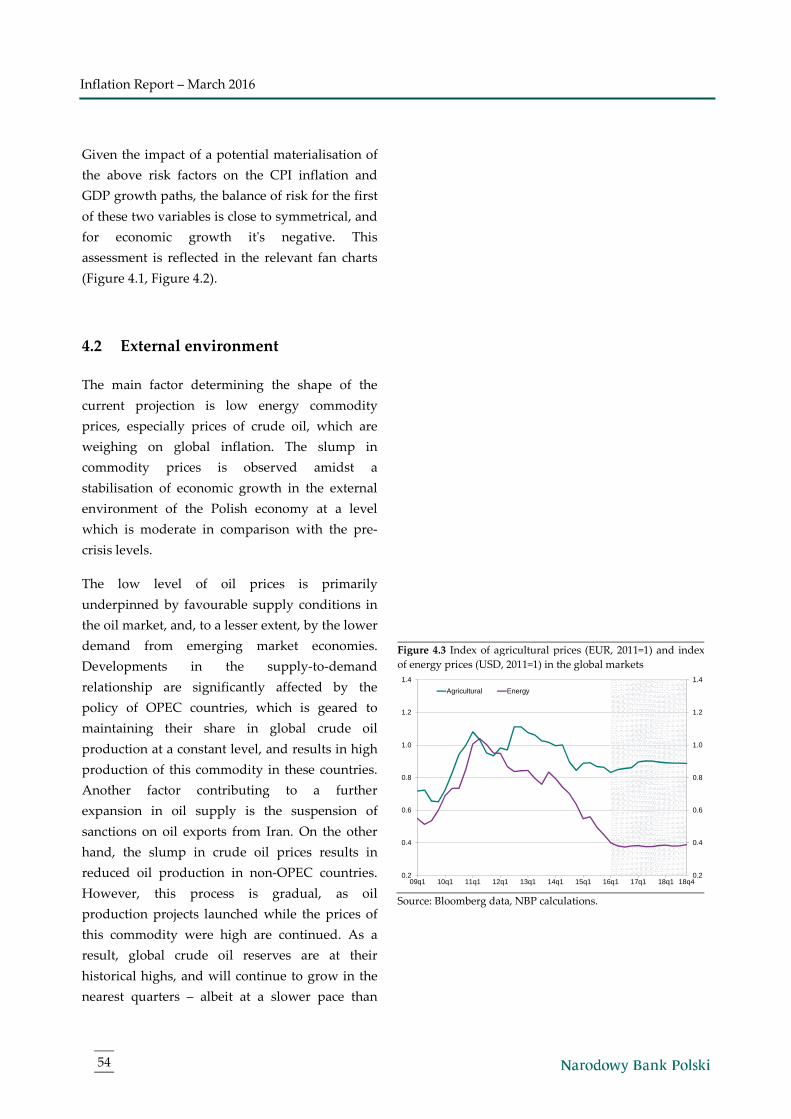
Inflation Report – March 2016
54
Given the impact of a potential materialisation of
the above risk factors on the CPI inflation and
GDP growth paths, the balance of risk for the first
of these two variables is close to symmetrical, and
for economic growth it's negative. This
assessment is reflected in the relevant fan charts
(Figure 4.1, Figure 4.2).
4.2 External environment
The main factor determining the shape of the
current projection is low energy commodity
prices, especially prices of crude oil, which are
weighing on global inflation. The slump in
commodity prices is observed amidst a
stabilisation of economic growth in the external
environment of the Polish economy at a level
which is moderate in comparison with the pre-
crisis levels.
The low level of oil prices is primarily
underpinned by favourable supply conditions in
the oil market, and, to a lesser extent, by the lower
demand from emerging market economies.
Developments in the supply-to-demand
relationship are significantly affected by the
policy of OPEC countries, which is geared to
maintaining their share in global crude oil
production at a constant level, and results in high
production of this commodity in these countries.
Another factor contributing to a further
expansion in oil supply is the suspension of
sanctions on oil exports from Iran. On the other
hand, the slump in crude oil prices results in
reduced oil production in non-OPEC countries.
However, this process is gradual, as oil
production projects launched while the prices of
this commodity were high are continued. As a
result, global crude oil reserves are at their
historical highs, and will continue to grow in the
nearest quarters – albeit at a slower pace than
Figure 4.3 Index of agricultural prices (EUR, 2011=1) and index
of energy prices (USD, 2011=1) in the global markets
Source: Bloomberg data, NBP calculations.
0.2
0.4
0.6
0.8
1.0
1.2
1.4
0.2
0.4
0.6
0.8
1.0
1.2
1.4
09q1 10q1 11q1 12q1 13q1 14q1 15q1 16q1 17q1 18q1 18q4
Agricultural Energy
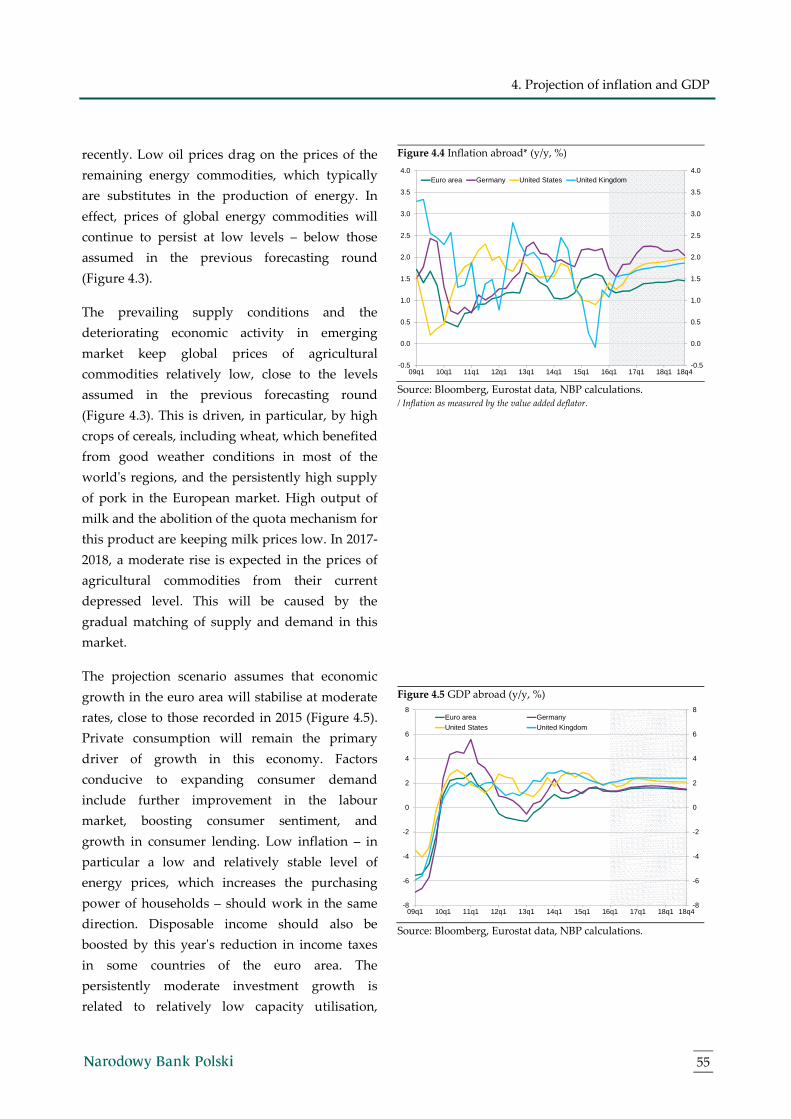
4. Projection of inflation and GDP
55
recently. Low oil prices drag on the prices of the
remaining energy commodities, which typically
are substitutes in the production of energy. In
effect, prices of global energy commodities will
continue to persist at low levels – below those
assumed in the previous forecasting round
(Figure 4.3).
The prevailing supply conditions and the
deteriorating economic activity in emerging
market keep global prices of agricultural
commodities relatively low, close to the levels
assumed in the previous forecasting round
(Figure 4.3). This is driven, in particular, by high
crops of cereals, including wheat, which benefited
from good weather conditions in most of the
world's regions, and the persistently high supply
of pork in the European market. High output of
milk and the abolition of the quota mechanism for
this product are keeping milk prices low. In 2017-
2018, a moderate rise is expected in the prices of
agricultural commodities from their current
depressed level. This will be caused by the
gradual matching of supply and demand in this
market.
The projection scenario assumes that economic
growth in the euro area will stabilise at moderate
rates, close to those recorded in 2015 (Figure 4.5).
Private consumption will remain the primary
driver of growth in this economy. Factors
conducive to expanding consumer demand
include further improvement in the labour
market, boosting consumer sentiment, and
growth in consumer lending. Low inflation – in
particular a low and relatively stable level of
energy prices, which increases the purchasing
power of households – should work in the same
direction. Disposable income should also be
boosted by this year's reduction in income taxes
in some countries of the euro area. The
persistently moderate investment growth is
related to relatively low capacity utilisation,
Figure 4.4 Inflation abroad* (y/y, %)
Source: Bloomberg, Eurostat data, NBP calculations. / Inflation as measured by the value added deflator.
Figure 4.5 GDP abroad (y/y, %)
Source: Bloomberg, Eurostat data, NBP calculations.
-0.5
0.0
0.5
1.0
1.5
2.0
2.5
3.0
3.5
4.0
-0.5
0.0
0.5
1.0
1.5
2.0
2.5
3.0
3.5
4.0
09q1 10q1 11q1 12q1 13q1 14q1 15q1 16q1 17q1 18q1 18q4
Euro area Germany United States United Kingdom
-8
-6
-4
-2
0
2
4
6
8
-8
-6
-4
-2
0
2
4
6
8
09q1 10q1 11q1 12q1 13q1 14q1 15q1 16q1 17q1 18q1 18q4
Euro area GermanyUnited States United Kingdom
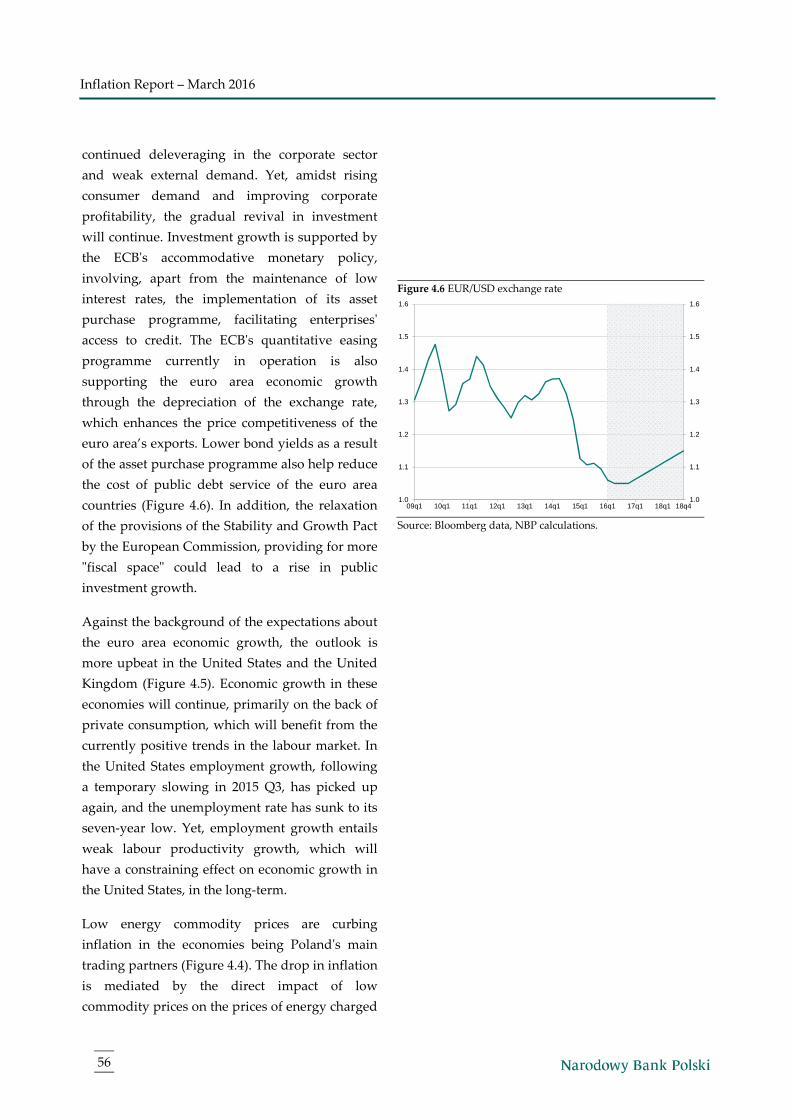
Inflation Report – March 2016
56
continued deleveraging in the corporate sector
and weak external demand. Yet, amidst rising
consumer demand and improving corporate
profitability, the gradual revival in investment
will continue. Investment growth is supported by
the ECB's accommodative monetary policy,
involving, apart from the maintenance of low
interest rates, the implementation of its asset
purchase programme, facilitating enterprises'
access to credit. The ECB's quantitative easing
programme currently in operation is also
supporting the euro area economic growth
through the depreciation of the exchange rate,
which enhances the price competitiveness of the
euro area’s exports. Lower bond yields as a result
of the asset purchase programme also help reduce
the cost of public debt service of the euro area
countries (Figure 4.6). In addition, the relaxation
of the provisions of the Stability and Growth Pact
by the European Commission, providing for more
"fiscal space" could lead to a rise in public
investment growth.
Against the background of the expectations about
the euro area economic growth, the outlook is
more upbeat in the United States and the United
Kingdom (Figure 4.5). Economic growth in these
economies will continue, primarily on the back of
private consumption, which will benefit from the
currently positive trends in the labour market. In
the United States employment growth, following
a temporary slowing in 2015 Q3, has picked up
again, and the unemployment rate has sunk to its
seven-year low. Yet, employment growth entails
weak labour productivity growth, which will
have a constraining effect on economic growth in
the United States, in the long-term.
Low energy commodity prices are curbing
inflation in the economies being Poland's main
trading partners (Figure 4.4). The drop in inflation
is mediated by the direct impact of low
commodity prices on the prices of energy charged
Figure 4.6 EUR/USD exchange rate
Source: Bloomberg data, NBP calculations.
1.0
1.1
1.2
1.3
1.4
1.5
1.6
1.0
1.1
1.2
1.3
1.4
1.5
1.6
09q1 10q1 11q1 12q1 13q1 14q1 15q1 16q1 17q1 18q1 18q4
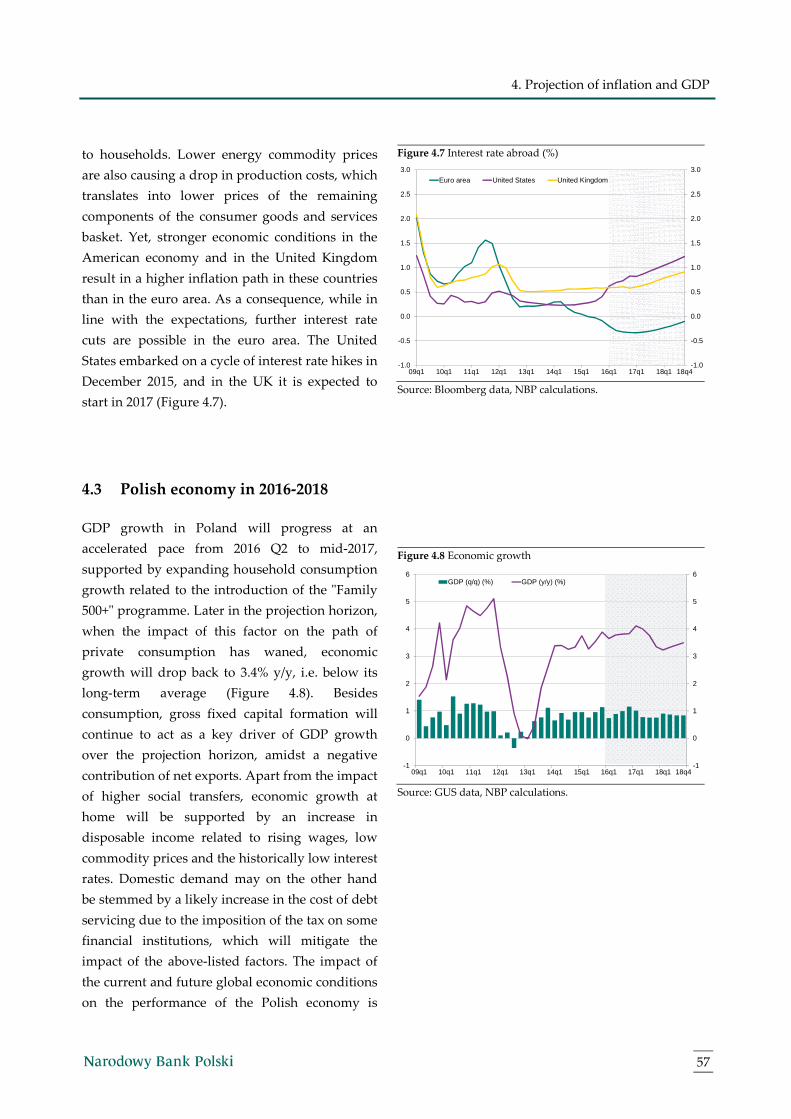
4. Projection of inflation and GDP
57
to households. Lower energy commodity prices
are also causing a drop in production costs, which
translates into lower prices of the remaining
components of the consumer goods and services
basket. Yet, stronger economic conditions in the
American economy and in the United Kingdom
result in a higher inflation path in these countries
than in the euro area. As a consequence, while in
line with the expectations, further interest rate
cuts are possible in the euro area. The United
States embarked on a cycle of interest rate hikes in
December 2015, and in the UK it is expected to
start in 2017 (Figure 4.7).
Figure 4.7 Interest rate abroad (%)
Source: Bloomberg data, NBP calculations.
4.3 Polish economy in 2016-2018
GDP growth in Poland will progress at an
accelerated pace from 2016 Q2 to mid-2017,
supported by expanding household consumption
growth related to the introduction of the "Family
500+" programme. Later in the projection horizon,
when the impact of this factor on the path of
private consumption has waned, economic
growth will drop back to 3.4% y/y, i.e. below its
long-term average (Figure 4.8). Besides
consumption, gross fixed capital formation will
continue to act as a key driver of GDP growth
over the projection horizon, amidst a negative
contribution of net exports. Apart from the impact
of higher social transfers, economic growth at
home will be supported by an increase in
disposable income related to rising wages, low
commodity prices and the historically low interest
rates. Domestic demand may on the other hand
be stemmed by a likely increase in the cost of debt
servicing due to the imposition of the tax on some
financial institutions, which will mitigate the
impact of the above-listed factors. The impact of
the current and future global economic conditions
on the performance of the Polish economy is
Figure 4.8 Economic growth
Source: GUS data, NBP calculations.
-1.0
-0.5
0.0
0.5
1.0
1.5
2.0
2.5
3.0
-1.0
-0.5
0.0
0.5
1.0
1.5
2.0
2.5
3.0
09q1 10q1 11q1 12q1 13q1 14q1 15q1 16q1 17q1 18q1 18q4
Euro area United States United Kingdom
-1
0
1
2
3
4
5
6
-1
0
1
2
3
4
5
6
09q1 10q1 11q1 12q1 13q1 14q1 15q1 16q1 17q1 18q1 18q4
GDP (q/q) (%) GDP (y/y) (%)
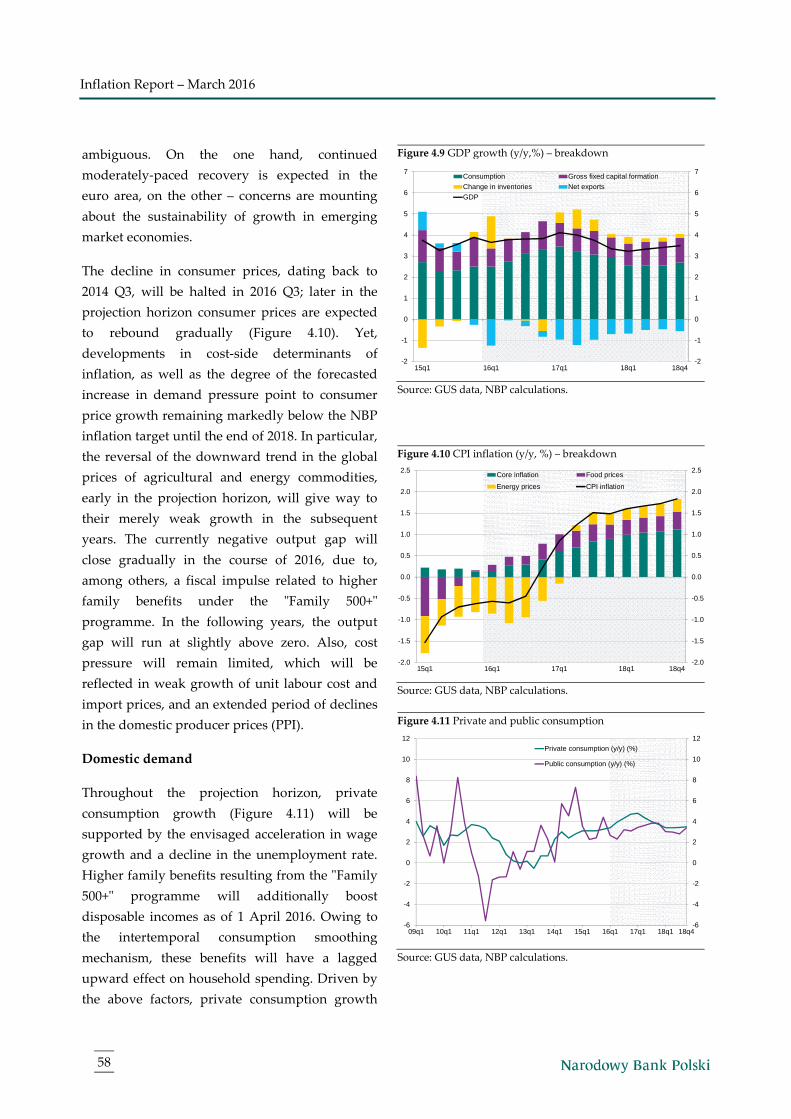
Inflation Report – March 2016
58
ambiguous. On the one hand, continued
moderately-paced recovery is expected in the
euro area, on the other – concerns are mounting
about the sustainability of growth in emerging
market economies.
The decline in consumer prices, dating back to
2014 Q3, will be halted in 2016 Q3; later in the
projection horizon consumer prices are expected
to rebound gradually (Figure 4.10). Yet,
developments in cost-side determinants of
inflation, as well as the degree of the forecasted
increase in demand pressure point to consumer
price growth remaining markedly below the NBP
inflation target until the end of 2018. In particular,
the reversal of the downward trend in the global
prices of agricultural and energy commodities,
early in the projection horizon, will give way to
their merely weak growth in the subsequent
years. The currently negative output gap will
close gradually in the course of 2016, due to,
among others, a fiscal impulse related to higher
family benefits under the "Family 500+"
programme. In the following years, the output
gap will run at slightly above zero. Also, cost
pressure will remain limited, which will be
reflected in weak growth of unit labour cost and
import prices, and an extended period of declines
in the domestic producer prices (PPI).
Domestic demand
Throughout the projection horizon, private
consumption growth (Figure 4.11) will be
supported by the envisaged acceleration in wage
growth and a decline in the unemployment rate.
Higher family benefits resulting from the "Family
500+" programme will additionally boost
disposable incomes as of 1 April 2016. Owing to
the intertemporal consumption smoothing
mechanism, these benefits will have a lagged
upward effect on household spending. Driven by
the above factors, private consumption growth
Figure 4.9 GDP growth (y/y,%) – breakdown
Source: GUS data, NBP calculations.
Figure 4.10 CPI inflation (y/y, %) – breakdown
Source: GUS data, NBP calculations.
Figure 4.11 Private and public consumption
Source: GUS data, NBP calculations.
-2
-1
0
1
2
3
4
5
6
7
-2
-1
0
1
2
3
4
5
6
7
15q1 16q1 17q1 18q1 18q4
Consumption Gross fixed capital formation
Change in inventories Net exports
GDP
-2.0
-1.5
-1.0
-0.5
0.0
0.5
1.0
1.5
2.0
2.5
-2.0
-1.5
-1.0
-0.5
0.0
0.5
1.0
1.5
2.0
2.5
15q1 16q1 17q1 18q1 18q4
Core inflation Food prices
Energy prices CPI inflation
-6
-4
-2
0
2
4
6
8
10
12
-6
-4
-2
0
2
4
6
8
10
12
09q1 10q1 11q1 12q1 13q1 14q1 15q1 16q1 17q1 18q1 18q4
Private consumption (y/y) (%)
Public consumption (y/y) (%)
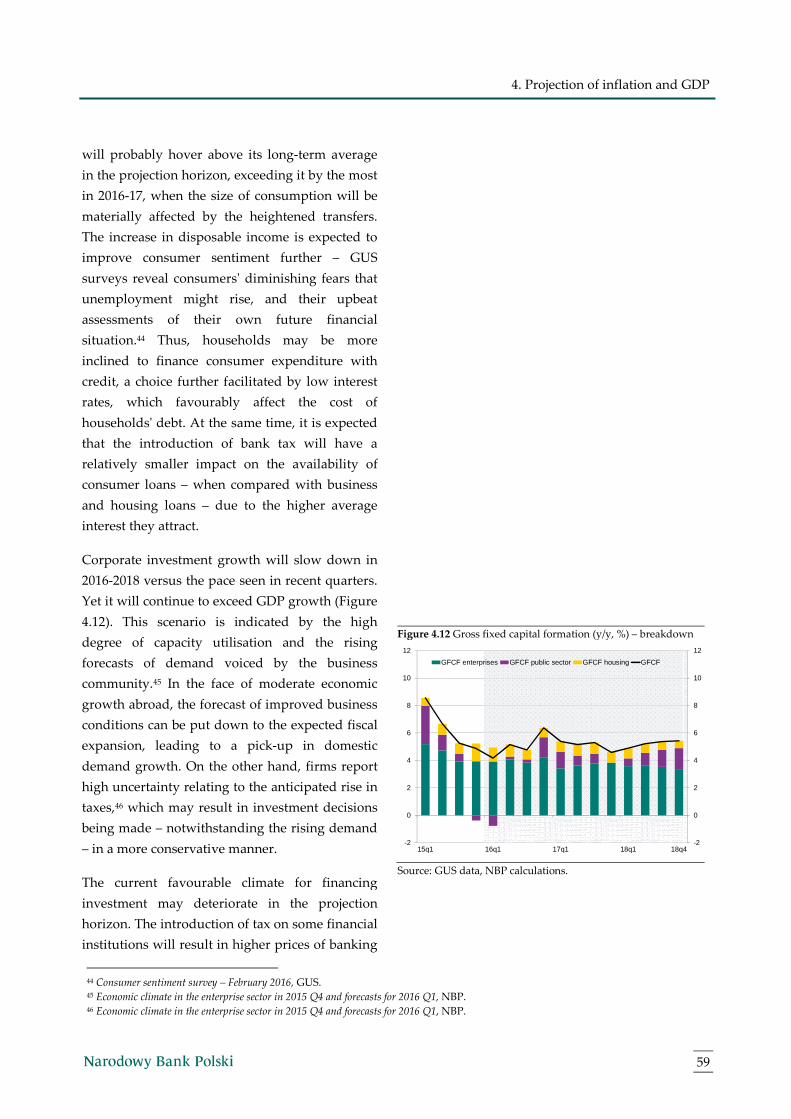
4. Projection of inflation and GDP
59
will probably hover above its long-term average
in the projection horizon, exceeding it by the most
in 2016-17, when the size of consumption will be
materially affected by the heightened transfers.
The increase in disposable income is expected to
improve consumer sentiment further – GUS
surveys reveal consumers' diminishing fears that
unemployment might rise, and their upbeat
assessments of their own future financial
situation.44 Thus, households may be more
inclined to finance consumer expenditure with
credit, a choice further facilitated by low interest
rates, which favourably affect the cost of
households' debt. At the same time, it is expected
that the introduction of bank tax will have a
relatively smaller impact on the availability of
consumer loans – when compared with business
and housing loans – due to the higher average
interest they attract.
Corporate investment growth will slow down in
2016-2018 versus the pace seen in recent quarters.
Yet it will continue to exceed GDP growth (Figure
4.12). This scenario is indicated by the high
degree of capacity utilisation and the rising
forecasts of demand voiced by the business
community.45 In the face of moderate economic
growth abroad, the forecast of improved business
conditions can be put down to the expected fiscal
expansion, leading to a pick-up in domestic
demand growth. On the other hand, firms report
high uncertainty relating to the anticipated rise in
taxes,46 which may result in investment decisions
being made – notwithstanding the rising demand
– in a more conservative manner.
The current favourable climate for financing
investment may deteriorate in the projection
horizon. The introduction of tax on some financial
institutions will result in higher prices of banking
Figure 4.12 Gross fixed capital formation (y/y, %) – breakdown
Source: GUS data, NBP calculations.
44 Consumer sentiment survey – February 2016, GUS. 45 Economic climate in the enterprise sector in 2015 Q4 and forecasts for 2016 Q1, NBP. 46 Economic climate in the enterprise sector in 2015 Q4 and forecasts for 2016 Q1, NBP.
-2
0
2
4
6
8
10
12
-2
0
2
4
6
8
10
12
15q1 16q1 17q1 18q1 18q4
GFCF enterprises GFCF public sector GFCF housing GFCF

Inflation Report – March 2016
60
services and stricter lending terms. Thus, the tax
may hamper lending through an adverse effect on
corporate investment. At the same time, nearly
half of all investors are self-financing new
projects,47 which is facilitated by enterprises'
sound financial performance.48 In the projection
horizon, enterprises are expected to further enjoy
a favourable financial environment, supported by
low energy commodity prices, which reduce
their operating costs and allow them to maintain
a relatively high profitability of operations
despite the persistent deflation.
In the projection horizon, housing investment will
be supported by good labour market conditions.
They have a favourable effect on consumer
sentiment by increasing the propensity to incur
long-term loans. Financing home purchases is
also being facilitated by the government scheme
"Home for the Young." On the other hand, the
introduction of the tax on some financial
institutions will raise the cost of the new
mortgage loans. In addition, as of the beginning
of 2016, the criteria for granting housing loans
have been tightened again as a result of the
amended Recommendation S, introduced in 2014.
The changes will restrict the availability of credit,
thus dampening the positive impact of rising
household income on investment.
Public consumption growth is expected to
weaken in 2016. This follows from the Draft 2016
Budget Act, which provides for a merely slow
growth of current expenditure by the local
government units, as well as absence of pay rises
for teachers and academic teachers. Since no
detailed information has been released to date
about a likely continuation, beyond 2016, of
measures aimed at reducing public sector
expenditure, a slight acceleration in public
47 Economic climate in the enterprise sector in 2015 Q4 and forecasts for 2016 Q1, NBP. 48 Financial situation of the enterprises in 2015 Q3, NBP.
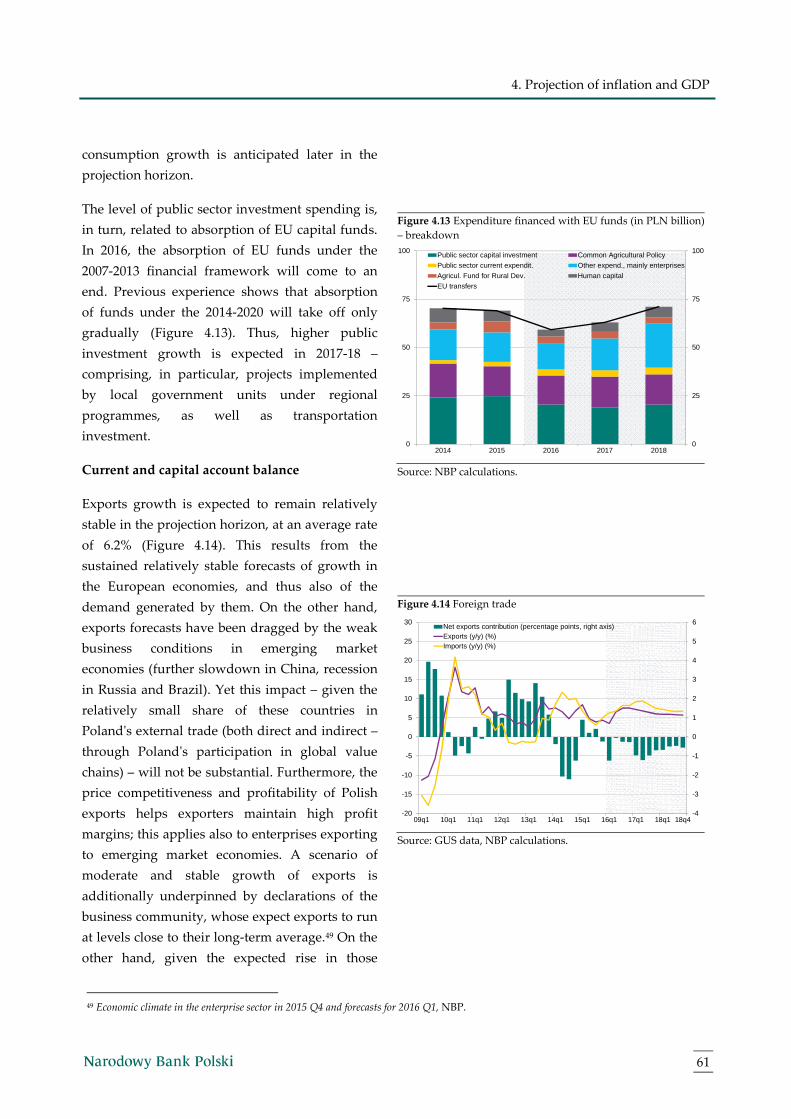
4. Projection of inflation and GDP
61
consumption growth is anticipated later in the
projection horizon.
The level of public sector investment spending is,
in turn, related to absorption of EU capital funds.
In 2016, the absorption of EU funds under the
2007-2013 financial framework will come to an
end. Previous experience shows that absorption
of funds under the 2014-2020 will take off only
gradually (Figure 4.13). Thus, higher public
investment growth is expected in 2017-18 –
comprising, in particular, projects implemented
by local government units under regional
programmes, as well as transportation
investment.
Current and capital account balance
Exports growth is expected to remain relatively
stable in the projection horizon, at an average rate
of 6.2% (Figure 4.14). This results from the
sustained relatively stable forecasts of growth in
the European economies, and thus also of the
demand generated by them. On the other hand,
exports forecasts have been dragged by the weak
business conditions in emerging market
economies (further slowdown in China, recession
in Russia and Brazil). Yet this impact – given the
relatively small share of these countries in
Poland's external trade (both direct and indirect –
through Poland's participation in global value
chains) – will not be substantial. Furthermore, the
price competitiveness and profitability of Polish
exports helps exporters maintain high profit
margins; this applies also to enterprises exporting
to emerging market economies. A scenario of
moderate and stable growth of exports is
additionally underpinned by declarations of the
business community, whose expect exports to run
at levels close to their long-term average.49 On the
other hand, given the expected rise in those
Figure 4.13 Expenditure financed with EU funds (in PLN billion)
– breakdown
Source: NBP calculations.
Figure 4.14 Foreign trade
Source: GUS data, NBP calculations.
49 Economic climate in the enterprise sector in 2015 Q4 and forecasts for 2016 Q1, NBP.
0
25
50
75
100
0
25
50
75
100
2014 2015 2016 2017 2018
Public sector capital investment Common Agricultural Policy
Public sector current expendit. Other expend., mainly enterprises
Agricul. Fund for Rural Dev. Human capital
EU transfers
-4
-3
-2
-1
0
1
2
3
4
5
6
-20
-15
-10
-5
0
5
10
15
20
25
30
09q1 10q1 11q1 12q1 13q1 14q1 15q1 16q1 17q1 18q1 18q4
Net exports contribution (percentage points, right axis)Exports (y/y) (%)Imports (y/y) (%)
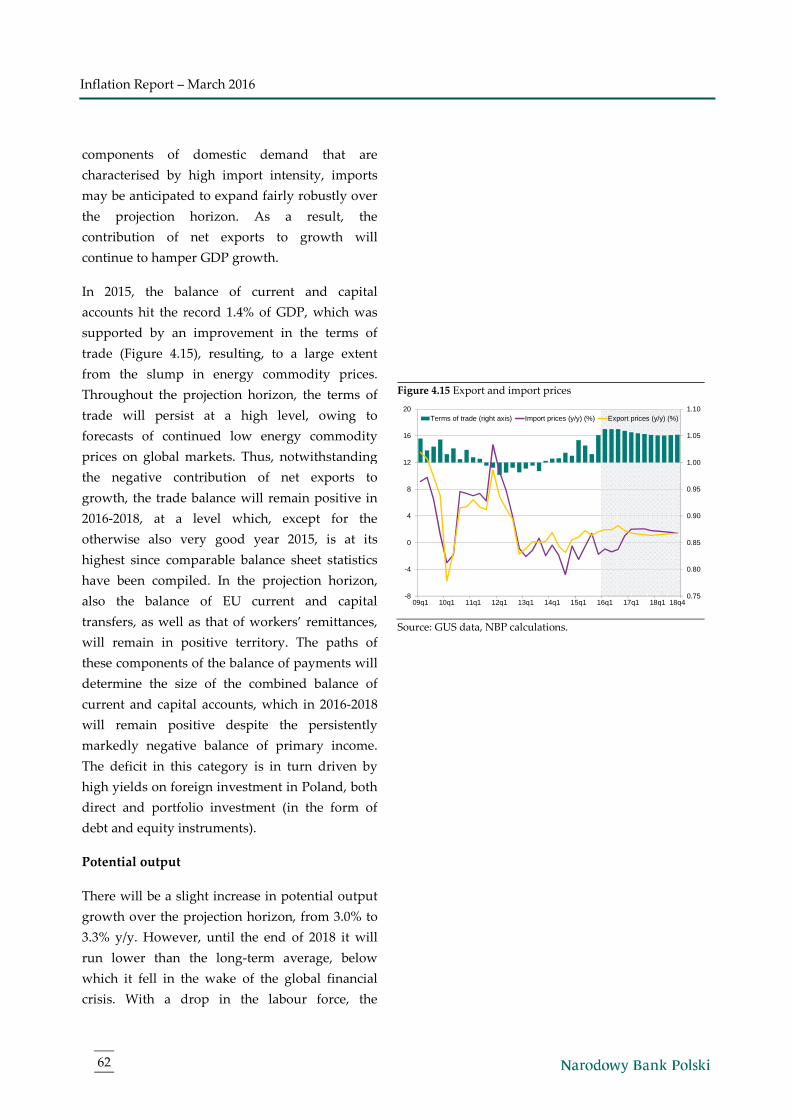
Inflation Report – March 2016
62
components of domestic demand that are
characterised by high import intensity, imports
may be anticipated to expand fairly robustly over
the projection horizon. As a result, the
contribution of net exports to growth will
continue to hamper GDP growth.
In 2015, the balance of current and capital
accounts hit the record 1.4% of GDP, which was
supported by an improvement in the terms of
trade (Figure 4.15), resulting, to a large extent
from the slump in energy commodity prices.
Throughout the projection horizon, the terms of
trade will persist at a high level, owing to
forecasts of continued low energy commodity
prices on global markets. Thus, notwithstanding
the negative contribution of net exports to
growth, the trade balance will remain positive in
2016-2018, at a level which, except for the
otherwise also very good year 2015, is at its
highest since comparable balance sheet statistics
have been compiled. In the projection horizon,
also the balance of EU current and capital
transfers, as well as that of workers’ remittances,
will remain in positive territory. The paths of
these components of the balance of payments will
determine the size of the combined balance of
current and capital accounts, which in 2016-2018
will remain positive despite the persistently
markedly negative balance of primary income.
The deficit in this category is in turn driven by
high yields on foreign investment in Poland, both
direct and portfolio investment (in the form of
debt and equity instruments).
Potential output
There will be a slight increase in potential output
growth over the projection horizon, from 3.0% to
3.3% y/y. However, until the end of 2018 it will
run lower than the long-term average, below
which it fell in the wake of the global financial
crisis. With a drop in the labour force, the
Figure 4.15 Export and import prices
Source: GUS data, NBP calculations.
0.75
0.80
0.85
0.90
0.95
1.00
1.05
1.10
-8
-4
0
4
8
12
16
20
09q1 10q1 11q1 12q1 13q1 14q1 15q1 16q1 17q1 18q1 18q4
Terms of trade (right axis) Import prices (y/y) (%) Export prices (y/y) (%)
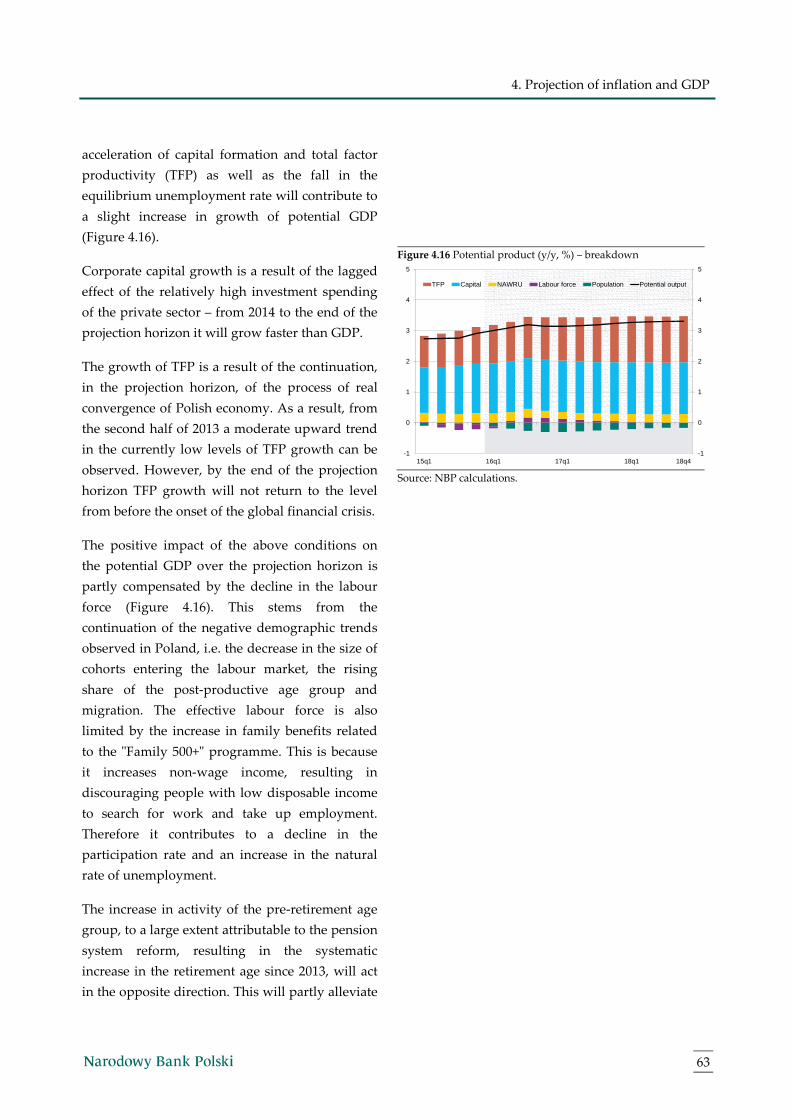
4. Projection of inflation and GDP
63
acceleration of capital formation and total factor
productivity (TFP) as well as the fall in the
equilibrium unemployment rate will contribute to
a slight increase in growth of potential GDP
(Figure 4.16).
Corporate capital growth is a result of the lagged
effect of the relatively high investment spending
of the private sector – from 2014 to the end of the
projection horizon it will grow faster than GDP.
The growth of TFP is a result of the continuation,
in the projection horizon, of the process of real
convergence of Polish economy. As a result, from
the second half of 2013 a moderate upward trend
in the currently low levels of TFP growth can be
observed. However, by the end of the projection
horizon TFP growth will not return to the level
from before the onset of the global financial crisis.
The positive impact of the above conditions on
the potential GDP over the projection horizon is
partly compensated by the decline in the labour
force (Figure 4.16). This stems from the
continuation of the negative demographic trends
observed in Poland, i.e. the decrease in the size of
cohorts entering the labour market, the rising
share of the post-productive age group and
migration. The effective labour force is also
limited by the increase in family benefits related
to the "Family 500+" programme. This is because
it increases non-wage income, resulting in
discouraging people with low disposable income
to search for work and take up employment.
Therefore it contributes to a decline in the
participation rate and an increase in the natural
rate of unemployment.
The increase in activity of the pre-retirement age
group, to a large extent attributable to the pension
system reform, resulting in the systematic
increase in the retirement age since 2013, will act
in the opposite direction. This will partly alleviate
Figure 4.16 Potential product (y/y, %) – breakdown
Source: NBP calculations.
-1
0
1
2
3
4
5
-1
0
1
2
3
4
5
15q1 16q1 17q1 18q1 18q4
TFP Capital NAWRU Labour force Population Potential output
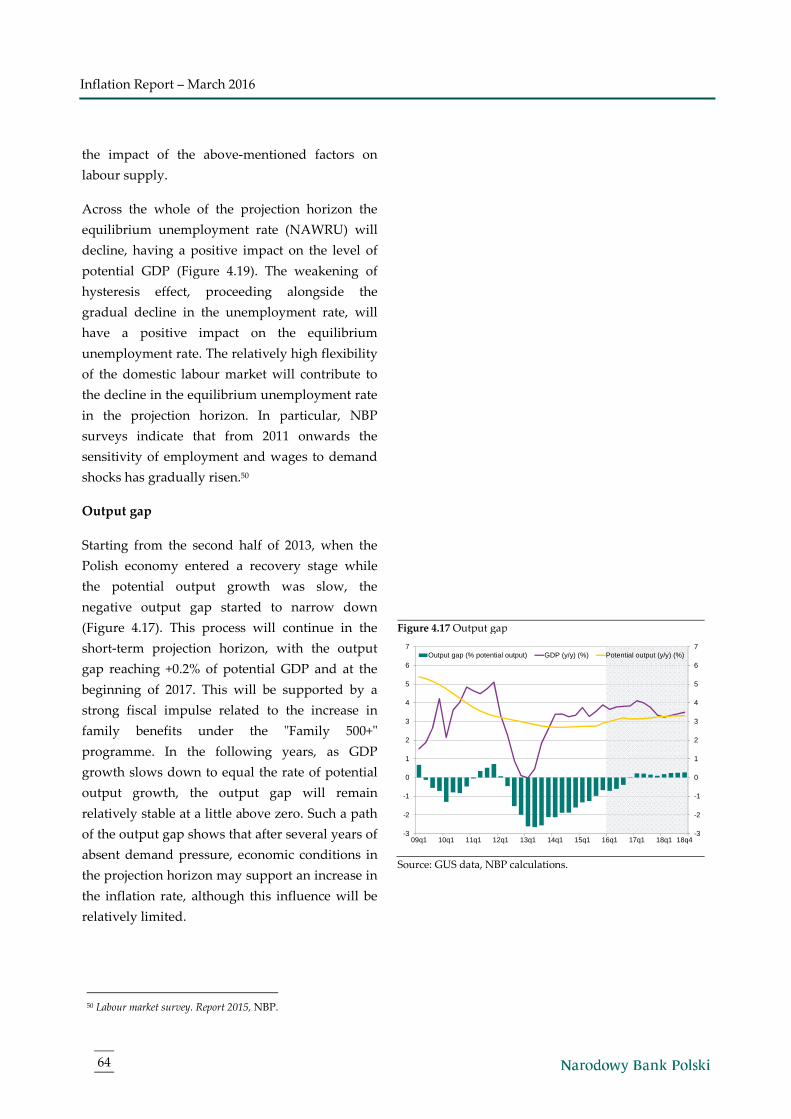
Inflation Report – March 2016
64
the impact of the above-mentioned factors on
labour supply.
Across the whole of the projection horizon the
equilibrium unemployment rate (NAWRU) will
decline, having a positive impact on the level of
potential GDP (Figure 4.19). The weakening of
hysteresis effect, proceeding alongside the
gradual decline in the unemployment rate, will
have a positive impact on the equilibrium
unemployment rate. The relatively high flexibility
of the domestic labour market will contribute to
the decline in the equilibrium unemployment rate
in the projection horizon. In particular, NBP
surveys indicate that from 2011 onwards the
sensitivity of employment and wages to demand
shocks has gradually risen.50
Output gap
Starting from the second half of 2013, when the
Polish economy entered a recovery stage while
the potential output growth was slow, the
negative output gap started to narrow down
(Figure 4.17). This process will continue in the
short-term projection horizon, with the output
gap reaching +0.2% of potential GDP and at the
beginning of 2017. This will be supported by a
strong fiscal impulse related to the increase in
family benefits under the "Family 500+"
programme. In the following years, as GDP
growth slows down to equal the rate of potential
output growth, the output gap will remain
relatively stable at a little above zero. Such a path
of the output gap shows that after several years of
absent demand pressure, economic conditions in
the projection horizon may support an increase in
the inflation rate, although this influence will be
relatively limited.
Figure 4.17 Output gap
Source: GUS data, NBP calculations.
50 Labour market survey. Report 2015, NBP.
-3
-2
-1
0
1
2
3
4
5
6
7
-3
-2
-1
0
1
2
3
4
5
6
7
09q1 10q1 11q1 12q1 13q1 14q1 15q1 16q1 17q1 18q1 18q4
Output gap (% potential output) GDP (y/y) (%) Potential output (y/y) (%)
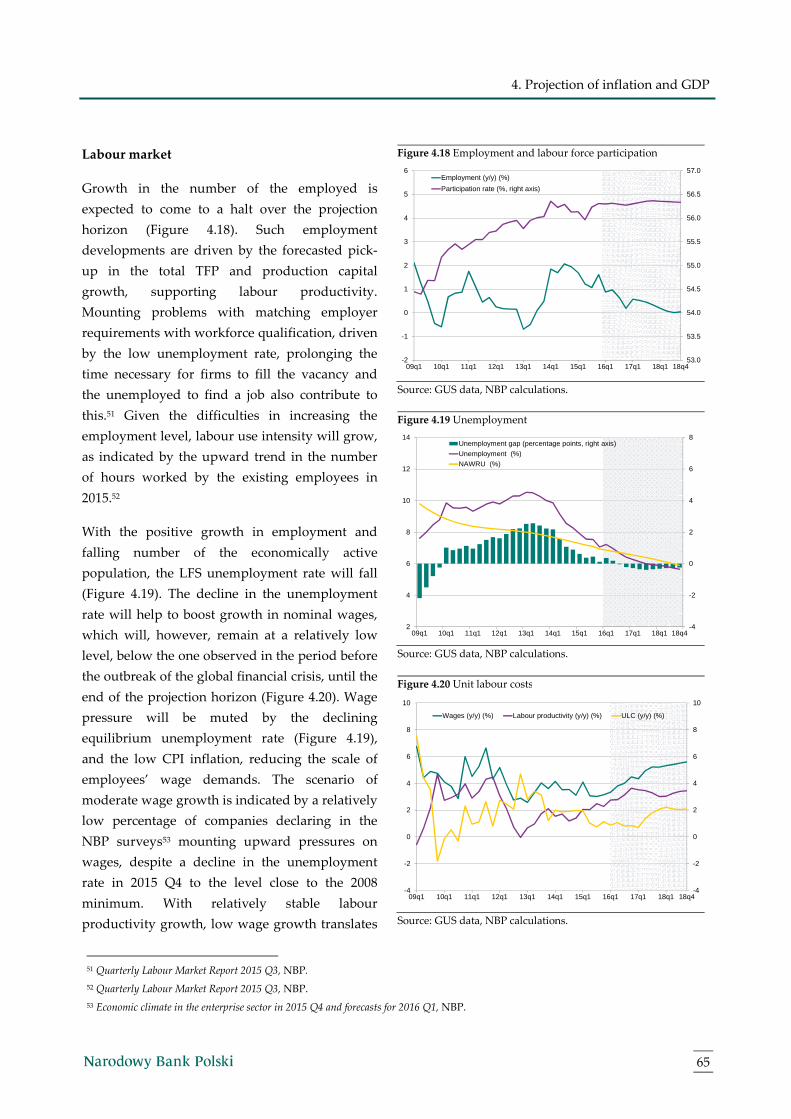
4. Projection of inflation and GDP
65
Labour market
Growth in the number of the employed is
expected to come to a halt over the projection
horizon (Figure 4.18). Such employment
developments are driven by the forecasted pick-
up in the total TFP and production capital
growth, supporting labour productivity.
Mounting problems with matching employer
requirements with workforce qualification, driven
by the low unemployment rate, prolonging the
time necessary for firms to fill the vacancy and
the unemployed to find a job also contribute to
this.51 Given the difficulties in increasing the
employment level, labour use intensity will grow,
as indicated by the upward trend in the number
of hours worked by the existing employees in
2015.52
With the positive growth in employment and
falling number of the economically active
population, the LFS unemployment rate will fall
(Figure 4.19). The decline in the unemployment
rate will help to boost growth in nominal wages,
which will, however, remain at a relatively low
level, below the one observed in the period before
the outbreak of the global financial crisis, until the
end of the projection horizon (Figure 4.20). Wage
pressure will be muted by the declining
equilibrium unemployment rate (Figure 4.19),
and the low CPI inflation, reducing the scale of
employees’ wage demands. The scenario of
moderate wage growth is indicated by a relatively
low percentage of companies declaring in the
NBP surveys53 mounting upward pressures on
wages, despite a decline in the unemployment
rate in 2015 Q4 to the level close to the 2008
minimum. With relatively stable labour
productivity growth, low wage growth translates
Figure 4.18 Employment and labour force participation
Source: GUS data, NBP calculations.
Figure 4.19 Unemployment
Source: GUS data, NBP calculations.
Figure 4.20 Unit labour costs
Source: GUS data, NBP calculations.
51 Quarterly Labour Market Report 2015 Q3, NBP.
52 Quarterly Labour Market Report 2015 Q3, NBP.
53 Economic climate in the enterprise sector in 2015 Q4 and forecasts for 2016 Q1, NBP.
53.0
53.5
54.0
54.5
55.0
55.5
56.0
56.5
57.0
-2
-1
0
1
2
3
4
5
6
09q1 10q1 11q1 12q1 13q1 14q1 15q1 16q1 17q1 18q1 18q4
Employment (y/y) (%)
Participation rate (%, right axis)
-4
-2
0
2
4
6
8
2
4
6
8
10
12
14
09q1 10q1 11q1 12q1 13q1 14q1 15q1 16q1 17q1 18q1 18q4
Unemployment gap (percentage points, right axis)
Unemployment (%)
NAWRU (%)
-4
-2
0
2
4
6
8
10
-4
-2
0
2
4
6
8
10
09q1 10q1 11q1 12q1 13q1 14q1 15q1 16q1 17q1 18q1 18q4
Wages (y/y) (%) Labour productivity (y/y) (%) ULC (y/y) (%)

Inflation Report – March 2016
66
into a limited increase in unit labour costs, which
at the end of the projection horizon will grow by
2.1% y/y.
Exchange rate
In 2015 Q4 the average exchange rate of the zloty
against the currencies of Poland’s major trading
partners was weaker than in the previous quarter.
Depreciation of the zloty was driven by global
factors, including the monetary policy of the ECB
and the Fed and mounting risk aversion in the
emerging markets. After the recently observed
weakening, the zloty exchange rate depreciated
significantly below the level determined by the
fundamental factors. This is indicated, in
particular, by the current and capital account
balance standing at a record high in 2015. It is
expected that in the projection horizon along with
the stabilization of the situation in the
international foreign exchange markets, the zloty
will gradually depreciate, bringing the effective
exchange rate closer to the equilibrium exchange
rate. Further real convergence of the Polish
economy, reflected in higher growth of domestic
potential output than Poland’s main trading
partners’ potential product growth, will work in
the same direction.
Components of CPI inflation
In recent years, the Polish economy has seen a
very low level of cost and demand pressures. This
situation was reflected in the significant negative
output gap, low growth in unit labour costs and
falling import prices. Over the projection horizon,
these developments will gradually fade away
and, consequently, a moderate rise in core
inflation will be observed (Figure 4.21). On the
one hand, the slightly positive output gap
remaining stable over the projection horizon
indicates a gradual increase in demand pressure
as compared with the years 2012-2015, when the
Figure 4.21 CPI and core inflation
Source: GUS data, NBP calculations.
-2
-1
0
1
2
3
4
5
6
-2
-1
0
1
2
3
4
5
6
09q1 10q1 11q1 12q1 13q1 14q1 15q1 16q1 17q1 18q1 18q4
CPI inflation (%) Core inflation (%)
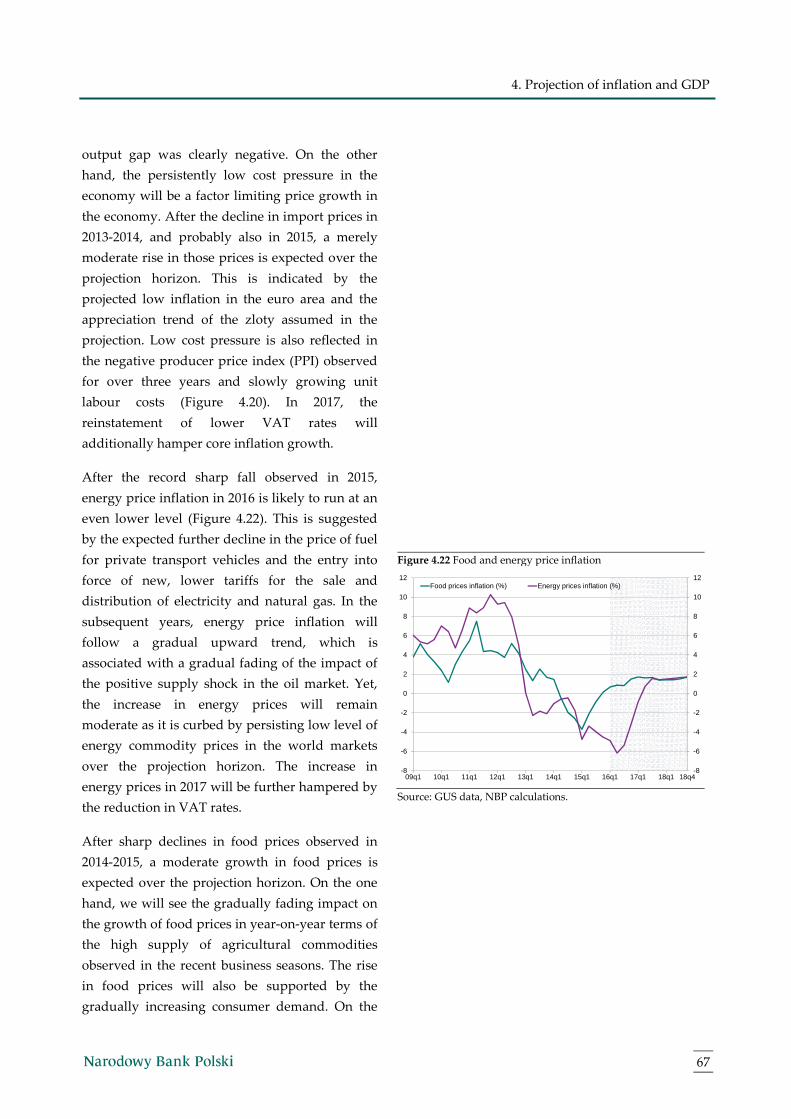
4. Projection of inflation and GDP
67
output gap was clearly negative. On the other
hand, the persistently low cost pressure in the
economy will be a factor limiting price growth in
the economy. After the decline in import prices in
2013-2014, and probably also in 2015, a merely
moderate rise in those prices is expected over the
projection horizon. This is indicated by the
projected low inflation in the euro area and the
appreciation trend of the zloty assumed in the
projection. Low cost pressure is also reflected in
the negative producer price index (PPI) observed
for over three years and slowly growing unit
labour costs (Figure 4.20). In 2017, the
reinstatement of lower VAT rates will
additionally hamper core inflation growth.
After the record sharp fall observed in 2015,
energy price inflation in 2016 is likely to run at an
even lower level (Figure 4.22). This is suggested
by the expected further decline in the price of fuel
for private transport vehicles and the entry into
force of new, lower tariffs for the sale and
distribution of electricity and natural gas. In the
subsequent years, energy price inflation will
follow a gradual upward trend, which is
associated with a gradual fading of the impact of
the positive supply shock in the oil market. Yet,
the increase in energy prices will remain
moderate as it is curbed by persisting low level of
energy commodity prices in the world markets
over the projection horizon. The increase in
energy prices in 2017 will be further hampered by
the reduction in VAT rates.
After sharp declines in food prices observed in
2014-2015, a moderate growth in food prices is
expected over the projection horizon. On the one
hand, we will see the gradually fading impact on
the growth of food prices in year-on-year terms of
the high supply of agricultural commodities
observed in the recent business seasons. The rise
in food prices will also be supported by the
gradually increasing consumer demand. On the
Figure 4.22 Food and energy price inflation
Source: GUS data, NBP calculations.
-8
-6
-4
-2
0
2
4
6
8
10
12
-8
-6
-4
-2
0
2
4
6
8
10
12
09q1 10q1 11q1 12q1 13q1 14q1 15q1 16q1 17q1 18q1 18q4
Food prices inflation (%) Energy prices inflation (%)

Inflation Report – March 2016
68
other hand, the growth of food prices will be
limited by low agricultural commodity prices in
the global markets (Figure 4.3). As in the case of
other components of the CPI inflation, the scale of
food price rises in 2017 will be further limited,
although to a lesser extent, by the reduction in
VAT rates.
Box 3: The impact of changes in oil prices on the revision to the inflation projection
The main factor determining the scale of revision to inflation forecasts in the recent period was the sharp
decline in oil prices in the global markets. At the time of adoption of the assumptions for the projection
published in November 2014, the price of oil exceeded USD 90 per barrel, to sink to a level close to USD 30 in
February 2016. Oil price forecasts assumed in each forecasting round are based on futures contracts, reflecting
the decisions of thousands of investors, as a result of which these contracts are factored in by many central
banks and international institutions in their forecasts. The futures contracts relied on in the November 2014
projection pointed to relatively stable oil prices, running significantly above their actual trends known today
(Figure B.3.1). The scale of the unexpected decline in oil prices is suggested by the forecasts running beyond
the 90% confidence interval determined on the basis of the errors made in the previous forecasts.
Table B.3.1 NBP inflation forecasts against the inflation forecasts by
other external forecasters (y/y, %)
Source Publ. date 2014 2015 2016
Reuters X ‘14 0.1 1.2 2.2
NBP surveys X ‘14 0.2 1.2 2.2
NBP forecast of CPI inflation XI ‘14 0.1 1.1 1.6
- core inflation XI ‘14 0.7 1.0 1.3
- food price inflation XI ‘14 -0.7 0.9 2.0
- energy price inflation XI ‘14 -0.6 1.5 2.0
Actual CPI 0.0 -0.9 -
- core inflation 0.6 0.3 -
- food price inflation -0.9 -1.7 -
- energy price inflation -1.0 -4.2 -
Source: NBP calculations.
The projection published in November 2014, pointed to a gradual rise in inflation to 1.1% in 2015 and to 1.6%
in 2016 (under the assumption of constant NBP interest rates, Table B.3.1). The unexpected sharp fall in oil
prices adversely affected the accuracy of the inflation forecasts formulated also by other forecasters. The
results of the surveys conducted by Narodowy Bank Polski (September 2014) and Reuters (October 2014)
among professional forecasters pointed to an even faster rise in inflation – to 2.2% in 2016 (median of
forecasts). Meanwhile, the actual CPI inflation in 2015 amounted to -0.9%, falling 2 percentage points below
the projection expectations. The forecast error was in approx. 50% due to the lower than expected growth of

4. Projection of inflation and GDP
69
energy prices, which in this period fell by 4.2%. The decline in these prices was largely driven by the reduction
in the prices of fuels for private transport vehicles and natural gas. Gas prices for households, approved by the
Energy Regulatory Office, are highly impacted by the price of gas imported from Russia, which, in line with
long-term contracts, responds to changes in oil prices with a delay of several quarters.
A further 30% discrepancy between the 2015 developments and the projection is due to lower-than-expected
negative growth in the prices of food and non-alcoholic beverages. The decline in these prices was the result of
both their high supply and low demand from Russia and Ukraine, which was affected by the economic crisis
in these countries and the ban on food products from the European Union imposed by the Russian Federation.
The difference between the projection and the actual developments in the case of core inflation was relatively
small and largely caused by the indirect impact of declines in crude oil prices on the components of core
inflation, as well as lower inflationary pressures worldwide. The decline in oil prices contributed in particular
to lower prices of transport services. Consequently, lower transport costs also put downward pressure on the
prices of other goods and services.
Figure B.3.1 Revision of oil price forecasts (USD/bbl) in respective projections against the background of the
90% confidence interval* of the November 2014 projection
Source: NBP calculations.
The 90% confidence interval for oil price forecasts made in the November 2014 projection was determined on the
basis of past forecast errors (from the 2005-2014 period).
4.4 Current versus previous projection
As compared to the November projection, in the
current forecasting round the GDP growth path
has been revised upwards and the CPI inflation
forecast has been reduced in the years 2016-2017
November 2014
March 2015
July 2015
November 2015
March 2016
0
20
40
60
80
100
120
140
160
180
0
20
40
60
80
100
120
140
160
180
05q1 06q1 07q1 08q1 09q1 10q1 11q1 12q1 13q1 14q1 15q1 16q1 17q1 18q1 18q4
Crude Oil Brent Price
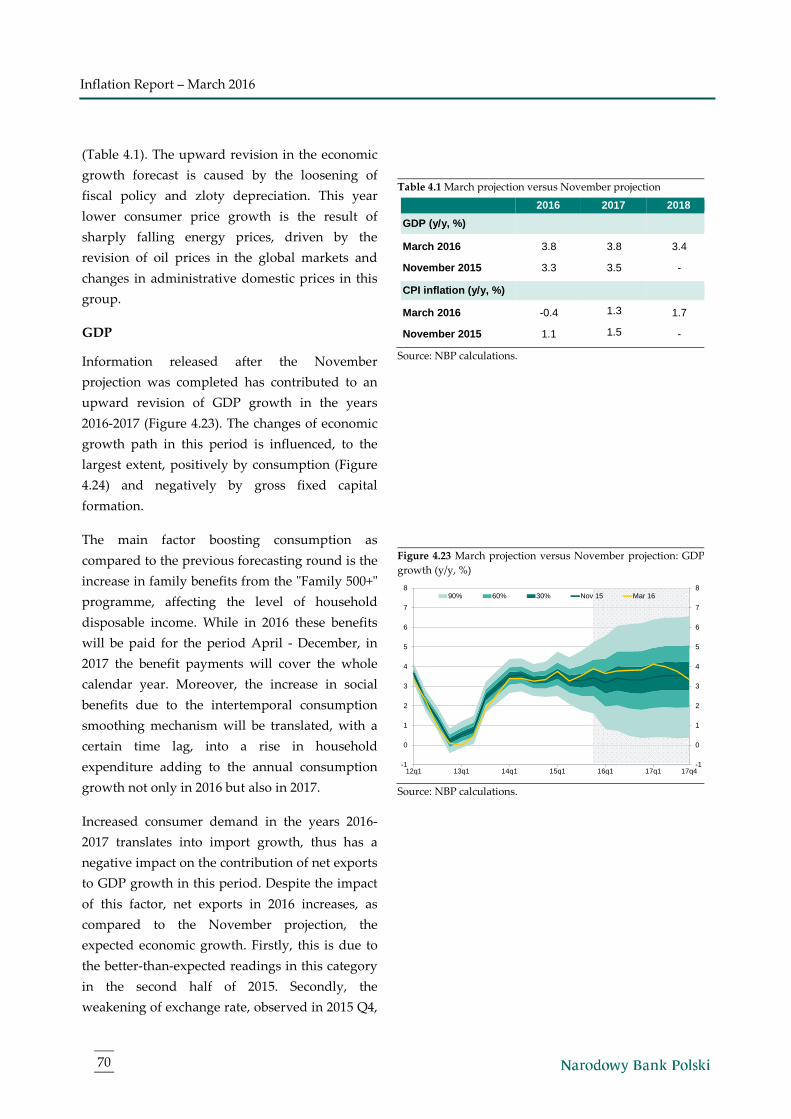
Inflation Report – March 2016
70
(Table 4.1). The upward revision in the economic
growth forecast is caused by the loosening of
fiscal policy and zloty depreciation. This year
lower consumer price growth is the result of
sharply falling energy prices, driven by the
revision of oil prices in the global markets and
changes in administrative domestic prices in this
group.
GDP
Information released after the November
projection was completed has contributed to an
upward revision of GDP growth in the years
2016-2017 (Figure 4.23). The changes of economic
growth path in this period is influenced, to the
largest extent, positively by consumption (Figure
4.24) and negatively by gross fixed capital
formation.
The main factor boosting consumption as
compared to the previous forecasting round is the
increase in family benefits from the "Family 500+"
programme, affecting the level of household
disposable income. While in 2016 these benefits
will be paid for the period April - December, in
2017 the benefit payments will cover the whole
calendar year. Moreover, the increase in social
benefits due to the intertemporal consumption
smoothing mechanism will be translated, with a
certain time lag, into a rise in household
expenditure adding to the annual consumption
growth not only in 2016 but also in 2017.
Increased consumer demand in the years 2016-
2017 translates into import growth, thus has a
negative impact on the contribution of net exports
to GDP growth in this period. Despite the impact
of this factor, net exports in 2016 increases, as
compared to the November projection, the
expected economic growth. Firstly, this is due to
the better-than-expected readings in this category
in the second half of 2015. Secondly, the
weakening of exchange rate, observed in 2015 Q4,
Table 4.1 March projection versus November projection
2016 2017 2018
GDP (y/y, %)
March 2016 November 2015
3.8
3.3
3.8
3.5
3.4 -
CPI inflation (y/y, %)
March 2016 November 2015
-0.4
1.1
1.3
1.5
1.7 -
Source: NBP calculations.
Figure 4.23 March projection versus November projection: GDP
growth (y/y, %)
Source: NBP calculations.
-1
0
1
2
3
4
5
6
7
8
-1
0
1
2
3
4
5
6
7
8
12q1 13q1 14q1 15q1 16q1 17q1 17q4
90% 60% 30% Nov 15 Mar 16

4. Projection of inflation and GDP
71
improves the price competitiveness of domestic
production, affecting exports and imports with
some delay. In 2017, when the impact of the
starting point and the exchange rate on net
exports will fade away, this category will fall
below the expectations from the last projection.
Central Statistical Office estimates from 26
January 2016 pointed to the investment growth in
the second half of 2015 falling short of the
November expectations and was a rationale for a
similar revision of this variable also in the
subsequent quarters of the projection. Another
factor in favor of the downward revision, as
compared to the previous forecasting round, of
the investment path in the period 2016-2017 is the
impact of tax on some financial institutions in
force from February 2016. It was assumed that in
the face of rising costs, banks will take measures
aimed at generating higher revenues by
increasing the cost of banking services. The effect
of these measures can be, in particular, growing
cost of credit and its declining availability, which
may be a drag on corporate and household
investment. It is expected, that the negative
impact on investment exerted by taxes imposed
on some financial institutions will grow in time as
banks are able to increase the cost of credit for
new loan agreements only. Downward revision of
investment over the projection horizon is also
associated with greater risk aversion of
companies when making long-term investment
plans due to increased uncertainty in the global
financial markets and concerns about future tax
burdens.54
Inflation
Information released after the cut-off date of the
November projection point to lower consumer
Figure 4.24 Decomposition of deviations between March and
November projection: GDP growth (percentage points)55
Source: NBP calculations.
54 Economic climate in the enterprise sector in 2015 Q4 and forecasts for 2016 Q1, NBP.
55 The data presented in the chart may vary slightly from those in Table 4.1, due to rounding of numbers to one decimal place.
-0.4
-0.2
0.0
0.2
0.4
0.6
0.8
1.0
-0.4
-0.2
0.0
0.2
0.4
0.6
0.8
1.0
2015 2016 2017
Private consumption Public consumption Gross capital formation
Net exports GDP
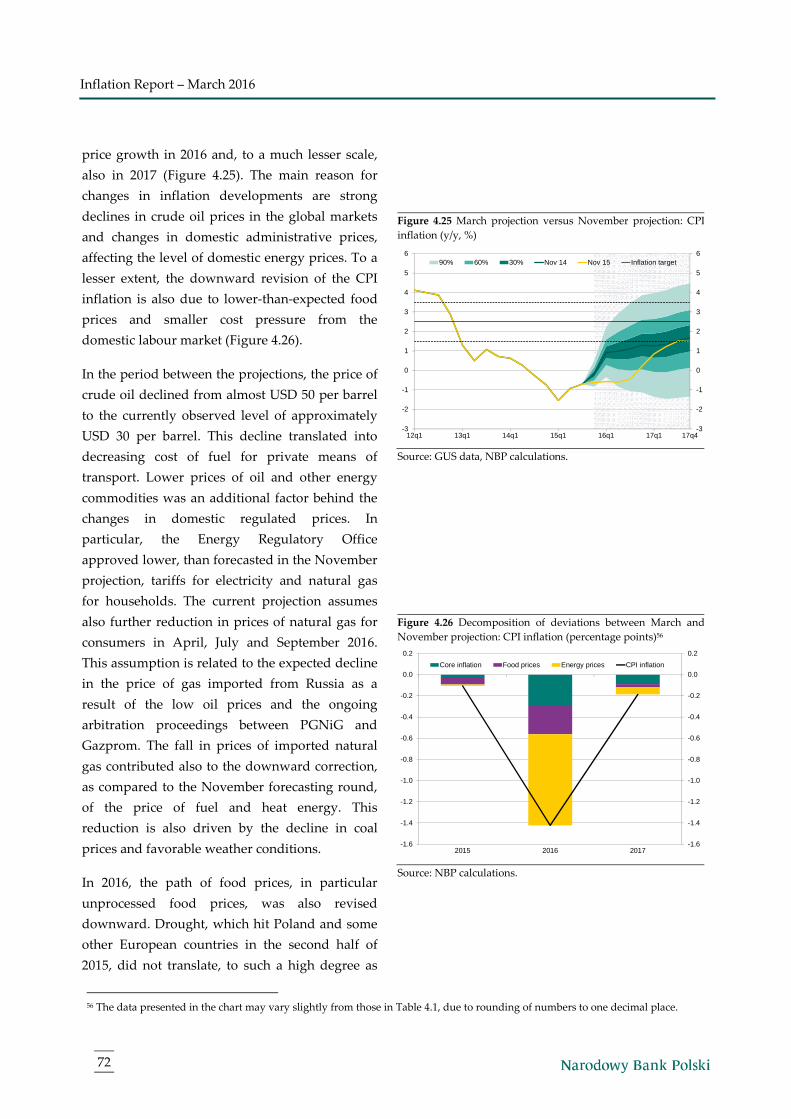
Inflation Report – March 2016
72
price growth in 2016 and, to a much lesser scale,
also in 2017 (Figure 4.25). The main reason for
changes in inflation developments are strong
declines in crude oil prices in the global markets
and changes in domestic administrative prices,
affecting the level of domestic energy prices. To a
lesser extent, the downward revision of the CPI
inflation is also due to lower-than-expected food
prices and smaller cost pressure from the
domestic labour market (Figure 4.26).
In the period between the projections, the price of
crude oil declined from almost USD 50 per barrel
to the currently observed level of approximately
USD 30 per barrel. This decline translated into
decreasing cost of fuel for private means of
transport. Lower prices of oil and other energy
commodities was an additional factor behind the
changes in domestic regulated prices. In
particular, the Energy Regulatory Office
approved lower, than forecasted in the November
projection, tariffs for electricity and natural gas
for households. The current projection assumes
also further reduction in prices of natural gas for
consumers in April, July and September 2016.
This assumption is related to the expected decline
in the price of gas imported from Russia as a
result of the low oil prices and the ongoing
arbitration proceedings between PGNiG and
Gazprom. The fall in prices of imported natural
gas contributed also to the downward correction,
as compared to the November forecasting round,
of the price of fuel and heat energy. This
reduction is also driven by the decline in coal
prices and favorable weather conditions.
In 2016, the path of food prices, in particular
unprocessed food prices, was also revised
downward. Drought, which hit Poland and some
other European countries in the second half of
2015, did not translate, to such a high degree as
Figure 4.25 March projection versus November projection: CPI
inflation (y/y, %)
Source: GUS data, NBP calculations.
Figure 4.26 Decomposition of deviations between March and
November projection: CPI inflation (percentage points)56
Source: NBP calculations.
56 The data presented in the chart may vary slightly from those in Table 4.1, due to rounding of numbers to one decimal place.
-3
-2
-1
0
1
2
3
4
5
6
-3
-2
-1
0
1
2
3
4
5
6
12q1 13q1 14q1 15q1 16q1 17q1 17q4
90% 60% 30% Nov 14 Nov 15 Inflation target
-1.6
-1.4
-1.2
-1.0
-0.8
-0.6
-0.4
-0.2
0.0
0.2
-1.6
-1.4
-1.2
-1.0
-0.8
-0.6
-0.4
-0.2
0.0
0.2
2015 2016 2017
Core inflation Food prices Energy prices CPI inflation

4. Projection of inflation and GDP
73
expected in the November projection, into food
and vegetable prices which was a rationale
behind their downward correction also in 2016.
Moreover, due to the lower than anticipated use
of subsidies for private storage of pork meat,
there is a large oversupply on the meat market,
resulting in lower, than expected in the previous
forecasting round, prices.
Core inflation is a component of consumer prices
which has been subject to the slightest revision.
On the one hand, along with the weakening of the
zloty exchange rate in 2015 Q4 prices of imported
goods are forecasted to grow faster. On the other
hand, however, low cost pressure from the
domestic labour market was the key factor behind
a slight downward revision of the path of core
inflation in 2016. Labour productivity growth in
line with the November projection will be
observed amid weaker growth in nominal wages,
which results from prolonging period of deflation
translating into wage expectations of
entrepreneurs and employees.
In 2017, along with the fading impact of oil price
declines on inflation in year-on-year terms and
the gradual stabilization of the food market, the
domestic energy and food price growth should
slowly return to the level assumed in the
November projection. Whereas core inflation in
2017 falling short of the expectations formulated
in the November projection, is the result of
persistently lower cost pressure reflected in a
slower pace of growth in unit labor costs.
4.5 Forecast uncertainty sources
The balance of risks for the March projection –
related to the macroeconomic conditions both in
Poland and its external environment – points to a
near-symmetrical distribution of risks to CPI

Inflation Report – March 2016
74
inflation (Table 4.2) and a negative balance of risk
factors for GDP growth. Under the assumption of
an unchanged NBP reference rate, the probability
of CPI inflation running in the range of acceptable
deviations from the NBP inflation target (1.5%-
3.5%), now close to zero, rises early in the
projection horizon to subsequently stabilize at
close to 36% in 2017-2018 (Table 4.2). The key
sources of uncertainty to the March projection are
presented below.
Deterioration in the prospects of growth in the
external environment of the Polish economy
A significant source of risk to the March
projection is related to the possibility of lower
than assumed growth in the external environment
of the Polish economy, especially in China and
advanced economies.
The risk of a strong deterioration in business
conditions in the Chinese economy is largely
driven by the threats to the stability of China’s
financial system. Should the effects of excessive
investment in the housing and manufacturing
sectors prove larger than currently assessed,
firms’ problems with debt servicing might trigger
a surge in uncertainty about the stability of the
Chinese banking and shadow banking sector.
Another source of risk to financial stability in
China is the considerable debt of local
government units due to heavy spending on
infrastructure projects. The excessive debt of the
private sector, Chinese local government units
and the resulting problems in the banking sector
may further dampen growth in investment and
consumer expenditure.
A stronger slowdown in China, which is one of
the major trading partners of the United States,
would contribute to a significant downward
revision of growth of the US economy as
compared to the projection assumptions.
Table 4.2 Probability of inflation running:
below 1.50%
below 2.50%
below 3.50%
below the central
projection
in the range
(1.5-3.5%)
16q1 1.00 1.00 1.00 0.50 0.00
16q2 1.00 1.00 1.00 0.50 0.00
16q3 0.96 1.00 1.00 0.50 0.04
16q4 0.83 0.95 0.99 0.50 0.17
17q1 0.66 0.85 0.95 0.49 0.30
17q2 0.56 0.77 0.91 0.49 0.35
17q3 0.49 0.70 0.86 0.49 0.37
17q4 0.50 0.71 0.86 0.50 0.36
18q1 0.49 0.70 0.86 0.52 0.37
18q2 0.50 0.71 0.87 0.54 0.37
18q3 0.50 0.70 0.86 0.55 0.35
18q4 0.49 0.69 0.85 0.56 0.36
Source: NBP calculations.
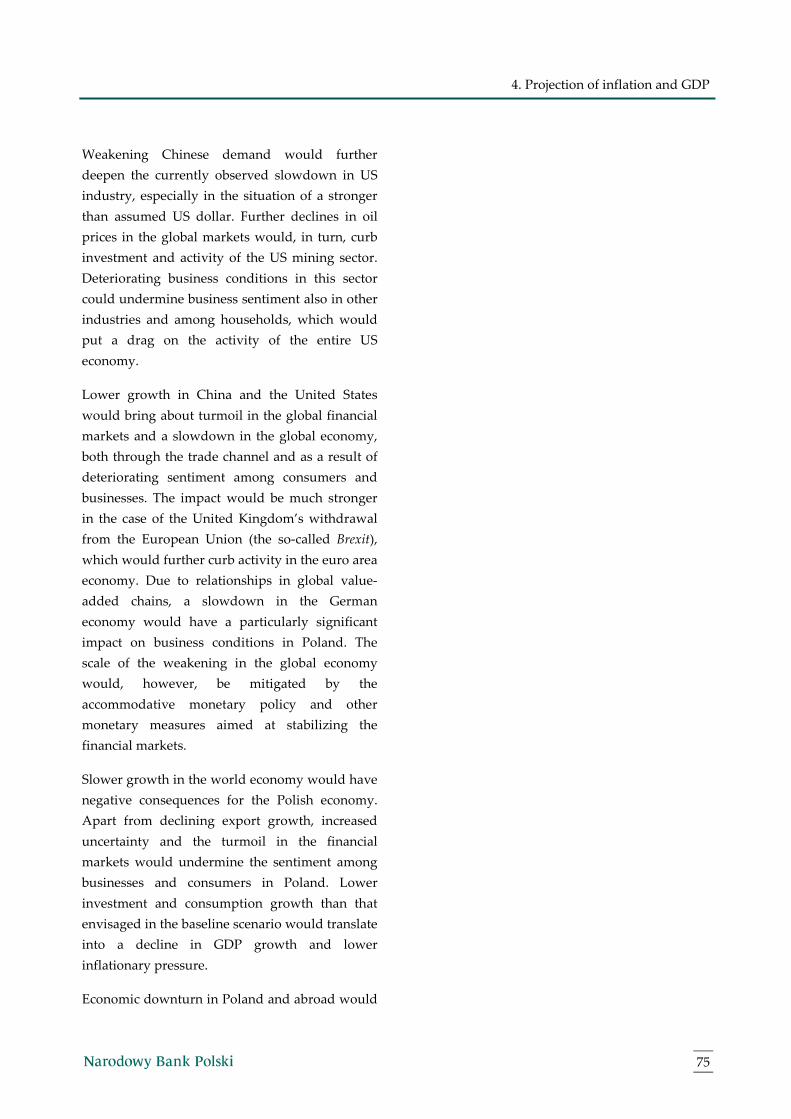
4. Projection of inflation and GDP
75
Weakening Chinese demand would further
deepen the currently observed slowdown in US
industry, especially in the situation of a stronger
than assumed US dollar. Further declines in oil
prices in the global markets would, in turn, curb
investment and activity of the US mining sector.
Deteriorating business conditions in this sector
could undermine business sentiment also in other
industries and among households, which would
put a drag on the activity of the entire US
economy.
Lower growth in China and the United States
would bring about turmoil in the global financial
markets and a slowdown in the global economy,
both through the trade channel and as a result of
deteriorating sentiment among consumers and
businesses. The impact would be much stronger
in the case of the United Kingdom’s withdrawal
from the European Union (the so-called Brexit),
which would further curb activity in the euro area
economy. Due to relationships in global value-
added chains, a slowdown in the German
economy would have a particularly significant
impact on business conditions in Poland. The
scale of the weakening in the global economy
would, however, be mitigated by the
accommodative monetary policy and other
monetary measures aimed at stabilizing the
financial markets.
Slower growth in the world economy would have
negative consequences for the Polish economy.
Apart from declining export growth, increased
uncertainty and the turmoil in the financial
markets would undermine the sentiment among
businesses and consumers in Poland. Lower
investment and consumption growth than that
envisaged in the baseline scenario would translate
into a decline in GDP growth and lower
inflationary pressure.
Economic downturn in Poland and abroad would

Inflation Report – March 2016
76
significantly increase the risk of a higher budget
deficit than the one in the March projection
baseline scenario. In such a situation, the financial
markets could revise downward their assessment
of Poland’s creditworthiness, which would raise
the yield on government bonds. As a result of the
possible difficulties with financing public finance
sector expenditure, the government would
probably undertake actions aimed at tightening
fiscal policy. Lower risk appetite in the financial
markets would also contribute to weakening the
zloty exchange rate as compared with the baseline
scenario of the March projection, which would be
an additional factor increasing the government
debt to GDP ratio (as part of bonds are issued in
foreign currency). At the same time, however, by
improving the price competitiveness of Polish
exports and increasing the cost of import, the
weaker zloty would somewhat reduce the scale of
the slowdown of domestic growth.
The slowdown in economic activity in Poland and
abroad would add to the risk of lower
inflationary pressures than assumed in the
baseline scenario, which, amid declining prices of
agricultural and energy commodities, would be
conducive to the low CPI inflation persisting in
the longer term. This effect, however, would be
reduced by an increase in import prices due to the
weakening of the zloty exchange rate.
Rising domestic demand on the back of stronger
economic activity in the euro area and Central
European economies
Considerable uncertainty for the March
projection, this time with a potential positive
impact on GDP growth in Poland, stems from the
possibility of faster than envisaged in the baseline
scenario economic growth in Poland’s major
trading partners – the euro area and Central
European economies. On the one hand, this could
be driven by declining uncertainty about the
4. Projection of inflation and GDP
77
global economic outlook, particularly regarding
the developments in the United States and
emerging markets. On the other hand, a higher
growth rate in the euro area compared to what
was assumed in the baseline scenario could be
fuelled by a stronger impact of the ECB’s
government bond purchasing programme than
currently expected and its possible expansion.
Should the euro depreciate against the dollar
more than expected, the euro area countries
would increase their exports, which might result
in a faster restoration of fixed capital in the
economy, especially amid easier access to credit.
Low borrowing costs, coupled with the
improving labour market conditions, would give
a boost to households’ purchasing power. The
greater than assumed scale of fiscal policy easing
would also foster faster growth in the euro area.
Should business conditions in the euro area
economy prove stronger than assumed in the
projection, higher export growth would
contribute to faster GDP growth in Poland and
other Central European countries. An
improvement in the situation of Polish exporters
could help sustain the robust investment activity
of domestic businesses over a longer time. A
faster improvement in Polish labour market,
coupled with low NBP interest rates, might
encourage households to use their higher real
wages to boost consumption at the expense of a
lower savings rate than assumed in the baseline
scenario. Higher domestic demand growth would
translate into materially higher GDP growth and
consumer price growth in comparison to the
baseline scenario of the March projection.
Further in the projection horizon, economic
growth could be supported by the effect of the
implementation of the European Commission’s
Investment Plan for the years 2015-2017.
According to the European Commission
estimates, the full realisation of the plan may

Inflation Report – March 2016
78
boost the European Union GDP by EUR 330-
410bn, resulting in the creation of 1-1.3 million
new jobs. Should the envisaged risk factors
materialise, GDP and CPI inflation would run
above the path assumed in the baseline scenario
of the projection.
Oil prices in the global markets
Another source of uncertainty for the baseline
scenario are prices of oil and other energy
commodities in the global markets. The risk of
significant fluctuations in oil prices is primarily
driven by factors changing the global oil supply.
They include supply of Iranian oil as a result of
the lifting of sanctions in January 2016 by the
European Union and the United States as well as
the reaction of American oil producers to the
deepening decline in prices of this commodity.
Other sources of uncertainty concern the supply
of oil related to the restoration of supply from
Libya. Demand factors related to prospects of
growth in the global economy, in particular in
emerging market economies, also add (but to a
lesser extent) to the risks associated with the path
of oil prices assumed in the baseline scenario.
Fiscal policy
A risk for the current projection also results from
the possibility of the government’s measures
aimed at limiting the deficit in the years 2017-
2018. They would be connected with a tightening
of fiscal policy, which could include the
withdrawal of the planned reduction of the basic
VAT rate since 2017 or even its increase. Measures
aimed at boosting the budget revenue could also
include an increase in the excise duty on fuel
since 2017 and the introduction of the planned tax
on retail sales. The likely reduction in expenditure
would entail, among others, a slowdown in wage
growth in the public sector. These changes would
boost consumer prices above the baseline scenario
4. Projection of inflation and GDP
79
and contribute to lower GDP growth. However,
due to the absence of detailed information on the
nature of possible fiscal adjustments, their
potential effects have not been included in the
baseline scenario of the March projection.
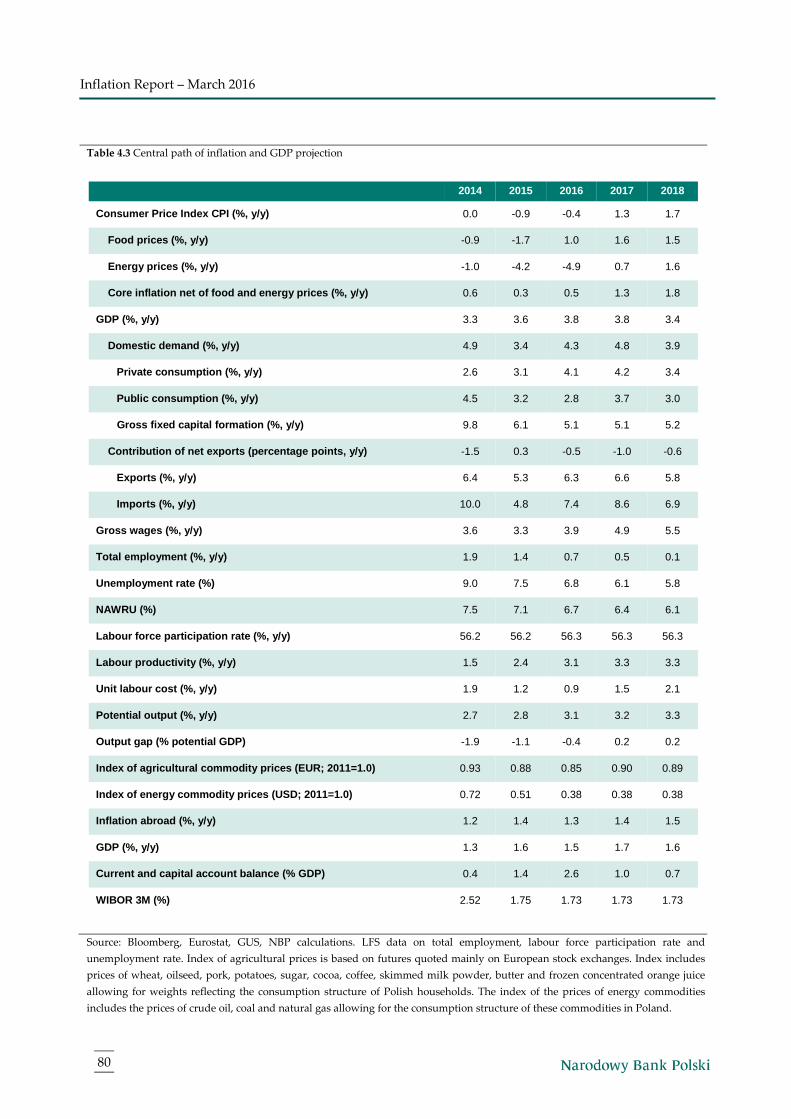
Inflation Report – March 2016
80
Table 4.3 Central path of inflation and GDP projection
2014 2015 2016 2017 2018
Consumer Price Index CPI (%, y/y) 0.0 -0.9 -0.4 1.3 1.7
Food prices (%, y/y) -0.9 -1.7 1.0 1.6 1.5
Energy prices (%, y/y) -1.0 -4.2 -4.9 0.7 1.6
Core inflation net of food and energy prices (%, y/y) 0.6 0.3 0.5 1.3 1.8
GDP (%, y/y) 3.3 3.6 3.8 3.8 3.4
Domestic demand (%, y/y) 4.9 3.4 4.3 4.8 3.9
Private consumption (%, y/y) 2.6 3.1 4.1 4.2 3.4
Public consumption (%, y/y) 4.5 3.2 2.8 3.7 3.0
Gross fixed capital formation (%, y/y) 9.8 6.1 5.1 5.1 5.2
Contribution of net exports (percentage points, y/y) -1.5 0.3 -0.5 -1.0 -0.6
Exports (%, y/y) 6.4 5.3 6.3 6.6 5.8
Imports (%, y/y) 10.0 4.8 7.4 8.6 6.9
Gross wages (%, y/y) 3.6 3.3 3.9 4.9 5.5
Total employment (%, y/y) 1.9 1.4 0.7 0.5 0.1
Unemployment rate (%) 9.0 7.5 6.8 6.1 5.8
NAWRU (%) 7.5 7.1 6.7 6.4 6.1
Labour force participation rate (%, y/y) 56.2 56.2 56.3 56.3 56.3
Labour productivity (%, y/y) 1.5 2.4 3.1 3.3 3.3
Unit labour cost (%, y/y) 1.9 1.2 0.9 1.5 2.1
Potential output (%, y/y) 2.7 2.8 3.1 3.2 3.3
Output gap (% potential GDP) -1.9 -1.1 -0.4 0.2 0.2
Index of agricultural commodity prices (EUR; 2011=1.0) 0.93 0.88 0.85 0.90 0.89
Index of energy commodity prices (USD; 2011=1.0) 0.72 0.51 0.38 0.38 0.38
Inflation abroad (%, y/y) 1.2 1.4 1.3 1.4 1.5
GDP (%, y/y) 1.3 1.6 1.5 1.7 1.6
Current and capital account balance (% GDP) 0.4 1.4 2.6 1.0 0.7
WIBOR 3M (%) 2.52 1.75 1.73 1.73 1.73
Source: Bloomberg, Eurostat, GUS, NBP calculations. LFS data on total employment, labour force participation rate and
unemployment rate. Index of agricultural prices is based on futures quoted mainly on European stock exchanges. Index includes
prices of wheat, oilseed, pork, potatoes, sugar, cocoa, coffee, skimmed milk powder, butter and frozen concentrated orange juice
allowing for weights reflecting the consumption structure of Polish households. The index of the prices of energy commodities
includes the prices of crude oil, coal and natural gas allowing for the consumption structure of these commodities in Poland.

5. The voting of the Monetary Policy Council members in October 2015 – January 2016
81
The voting of the Monetary Policy Council
members in October 2015 – January 2016
� Date: 1 December 2015
Subject matter of motion or resolution:
Resolution No. 7/2015 of 1 December 2015 on approving the Financial Plan of the National Bank of
Poland for 2016.
Voting of the MPC members:
For: M. Belka
A. Bratkowski
E. Chojna-Duch
A. Glapiński
J. Hausner
A. Kaźmierczak
E.J. Osiatyński
A. Rzońca
J. Winiecki
A. Zielińska-Głębocka
Against:

www.nbp.pl