marengo lid symposium_2011-09-25
TRANSCRIPT
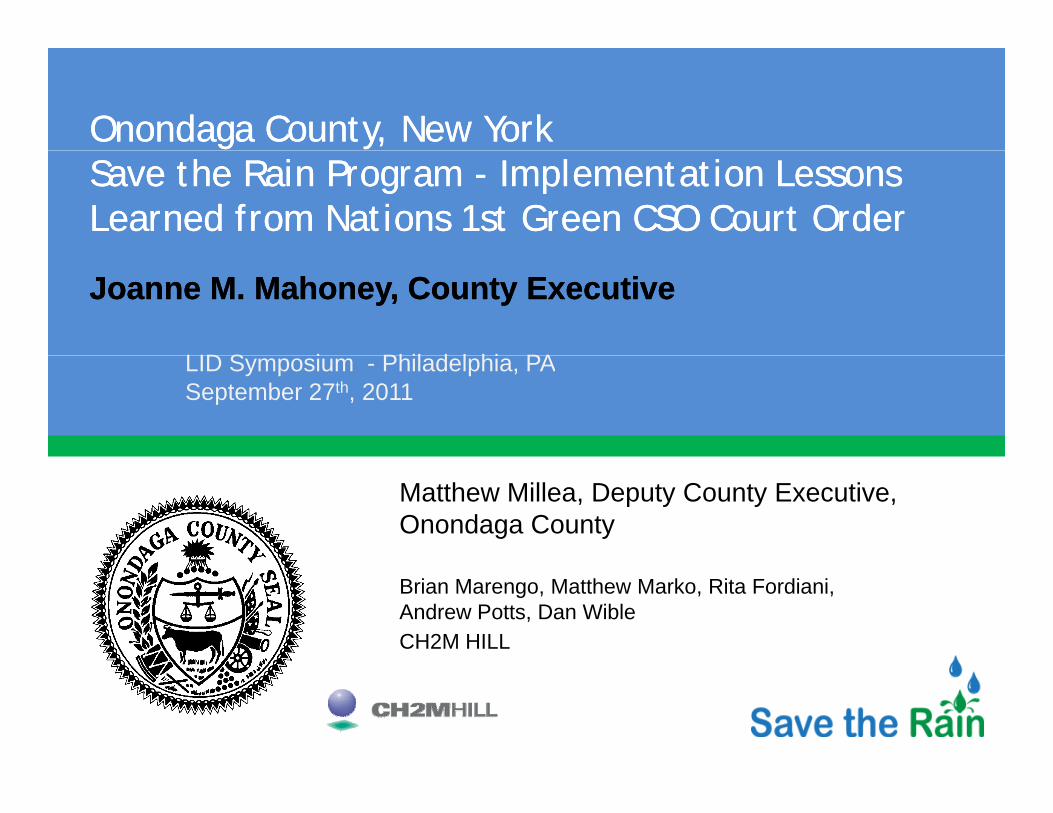
Onondaga County, New YorkOnondaga County, New YorkSave the Rain Program - Implementation Lessons Learned from Nations 1st Green CSO Court Order Save the Rain Program - Implementation Lessons Learned from Nations 1st Green CSO Court Order
Joanne M. Mahoney, County ExecutiveJoanne M. Mahoney, County Executive
LID S i Phil d l hi PALID Symposium - Philadelphia, PASeptember 27th, 2011
Matthew Millea, Deputy County Executive, Onondaga County
Brian Marengo, Matthew Marko, Rita Fordiani, Andrew Potts, Dan WibleCH2M HILL
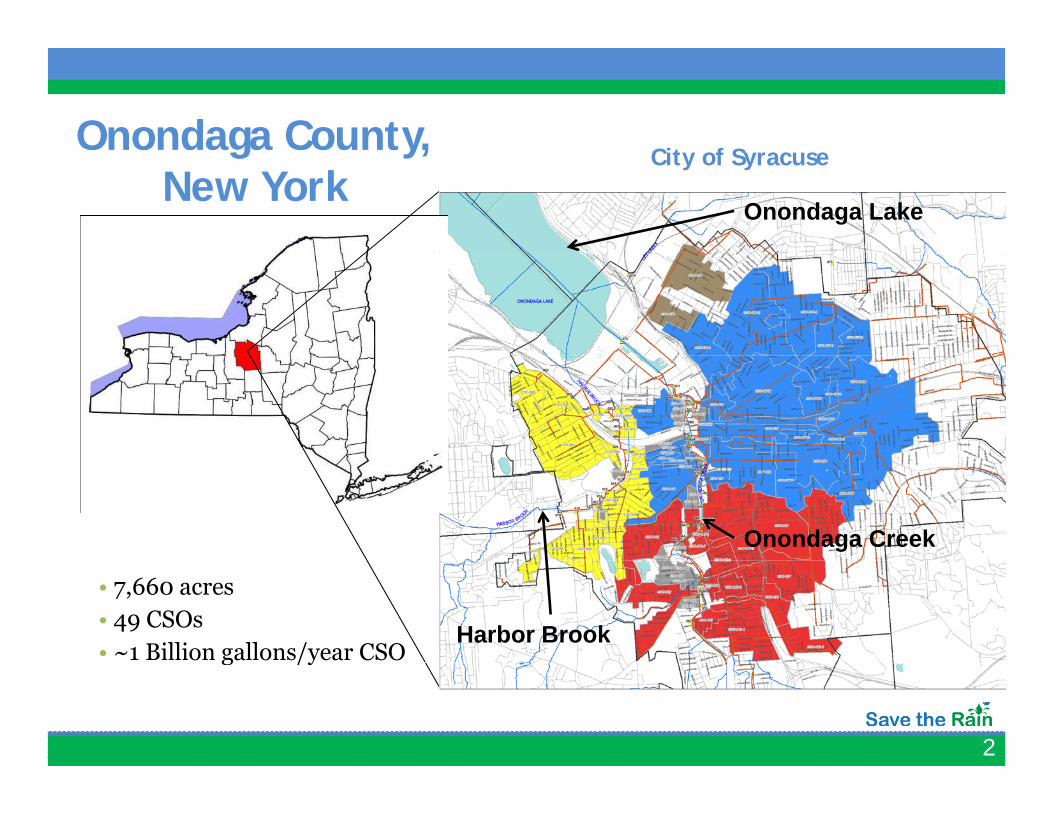
Onondaga County,Cit f S
g y,New York
City of Syracuse
Onondaga Lake
Onondaga Creek
• 7,660 acres• 49 CSOs• ~1 Billion gallons/year CSO
Harbor Brook
2
g /y
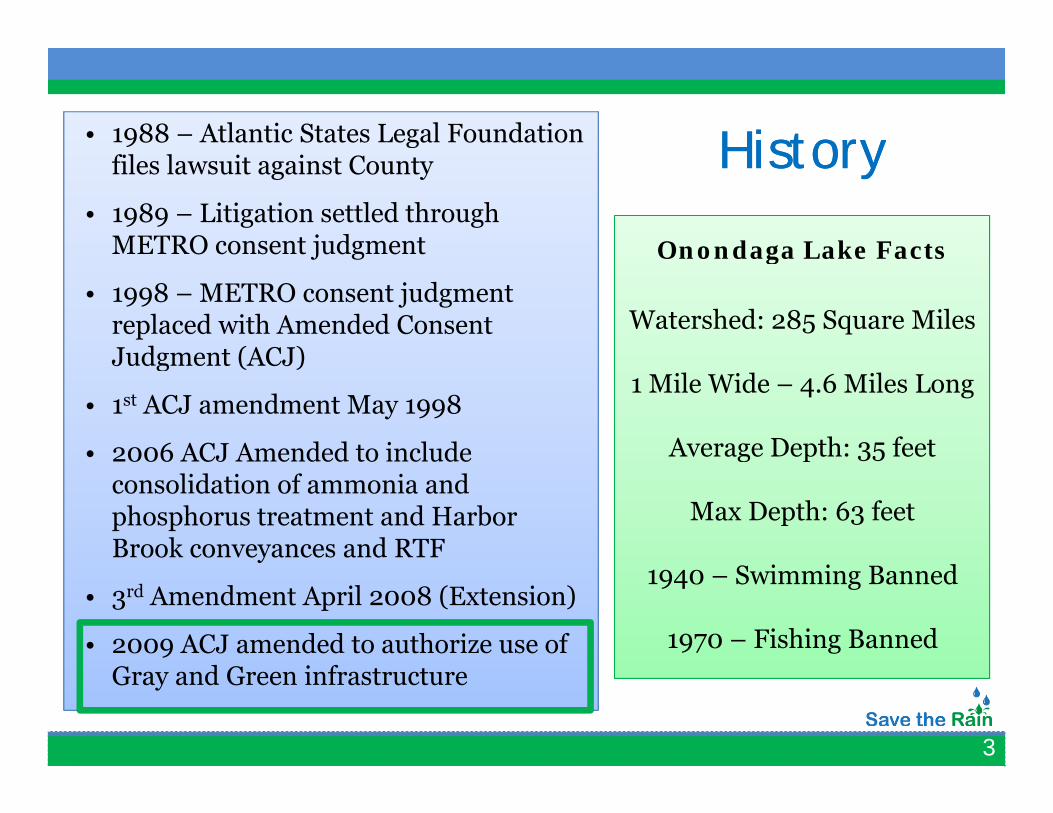
HistoryHistory• 1988 – Atlantic States Legal Foundation HistoryHistory
Onondaga Lake Facts
files lawsuit against County
• 1989 – Litigation settled through METRO consent judgment Onondaga Lake Facts
Watershed: 285 Square Miles
METRO consent judgment
• 1998 – METRO consent judgment replaced with Amended Consent Judgment (ACJ)
1 Mile Wide – 4.6 Miles Long
Average Depth: 35 feet
Judgment (ACJ)
• 1st ACJ amendment May 1998
• 2006 ACJ Amended to include g p 35
Max Depth: 63 feet
2006 ACJ Amended to include consolidation of ammonia and phosphorus treatment and Harbor Brook conveyances and RTF
1940 – Swimming Banned
1970 – Fishing Banned
y
• 3rd Amendment April 2008 (Extension)
• 2009 ACJ amended to authorize use of
3
Gray and Green infrastructure
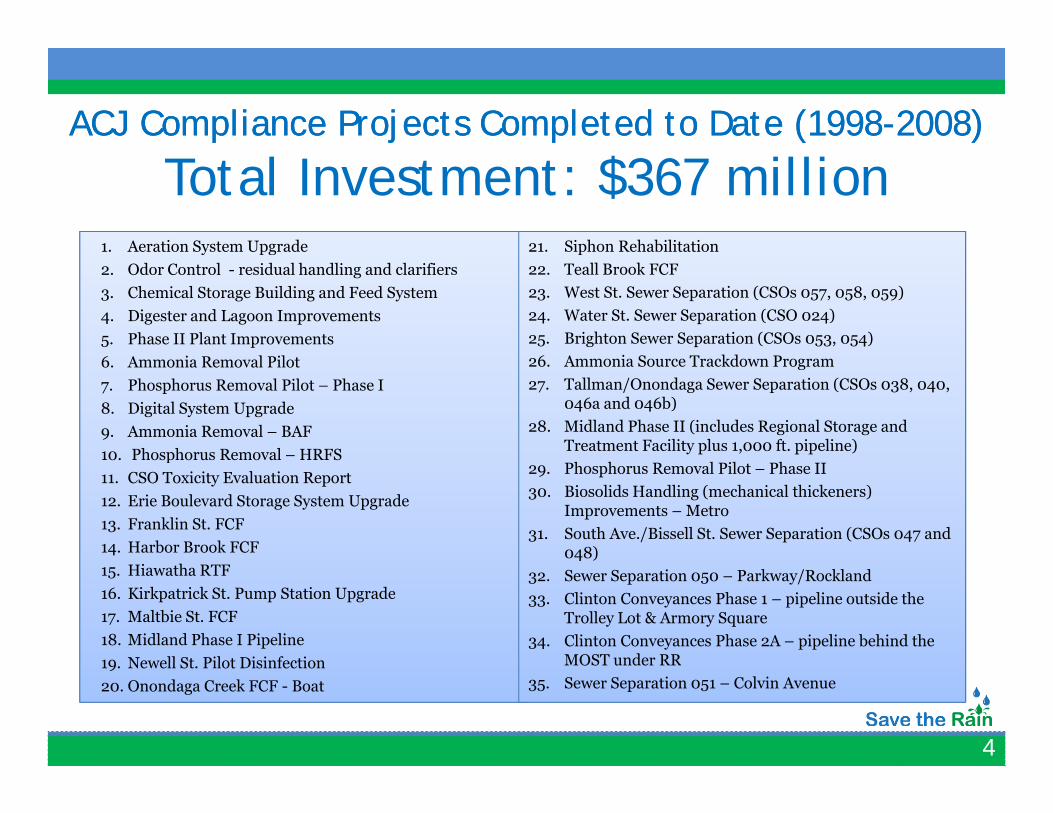
ACJ Compliance Projects Completed to Date (1998ACJ Compliance Projects Completed to Date (1998--2008)2008)
Total Investment: $367 million1. Aeration System Upgrade 21. Siphon Rehabilitationy pg2. Odor Control - residual handling and clarifiers3. Chemical Storage Building and Feed System4. Digester and Lagoon Improvements5. Phase II Plant Improvements
l l
p22. Teall Brook FCF23. West St. Sewer Separation (CSOs 057, 058, 059)24. Water St. Sewer Separation (CSO 024)25. Brighton Sewer Separation (CSOs 053, 054)
6 A i S kd 6. Ammonia Removal Pilot7. Phosphorus Removal Pilot – Phase I8. Digital System Upgrade9. Ammonia Removal – BAF10. Phosphorus Removal – HRFS
26. Ammonia Source Trackdown Program27. Tallman/Onondaga Sewer Separation (CSOs 038, 040,
046a and 046b)28. Midland Phase II (includes Regional Storage and
Treatment Facility plus 1,000 ft. pipeline)10. Phosphorus Removal HRFS11. CSO Toxicity Evaluation Report12. Erie Boulevard Storage System Upgrade13. Franklin St. FCF14. Harbor Brook FCF
29. Phosphorus Removal Pilot – Phase II30. Biosolids Handling (mechanical thickeners)
Improvements – Metro31. South Ave./Bissell St. Sewer Separation (CSOs 047 and
048)15. Hiawatha RTF16. Kirkpatrick St. Pump Station Upgrade17. Maltbie St. FCF18. Midland Phase I Pipeline19 Newell St Pilot Disinfection
4 )32. Sewer Separation 050 – Parkway/Rockland33. Clinton Conveyances Phase 1 – pipeline outside the
Trolley Lot & Armory Square34. Clinton Conveyances Phase 2A – pipeline behind the
MOST under RR
4
19. Newell St. Pilot Disinfection20. Onondaga Creek FCF - Boat
MOST under RR35. Sewer Separation 051 – Colvin Avenue
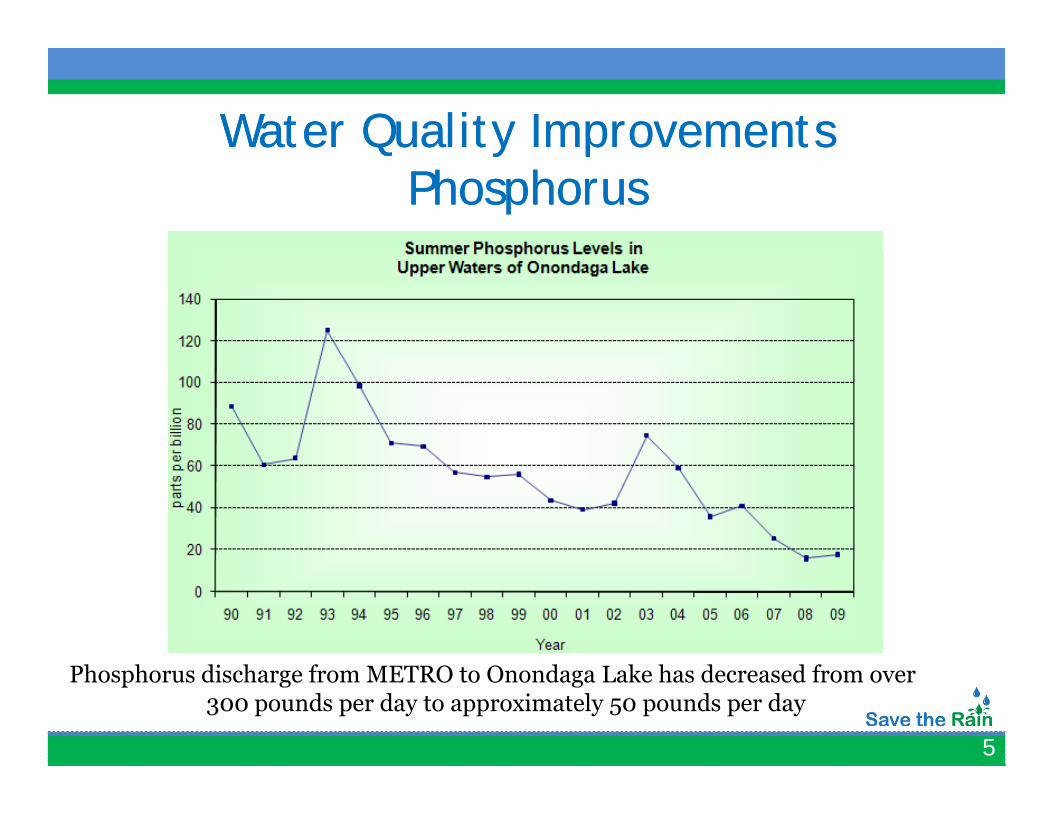
Water Quality ImprovementsWater Quality ImprovementsQ y pQ y pPhosphorusPhosphorus
5
Phosphorus discharge from METRO to Onondaga Lake has decreased from over 300 pounds per day to approximately 50 pounds per day
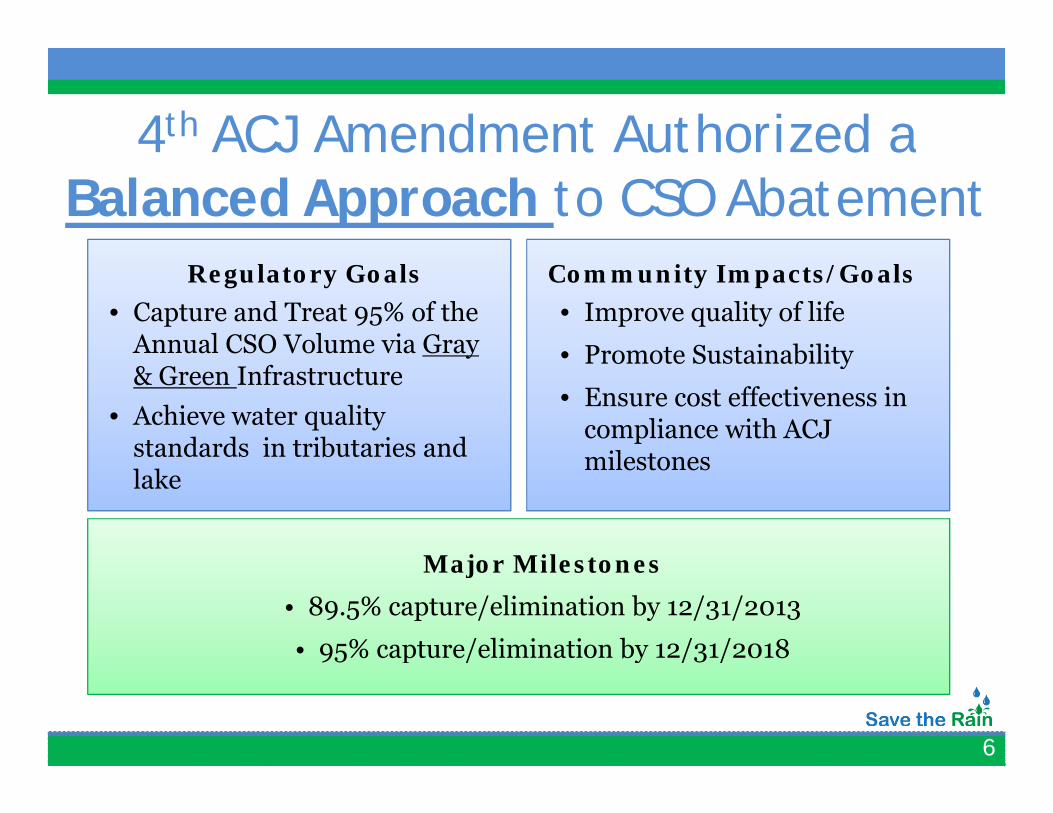
4th ACJ Amendment Authorized a4 ACJ Amendment Authorized aBalanced Approach to CSO Abatement
Regulatory Goals • Capture and Treat 95% of the
Annual CSO Volume via Gray
Community Impacts/Goals• Improve quality of life
• Promote Sustainabilityy& Green Infrastructure
• Achieve water quality standards in tributaries and
• Promote Sustainability
• Ensure cost effectiveness in compliance with ACJ milestones
lakemilestones
Major Milestones Major Milestones • 89.5% capture/elimination by 12/31/2013
• 95% capture/elimination by 12/31/2018
6
p / y / /
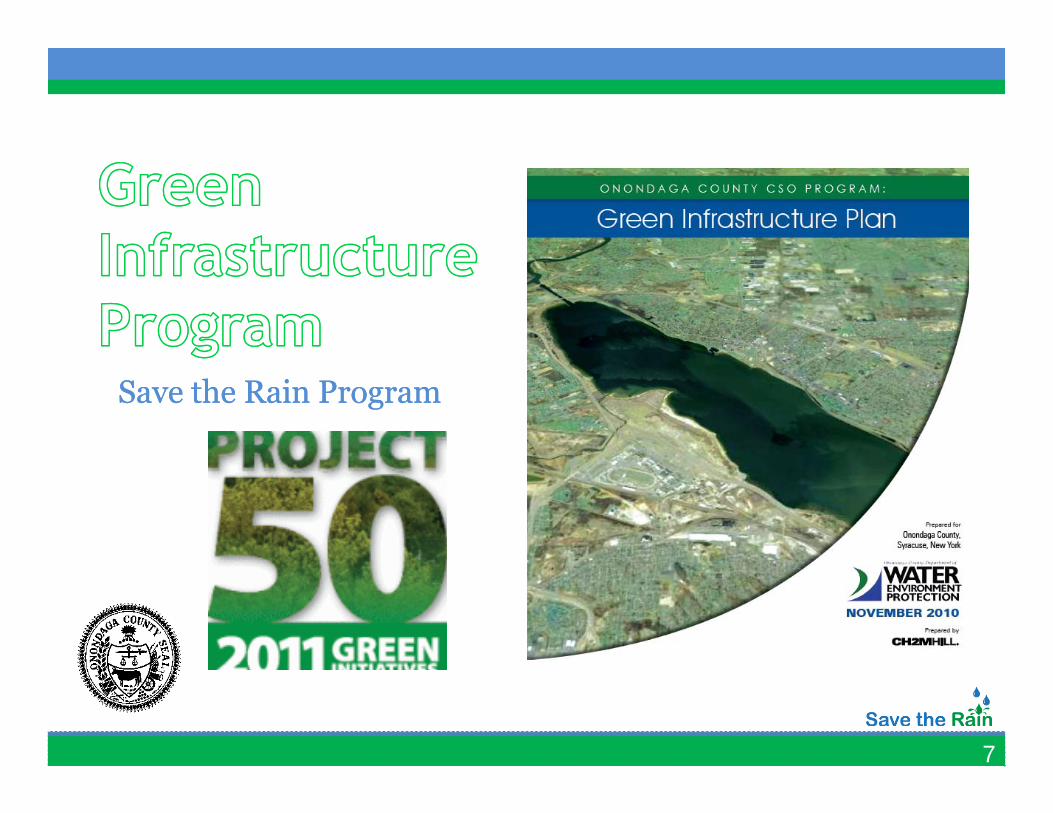
Save the Rain ProgramSave the Rain Program
7
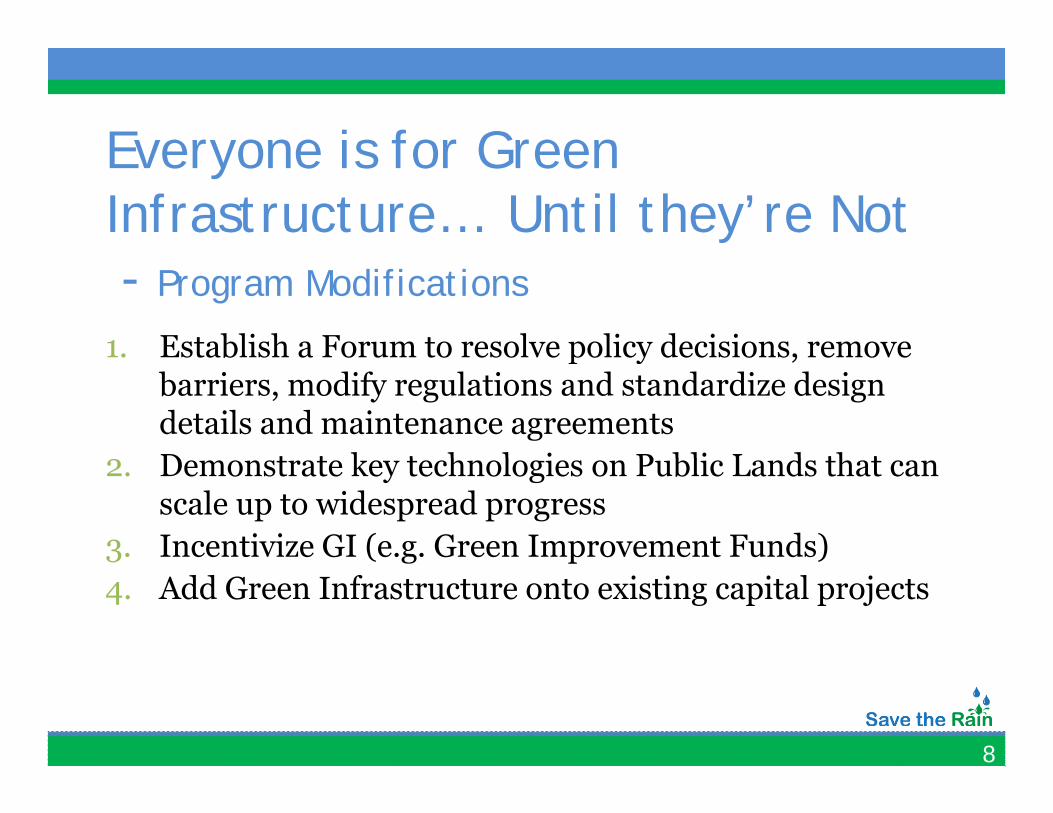
Everyone is for Green Everyone is for Green Infrastructure… Until they’re Not- Program Modifications
1. Establish a Forum to resolve policy decisions, remove 1. Establish a Forum to resolve policy decisions, remove barriers, modify regulations and standardize design details and maintenance agreements D t t k t h l i P bli L d th t 2. Demonstrate key technologies on Public Lands that can scale up to widespread progress
3. Incentivize GI (e.g. Green Improvement Funds)3 ( g p )4. Add Green Infrastructure onto existing capital projects
8
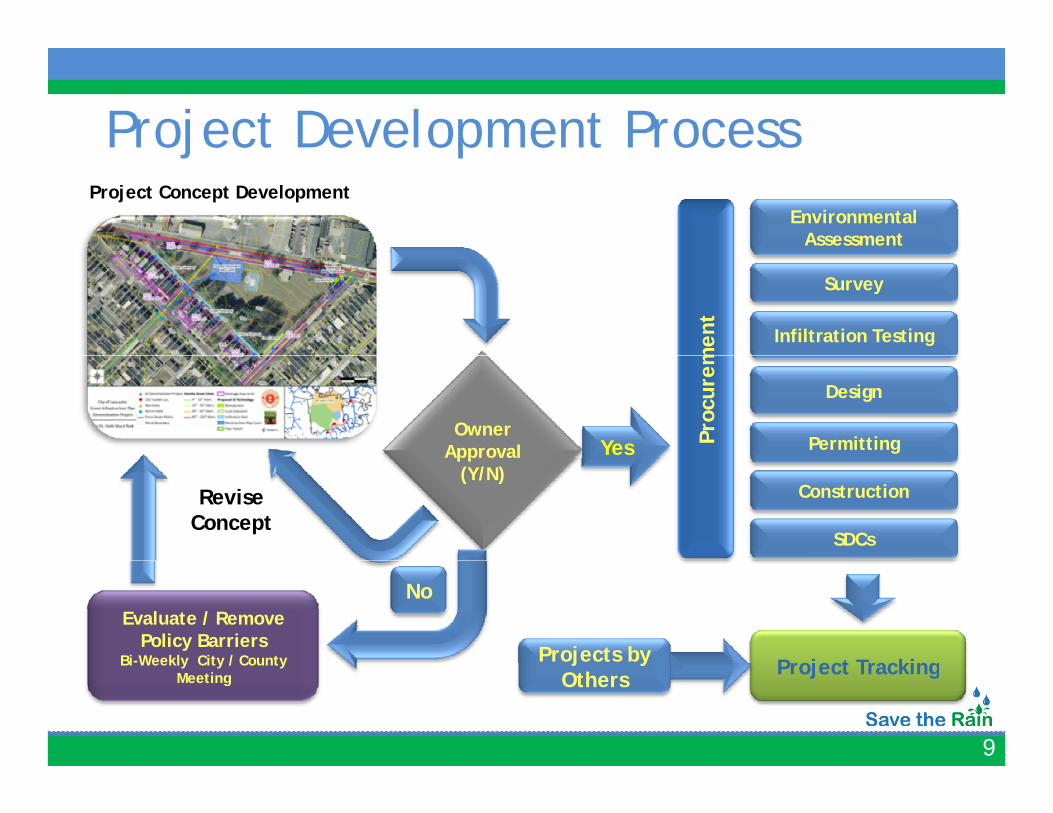
Project Development Processj pProject Concept Development
Environmental Assessment
men
t
Survey
Infiltration Testing
Proc
urem
Owner Approval Yes
Design
Permittingpp(Y/N)
SDCs
ConstructionRevise Concept
Project Tracking
NoEvaluate / Remove
Policy BarriersBi-Weekly City / County Projects by
9
Project TrackingBi Weekly City / County Meeting
j yOthers
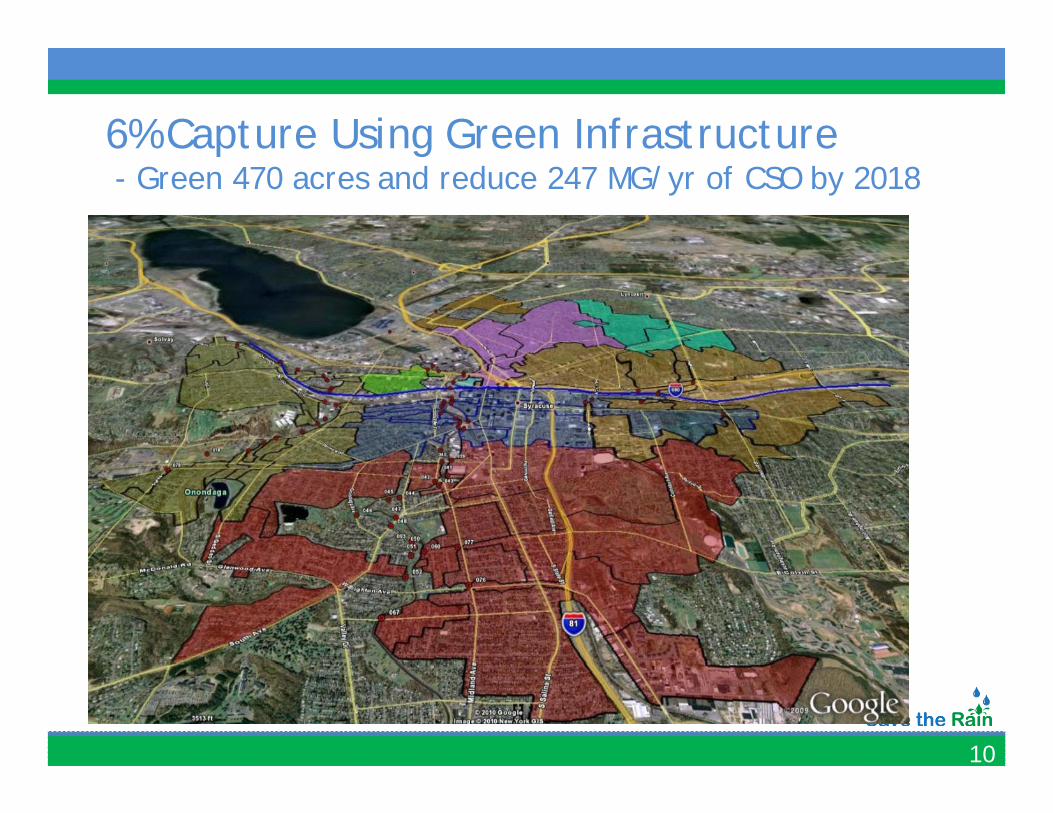
6% Capture Using Green Infrastructurep g- Green 470 acres and reduce 247 MG/yr of CSO by 2018
10
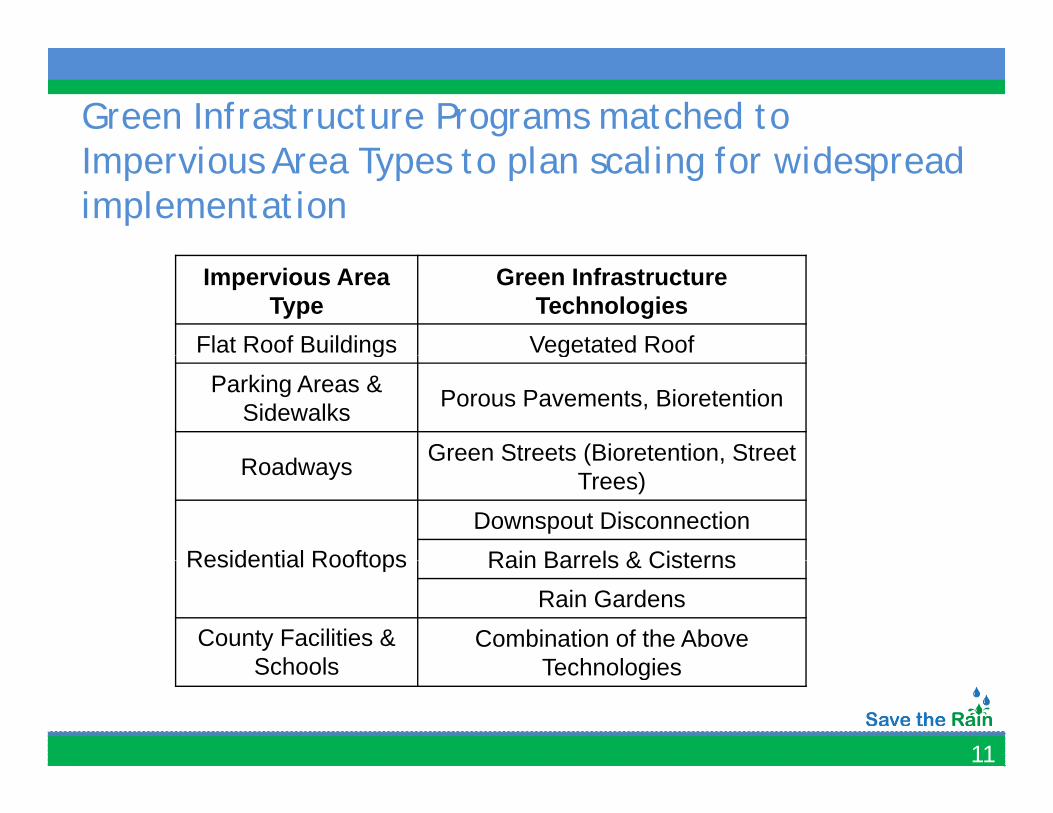
Green Infrastructure Programs matched to I i A T t l li f id d Impervious Area Types to plan scaling for widespread implementation
Impervious Area Type
Green Infrastructure Technologies
Flat Roof Buildings Vegetated Roofg gParking Areas &
Sidewalks Porous Pavements, Bioretention
R d Green Streets (Bioretention StreetRoadways Green Streets (Bioretention, Street Trees)
Residential RooftopsDownspout Disconnection
Rain Barrels & CisternsResidential Rooftops Rain Barrels & CisternsRain Gardens
County Facilities & Schools
Combination of the Above Technologies
11
Schools Technologies
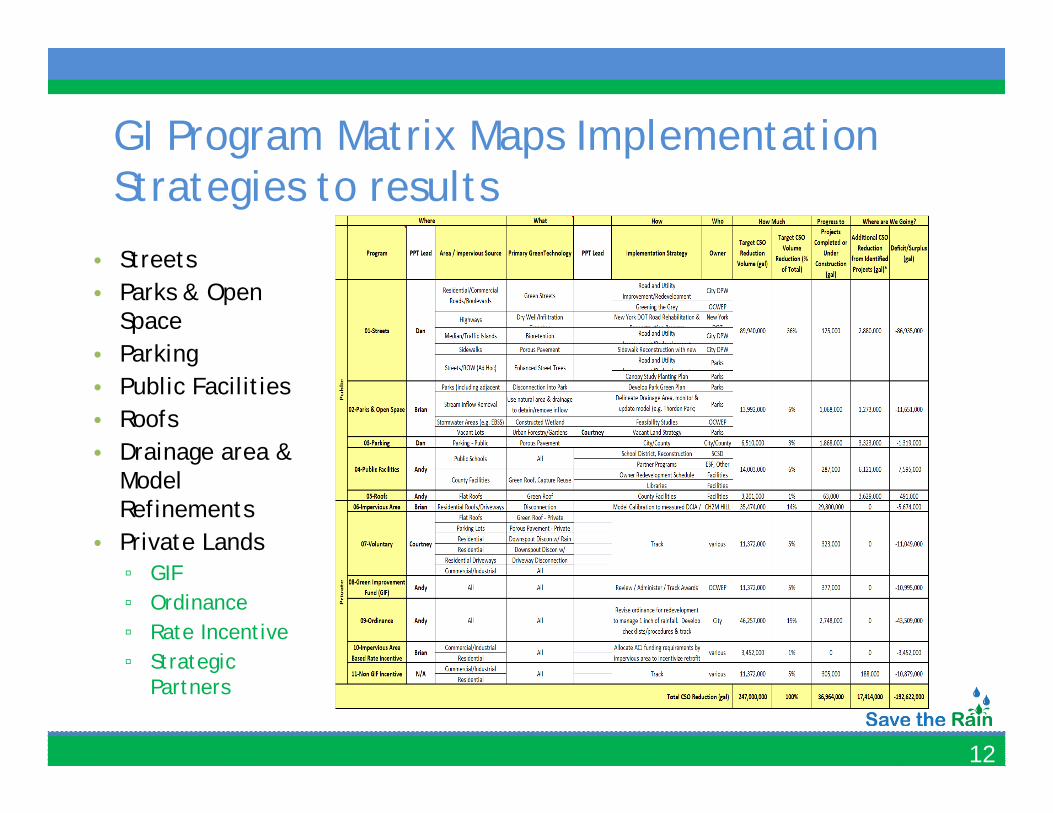
GI Program Matrix Maps Implementation g p pStrategies to results
St t• Streets• Parks & Open
Space• Parking• Parking• Public Facilities• Roofs• Drainage area & Drainage area &
Model Refinements
• Private Lands▫ GIF▫ Ordinance▫ Rate Incentive▫ Strategic
12
▫ Strategic Partners
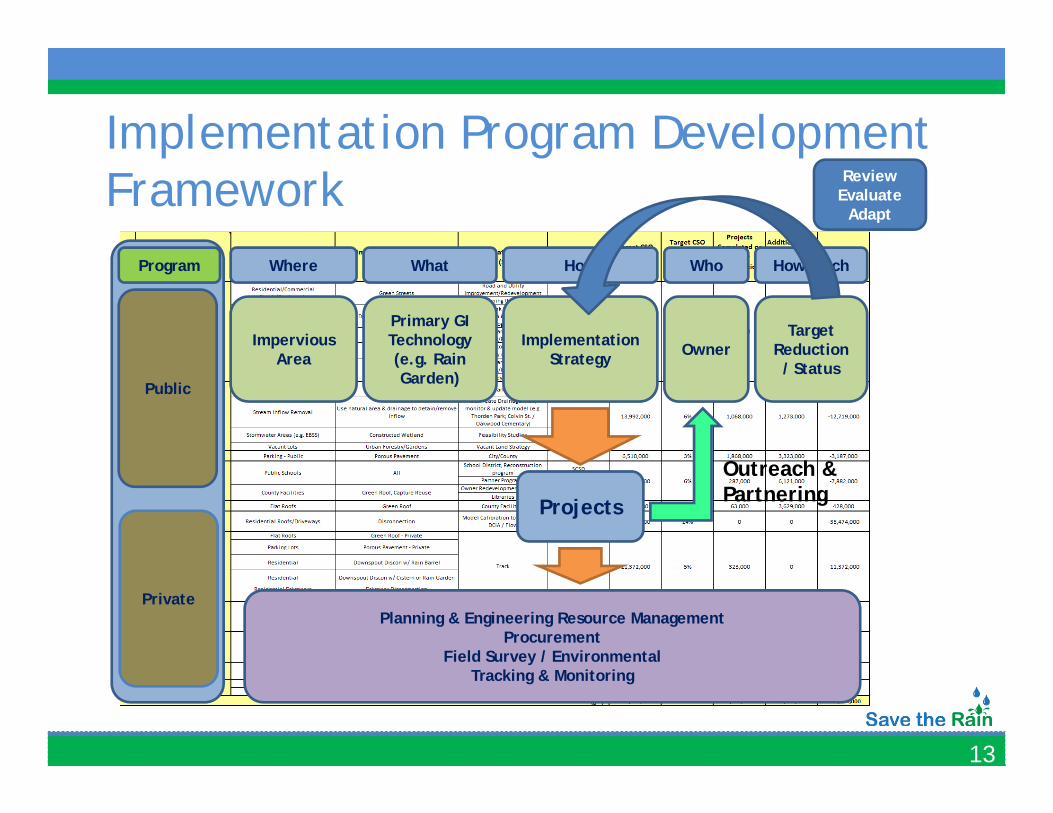
Implementation Program Development p g pFramework Review
Evaluate Adapt
Program Where
Impervious A
What
Primary GI Technology( g R i
Implementation St t g
How Who
Owner
How Much
Target Reduction
Public
Area (e.g. Rain Garden)
Strategy / Status
Outreach & PartneringProjects
PrivatePlanning & Engineering Resource Management
ProcurementField Survey / Environmental
13
yTracking & Monitoring
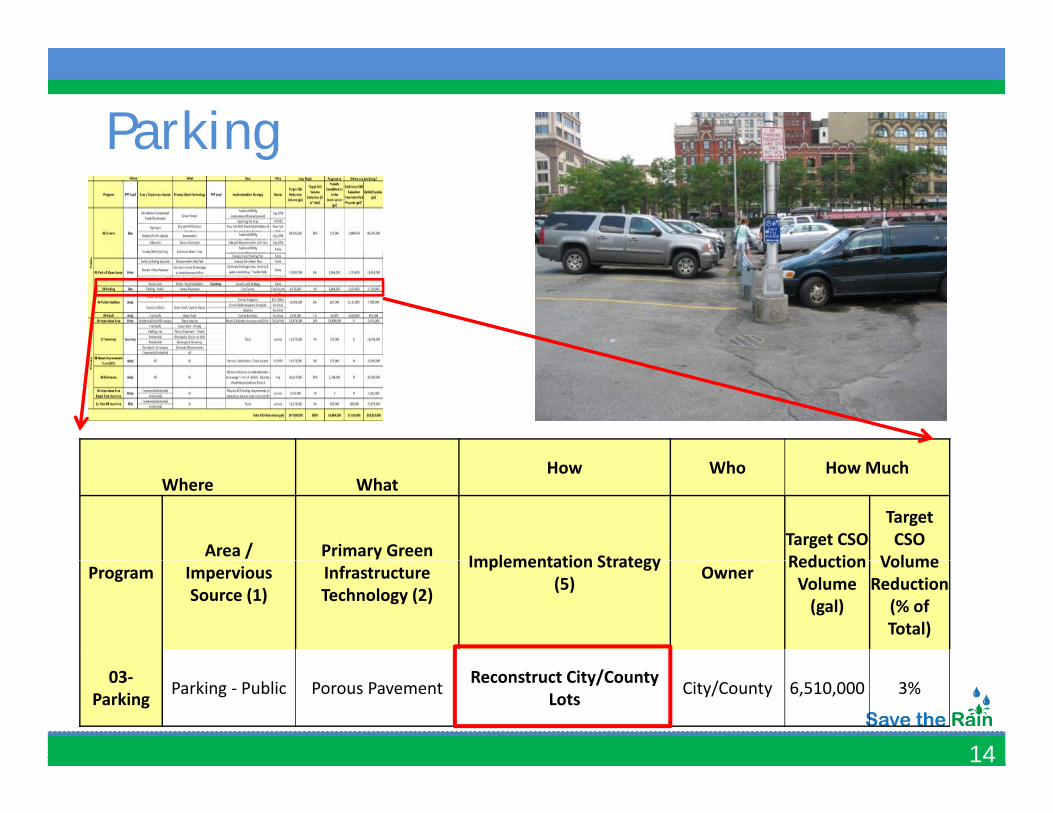
Parkingg
Where WhatHow Who How Much
Area / Primary Green Implementation StrategyTarget CSO Reduction
Target CSO
VolumeProgram Impervious Source (1)
Infrastructure Technology (2)
Implementation Strategy (5) Owner Reduction
Volume (gal)
Volume Reduction
(% of Total)
14
03‐Parking Parking ‐ Public Porous Pavement Reconstruct City/County
Lots City/County 6,510,000 3%
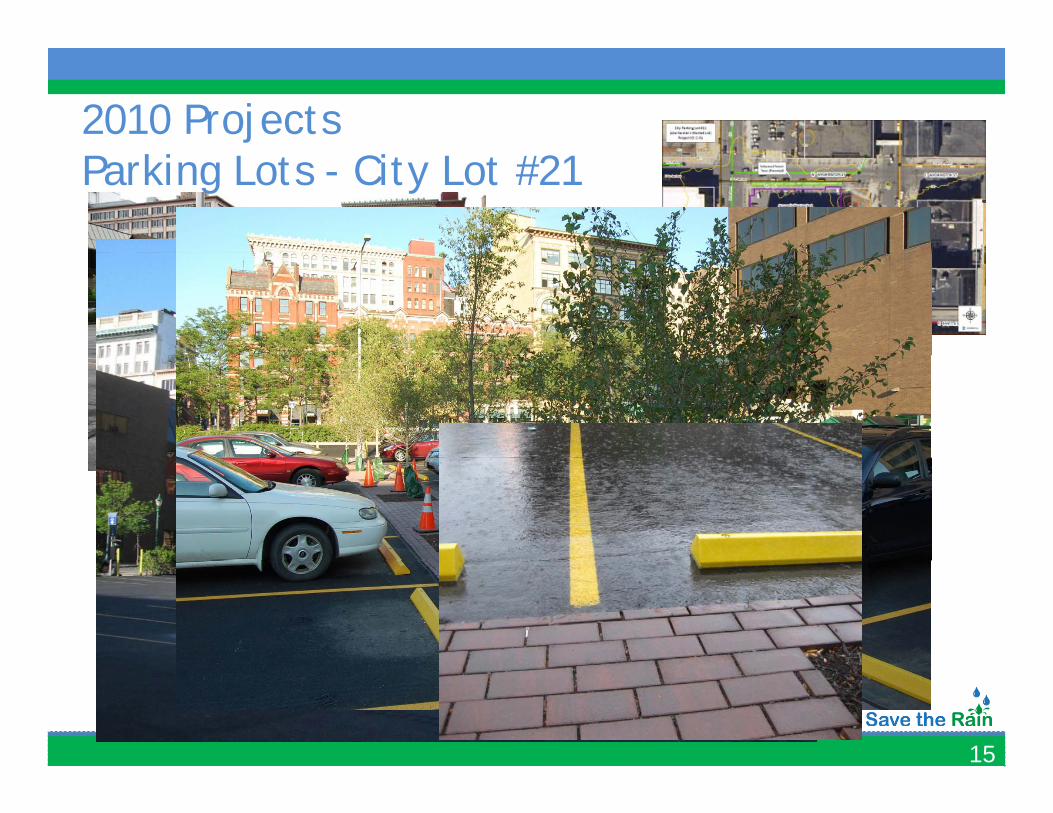
2010 ProjectsParking Lots - City Lot #21
15
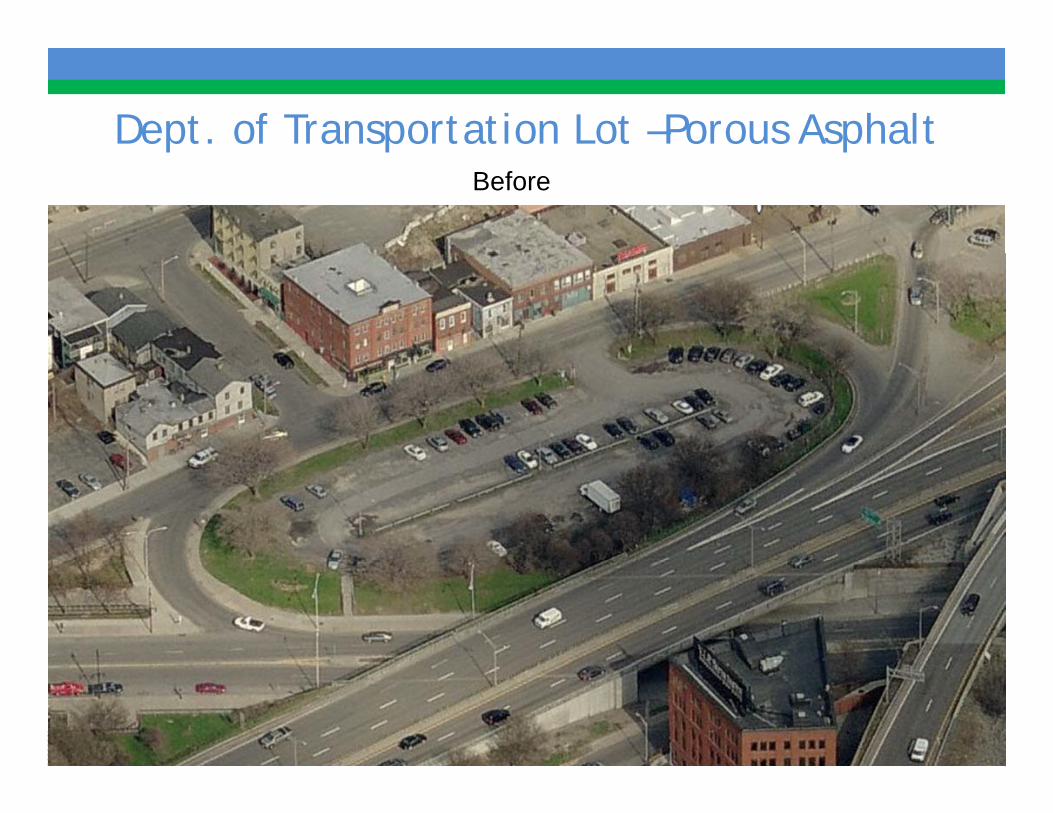
Dept. of Transportation Lot –Porous Asphaltp p pBefore
16
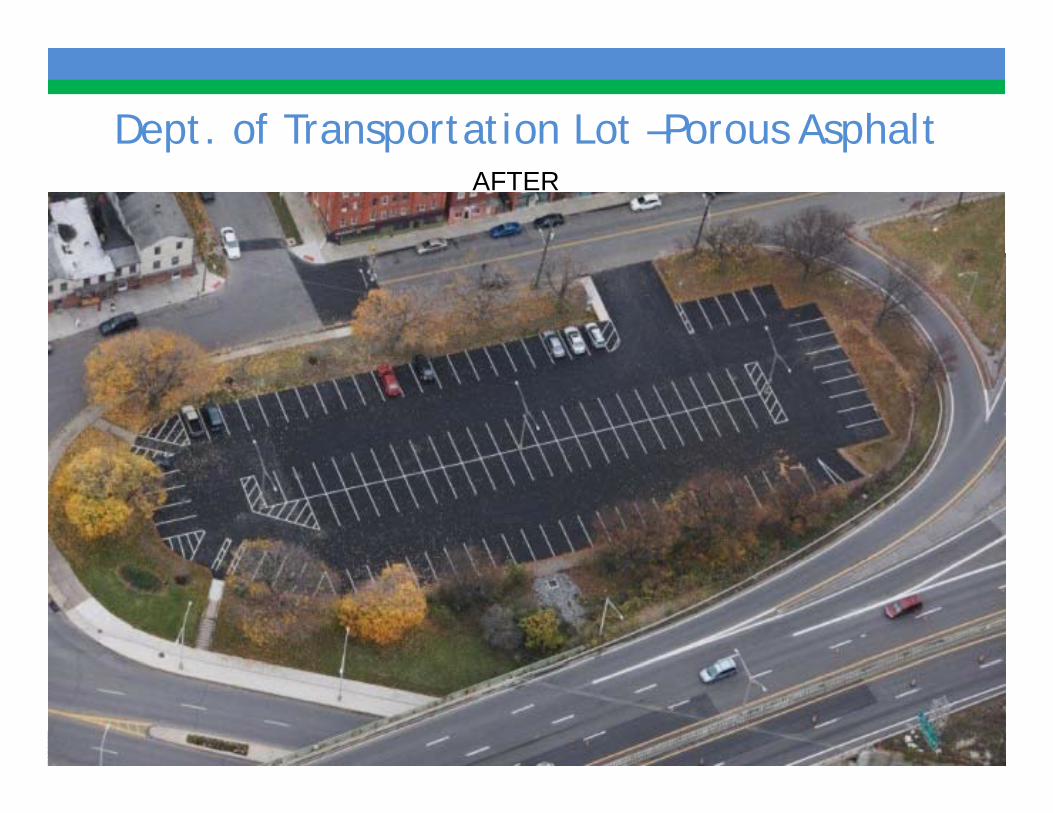
Dept. of Transportation Lot –Porous Asphaltp p pAFTER
17
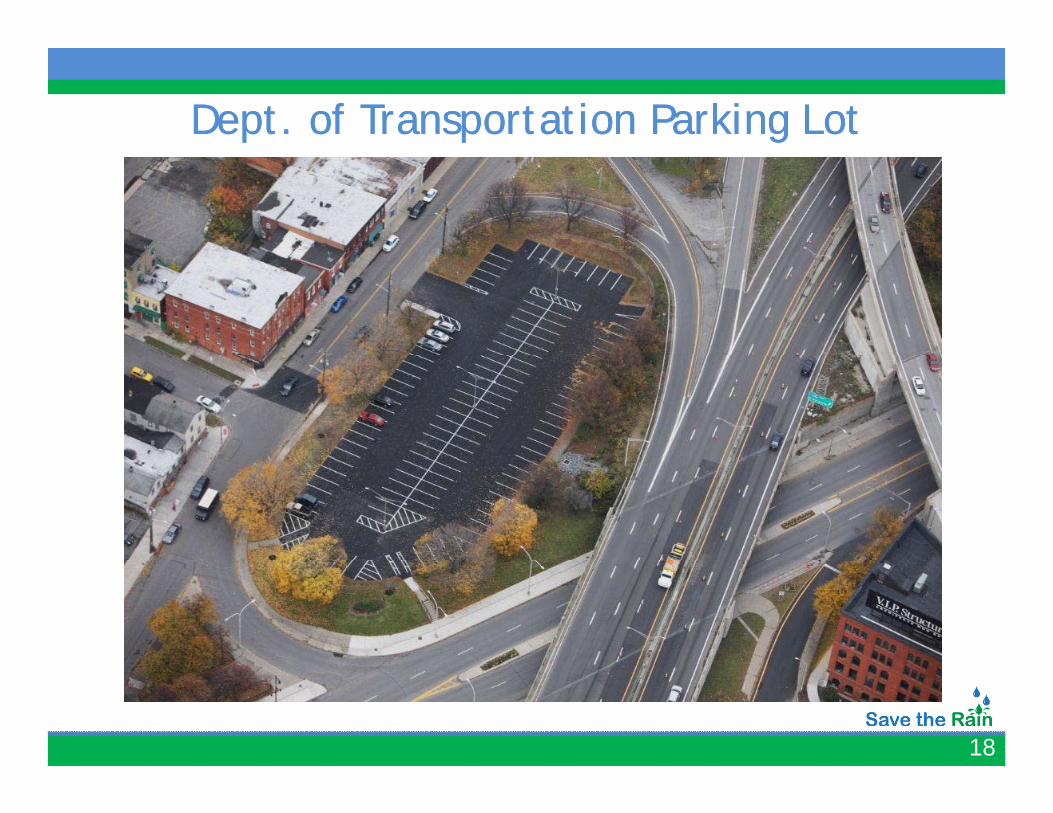
Dept. of Transportation Parking LotDept. of Transportation Parking Lot
18
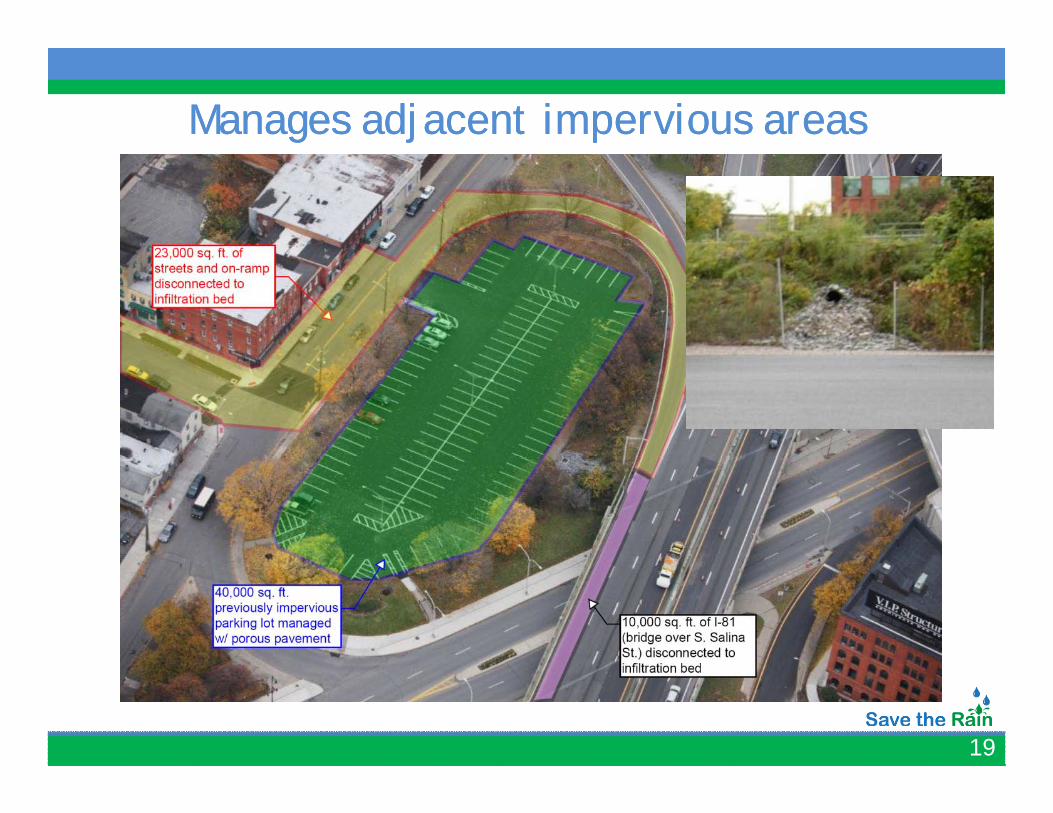
Manages adjacent impervious areasManages adjacent impervious areas
19
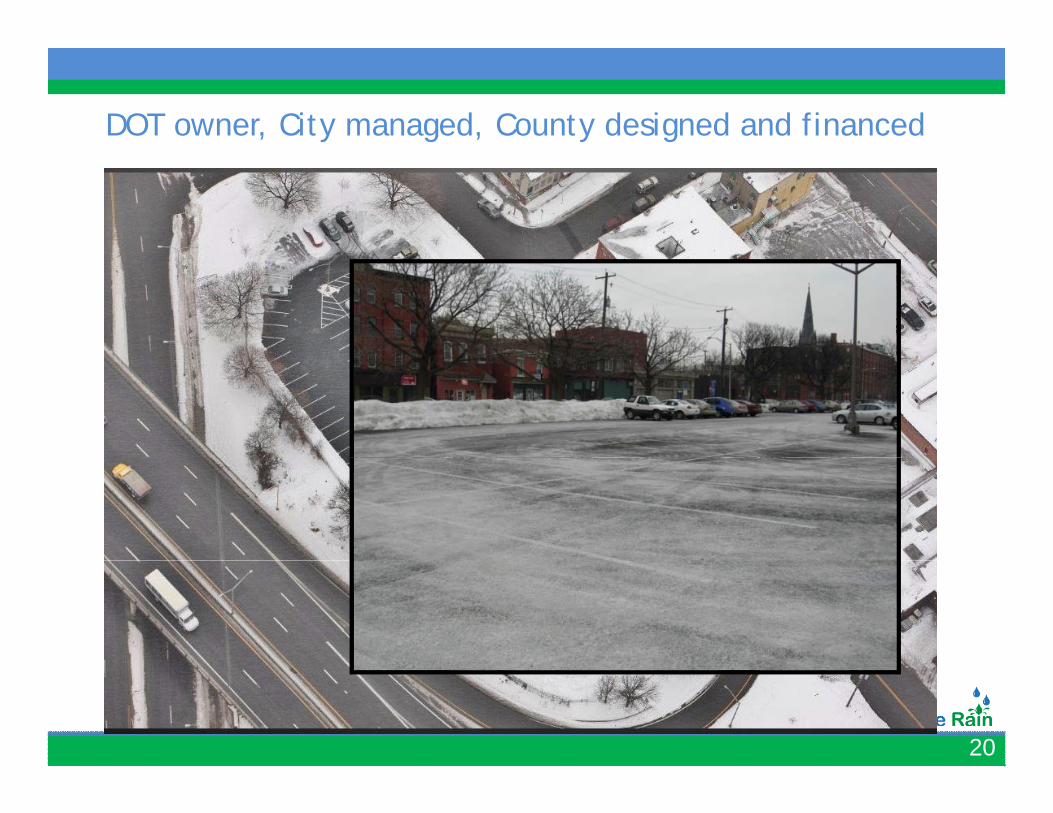
DOT owner, City managed, County designed and financed
20
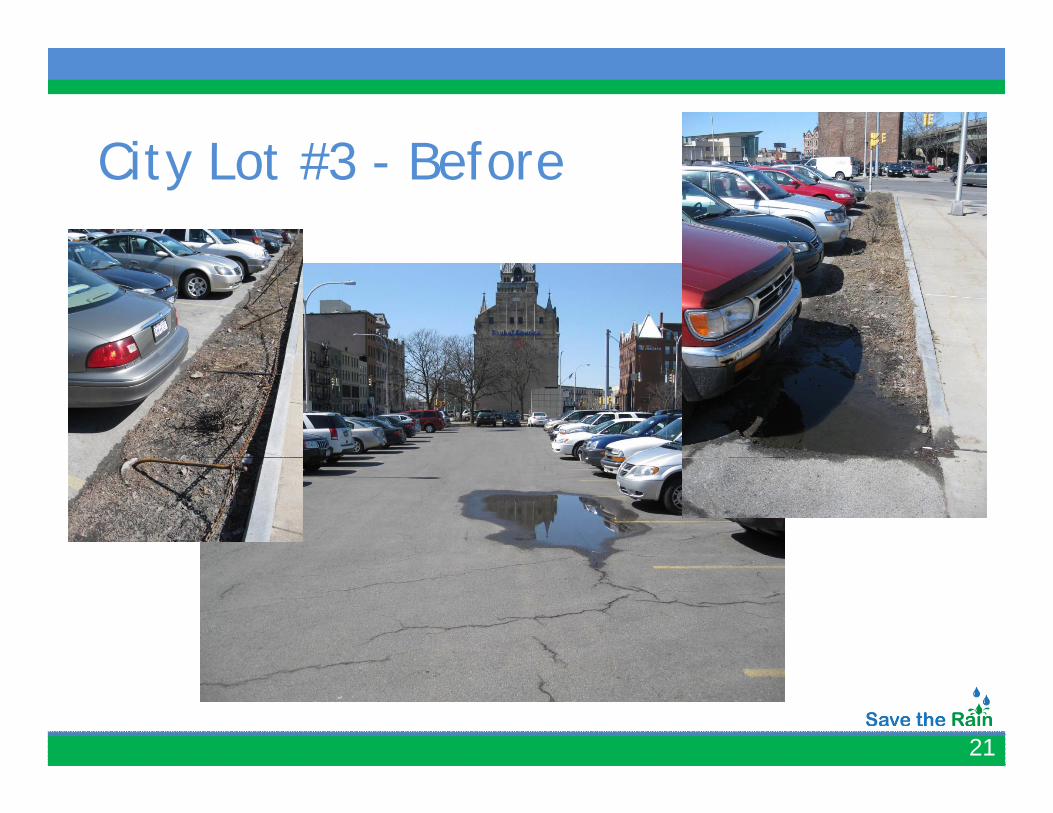
Cit L t #3 B fCity Lot #3 - Before
21
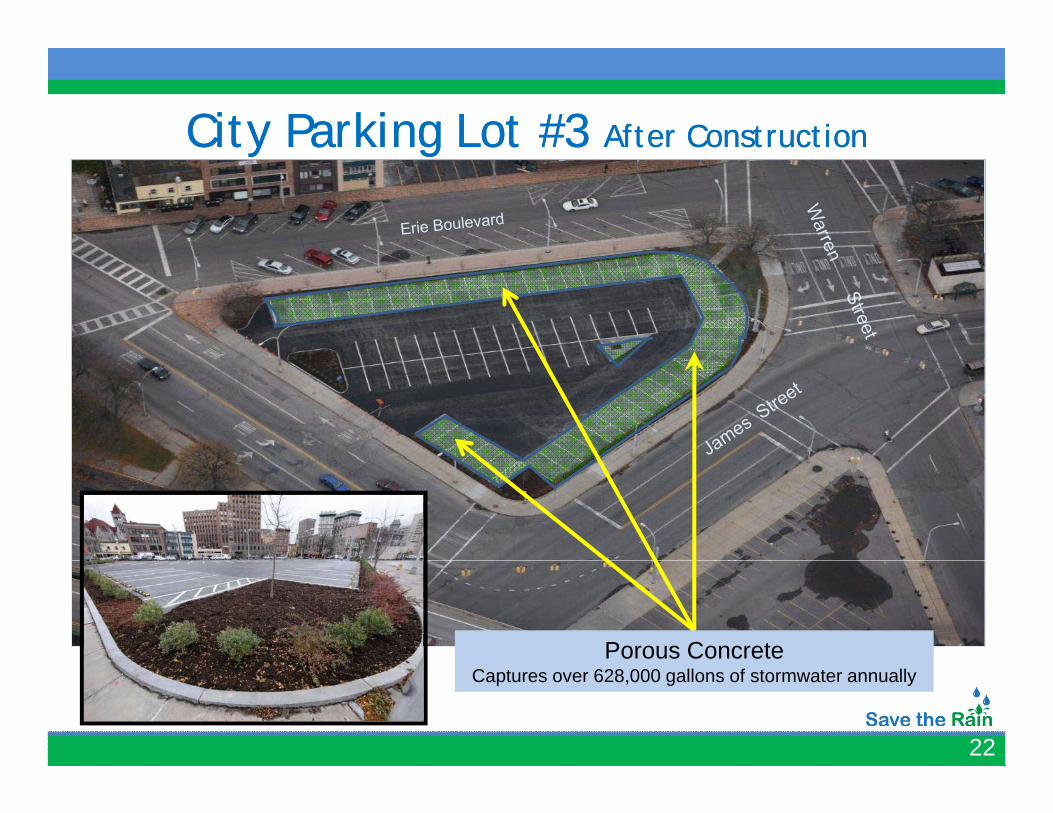
City Parking Lot #3 City Parking Lot #3 After ConstructionAfter Constructiony gy g
Porous Concrete
22
Captures over 628,000 gallons of stormwater annually
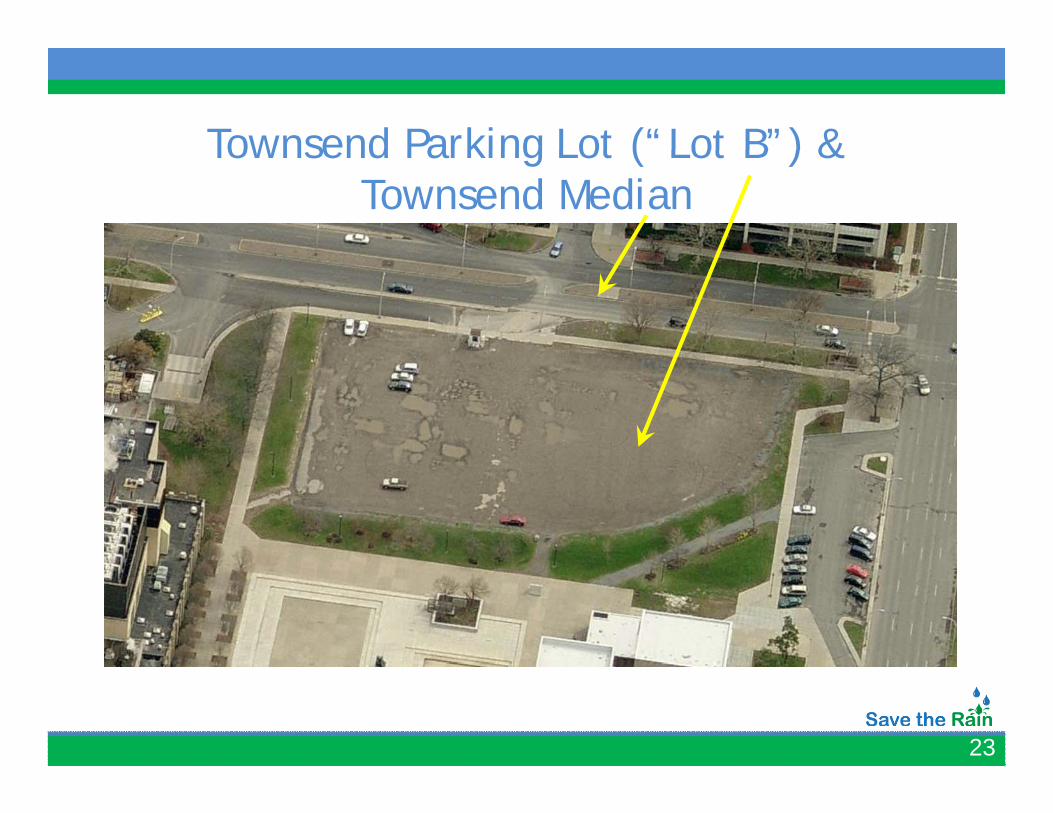
Townsend Parking Lot (“Lot B”) & Townsend Parking Lot ( Lot B ) & Townsend Median
23
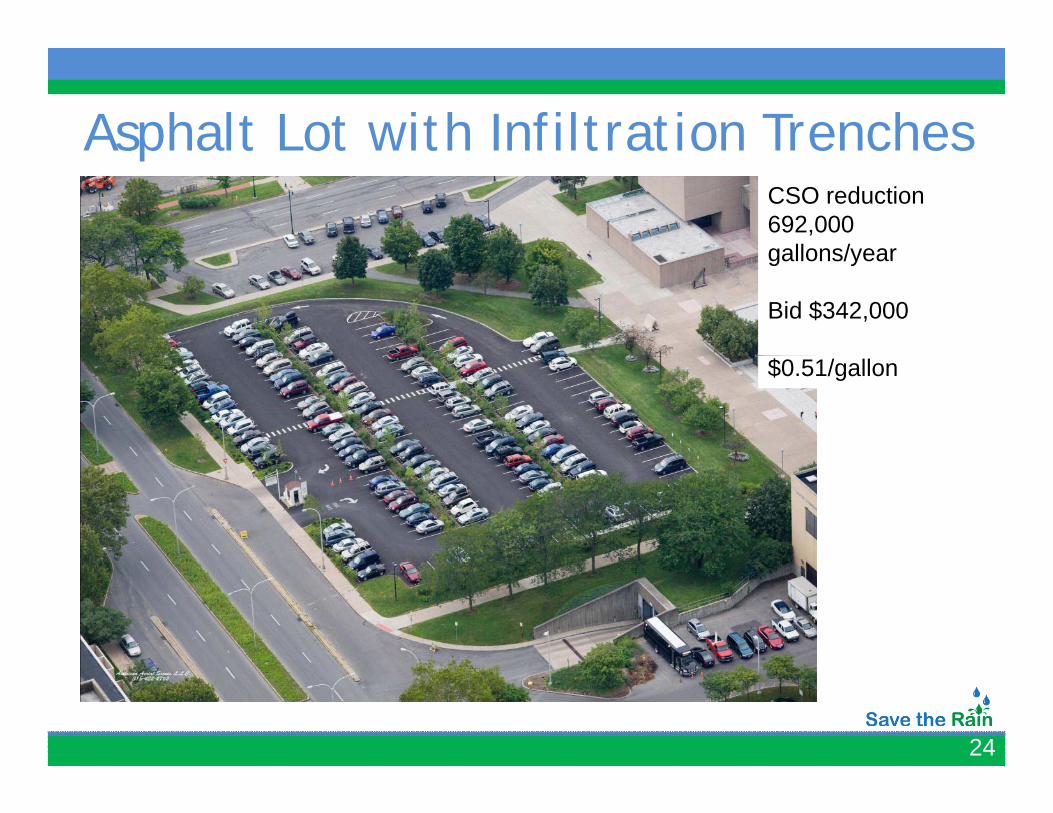
Asphalt Lot with Infiltration Trenches Asphalt Lot with Infiltration Trenches CSO reduction 692,000 gallons/yeargallons/year
Bid $342,000
$0.51/gallon
24
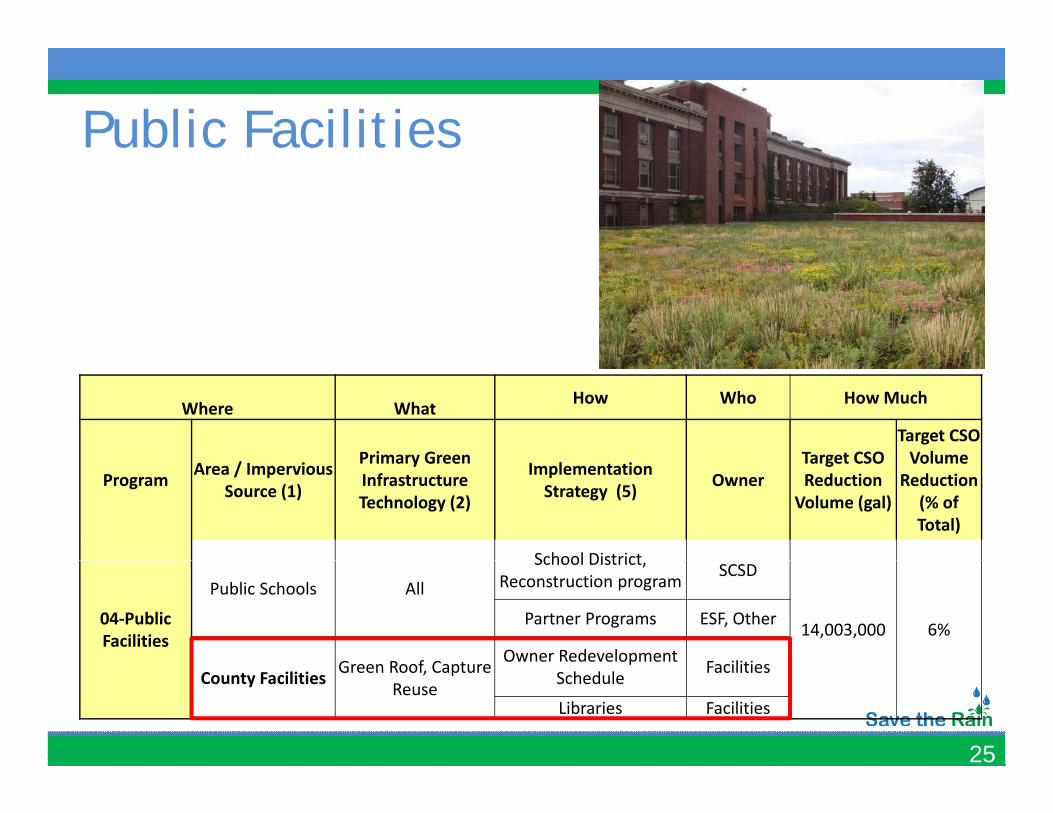
Public Facilities
Where What How Who How Much
Primary Green Target CSOTarget CSO Volume
Program Area / Impervious Source (1)
Primary Green Infrastructure Technology (2)
Implementation Strategy (5) Owner
Target CSO Reduction Volume (gal)
Volume Reduction
(% of Total)
School District
04‐Public Facilities
Public Schools All
School District, Reconstruction program SCSD
14,003,000 6%Partner Programs ESF, Other
G R f C t Owner Redevelopment F iliti
25
County Facilities Green Roof, Capture Reuse
pSchedule Facilities
Libraries Facilities
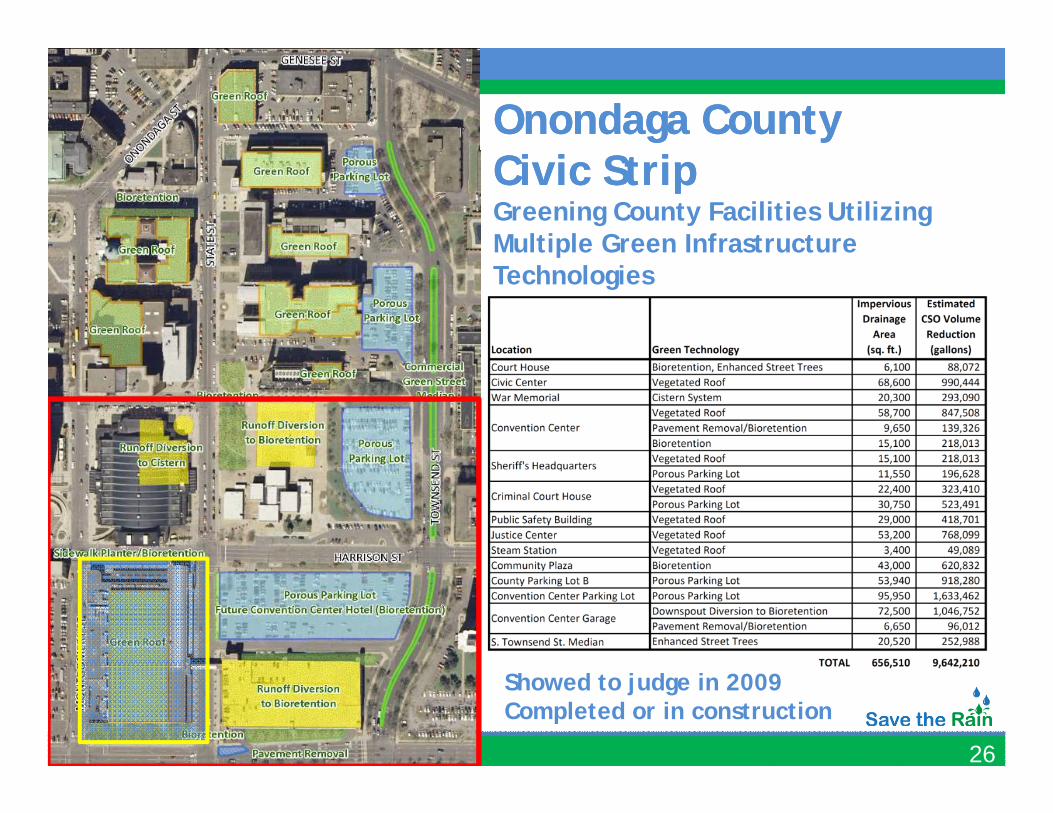
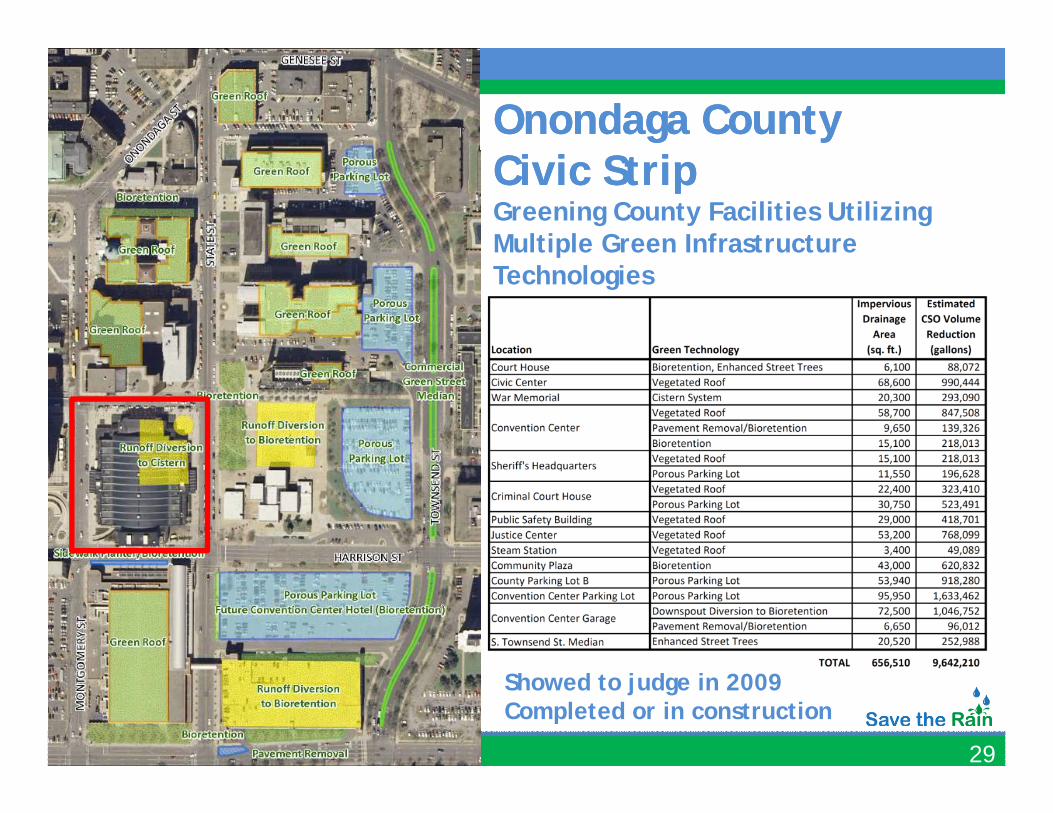
Onondaga CountyOnondaga CountyCivic StripCivic StripGreening County Facilities Utilizing Multiple Green Infrastructure pTechnologies
26
Showed to judge in 2009Completed or in construction
Green Infrastructure 2011Green Infrastructure 2011
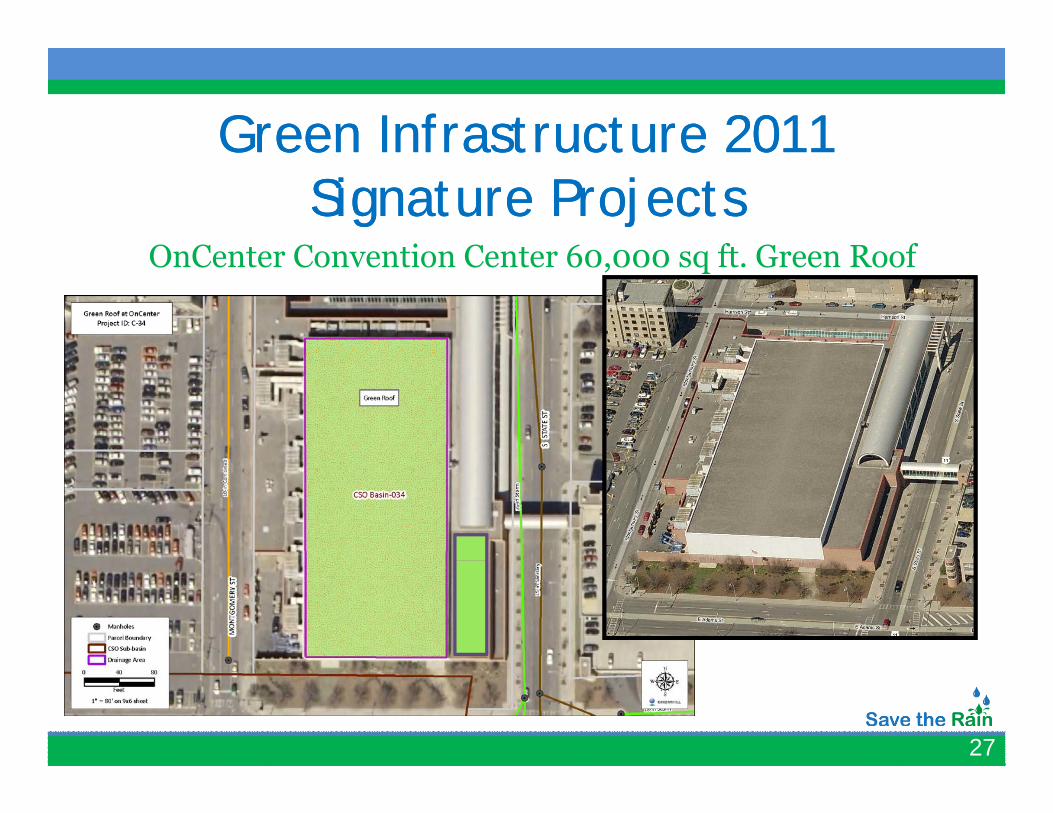
OnCenter Convention Center 60 000 sq ft Green Roof
Green Infrastructure 2011Signature Projects
Green Infrastructure 2011Signature Projects
OnCenter Convention Center 60,000 sq ft. Green Roof
27
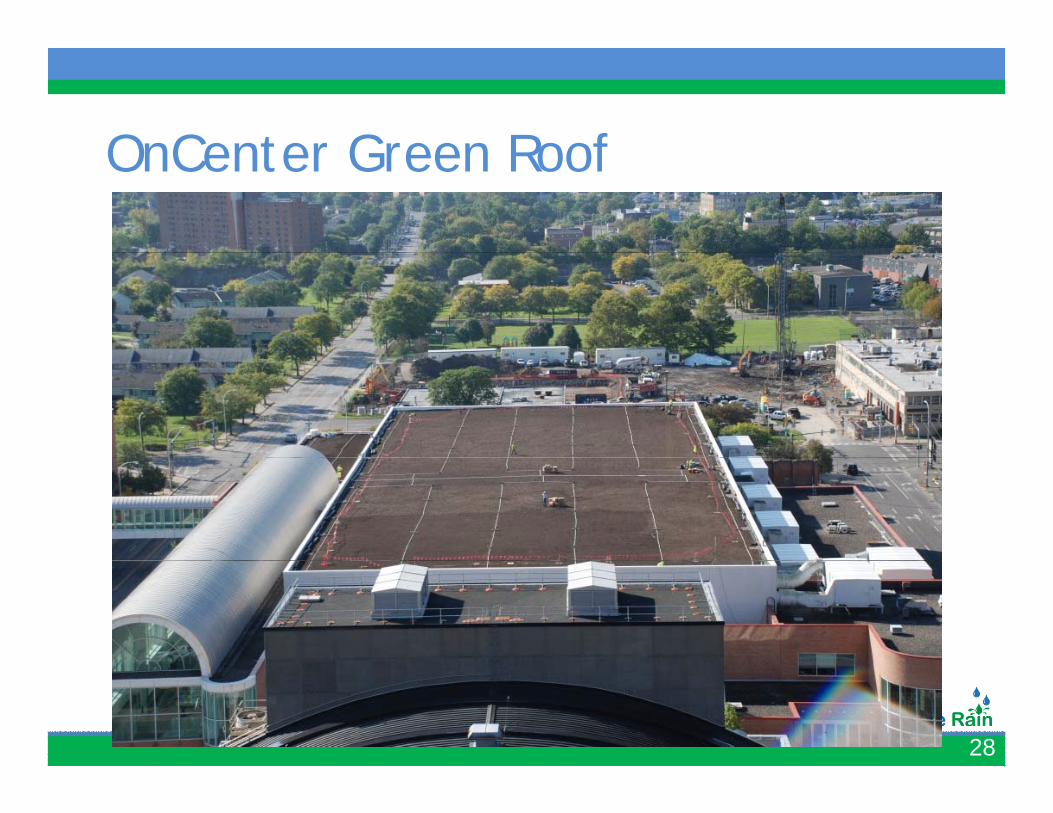
OnCenter Green RoofOnCenter Green Roof
28
Onondaga CountyOnondaga CountyCivic StripCivic StripGreening County Facilities Utilizing Multiple Green Infrastructure pTechnologies
29
Showed to judge in 2009Completed or in construction
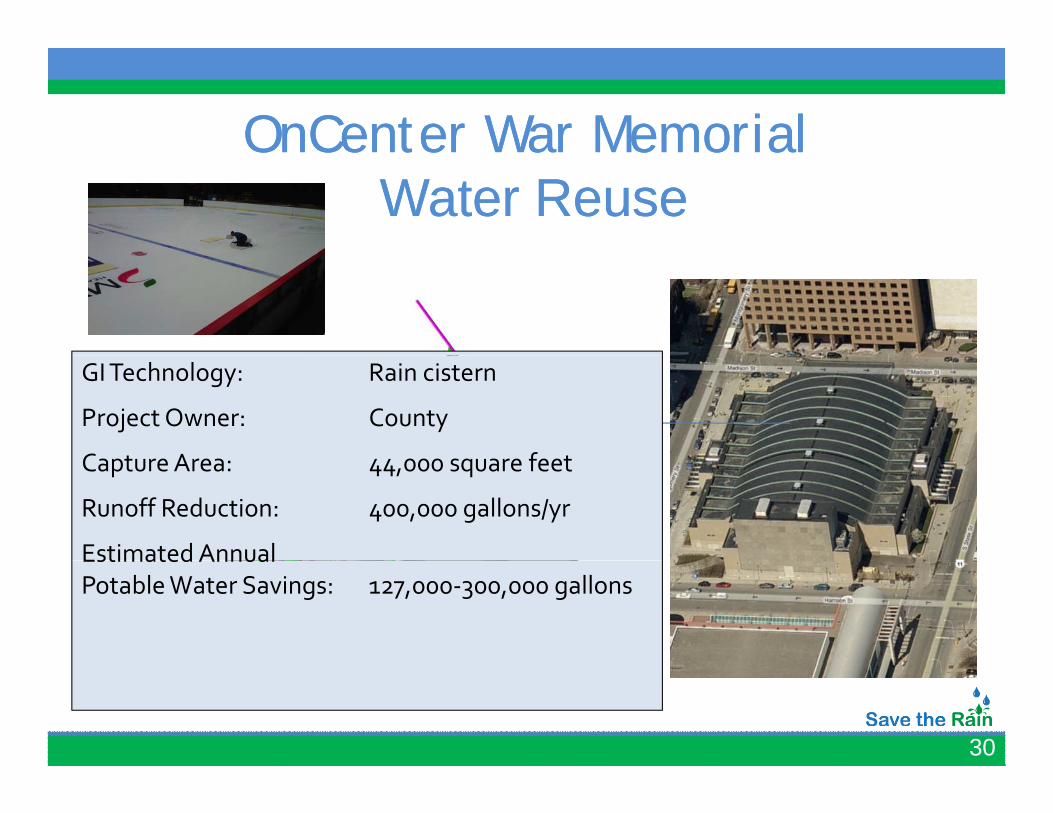
OnCenter War MemorialOnCenter War MemorialOnCenter War MemorialWater Reuse
OnCenter War MemorialWater Reuse
GI Technology: Rain cistern
Project Owner: County
C t A f tCapture Area: 44,000 square feet
Runoff Reduction: 400,000 gallons/yr
Estimated Annual Estimated Annual Potable Water Savings: 127,000‐300,000 gallons
30
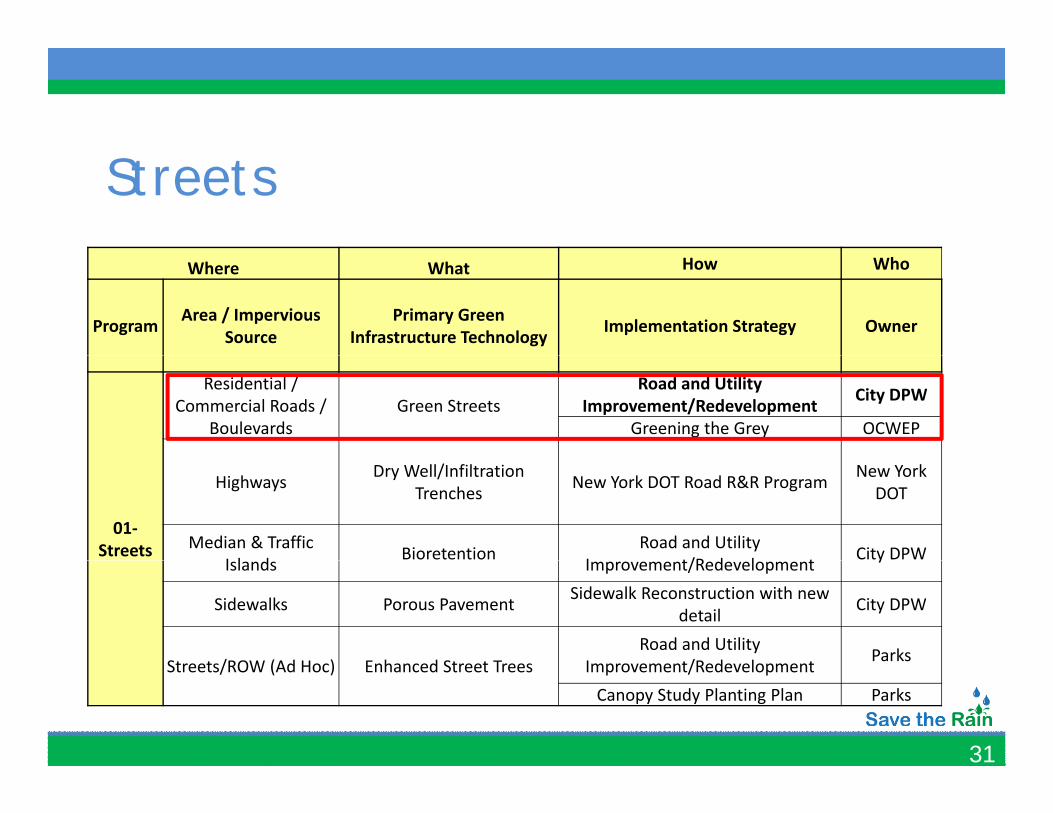
StreetsWhere What How Who
Program Area / Impervious Source
Primary Green Infrastructure Technology Implementation Strategy Owner
Residential / Commercial Roads /
BoulevardsGreen Streets
Road and Utility Improvement/Redevelopment City DPW
Greening the Grey OCWEP
01‐Streets
Highways Dry Well/Infiltration Trenches New York DOT Road R&R Program New York
DOT
Median & Traffic I l d Bioretention Road and Utility
I t/R d l t City DPWIslands Improvement/Redevelopment y
Sidewalks Porous Pavement Sidewalk Reconstruction with new detail City DPW
St t /ROW (Ad H ) E h d St t TRoad and Utility
I t/R d l t Parks
31
Streets/ROW (Ad Hoc) Enhanced Street Trees Improvement/RedevelopmentCanopy Study Planting Plan Parks
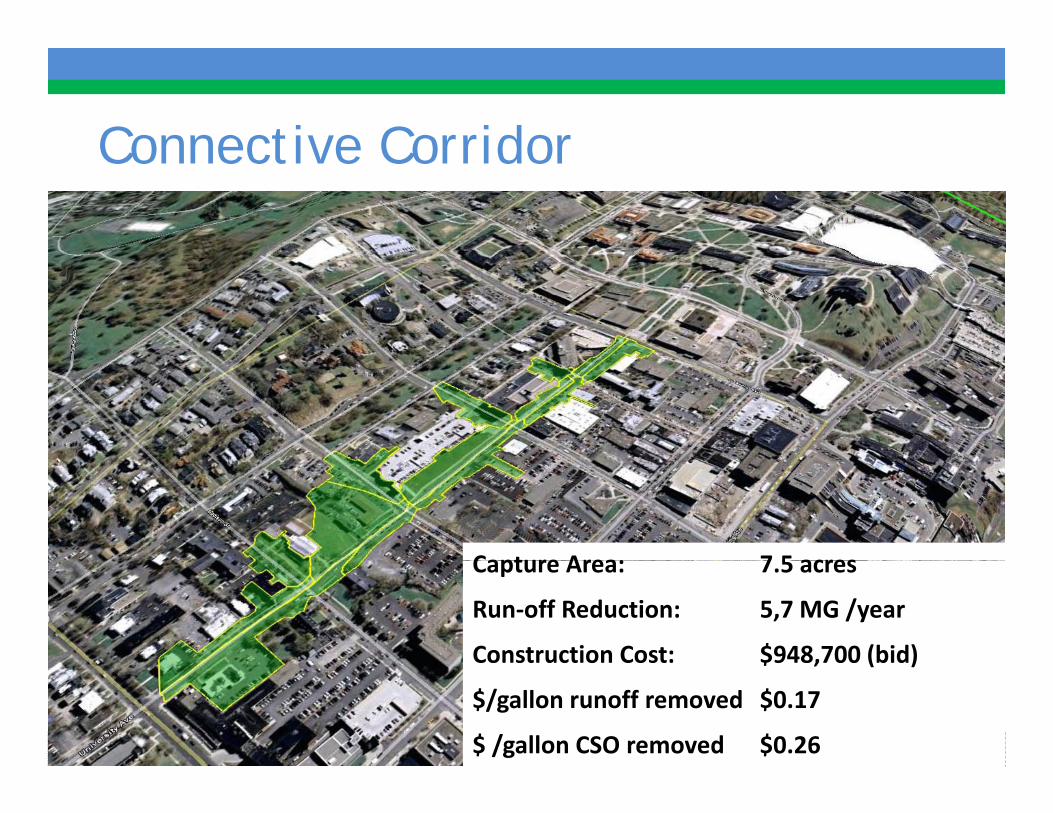
Connective CorridorConnective Corridor
Capture Area: 7 5 acresCapture Area: 7.5 acres
Run‐off Reduction: 5,7 MG /year
Construction Cost: $948,700 (bid)
32
$ , ( )
$/gallon runoff removed $0.17
$ /gallon CSO removed $0.26
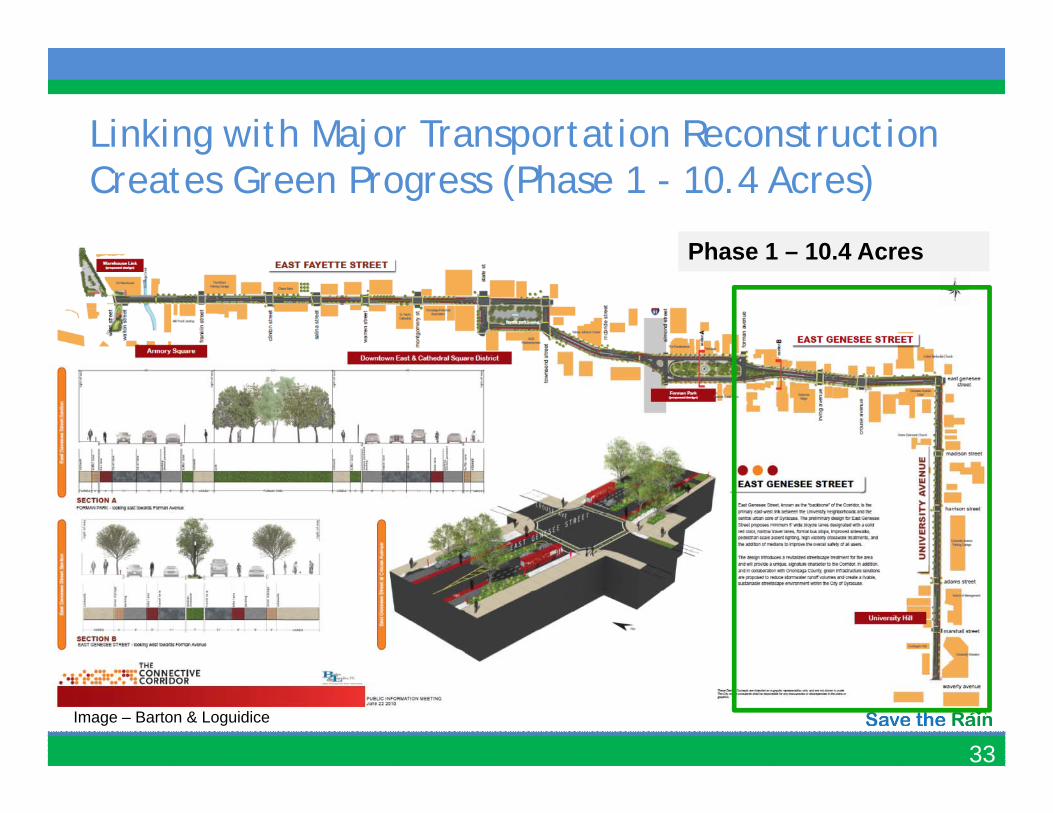
Linking with Major Transportation Reconstruction g j pCreates Green Progress (Phase 1 - 10.4 Acres)
Phase 1 – 10 4 AcresPhase 1 – 10.4 Acres
33Image – Barton & Loguidice
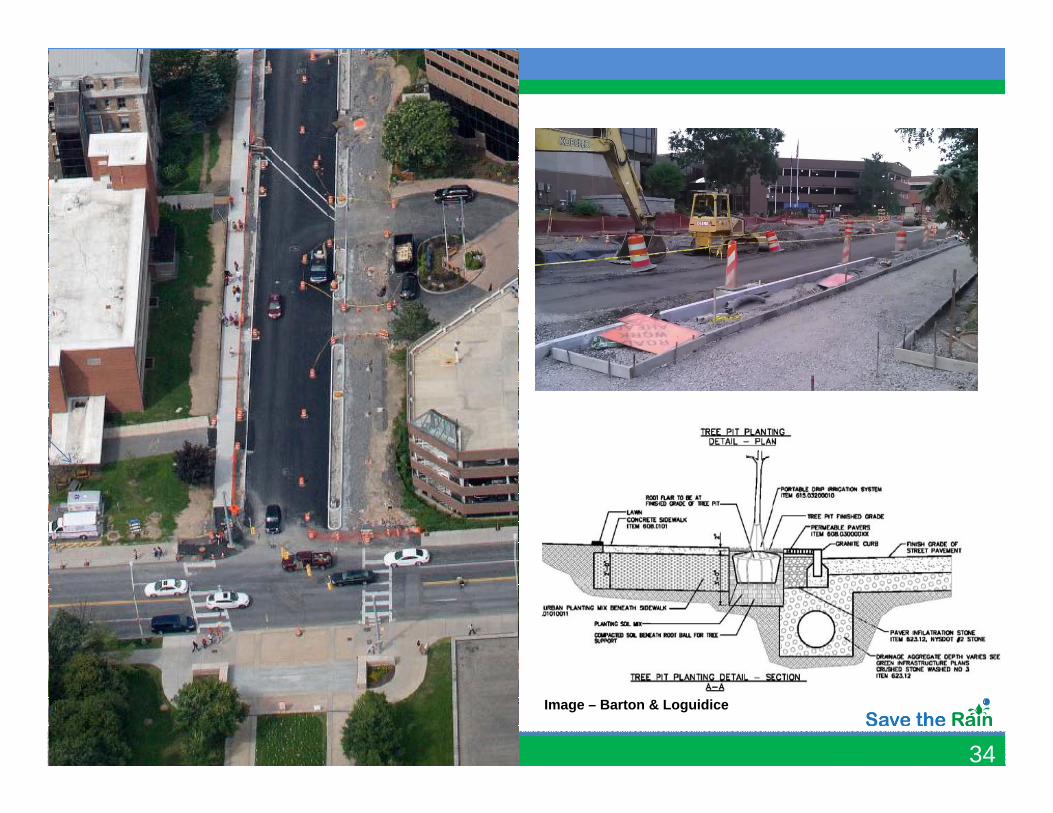
Connective Corridor
34
Image – Barton & Loguidice
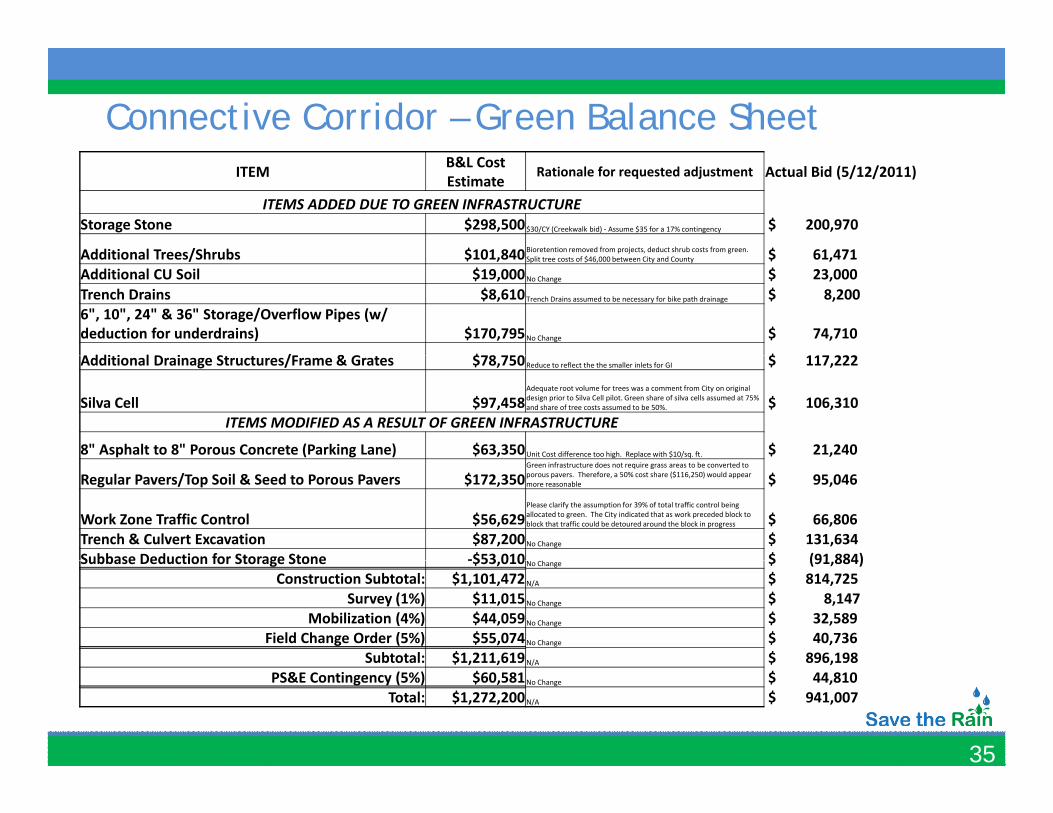
Connective Corridor – Green Balance SheetITEM B&L Cost
EstimateRationale for requested adjustment Actual Bid (5/12/2011)
ITEMS ADDED DUE TO GREEN INFRASTRUCTUREStorage Stone $298,500 $30/CY (Creekwalk bid) ‐ Assume $35 for a 17% contingency $ 200,970
Additional Trees/Shrubs $101 840Bioretention removed from projects, deduct shrub costs from green. $ 61 471Additional Trees/Shrubs $101,840 p j , gSplit tree costs of $46,000 between City and County $ 61,471
Additional CU Soil $19,000 No Change $ 23,000 Trench Drains $8,610 Trench Drains assumed to be necessary for bike path drainage $ 8,200 6", 10", 24" & 36" Storage/Overflow Pipes (w/ deduction for underdrains) $170,795 No Change $ 74,710
Addi i l D i S /F & G $78 750 $ 117 222Additional Drainage Structures/Frame & Grates $78,750 Reduce to reflect the the smaller inlets for GI $ 117,222
Silva Cell $97,458 Adequate root volume for trees was a comment from City on original design prior to Silva Cell pilot. Green share of silva cells assumed at 75% and share of tree costs assumed to be 50%. $ 106,310
ITEMS MODIFIED AS A RESULT OF GREEN INFRASTRUCTURE
8" Asphalt to 8" Porous Concrete (Parking Lane) $63,350 Unit Cost difference too high. Replace with $10/sq. ft. $ 21,240 g p q
Regular Pavers/Top Soil & Seed to Porous Pavers $172,350 Green infrastructure does not require grass areas to be converted to porous pavers. Therefore, a 50% cost share ($116,250) would appear more reasonable $ 95,046
Work Zone Traffic Control $56,629 Please clarify the assumption for 39% of total traffic control being allocated to green. The City indicated that as work preceded block to block that traffic could be detoured around the block in progress $ 66,806
Trench & Culvert Excavation $87,200 No Change $ 131,634 Subbase Deduction for Storage Stone ‐$53 010 $ (91 884)Subbase Deduction for Storage Stone ‐$53,010No Change $ (91,884)
Construction Subtotal: $1,101,472 N/A $ 814,725 Survey (1%) $11,015 No Change $ 8,147
Mobilization (4%) $44,059 No Change $ 32,589 Field Change Order (5%) $55,074 No Change $ 40,736
Subtotal: $1,211,619 N/A $ 896,198
35
$ , , N/A $ ,PS&E Contingency (5%) $60,581 No Change $ 44,810
Total: $1,272,200 N/A $ 941,007
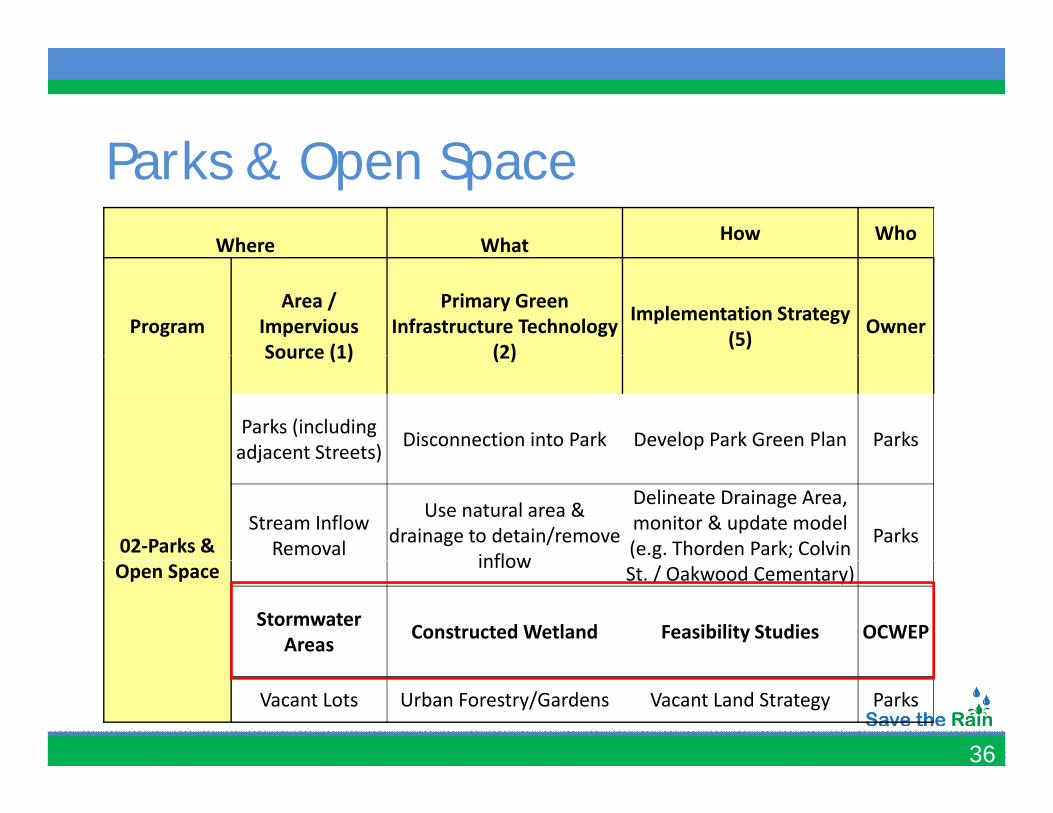
P k & O SParks & Open SpaceWhere What How Who
ProgramArea /
Impervious Source (1)
Primary Green Infrastructure Technology
(2)
Implementation Strategy (5) Owner
Source (1) (2)
Parks (including adjacent Streets) Disconnection into Park Develop Park Green Plan Parks
02‐Parks &
adjacent Streets)
Stream Inflow Removal
Use natural area & drainage to detain/remove
inflow
Delineate Drainage Area, monitor & update model (e.g. Thorden Park; Colvin Parks
Open Space inflow St. / Oakwood Cementary)
Stormwater Areas Constructed Wetland Feasibility Studies OCWEP
36
Vacant Lots Urban Forestry/Gardens Vacant Land Strategy Parks
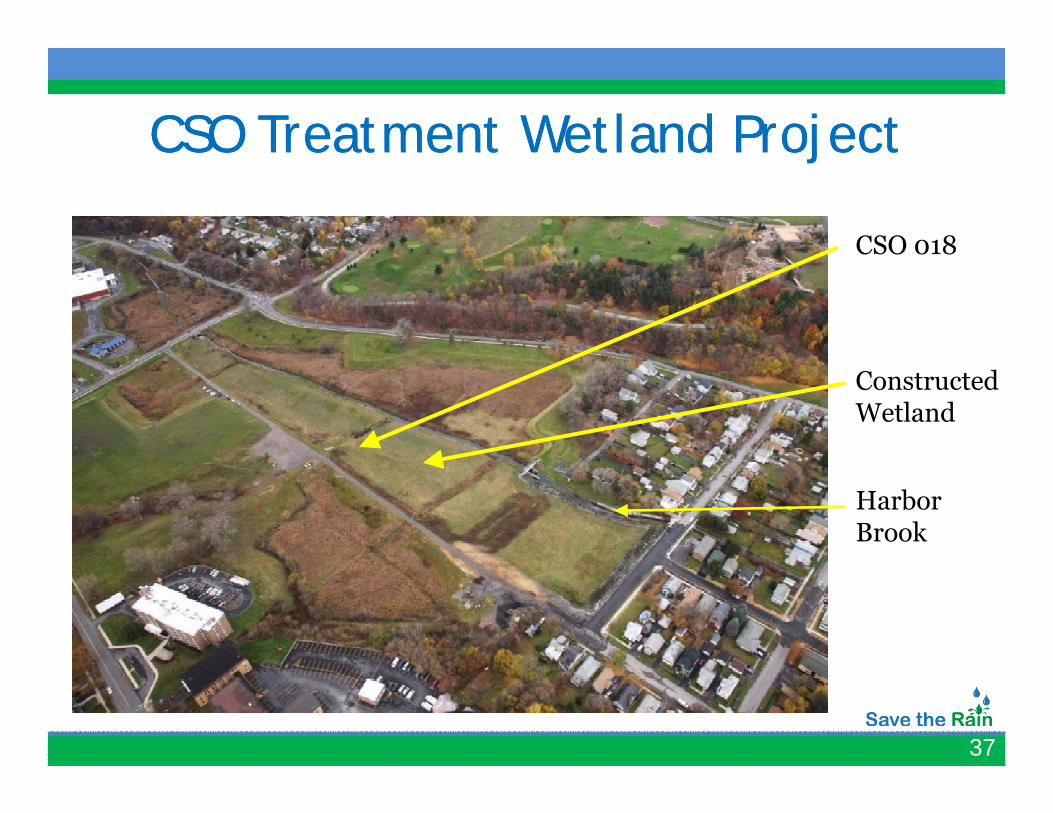
CSO Treatment Wetland ProjectCSO Treatment Wetland Project
CSO 018
CSO Treatment Wetland ProjectCSO Treatment Wetland Project
CSO 018
Constructed Wetland
HarborBrook
37
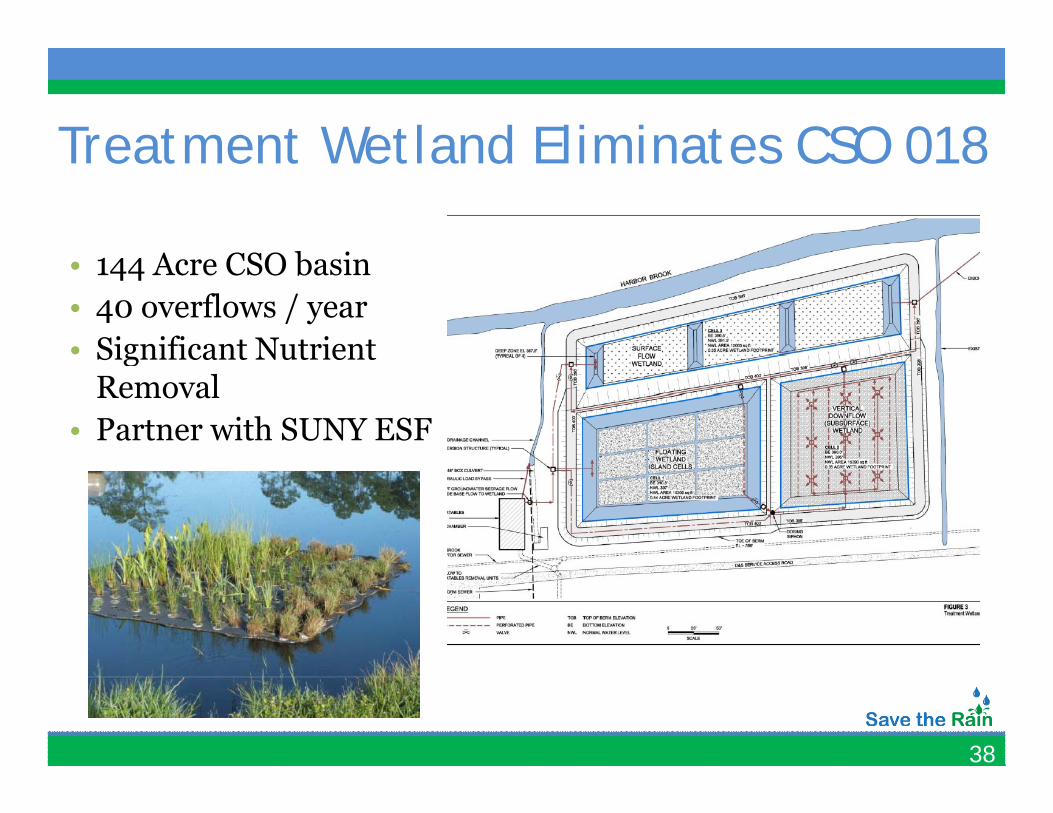
Treatment Wetland Eliminates CSO 018Treatment Wetland Eliminates CSO 018
A CSO b i• 144 Acre CSO basin• 40 overflows / year• Significant Nutrient Significant Nutrient
Removal• Partner with SUNY ESF
38
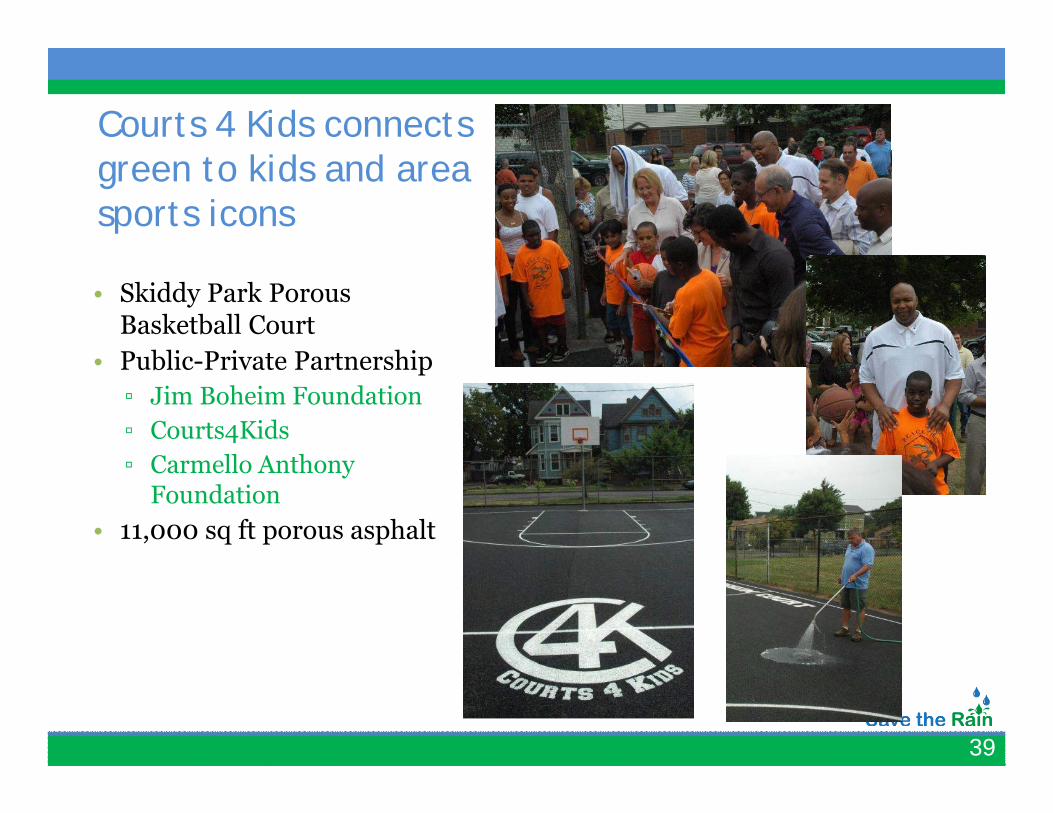
Courts 4 Kids connects green to kids and area sports icons
• Skiddy Park Porous Basketball CourtP bli P i t P t hi• Public-Private Partnership▫ Jim Boheim Foundation▫ Courts4Kids
C ll A th ▫ Carmello Anthony Foundation
• 11,000 sq ft porous asphalt
39
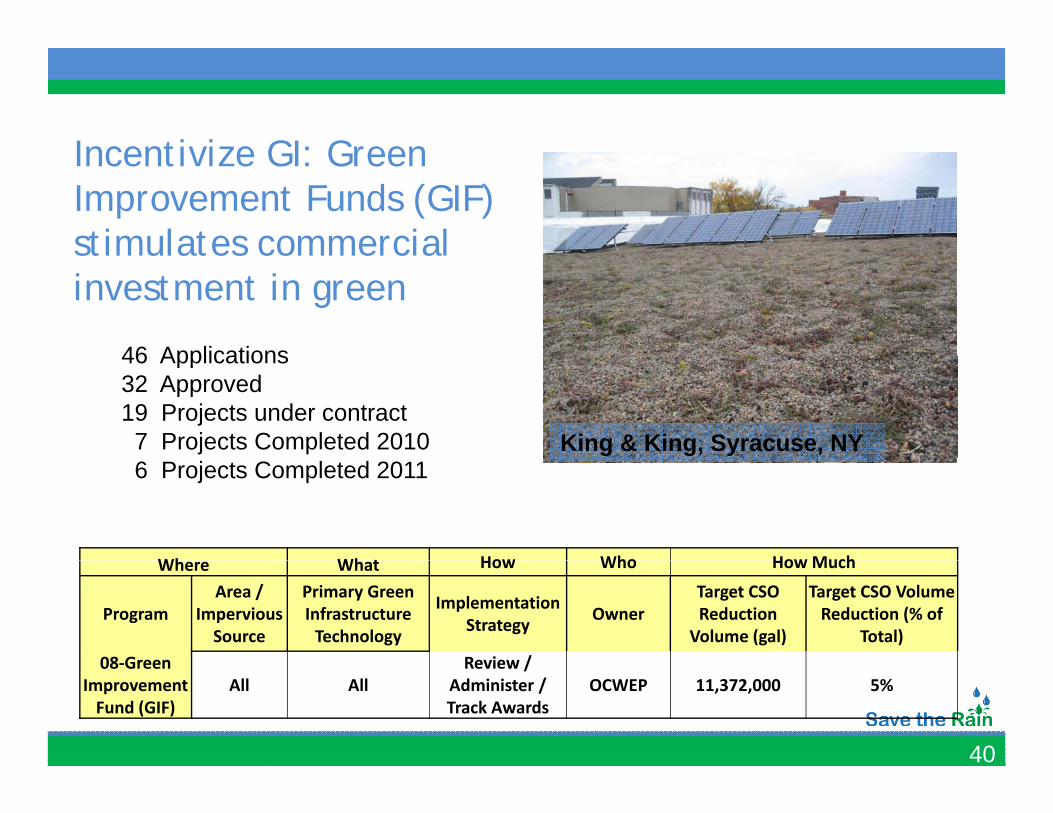
Incentivize GI: Green Incentivize GI: Green Improvement Funds (GIF) stimulates commercial stimulates commercial investment in green
46 Applications
King & King, Syracuse, NY
46 Applications32 Approved19 Projects under contract7 Projects Completed 2010
Wh Wh t How Who HowMuch
6 Projects Completed 2011
Where What How Who How Much
ProgramArea /
Impervious Source
Primary Green Infrastructure Technology
Implementation Strategy Owner
Target CSO Reduction Volume (gal)
Target CSO Volume Reduction (% of
Total)08 Green Review /
40
08‐Green Improvement Fund (GIF)
All AllReview /
Administer / Track Awards
OCWEP 11,372,000 5%
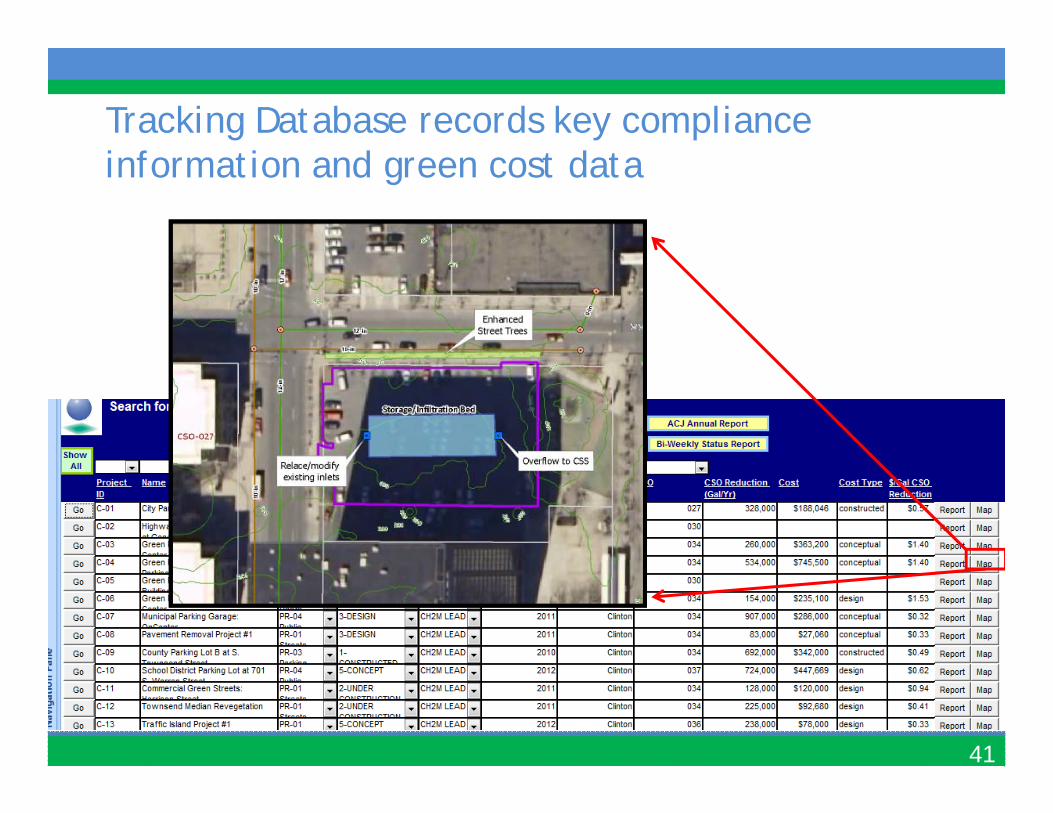
Tracking Database records key compliance f d dinformation and green cost data
41
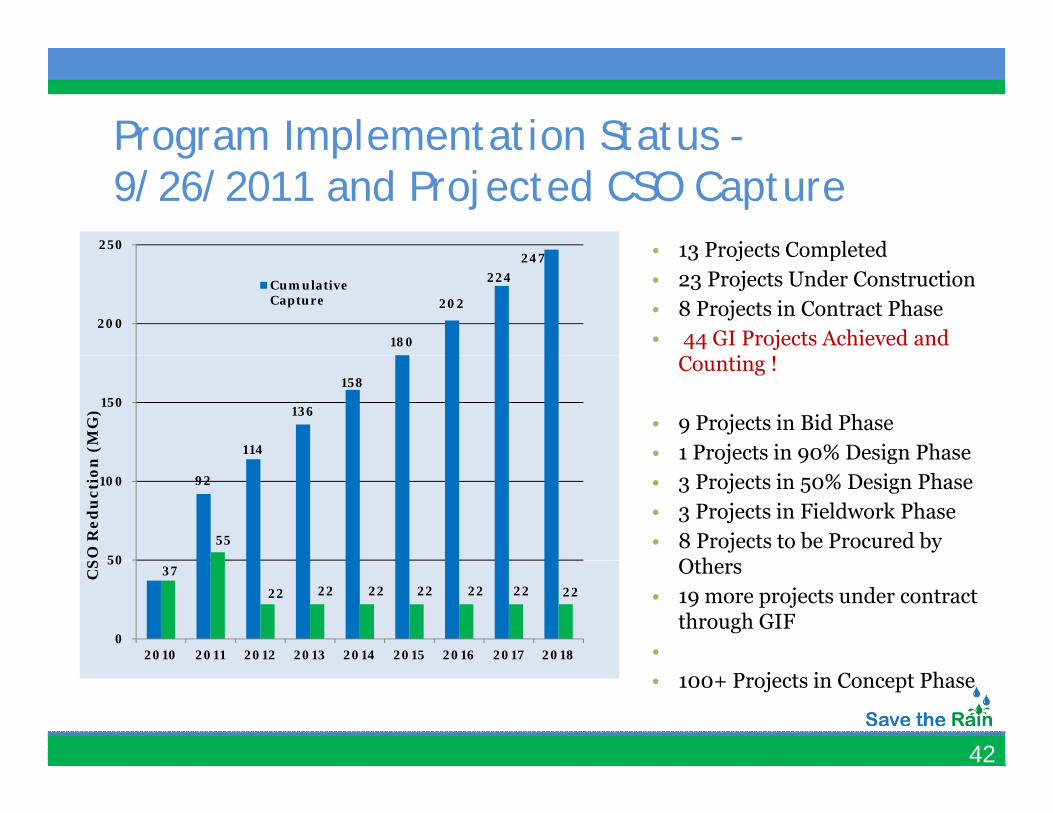
Program Implementation Status -g p9/26/2011 and Projected CSO Capture
• 13 Projects Completed250 • 13 Projects Completed• 23 Projects Under Construction• 8 Projects in Contract Phase• 44 GI Projects Achieved and
i180
202
224247
200
Cumulative Capture
Counting !
• 9 Projects in Bid Phase• 1 Projects in 90% Design Phase114
136
158150
n (
MG
)
1 Projects in 90% Design Phase• 3 Projects in 50% Design Phase• 3 Projects in Fieldwork Phase• 8 Projects to be Procured by
Oth
92
5550
100
SO
Red
uct
ion
Others• 19 more projects under contract
through GIF•
37
22 22 22 22 22 22 22
0
50
2010 2011 2012 2013 2014 2015 2016 2017 2018
CS
42
• 100+ Projects in Concept Phase
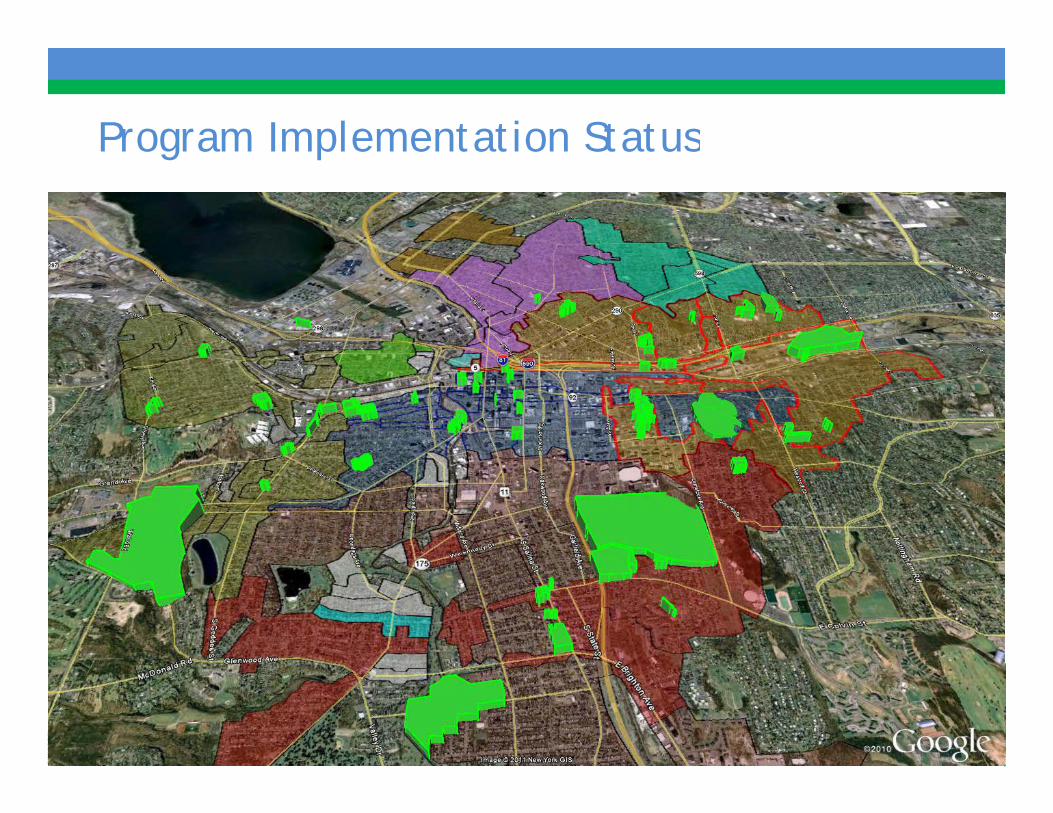
Program Implementation StatusProgram Implementation Status
43

Thank You!Questions ?
Please Visit us atwww.SaveTheRain.us