maricopa unified school district no. 20images.pcmac.org/uploads/maricopausd/maricopausd/sites... ·...
TRANSCRIPT

MARICOPA UNIFIED
SCHOOL DISTRICT NO. 20
Comprehensive Annual Financial Report
Fiscal Year Ended June 30, 2015
44150 West Maricopa-Casa Grande Highway ▪ Maricopa, Arizona 85138
MARICOPA UNIFIED SCHOOL DISTRICT NO. 20
MARICOPA, ARIZONA
COMPREHENSIVE ANNUAL FINANCIAL REPORT FOR THE FISCAL YEAR ENDED JUNE 30, 2015
Issued by: Business and Finance Department
MARICOPA UNIFIED SCHOOL DISTRICT NO. 20
TABLE OF CONTENTS
INTRODUCTORY SECTION Page
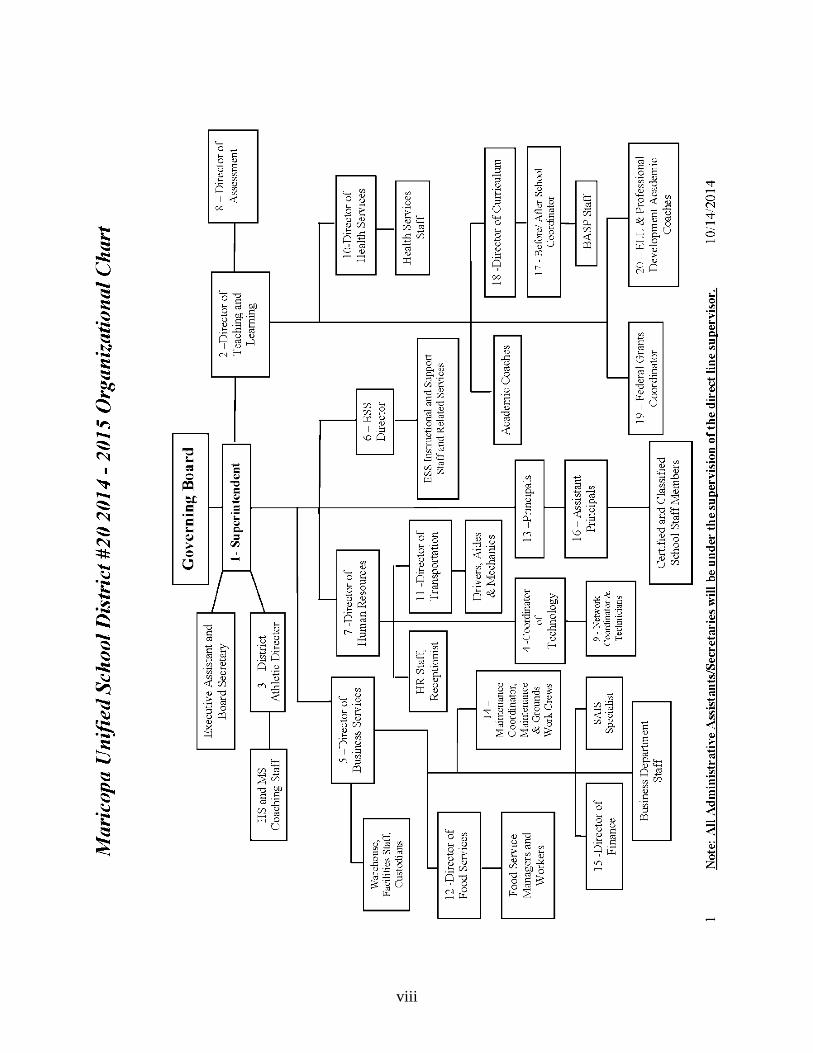
Letter of Transmittal i ASBO Certificate of Excellence vi GFOA Certificate of Achievement vii Organizational Chart viii List of Principal Officials ix FINANCIAL SECTION
INDEPENDENT AUDITOR’S REPORT 1
MANAGEMENT’S DISCUSSION AND ANALYSIS (MD&A) 5
BASIC FINANCIAL STATEMENTS
Government-Wide Financial Statements: Statement of Net Position 18 Statement of Activities 19
Fund Financial Statements: Balance Sheet – Governmental Funds 22 Reconciliation of the Balance Sheet –
Governmental Funds to the Statement of Net Position 25 Statement of Revenues, Expenditures and Changes in Fund Balances –
Governmental Funds 26 Reconciliation of the Statement of Revenues, Expenditures and
Changes in Fund Balances – Governmental Funds to the Statement of Activities 28
Statement of Assets and Liabilities – Fiduciary Funds 29
Notes to Financial Statements 30

MARICOPA UNIFIED SCHOOL DISTRICT NO. 20
TABLE OF CONTENTS
FINANCIAL SECTION Page
REQUIRED SUPPLEMENTARY INFORMATION Schedule of Revenues Expenditures and Changes in Fund Balances –
Budget and Actual: General Fund 52
Schedule of Proportionate Share of the Net Pension Liability 53
Schedule of Contributions 53 Notes to Required Supplementary Information 54
COMBINING AND INDIVIDUAL FUND FINANCIAL STATEMENTS AND
SCHEDULES Governmental Funds:
Combining Balance Sheet – All Non-Major Governmental Funds – By Fund Type 58
Combining Statement of Revenues, Expenditures and Changes in
Fund Balances – All Non-Major Governmental Funds – By Fund Type 60
Special Revenue Funds: Combining Balance Sheet 64 Combining Statement of Revenues, Expenditures and
Changes in Fund Balances 70 Combining Schedule of Revenues, Expenditures and
Changes in Fund Balances – Budget and Actual 76
Debt Service Fund:
Schedule of Revenues, Expenditures and Changes in Fund Balance – Budget and Actual 102
MARICOPA UNIFIED SCHOOL DISTRICT NO. 20
TABLE OF CONTENTS
FINANCIAL SECTION Page
Capital Projects Funds: Combining Balance Sheet 104 Combining Statement of Revenues, Expenditures and Changes in
Fund Balances 106 Combining Schedule of Revenues, Expenditures and Changes in
Fund Balances – Budget and Actual 108
Agency Funds: Combining Statement of Assets and Liabilities 114 Combining Statement of Changes in Assets and Liabilities 115
STATISTICAL SECTION Financial Trends:
Net Position by Component 118 Expenses, Program Revenues, and Net (Expense)/Revenue 119 General Revenues and Total Changes in Net Position 121 Fund Balances – Governmental Funds 123 Governmental Funds Revenues 125
Governmental Funds Expenditures and Debt Service Ratio 127 Other Financing Sources and Uses and Net Changes in Fund Balances – Governmental Funds 129
MARICOPA UNIFIED SCHOOL DISTRICT NO. 20
TABLE OF CONTENTS
STATISTICAL SECTION Page
Revenue Capacity:
Primary Assessed Value and Estimated Actual Value of Taxable Property by Class 130 Secondary Assessed Value of Taxable Property by Class 131 Property Tax Assessment Ratios 132 Direct and Overlapping Property Tax Rates 133 Principal Property Taxpayers 134 Property Tax Levies and Collections 135
Debt Capacity:
Outstanding Debt by Type 136 Direct and Overlapping Governmental Activities Debt 137 Direct and Overlapping General Bonded Debt Ratios 137 Legal Debt Margin Information 138
Demographic and Economic Information:
County-Wide Demographic and Economic Statistics 139 Principal Employers 140
Operating Information: Full-Time Equivalent District Employees by Type 141 Operating Statistics 143 Capital Assets Information 144

(This page intentionally left blank)
INTRODUCTORY SECTION

(This page intentionally left blank)
i
December 16, 2015 Citizens and Governing Board Maricopa Unified School District No. 20 44150 West Maricopa – Casa Grande Highway Maricopa, Arizona 85138 State law mandates that school districts required to undergo an annual single audit publish a complete set of financial statements presented in conformity with accounting principles generally accepted in the United States of America and audited in accordance with auditing standards generally accepted in the United States by a certified public accounting firm licensed in the State of Arizona. Pursuant to that requirement, we hereby issue the comprehensive annual financial report of the Maricopa Unified School District No. 20 (District) for the fiscal year ended June 30, 2015. This report consists of management’s representations concerning the finances of the District. Consequently, management assumes full responsibility for the completeness and reliability of all of the information presented in this report. To provide a reasonable basis for making these representations, management of the District has established a comprehensive internal control framework that is designed both to protect the District’s assets from loss, theft, or misuse and to compile sufficient reliable information for the preparation of the District’s financial statements in conformity with accounting principles generally accepted in the United States of America. Because the cost of internal controls should not outweigh their benefits, the District’s comprehensive framework of internal controls has been designed to provide reasonable rather than absolute assurance that the financial statements will be free of material misstatement. As management, we assert that, to the best of our knowledge and belief, this financial report is complete and reliable in all material respects. The District’s financial statements have been audited by Heinfeld, Meech & Co., P.C., a certified public accounting firm. The goal of the independent audit was to provide reasonable assurance that the financial statements of the District for the fiscal year ended June 30, 2015, are free of material misstatement. The independent audit involved examining, on a test basis, evidence supporting the amounts and disclosures in the financial statements; assessing the accounting principles used and significant estimates made by management; and evaluating the overall financial statement presentation. The independent auditors concluded, based upon the audit, that there was a reasonable basis for rendering an unmodified opinion that the District’s financial statements for the fiscal year ended June 30, 2015, are fairly presented in conformity with accounting principles generally accepted in the United States of America. The independent auditor’s report is presented as the first component of the financial section of this report.

ii
The independent audit of the financial statements of the District was part of a broader, federally mandated Single Audit as required by the provisions of the Single Audit Act Amendments of 1996 and U.S. Office of Management and Budget Circular A-133, Audits of States, Local Governments and Non-Profit Organizations designed to meet the special needs of federal grantor agencies. The standards governing Single Audit engagements require the independent auditor to report not only on the fair presentation of the financial statements, but also on the District’s internal controls and compliance with legal requirements, with special emphasis on internal controls and legal requirements involving the administration of federal awards. These reports are available in a separately issued Single Audit Reporting Package. Accounting principles generally accepted in the United States of America require that management provide a narrative introduction, overview, and analysis to accompany the basic financial statements in the form of Management’s Discussion and Analysis (MD&A). This letter of transmittal is designed to complement the MD&A and should be read in conjunction with it. The District’s MD&A can be found immediately following the report of the independent auditors. PROFILE OF THE DISTRICT The District is one of 19 public school districts located in Pinal County, Arizona. It provides a program of public education from preschool through grade 12, with a fiscal year 2014-15 average daily membership of 5,618. The District’s Governing Board is organized under Section 15-321 of the Arizona Revised Statutes (A.R.S.). Management of the District is independent of other state or local governments. The County Treasurer collects taxes for the District, but exercises no control over its expenditures/expenses. The membership of the Governing Board consists of five members elected by the public. Under existing statutes, the Governing Board’s duties and powers include, but are not limited to, the acquisition, maintenance and disposition of school property; the development and adoption of a school program; and the establishment, organization and operation of schools. The Board also has broad financial responsibilities, including the approval of the annual budget, and the establishment of a system of accounting and budgetary controls. The financial reporting entity consists of a primary government and its component units. A component unit is a legally separate entity that must be included in the reporting entity in conformity with generally accepted accounting principles. The District is a primary government because it is a special-purpose government that has a separately elected governing body, is legally separate, and is fiscally independent of other state or local governments. Furthermore, there are no component units combined with the District for financial statement presentation purposes, and the District is not included in any other governmental reporting entity. Consequently, the District’s financial statements include only the funds of those organizational entities for which its elected governing board is financially accountable. The District’s major operations include education, student transportation, construction and maintenance of District facilities, food services, bookstore, and athletic functions.

iii
The District encompasses an area of 157 square miles in the north central portion of Pinal County, Arizona. The District is bordered on the north and west sides by Maricopa County, and the east side by the Superstition Mountains. The economy of the Maricopa area has historically been based upon recreation, tourism and retirement activities. However, due to the community being in close proximity to other populated communities, such as Mesa, Tempe, Chandler, and Gilbert, Arizona, Maricopa is starting to experience more of a “bedroom community” growth pattern. The District population grows although the enrollment has stayed steady. The projected enrollment for the 2015-16 fiscal year is expected to be 6,200. The assessed valuation for the District decreased due to the recession, however, new construction continues with new housing developments and commercial construction. Over the last ten years, the District has built new or remodeled almost all campus facilities. The District used approximately $51,000,000 of the $57,000,000 bond authorization of 2006 to accomplish facility improvements. The District has a secondary assessed valuation of $233,370,759. The District has nine school campuses, six elementary, two middle schools, one high school, including an alternative high school and performing arts center. The average age of the elementary and middle schools is eight years and the high school was remodeled in 2011. The District also has a District Transportation Center, a District Maintenance Warehouse and a District Administration Office with an average age of four years. The annual expenditure budget serves as the foundation for the District’s financial planning and control. The objective of these budgetary controls is to ensure compliance with legal provisions embodied in the annual expenditure budget approved by the District’s Governing Board. The expenditure budget is prepared by fund for all Governmental Funds, and includes function and object code detail for the General Fund and some Special Revenue and Capital Projects Funds. The legal level of budgetary control (that is, the level at which expenditures cannot exceed the appropriated amount) is established at the individual fund level for all funds. Funds that are not required to legally adopt a budget may have over-expenditures of budgeted funds. The budget for these funds is simply an estimate and does not prevent the District from exceeding the budget as long as the necessary revenue is earned. The District is not required to prepare an annual budget of revenue; therefore, a deficit budgeted fund balance may be presented. However, this does not affect the District’s ability to expend monies. FACTORS AFFECTING FINANCIAL CONDITION The information presented in the financial statements is perhaps best understood when it is considered from the broader perspective of the specific environment within which the District operates.

iv
Local Economy. The City of Maricopa is located in the greater metropolitan Phoenix area, approximately 20 miles southwest of the City of Phoenix. Economic development and employment within the City are linked closely with the Phoenix metropolitan area. The major employers represented in Maricopa include the City of Maricopa, Harrah’s Ak-Chin Casino & Resort, and the Maricopa Unified School District No. 20. In addition, the metropolitan area provides for the City’s labor market, and includes the cities of Mesa, Chandler and Tempe. Major employers in the surrounding area include Intel Corporation and Motorola. Pinal County was formed in 1875 from portions of Maricopa and Pima Counties and is located in the south-central portion of Arizona, bordered on the north by Maricopa County and on the south by Pima County. The principal geographic features of the County consist of mountains with elevations to 6,000 feet in the eastern portion of the County and principally low desert valleys in the western portions of the County. Pinal County encompasses an area of approximately 5,371 square miles. Approximately 26 percent of the land is privately owned while 74 percent is under governmental control. The principal economic activities within Pinal County include mining, farming, ranching, and tourism. Copper mining is the chief economic activity in the eastern portion of the County and irrigated farming is prevalent in the low desert valleys of the western portion of Pinal County. In addition to growth occurring in the Maricopa area, other areas of Pinal County, including the communities of Apache Junction, Casa Grande, Coolidge and Florence, are also experiencing growth and are expected to see substantial student growth in the near future. A 1694 journal entry by Father Euseblo Francisco Kino records a description of what would become Maricopa Wells. He noted an established agricultural community populated by friendly Native Americans who were established traders. In the mid-1800’s, when everything south of the Gila River was still part of Mexico, Maricopa Wells was a dependable source of water along the Gila Trail. It became an important and famous stage stop for the Butterfield Overland Mail Line that stretched from St. Louis to San Francisco. The 1870’s brought the railroad south of the Wells and the ever-adaptable people of the area moved to meet the needs of progress. Phoenix was little more than a tiny village on the Salt River, but growing political influence led to the building of a spur line from Maricopa to Phoenix. Today’s Maricopa Road (John Wayne Parkway) lies over the top of that old rail line. In 1935, Maricopa settled into a slower pace as rail traffic north was halted. Although agricultural production had been consistent through time, it became the catalyst when the rail service was cut. Increased mechanization of agriculture slowed the flow of people. However, it created a hearty farm economy that thrives today. Farms and pecan groves have given way to new rooftops, paved roads, and endless opportunities for residents. Long-term Financial Planning. Even with the current national housing slowdown, the major challenge the District continues to face is preparing itself for rapid student growth. The District is located approximately 15 miles from a major financial sector in the Phoenix metropolitan area. The Maricopa area has grown rapidly as evidenced by the new residential developments and the accompanying service providers. Future building sites for schools and support facilities are being considered along with the acquisition of additional land purchases.
v
Neighboring districts to the south and the east have seen double-digit student growth over a number of years. In preparation for this student growth, the District continues to increase the level of technology in the schools to allow for long distance learning opportunities, as well as ensure that adequate classroom space exists for both existing and anticipated new students. AWARDS AND ACKNOWLEDGMENTS Awards. The Association of School Business Officials International (ASBO) awarded a Certificate of Excellence in Financial Reporting to the District for its comprehensive annual financial report for the fiscal year ended June 30, 2014. This was the sixth year that the District has received this prestigious award. In addition, the Government Finance Officers Association (GFOA) awarded a Certificate of Achievement for Excellence in Financial Reporting to the District for its comprehensive annual financial report for the fiscal year ended June 30, 2014. In order to be awarded these certificates, the District published an easily readable and efficiently organized comprehensive annual financial report. This report satisfied both accounting principles generally accepted in the United States of America and applicable legal requirements. These certificates are valid for a period of one year only. We believe that our current comprehensive annual financial report continues to meet the programs’ requirements and we are submitting it to ASBO and GFOA to determine its eligibility for the fiscal year ended June 30, 2015 certificates. Acknowledgments. The preparation of the comprehensive annual financial report on a timely basis was made possible by the dedicated service of the entire staff of the business and finance department. Each member of the department has our sincere appreciation for the contributions made in the preparation of this report. In closing, without the leadership and support of the Governing Board of the District, preparation of this report would not have been possible.
Steve Chestnut, Ed.D. Aron Rausch Superintendent Director of Business Services

vi
Association of School Business Officials International
The Certificate of Excellence in Financial Reporting Award
is presented to
Maricopa Unified School District No. 20
For Its Comprehensive Annual Financial Report (CAFR) For the Fiscal Year Ended June 30, 2014
The CAFR has been reviewed and met or exceeded
ASBO International’s Certificate of Excellence standards
Mark C. Pepera, MBA, RSBO, SFO John D. Musso, CAE, RSBA President Executive Director
vii
viii
ix
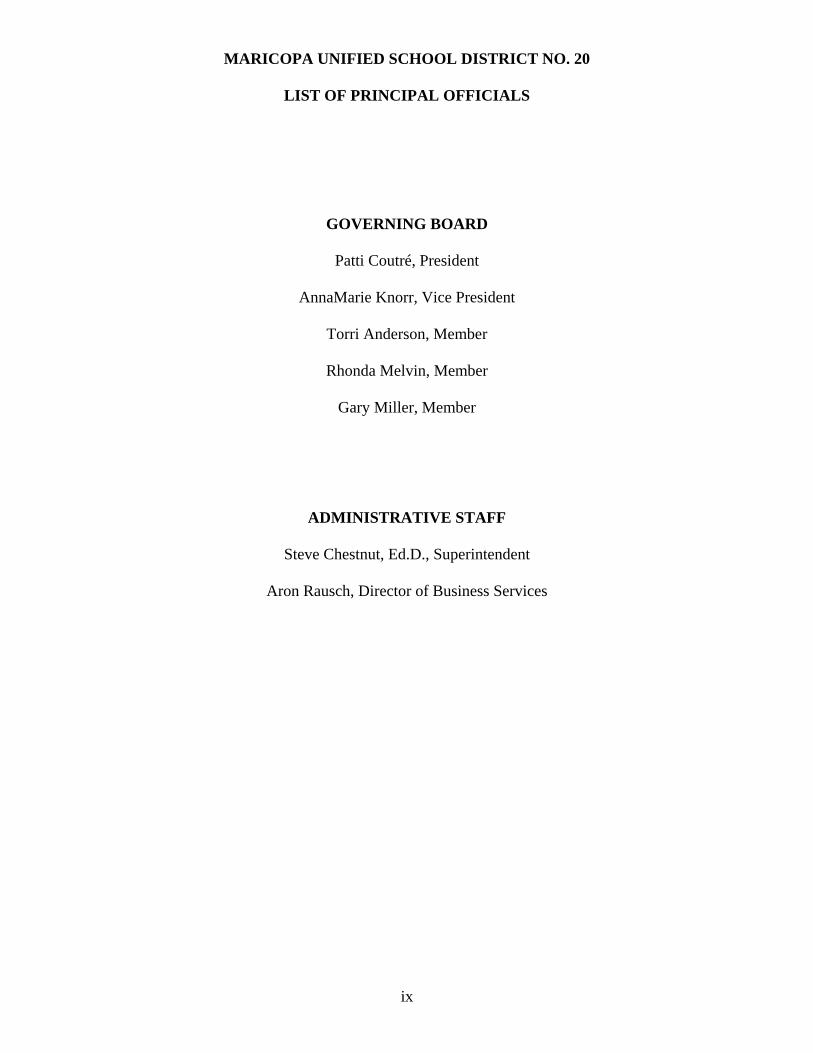
MARICOPA UNIFIED SCHOOL DISTRICT NO. 20
LIST OF PRINCIPAL OFFICIALS
GOVERNING BOARD
Patti Coutré, President
AnnaMarie Knorr, Vice President
Torri Anderson, Member
Rhonda Melvin, Member
Gary Miller, Member
ADMINISTRATIVE STAFF
Steve Chestnut, Ed.D., Superintendent
Aron Rausch, Director of Business Services

(This page intentionally left blank)

FINANCIAL SECTION

(This page intentionally left blank)

Page 1
INDEPENDENT AUDITOR’S REPORT Governing Board Maricopa Unified School District No. 20 Report on the Financial Statements We have audited the accompanying financial statements of the governmental activities, each major fund, and the aggregate remaining fund information of Maricopa Unified School District No. 20 (District), as of and for the year ended June 30, 2015, and the related notes to the financial statements, which collectively comprise the District’s basic financial statements as listed in the table of contents. Management’s Responsibility for the Financial Statements Management is responsible for the preparation and fair presentation of these financial statements in accordance with accounting principles generally accepted in the United States of America; this includes the design, implementation, and maintenance of internal control relevant to the preparation and fair presentation of financial statements that are free from material misstatement, whether due to fraud or error. Auditor’s Responsibility Our responsibility is to express opinions on these financial statements based on our audit. We conducted our audit in accordance with auditing standards generally accepted in the United States of America and the standards applicable to financial audits contained in Government Auditing Standards, issued by the Comptroller General of the United States. Those standards require that we plan and perform the audit to obtain reasonable assurance about whether the financial statements are free from material misstatement. An audit involves performing procedures to obtain audit evidence about the amounts and disclosures in the financial statements. The procedures selected depend on the auditor’s judgment, including the assessment of the risks of material misstatement of the financial statements, whether due to fraud or error. In making those risk assessments, the auditor considers internal control relevant to the entity’s preparation and fair presentation of the financial statements in order to design audit procedures that are appropriate in the circumstances, but not for the purpose of expressing an opinion on the effectiveness of the entity’s internal control. Accordingly, we express no such opinion. An audit also includes evaluating the appropriateness of accounting policies used and the reasonableness of significant accounting estimates made by management, as well as evaluating the overall presentation of the financial statements. We believe that the audit evidence we have obtained is sufficient and appropriate to provide a basis for our audit opinions. Opinions In our opinion, the financial statements referred to above present fairly, in all material respects, the respective financial position of the governmental activities, each major fund, and the aggregate remaining fund information of the Maricopa Unified School District No. 20, as of June 30, 2015, and the respective changes in financial position thereof for the year then ended in accordance with accounting principles generally accepted in the United States of America. Change in Accounting Principle As described in Note 1, the District implemented the provisions of the Governmental Accounting Standards Board (GASB) Statement No. 68, Accounting and Financial Reporting for Pensions, as amended by GASB Statement No. 71, Pension Transition for Contributions Made Subsequent to the Measurement Date, for the year ended June 30, 2015, which represents a change in accounting principle. Our opinion is not modified with respect to this matter.
TUCSON • PHOENIX • FLAGSTAFF www.heinfeldmeech.com
3033 N. Central Ave., Suite 300Phoenix, Arizona 85012
Tel (602) 277-9449Fax (602) 277-9297

Page 2
Other Matters Required Supplementary Information Accounting principles generally accepted in the United States of America require that the Management’s Discussion and Analysis, budgetary comparison information, and net pension liability information, as listed in the table of contents, be presented to supplement the basic financial statements. Such information, although not a part of the basic financial statements, is required by the Governmental Accounting Standards Board, who considers it to be an essential part of financial reporting for placing the basic financial statements in an appropriate operational, economic, or historical context. We have applied certain limited procedures to the required supplementary information in accordance with auditing standards generally accepted in the United States of America, which consisted of inquiries of management about the methods of preparing the information and comparing the information for consistency with management’s responses to our inquiries, the basic financial statements, and other knowledge we obtained during our audit of the basic financial statements. We do not express an opinion or provide any assurance on the information because the limited procedures do not provide us with sufficient evidence to express an opinion or provide any assurance. Other Information Our audit was conducted for the purpose of forming opinions on the financial statements that collectively comprise the District’s basic financial statements. The Introductory Section, Combining and Individual Fund Financial Statements and Schedules, and Statistical Section are presented for purposes of additional analysis and are not a required part of the basic financial statements. The Combining and Individual Fund Financial Statements and Schedules are the responsibility of management and were derived from and relate directly to the underlying accounting and other records used to prepare the basic financial statements. Such information has been subjected to the auditing procedures applied in the audit of the basic financial statements and certain additional procedures, including comparing and reconciling such information directly to the underlying accounting and other records used to prepare the basic financial statements or to the basic financial statements themselves, and other additional procedures in accordance with auditing standards generally accepted in the United States of America. In our opinion, the Combining and Individual Fund Financial Statements and Schedules information is fairly stated in all material respects in relation to the basic financial statements as a whole. The Introductory Section and Statistical Section have not been subjected to the auditing procedures applied in the audit of the basic financial statements and, accordingly, we do not express an opinion or provide any assurance on them. Other Reporting Required by Government Auditing Standards In accordance with Government Auditing Standards, we have also issued our report dated December 16, 2015, on our consideration of Maricopa Unified School District No. 20’s internal control over financial reporting and on our tests of its compliance with certain provisions of laws, regulations, contracts, and grant agreements and other matters. The purpose of that report is to describe the scope of our testing of internal control over financial reporting and compliance and the results of that testing, and not to provide an opinion on the internal control over financial reporting or on compliance. That report is an integral part of an audit performed in accordance with Government Auditing Standards in considering Maricopa Unified School District No. 20’s internal control over financial reporting and compliance. HEINFELD, MEECH & CO., P.C. CPAs and Business Consultants December 16, 2015
Page 3
MANAGEMENT’S DISCUSSION AND ANALYSIS (MD&A) (Required Supplementary Information)

Page 4
(This page intentionally left blank)
MARICOPA UNIFIED SCHOOL DISTRICT NO. 20 MANAGEMENT’S DISCUSSION AND ANALYSIS (MD&A)
YEAR ENDED JUNE 30, 2015
Page 5
As management of the Maricopa Unified School District No. 20 (District), we offer readers of the District’s financial statements this narrative overview and analysis of the financial activities of the District for the fiscal year ended June 30, 2015. The management’s discussion and analysis is presented as required supplementary information to supplement the basic financial statements. We encourage readers to consider the information presented here in conjunction with additional information that we have furnished in our letter of transmittal, which can be found in the introductory section of this report. FINANCIAL HIGHLIGHTS
The District’s total net position of governmental activities decreased $716,176 which
represents a one percent decrease from the prior fiscal year. General revenues accounted for $39.2 million in revenue, or 85 percent of all current
fiscal year revenues. Program specific revenues in the form of charges for services and grants and contributions accounted for $7.2 million or 15 percent of total current fiscal year revenues.
The District had approximately $47.2 million in expenses related to governmental
activities, an increase of three percent from the prior fiscal year. Among major funds, the General Fund had $28.1 million in current fiscal year revenues,
which primarily consisted of state aid and property taxes, and $32.5 million in expenditures. The General Fund’s fund balance decreased from $4.3 million at the prior fiscal year end, to $3.2 million at the end of the current fiscal year, due primarily to increased instructional expenditures as a result of an increase in staffing, salaries, and benefits.
OVERVIEW OF FINANCIAL STATEMENTS This discussion and analysis are intended to serve as an introduction to the District’s basic financial statements. The District’s basic financial statements comprise three components: 1) government-wide financial statements, 2) fund financial statements, and 3) notes to the financial statements. This report also contains other supplementary information in addition to the basic financial statements themselves. Government-wide financial statements. The government-wide financial statements are designed to provide readers with a broad overview of the District’s finances, in a manner similar to a private-sector business. The accrual basis of accounting is used for the government-wide financial statements.
MARICOPA UNIFIED SCHOOL DISTRICT NO. 20 MANAGEMENT’S DISCUSSION AND ANALYSIS (MD&A)
YEAR ENDED JUNE 30, 2015
Page 6
OVERVIEW OF FINANCIAL STATEMENTS The statement of net position presents information on all of the District’s assets, liabilities, and deferred inflows/outflows of resources with the difference reported as net position. Over time, increases or decreases in net position may serve as a useful indicator of whether the financial position of the District is improving or deteriorating. The statement of activities presents information showing how the District’s net position changed during the most recent fiscal year. All changes in net position are reported as soon as the underlying event giving rise to the change occurs, regardless of the timing of related cash flows. Thus, revenues and expenses are reported in this statement for some items that will only result in cash flows in future fiscal periods (e.g., uncollected taxes and earned but unused compensated absences). The government-wide financial statements outline functions of the District that are principally supported by property taxes and intergovernmental revenues. The governmental activities of the District include instruction, support services, operation and maintenance of plant services, student transportation services, operation of non-instructional services, and interest on long-term debt. Fund financial statements. A fund is a grouping of related accounts that is used to maintain control over resources that have been segregated for specific activities or objectives. The District uses fund accounting to ensure and demonstrate compliance with finance-related legal requirements. All of the funds of the District can be divided into two categories: governmental funds and fiduciary funds.
Governmental funds. Governmental funds are used to account for essentially the same functions reported as governmental activities in the government-wide financial statements. However, unlike the government-wide financial statements, governmental fund financial statements use the modified accrual basis of accounting and focus on near-term inflows of spendable resources, as well as on balances of spendable resources available at the end of the fiscal year. Such information may be useful in evaluating the District’s near-term financing requirements. Because the focus of governmental funds is narrower than that of the government-wide financial statements, it is useful to compare the information presented for governmental funds with similar information presented for governmental activities in the government-wide financial statements. By doing so, readers may better understand the long-term impact of the District’s near-term financing decision. Both the governmental fund balance sheet and the governmental fund statement of revenues, expenditures and changes in fund balances provide a reconciliation to facilitate this comparison between governmental funds and governmental activities.

MARICOPA UNIFIED SCHOOL DISTRICT NO. 20 MANAGEMENT’S DISCUSSION AND ANALYSIS (MD&A)
YEAR ENDED JUNE 30, 2015
Page 7
OVERVIEW OF FINANCIAL STATEMENTS Information is presented separately in the governmental fund balance sheet and in the governmental fund statement of revenues, expenditures and changes in fund balances for the General and Unrestricted Capital Outlay Funds, both of which are considered to be major funds. Data from the other governmental funds are combined into a single, aggregated presentation. Individual fund data for each of these non-major governmental funds is provided in the form of combining statements and schedules. Fiduciary funds. Fiduciary funds are used to account for resources held for the benefit of parties outside the District. Fiduciary funds are not reflected in the government-wide financial statements because the resources of those funds are not available to support the District’s own programs. Due to their custodial nature, fiduciary funds do not have a measurement focus.
Notes to the financial statements. The notes provide additional information that is essential to a full understanding of the data provided in the government-wide and fund financial statements. The notes to the financial statements can be found immediately following the basic financial statements. Other information. In addition to the basic financial statements and accompanying notes, this report also presents certain required supplementary information concerning the District’s budget process. The District adopts an annual expenditure budget for all governmental funds. A schedule of revenues, expenditures and changes in fund balances - budget and actual has been provided for the General Fund as required supplementary information. GOVERNMENT-WIDE FINANCIAL ANALYSIS Net position may serve over time as a useful indicator of a government’s financial position. In the case of the District, assets exceeded liabilities by $82.5 million at the current fiscal year end. The largest portion of the District’s net position reflects its investment in capital assets (e.g., land and improvements, buildings and improvements, vehicles, furniture and equipment and construction in progress), less any related outstanding debt used to acquire those assets. The District uses these capital assets to provide services to its students; consequently, these assets are not available for future spending. Although the District’s investment in its capital assets is reported net of related debt, it should be noted that the resources needed to repay this debt must be provided from other sources, since the capital assets themselves cannot be used to liquidate these liabilities. In addition, a portion of the District’s net position represents resources that are subject to external restrictions on how they may be used.
MARICOPA UNIFIED SCHOOL DISTRICT NO. 20 MANAGEMENT’S DISCUSSION AND ANALYSIS (MD&A)
YEAR ENDED JUNE 30, 2015
Page 8
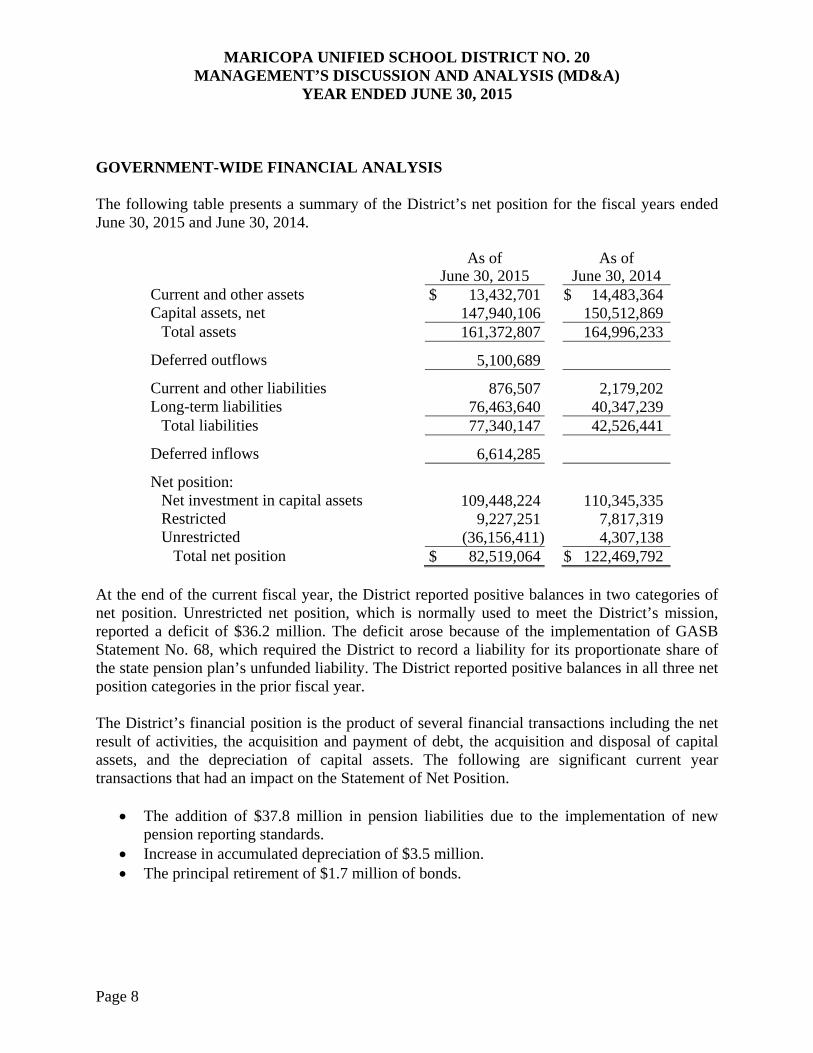
GOVERNMENT-WIDE FINANCIAL ANALYSIS The following table presents a summary of the District’s net position for the fiscal years ended June 30, 2015 and June 30, 2014.
As of
June 30, 2015 As of
June 30, 2014 Current and other assets $ 13,432,701 $ 14,483,364 Capital assets, net 147,940,106 150,512,869
Total assets 161,372,807 164,996,233
Deferred outflows 5,100,689
Current and other liabilities 876,507 2,179,202 Long-term liabilities 76,463,640 40,347,239
Total liabilities 77,340,147 42,526,441
Deferred inflows 6,614,285
Net position: Net investment in capital assets 109,448,224 110,345,335 Restricted 9,227,251 7,817,319 Unrestricted (36,156,411) 4,307,138
Total net position $ 82,519,064 $ 122,469,792 At the end of the current fiscal year, the District reported positive balances in two categories of net position. Unrestricted net position, which is normally used to meet the District’s mission, reported a deficit of $36.2 million. The deficit arose because of the implementation of GASB Statement No. 68, which required the District to record a liability for its proportionate share of the state pension plan’s unfunded liability. The District reported positive balances in all three net position categories in the prior fiscal year. The District’s financial position is the product of several financial transactions including the net result of activities, the acquisition and payment of debt, the acquisition and disposal of capital assets, and the depreciation of capital assets. The following are significant current year transactions that had an impact on the Statement of Net Position.
The addition of $37.8 million in pension liabilities due to the implementation of new pension reporting standards.
Increase in accumulated depreciation of $3.5 million. The principal retirement of $1.7 million of bonds.
MARICOPA UNIFIED SCHOOL DISTRICT NO. 20 MANAGEMENT’S DISCUSSION AND ANALYSIS (MD&A)
YEAR ENDED JUNE 30, 2015
Page 9
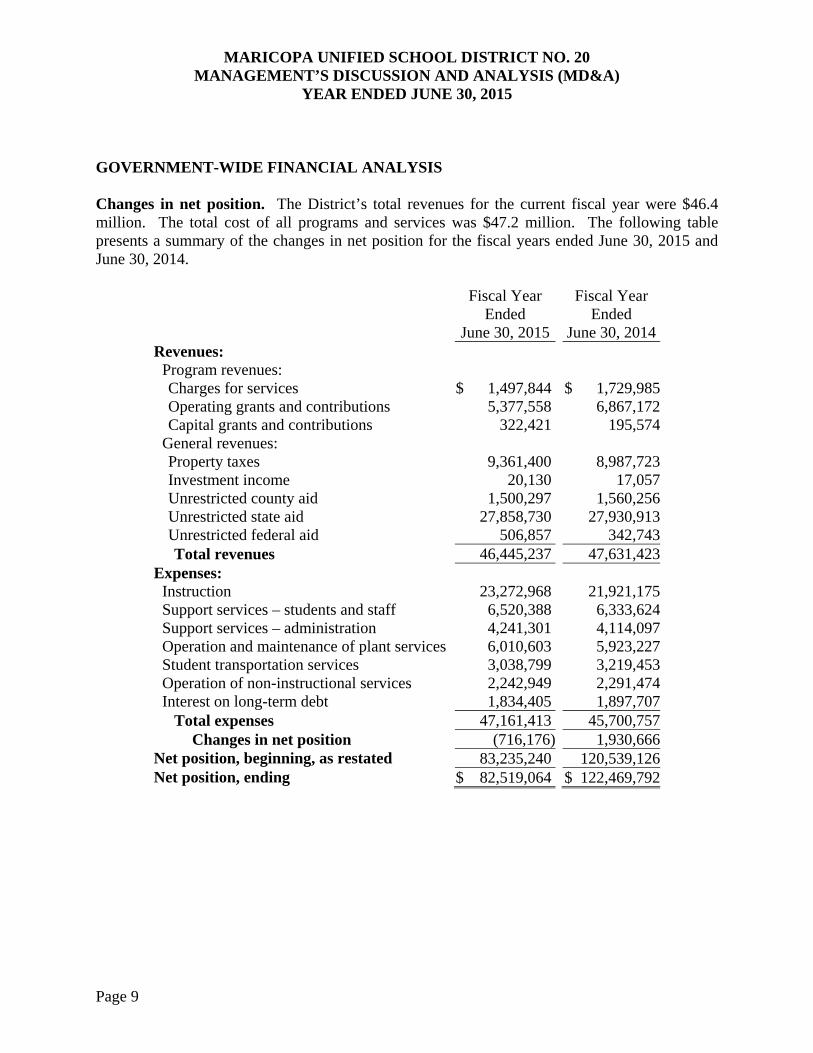
GOVERNMENT-WIDE FINANCIAL ANALYSIS Changes in net position. The District’s total revenues for the current fiscal year were $46.4 million. The total cost of all programs and services was $47.2 million. The following table presents a summary of the changes in net position for the fiscal years ended June 30, 2015 and June 30, 2014.
Fiscal Year Ended
June 30, 2015
Fiscal Year Ended
June 30, 2014Revenues:
Program revenues: Charges for services $ 1,497,844 $ 1,729,985 Operating grants and contributions 5,377,558 6,867,172 Capital grants and contributions 322,421 195,574
General revenues: Property taxes 9,361,400 8,987,723 Investment income 20,130 17,057 Unrestricted county aid 1,500,297 1,560,256 Unrestricted state aid 27,858,730 27,930,913 Unrestricted federal aid 506,857 342,743 Total revenues 46,445,237 47,631,423
Expenses: Instruction 23,272,968 21,921,175 Support services – students and staff 6,520,388 6,333,624 Support services – administration 4,241,301 4,114,097 Operation and maintenance of plant services 6,010,603 5,923,227 Student transportation services 3,038,799 3,219,453 Operation of non-instructional services 2,242,949 2,291,474 Interest on long-term debt 1,834,405 1,897,707
Total expenses 47,161,413 45,700,757 Changes in net position (716,176) 1,930,666
Net position, beginning, as restated 83,235,240 120,539,126 Net position, ending $ 82,519,064 $ 122,469,792
MARICOPA UNIFIED SCHOOL DISTRICT NO. 20 MANAGEMENT’S DISCUSSION AND ANALYSIS (MD&A)
YEAR ENDED JUNE 30, 2015
Page 10
GOVERNMENT-WIDE FINANCIAL ANALYSIS
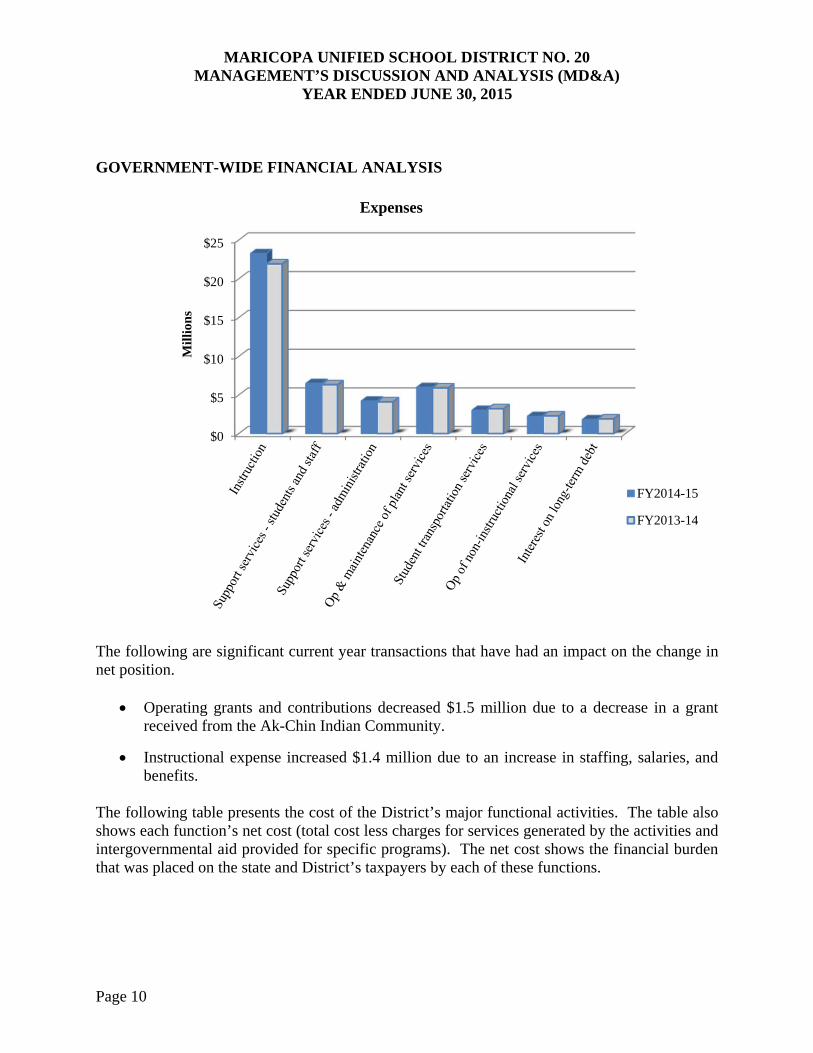
The following are significant current year transactions that have had an impact on the change in net position.
Operating grants and contributions decreased $1.5 million due to a decrease in a grant received from the Ak-Chin Indian Community.
Instructional expense increased $1.4 million due to an increase in staffing, salaries, and benefits.
The following table presents the cost of the District’s major functional activities. The table also shows each function’s net cost (total cost less charges for services generated by the activities and intergovernmental aid provided for specific programs). The net cost shows the financial burden that was placed on the state and District’s taxpayers by each of these functions.
$0
$5
$10
$15
$20
$25
Mil
lion
s
Expenses
FY2014-15
FY2013-14
MARICOPA UNIFIED SCHOOL DISTRICT NO. 20 MANAGEMENT’S DISCUSSION AND ANALYSIS (MD&A)
YEAR ENDED JUNE 30, 2015
Page 11
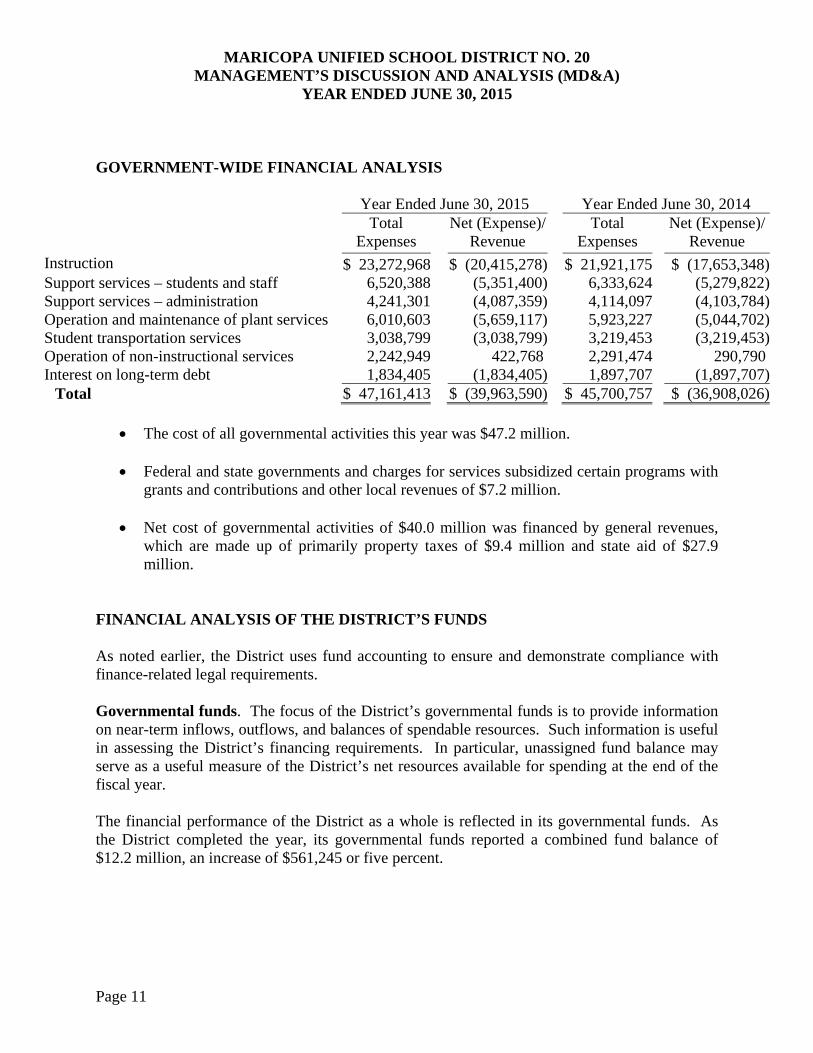
GOVERNMENT-WIDE FINANCIAL ANALYSIS
Year Ended June 30, 2015 Year Ended June 30, 2014 Total
Expenses Net (Expense)/
Revenue Total
Expenses Net (Expense)/
Revenue Instruction $ 23,272,968 $ (20,415,278) $ 21,921,175 $ (17,653,348)Support services – students and staff 6,520,388 (5,351,400) 6,333,624 (5,279,822)Support services – administration 4,241,301 (4,087,359) 4,114,097 (4,103,784)Operation and maintenance of plant services 6,010,603 (5,659,117) 5,923,227 (5,044,702)Student transportation services 3,038,799 (3,038,799) 3,219,453 (3,219,453)Operation of non-instructional services 2,242,949 422,768 2,291,474 290,790 Interest on long-term debt 1,834,405 (1,834,405) 1,897,707 (1,897,707)
Total $ 47,161,413 $ (39,963,590) $ 45,700,757 $ (36,908,026)
The cost of all governmental activities this year was $47.2 million.
Federal and state governments and charges for services subsidized certain programs with grants and contributions and other local revenues of $7.2 million.
Net cost of governmental activities of $40.0 million was financed by general revenues,
which are made up of primarily property taxes of $9.4 million and state aid of $27.9 million.
FINANCIAL ANALYSIS OF THE DISTRICT’S FUNDS As noted earlier, the District uses fund accounting to ensure and demonstrate compliance with finance-related legal requirements. Governmental funds. The focus of the District’s governmental funds is to provide information on near-term inflows, outflows, and balances of spendable resources. Such information is useful in assessing the District’s financing requirements. In particular, unassigned fund balance may serve as a useful measure of the District’s net resources available for spending at the end of the fiscal year. The financial performance of the District as a whole is reflected in its governmental funds. As the District completed the year, its governmental funds reported a combined fund balance of $12.2 million, an increase of $561,245 or five percent.
MARICOPA UNIFIED SCHOOL DISTRICT NO. 20 MANAGEMENT’S DISCUSSION AND ANALYSIS (MD&A)
YEAR ENDED JUNE 30, 2015
Page 12
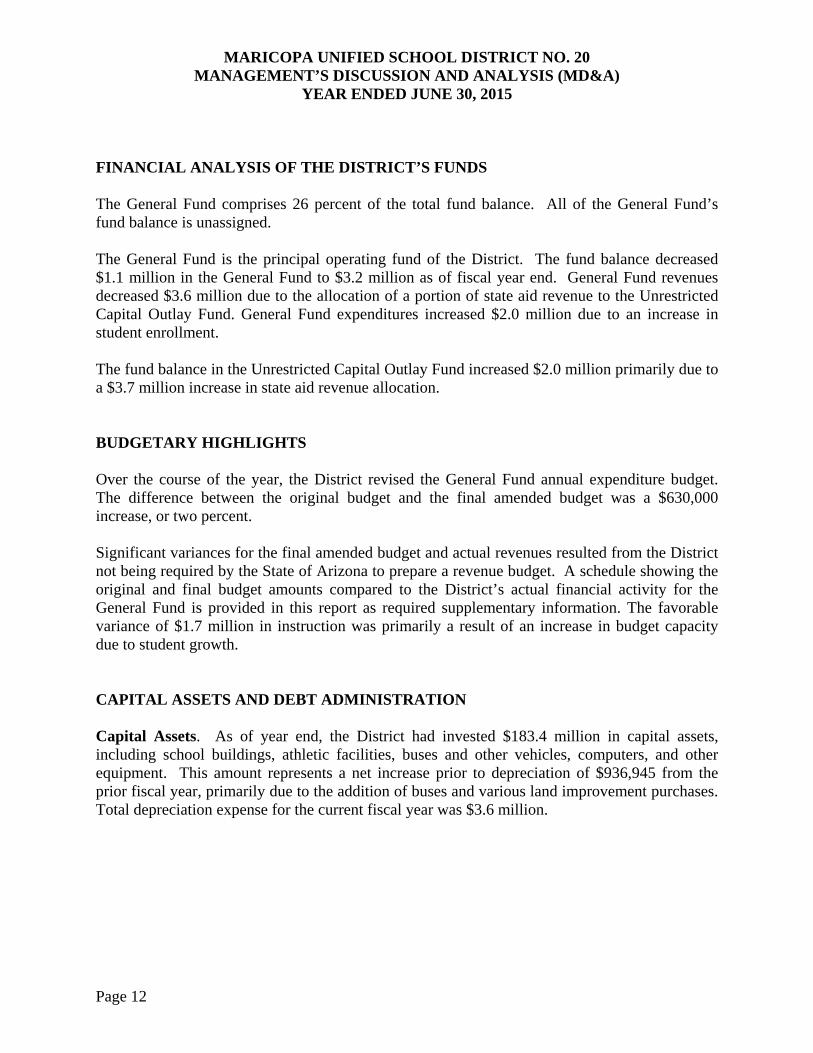
FINANCIAL ANALYSIS OF THE DISTRICT’S FUNDS The General Fund comprises 26 percent of the total fund balance. All of the General Fund’s fund balance is unassigned. The General Fund is the principal operating fund of the District. The fund balance decreased $1.1 million in the General Fund to $3.2 million as of fiscal year end. General Fund revenues decreased $3.6 million due to the allocation of a portion of state aid revenue to the Unrestricted Capital Outlay Fund. General Fund expenditures increased $2.0 million due to an increase in student enrollment. The fund balance in the Unrestricted Capital Outlay Fund increased $2.0 million primarily due to a $3.7 million increase in state aid revenue allocation. BUDGETARY HIGHLIGHTS Over the course of the year, the District revised the General Fund annual expenditure budget. The difference between the original budget and the final amended budget was a $630,000 increase, or two percent. Significant variances for the final amended budget and actual revenues resulted from the District not being required by the State of Arizona to prepare a revenue budget. A schedule showing the original and final budget amounts compared to the District’s actual financial activity for the General Fund is provided in this report as required supplementary information. The favorable variance of $1.7 million in instruction was primarily a result of an increase in budget capacity due to student growth. CAPITAL ASSETS AND DEBT ADMINISTRATION Capital Assets. As of year end, the District had invested $183.4 million in capital assets, including school buildings, athletic facilities, buses and other vehicles, computers, and other equipment. This amount represents a net increase prior to depreciation of $936,945 from the prior fiscal year, primarily due to the addition of buses and various land improvement purchases. Total depreciation expense for the current fiscal year was $3.6 million.

MARICOPA UNIFIED SCHOOL DISTRICT NO. 20 MANAGEMENT’S DISCUSSION AND ANALYSIS (MD&A)
YEAR ENDED JUNE 30, 2015
Page 13
CAPITAL ASSETS AND DEBT ADMINISTRATION The following schedule presents a summary of capital asset balances for the fiscal years ended June 30, 2015 and June 30, 2014.
As of June 30, 2015
As of June 30, 2014
Capital assets – non-depreciable $ 14,512,800 $ 14,614,486 Capital assets – depreciable, net 133,427,306 135,898,383
Total $ 147,940,106 $ 150,512,869 Additional information on the District’s capital assets can be found in Note 6. Debt Administration. At year-end, the District had $38.5 million in long-term debt outstanding, $1.9 million due within one year. This represents a net decrease of $1.7 million. The District’s general obligation bonds are subject to two limits; the Constitutional debt limit (total debt limit) on all general obligation bonds up to 30 percent of the total secondary assessed valuation) and the statutory debt limit on Class B bonds (the greater of 20 percent of the secondary assessed valuation or $1,500 per student). The current debt limitation for the District is $70.0 million and the Class B debt limit is $46.7 million, which are more than the District’s total outstanding general obligation and Class B debt, respectively Additional information on the District’s long-term debt can be found in Notes 7 through 9. ECONOMIC FACTORS AND NEXT YEAR’S BUDGET AND RATES Many factors were considered by the District’s administration during the process of developing the fiscal year 2015-16 budget. Among them:
State of Arizona budget deficit and the impact on funding. Fiscal year 2014-15 budget balance carry forward (estimated $618,169). District student population (estimated 6,200).
Also considered in the development of the budget is the local economy and inflation of the surrounding area.

MARICOPA UNIFIED SCHOOL DISTRICT NO. 20 MANAGEMENT’S DISCUSSION AND ANALYSIS (MD&A)
YEAR ENDED JUNE 30, 2015
Page 14
ECONOMIC FACTORS AND NEXT YEAR’S BUDGET AND RATES Budgeted expenditures in the General Fund increased five percent to $33.6 million in fiscal year 2015-16. Expected student growth, budget carryover, and a state increase in per pupil funding are the primary reasons for the increase. State aid and property taxes are expected to be the primary funding sources. No new programs were added to the 2015-16 budget. CONTACTING THE DISTRICT’S FINANCIAL MANAGEMENT This financial report is designed to provide our citizens, taxpayers, and investors and creditors with a general overview of the District’s finances and to demonstrate the District’s accountability for the resources it receives. If you have questions about this report or need additional information, contact the Business and Finance Department, Maricopa Unified School District No. 20, 44150 West Maricopa-Casa Grande Highway, Maricopa, Arizona 85138.

Page 15
BASIC FINANCIAL STATEMENTS

Page 16
(This page intentionally left blank)
Page 17
GOVERNMENT-WIDE FINANCIAL STATEMENTS

ASSETSCurrent assets:
Cash and investmentsProperty taxes receivableDepositsDue from governmental entities
Total current assets
Noncurrent assets:Capital assets not being depreciatedCapital assets, net of accumulated depreciation
Total noncurrent assetsTotal assets
DEFERRED OUTFLOWS OF RESOURCESPension plan items
LIABILITIESCurrent liabilities:
Accounts payableConstruction contracts payableAccrued payroll and employee benefitsCompensated absences payableUnearned revenuesObligations under capital leasesBonds payable
Total current liabilities
Noncurrent liabilities:Non-current portion of long-term obligations
Total noncurrent liabilitiesTotal liabilities
DEFERRED INFLOWS OF RESOURCESPension plan items
NET POSITIONNet investment in capital assetsRestricted for:
Voter approved initiativesFederal and state projectsFood serviceCounty, City, and Town grantsCivic centerCommunity schoolExtracurricular activitiesOther local initiativesDebt serviceCapital outlay
UnrestrictedTotal net position
Governmental Activities
$ 2,038,738240,87973,264
11,079,82013,432,701
14,512,800133,427,306147,940,106161,372,807
5,100,689
439,41051,085
380,487125,000
5,52542,575
1,855,0002,899,082
74,441,06574,441,06577,340,147
6,614,285
109,448,224
485,782546,100
1,060,839361,268475,339257,740139,101111,893310,788
5,478,401(36,156,411)
$ 82,519,064
MARICOPA UNIFIED SCHOOL DISTRICT NO. 20STATEMENT OF NET POSITION
JUNE 30, 2015
The notes to the basic financial statements are an integral part of this statement.Page 18
Program Revenues
Net (Expense) Revenue and
Changes in Net Position
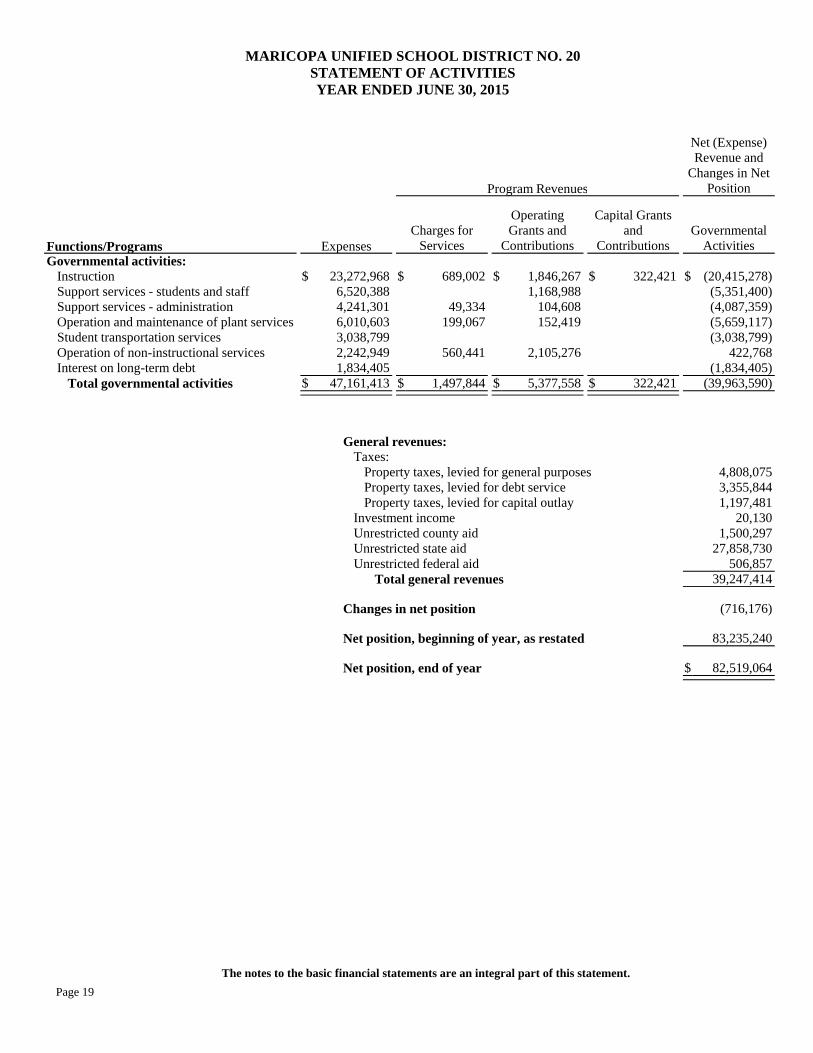
Functions/ProgramsGovernmental activities:
InstructionSupport services - students and staffSupport services - administrationOperation and maintenance of plant servicesStudent transportation servicesOperation of non-instructional servicesInterest on long-term debt
Total governmental activities
Expenses
$ 23,272,9686,520,3884,241,3016,010,6033,038,7992,242,9491,834,405
$ 47,161,413
Charges for Services
$ 689,002
49,334199,067
560,441
$ 1,497,844
Operating Grants and
Contributions
$ 1,846,2671,168,988
104,608152,419
2,105,276
$ 5,377,558
Capital Grants and
Contributions
$ 322,421
$ 322,421
Governmental Activities
$ (20,415,278)(5,351,400)(4,087,359)(5,659,117)(3,038,799)
422,768(1,834,405)
(39,963,590)
General revenues:Taxes:
Property taxes, levied for general purposesProperty taxes, levied for debt serviceProperty taxes, levied for capital outlay
Investment incomeUnrestricted county aidUnrestricted state aidUnrestricted federal aid
Total general revenues
Changes in net position
Net position, beginning of year, as restated
Net position, end of year
4,808,0753,355,8441,197,481
20,1301,500,297
27,858,730506,857
39,247,414
(716,176)
83,235,240
$ 82,519,064
MARICOPA UNIFIED SCHOOL DISTRICT NO. 20STATEMENT OF ACTIVITIESYEAR ENDED JUNE 30, 2015
Page 19
The notes to the basic financial statements are an integral part of this statement.

Page 20
(This page intentionally left blank)

Page 21
FUND FINANCIAL STATEMENTS
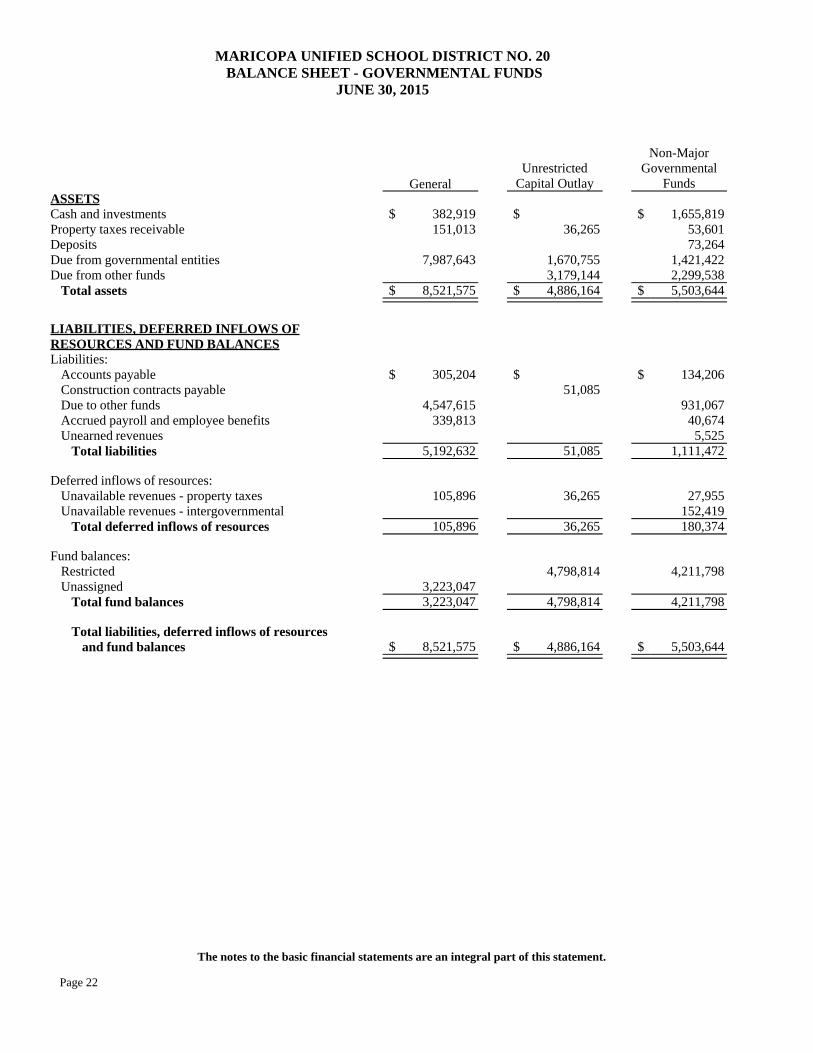
ASSETSCash and investmentsProperty taxes receivableDepositsDue from governmental entitiesDue from other funds
Total assets
LIABILITIES, DEFERRED INFLOWS OF RESOURCES AND FUND BALANCESLiabilities:
Accounts payableConstruction contracts payableDue to other fundsAccrued payroll and employee benefitsUnearned revenues
Total liabilities
Deferred inflows of resources:Unavailable revenues - property taxesUnavailable revenues - intergovernmental
Total deferred inflows of resources
Fund balances:RestrictedUnassigned
Total fund balances
Total liabilities, deferred inflows of resourcesand fund balances
General
$ 382,919151,013
7,987,643
$ 8,521,575
$ 305,204
4,547,615339,813
5,192,632
105,896
105,896
3,223,0473,223,047
$ 8,521,575
Unrestricted Capital Outlay
$36,265
1,670,7553,179,144
$ 4,886,164
$51,085
51,085
36,265
36,265
4,798,814
4,798,814
$ 4,886,164
Non-Major Governmental
Funds
$ 1,655,81953,60173,264
1,421,4222,299,538
$ 5,503,644
$ 134,206
931,06740,6745,525
1,111,472
27,955152,419180,374
4,211,798
4,211,798
$ 5,503,644
MARICOPA UNIFIED SCHOOL DISTRICT NO. 20 BALANCE SHEET - GOVERNMENTAL FUNDS
JUNE 30, 2015
Page 22
The notes to the basic financial statements are an integral part of this statement.
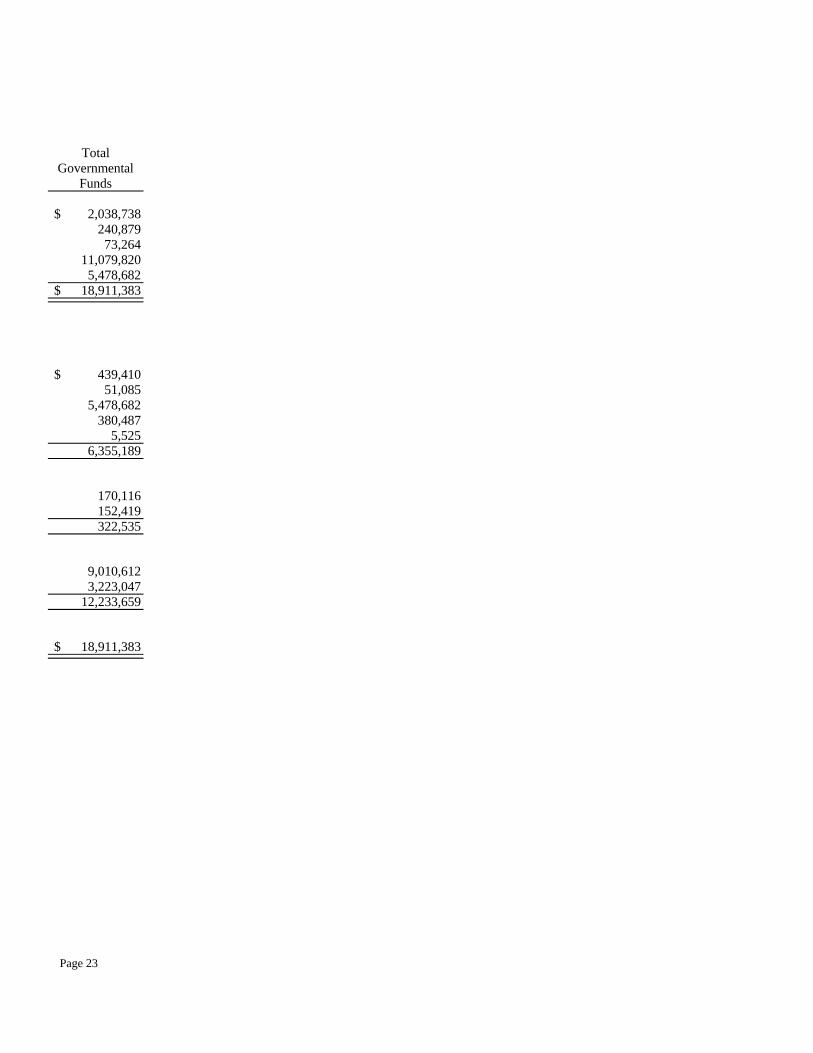
Total Governmental
Funds
$ 2,038,738240,87973,264
11,079,8205,478,682
$ 18,911,383
$ 439,41051,085
5,478,682380,487
5,5256,355,189
170,116152,419322,535
9,010,6123,223,047
12,233,659
$ 18,911,383
Page 23

Page 24
(This page intentionally left blank)

Total governmental fund balances 12,233,659$
Amounts reported for governmental activities in the Statement of Net Position are different because:
Capital assets used in governmental activities are not financialresources and, therefore, are not reported in the funds.
Governmental capital assets 183,385,879$ Less accumulated depreciation (35,445,773) 147,940,106
Some receivables are not available to pay for current period expenditures and, therefore, are reported as unavailable revenues in the funds.
Property taxes 170,116Intergovernmental 152,419 322,535
Deferred outflows and inflows of resources related to pensions are applicable to future periods and, therefore, are not reported in the funds.
Deferred outflows of resources related to pensions 5,100,689Deferred inflows of resources related to pensions (6,614,285) (1,513,596)
Long-term liabilities are not due and payable in the currentperiod and, therefore, are not reported in the funds.
Compensated absences payable (147,556)Obligations under capital leases (111,882)Bonds payable (38,380,000)Net pension liability (37,824,202) (76,463,640)
Net position of governmental activities 82,519,064$
MARICOPA UNIFIED SCHOOL DISTRICT NO. 20RECONCILIATION OF THE BALANCE SHEET - GOVERNMENTAL FUNDS
TO THE STATEMENT OF NET POSITIONJUNE 30, 2015
Page 25
The notes to the basic financial statements are an integral part of this statement.
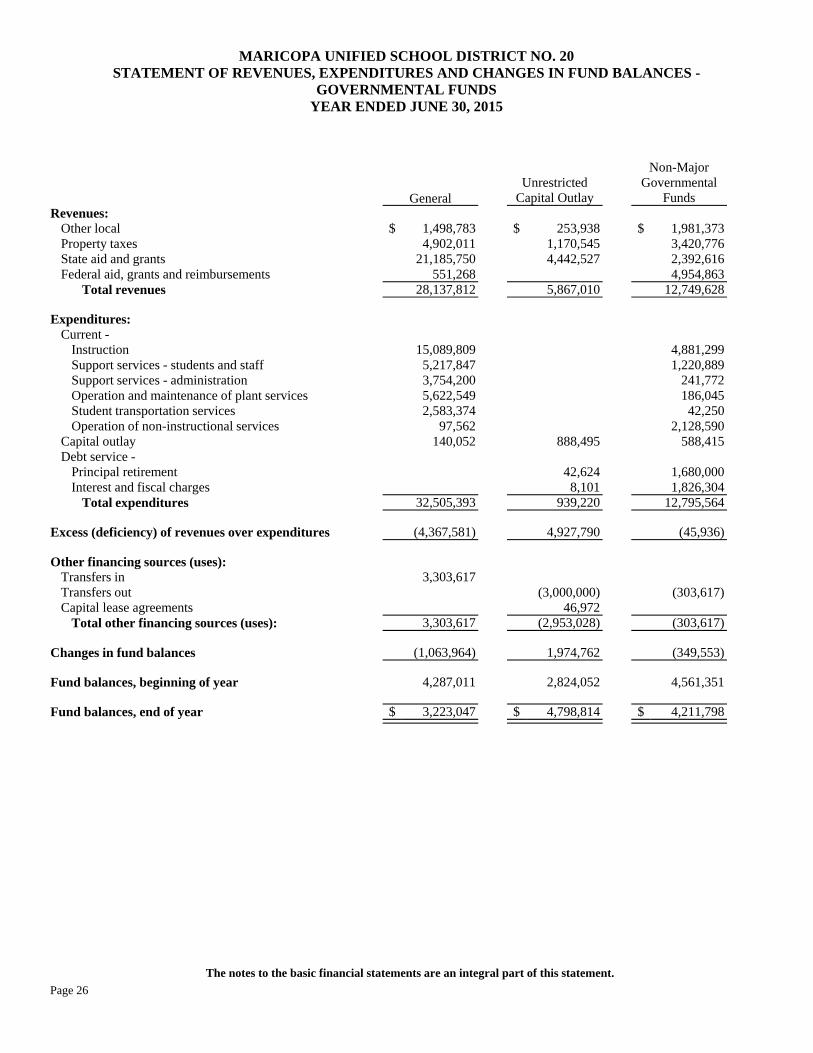
Revenues:Other localProperty taxesState aid and grantsFederal aid, grants and reimbursements
Total revenues
Expenditures:Current -
InstructionSupport services - students and staffSupport services - administrationOperation and maintenance of plant servicesStudent transportation servicesOperation of non-instructional services
Capital outlayDebt service -
Principal retirementInterest and fiscal charges
Total expenditures
Excess (deficiency) of revenues over expenditures
Other financing sources (uses):Transfers inTransfers outCapital lease agreements
Total other financing sources (uses):
Changes in fund balances
Fund balances, beginning of year
Fund balances, end of year
General
$ 1,498,7834,902,011
21,185,750551,268
28,137,812
15,089,8095,217,8473,754,2005,622,5492,583,374
97,562140,052
32,505,393
(4,367,581)
3,303,617
3,303,617
(1,063,964)
4,287,011
$ 3,223,047
Unrestricted Capital Outlay
$ 253,9381,170,5454,442,527
5,867,010
888,495
42,6248,101
939,220
4,927,790
(3,000,000)46,972
(2,953,028)
1,974,762
2,824,052
$ 4,798,814
Non-Major Governmental
Funds
$ 1,981,3733,420,7762,392,6164,954,863
12,749,628
4,881,2991,220,889
241,772186,045
42,2502,128,590
588,415
1,680,0001,826,304
12,795,564
(45,936)
(303,617)
(303,617)
(349,553)
4,561,351
$ 4,211,798
MARICOPA UNIFIED SCHOOL DISTRICT NO. 20STATEMENT OF REVENUES, EXPENDITURES AND CHANGES IN FUND BALANCES -
GOVERNMENTAL FUNDSYEAR ENDED JUNE 30, 2015
Page 26
The notes to the basic financial statements are an integral part of this statement.

Total Governmental
Funds
$ 3,734,0949,493,332
28,020,8935,506,131
46,754,450
19,971,1086,438,7363,995,9725,808,5942,625,6242,226,1521,616,962
1,722,6241,834,405
46,240,177
514,273
3,303,617(3,303,617)
46,97246,972
561,245
11,672,414
$ 12,233,659
Page 27

Net changes in fund balances - total governmental funds 561,245$
Amounts reported for governmental activities in the Statement of Activities are different because:
Governmental funds report the portion of capital outlay for capitalized assets as expenditures. However, in the Statement of Activities, the costs of those assets are allocated over theirestimated useful lives as depreciation expense.
Expenditures for capitalized assets 1,097,285$ Less current year depreciation (3,635,533) (2,538,248)
Issuance of long-term debt provides current financial resources to governmental funds, but the issuance increases long term liabilities in the Statement of Net Position.
Obligations under capital leases (46,972)
Property tax revenues in the Statement of Activities that do not provide current financial resources are not reported as revenues in the funds.
Property taxes (131,932)Intergovernmental (177,281) (309,213)
Repayments of long-term debt principal are expenditures in the governmental funds,but the repayment reduces long-term liabilities in the Statement of Net Position.
Capital lease principal retirement 42,624 Bond principal retirement 1,680,000 1,722,624
Governmental funds report pension contributions as expenditures. However,they are reported as deferred outflows of resources in the Statement ofNet Position. The change in the net pension liability, adjusted for deferred pension items, is reported as pension expense in the Statement of Activities.
Current year pension contributions 2,625,957Pension expense (2,729,203) (103,246)
Some expenses reported in the Statement of Activities do not require the useof current financial resources and, therefore, are not reported as expenditures in governmental funds.
Loss on disposal of capital assets (34,515)Compensated absences 32,149 (2,366)
(716,176)$
MARICOPA UNIFIED SCHOOL DISTRICT NO. 20RECONCILIATION OF THE STATEMENT OF REVENUES, EXPENDITURES AND CHANGES
IN FUND BALANCES - GOVERNMENTAL FUNDS TO THE STATEMENT OF ACTIVITIESYEAR ENDED JUNE 30, 2015
Changes in net position in governmental activities
Page 28
The notes to the basic financial statements are an integral part of this statement.

ASSETSCash and investments
Total assets
LIABILITIESDeposits held for othersDue to student groups
Total liabilities
Agency
$ 141,406$ 141,406
$ 63,04178,365
$ 141,406
MARICOPA UNIFIED SCHOOL DISTRICT NO. 20STATEMENT OF ASSETS AND LIABILITIES
FIDUCIARY FUNDSJUNE 30, 2015
Page 29
The notes to the basic financial statements are an integral part of this statement.
MARICOPA UNIFIED SCHOOL DISTRICT NO. 20 NOTES TO FINANCIAL STATEMENTS
JUNE 30, 2015
Page 30
NOTE 1 – SUMMARY OF SIGNIFICANT ACCOUNTING POLICIES The financial statements of the Maricopa Unified School District No. 20 (District) have been prepared in conformity with accounting principles generally accepted in the United States of America as applied to government units. The Governmental Accounting Standards Board (GASB) is the accepted standard-setting body for establishing governmental accounting and financial reporting principles. During the year ended June 30, 2015, the District implemented the provisions of GASB Statement No. 68, Accounting and Financial Reporting for Pensions, as amended by GASB Statement No. 71, Pension Transition for Contributions Made Subsequent to the Measurement Date. This Statement requires governments providing defined benefit pensions to recognize the long-term obligation for pension benefits as a liability, and to more comprehensively and comparably measure the annual costs of pension benefits. This Statement also enhances accountability and transparency through revised note disclosures and new required supplementary information. The more significant of the District’s accounting policies are described below. A. Reporting Entity The Governing Board is organized under Section 15-321 of the Arizona Revised Statutes (A.R.S.). Management of the District is independent of other state or local governments. The County Treasurer collects taxes for the District, but exercises no control over its expenditures/expenses. The membership of the Governing Board consists of five members elected by the public. Under existing statutes, the Governing Board’s duties and powers include, but are not limited to, the acquisition, maintenance and disposition of school property; the development and adoption of a school program; and the establishment, organization and operation of schools. The Board also has broad financial responsibilities, including the approval of the annual budget, and the establishment of a system of accounting and budgetary controls. The financial reporting entity consists of a primary government and its component units. A component unit is a legally separate entity that must be included in the reporting entity in conformity with generally accepted accounting principles. The District is a primary government because it is a special-purpose government that has a separately elected governing body, is legally separate, and is fiscally independent of other state or local governments. Furthermore, there are no component units combined with the District for financial statement presentation purposes, and the District is not included in any other governmental reporting entity. Consequently, the District’s financial statements include only the funds of those organizational entities for which its elected governing board is financially accountable. The District’s major operations include education, student transportation, construction and maintenance of District facilities, food services, bookstore, and athletic functions.
MARICOPA UNIFIED SCHOOL DISTRICT NO. 20 NOTES TO FINANCIAL STATEMENTS
JUNE 30, 2015
Page 31
NOTE 1 – SUMMARY OF SIGNIFICANT ACCOUNTING POLICIES B. Government-Wide and Fund Financial Statements The government-wide financial statements (i.e., the statement of net position and the statement of activities) present financial information about the District as a whole. The reported information includes all of the nonfiduciary activities of the District. For the most part, the effect of internal activity has been removed from these statements. These statements are to distinguish between the governmental and business-type activities of the District. Governmental activities normally are supported by taxes and intergovernmental revenues, and are reported separately from business-type activities, which rely to a significant extent on fees and charges for support. The District does not have any business-type activities. The statement of activities demonstrates the degree to which the direct expenses of a given function or segment are offset by program revenues. Direct expenses are those that are clearly identifiable with a specific function or segment. Program revenues include 1) charges to customers or applicants who purchase, use, or directly benefit from goods, services, or privileges provided by a given function or segment and 2) grants and contributions that are restricted to meeting the operational or capital requirements of a particular function or segment. Taxes, unrestricted federal, state, and county aid, and other items not included among program revenues are reported instead as general revenues. Separate financial statements are provided for governmental funds and fiduciary funds, even though the latter are excluded from the government-wide financial statements. Major individual governmental funds are reported as separate columns in the fund financial statements. C. Measurement Focus, Basis of Accounting, and Financial Statement Presentation Government-Wide Financial Statements – The government-wide financial statements are reported using the economic resources measurement focus and the accrual basis of accounting. Revenues are recorded when earned and expenses are recorded when a liability is incurred, regardless of the timing of related cash flows. Property taxes are recognized as revenues in the year for which they are levied. Grants and similar items are recognized as revenue as soon as all eligibility requirements imposed by the grantor or provider have been met. As a general rule, the effect of internal activity has been eliminated from the government-wide financial statements; however, the effects of interfund services provided and used between functions are reported as expenses and program revenues at amounts approximating their external exchange value.
MARICOPA UNIFIED SCHOOL DISTRICT NO. 20 NOTES TO FINANCIAL STATEMENTS
JUNE 30, 2015
Page 32
NOTE 1 – SUMMARY OF SIGNIFICANT ACCOUNTING POLICIES Fund Financial Statements – Governmental fund financial statements are reported using the current financial resources measurement focus and the modified accrual basis of accounting. Revenues are recognized as soon as they are both measurable and available. Revenues are considered to be available when they are collectible within the current period or soon enough thereafter to pay liabilities of the current period. For this purpose, the District considers revenues to be available if they are collected within 60 days of the end of the current fiscal period. Expenditures generally are recorded when a liability is incurred, as under accrual accounting. However, debt service expenditures, as well as expenditures related to compensated absences, and claims and judgments, are recorded only when payment is due. Property taxes, federal, state and county aid, tuition and investment income associated with the current fiscal period are all considered to be susceptible to accrual and have been recognized as revenues of the current fiscal period. Food services and miscellaneous revenues are not susceptible to accrual because generally they are not measurable until received in cash. Grants and similar awards are recognized as revenue as soon as all eligibility requirements imposed by the grantor or provider have been met. Unearned revenues arise when resources are received by the District before it has legal claim to them, as when grant monies are received prior to meeting all eligibility requirements imposed by the provider. Delinquent property taxes and other receivables that will not be collected within the available period have been reported as unavailable revenues on the governmental fund financial statements. The focus of governmental fund financial statements is on major funds rather than reporting funds by type. Each major fund is presented in a separate column. Non-major funds are aggregated and presented in a single column. Fiduciary funds are reported by fund type. The District reports the following major governmental funds:
General Fund – The General Fund is the District’s primary operating fund. It accounts for all resources used to finance District maintenance and operation except those required to be accounted for in other funds. The General Fund includes the District’s Maintenance and Operation Fund as well as certain activities budgeted in separate funds in accordance with A.R.S. These funds are maintained as separate funds for budgetary purposes but do not meet the criteria for separate reporting in the financial statements. Unrestricted Capital Outlay Fund – The Unrestricted Capital Outlay Fund accounts for transactions relating to the acquisition of capital items.
MARICOPA UNIFIED SCHOOL DISTRICT NO. 20 NOTES TO FINANCIAL STATEMENTS
JUNE 30, 2015
Page 33
NOTE 1 – SUMMARY OF SIGNIFICANT ACCOUNTING POLICIES
Additionally, the District reports the following fund type: Fiduciary Funds – The Fiduciary Funds are Agency Funds which account for resources held by the District on behalf of others. This fund type includes the Student Activities Fund which accounts for monies raised by students to finance student clubs and organizations held by the District as an agent. In addition, funds that account for employee withholdings before the monies are remitted to the appropriate entities are included in the Agency Funds.
The agency funds are custodial in nature and do not have a measurement focus and are reported on the accrual basis of accounting. The agency funds are reported by fund type. D. Cash and Investments A.R.S. require the District to deposit all cash with the County Treasurer, except as discussed below. Cash with the County Treasurer is pooled for investment purposes, except for cash of the Debt Service and Bond Building Funds that may be invested separately. Interest earned from investments purchased with pooled monies is allocated to each of the District’s funds based on their average balances. As required by statute, interest earnings of the Bond Building Fund are recorded initially in that fund, but then transferred to the Debt Service Fund. All investments are stated at fair value. Statute authorizes the District to separately invest monies of the Bond Building and Debt Service Funds in the State Treasurer’s investment pools; obligations issued and guaranteed by the United States or any of its agencies or instrumentalities; specified state and local government bonds and notes; and interest bearing savings accounts or certificates of deposit. Statute authorizes the District to deposit monies of the Auxiliary Operations and Student Activities Funds in bank accounts. Monies in these funds may also be invested. In addition, statute authorizes the District to maintain various bank accounts such as clearing accounts to temporarily deposit receipts before they are transmitted to the County Treasurer; revolving accounts to pay minor disbursements; and withholdings accounts for taxes and employee insurance programs. Some of these bank accounts may be interest bearing. Statute does not include any requirements for credit risk, concentration of credit risk, interest rate risk, or foreign currency risk. Statute requires collateral for deposits of Bond Building and Debt Service Funds monies in interest bearing savings accounts and certificates of deposit at 101 percent of all deposits not covered by federal depository insurance.
MARICOPA UNIFIED SCHOOL DISTRICT NO. 20 NOTES TO FINANCIAL STATEMENTS
JUNE 30, 2015
Page 34
NOTE 1 – SUMMARY OF SIGNIFICANT ACCOUNTING POLICIES
Arizona statute requires a pooled collateral program for public deposits and a Statewide Collateral Pool Administrator (Administrator) in the State Treasurer’s Office. The purpose of the pooled collateral program is to ensure that governmental entities’ public deposits placed in participating depositories are secured with collateral of 102 percent of the public deposits, less any applicable deposit insurance. An eligible depository may not retain or accept any public deposit unless it has deposited the required collateral with a qualified escrow agent or the Administrator. The Administrator manages the pooled collateral program, including reporting on each depository’s compliance with the program.
E. Investment Income Investment income is composed of interest, dividends, and net changes in the fair value of applicable investments. Investment income is included in other local revenue in the fund financial statements. F. Receivables and Payables Activity between funds that is representative of lending/borrowing arrangements outstanding at the end of the fiscal year is referred to as either “due to/from other funds” (i.e., the current portion of interfund loans) or “advances to/from other funds” (i.e., the non-current portion of interfund loans). All other outstanding balances between funds are reported as “due to/from other funds.” Interfund balances between governmental funds are eliminated on the Statement of Net Position. All receivables, including property taxes receivable, are shown net of an allowance for uncollectibles. G. Property Tax Calendar The County Treasurer is responsible for collecting property taxes for all governmental entities within the county. The county levies real and personal property taxes on or before the third Monday in August that become due and payable in two equal installments. The first installment is due on the first day of October and becomes delinquent after the first business day of November. The second installment is due on the first day of March of the next year and becomes delinquent after the first business day of May. Pursuant to A.R.S., a lien against assessed real and personal property attaches on the first day of January preceding assessment and levy; however according to case law, an enforceable legal claim to the asset does not arise.
MARICOPA UNIFIED SCHOOL DISTRICT NO. 20 NOTES TO FINANCIAL STATEMENTS
JUNE 30, 2015
Page 35
NOTE 1 – SUMMARY OF SIGNIFICANT ACCOUNTING POLICIES H. Prepaid Items Certain payments to vendors reflect costs applicable to future accounting periods and are recorded as prepaid items in both the government-wide and fund financial statements. I. Capital Assets Capital assets, which include land and improvements; buildings and improvements; vehicles, furniture, and equipment; and construction in progress, are reported in the government-wide financial statements. Land and improvements and buildings and improvements are defined by the District as assets with an initial, individual cost in excess of $5,000 and an estimated useful life of more than one year. Vehicles, furniture and equipment are defined by the District as assets with an initial, individual cost in excess of $5,000 and an estimated useful life of more than one year. Such assets are recorded at historical cost, or estimated historical cost if actual historical cost is not available. Donated capital assets are recorded at the estimated fair market value at the date of donation. The costs of normal maintenance and repairs that do not add to the value of the asset or materially extend the life of the asset are not capitalized. Capital assets are depreciated using the straight-line method over the following estimated useful lives:
Land improvements 10 – 50 years Buildings and improvements 20 – 50 years Vehicles, furniture and equipment 5 – 25 years
J. Deferred Outflows/Inflows of Resources In addition to assets, the statement of financial position may report a separate section for deferred outflows of resources. This separate financial statement element, deferred outflows of resources, represents a consumption of net position that applies to a future period and so will not be recognized as an outflow of resources (expense/expenditure) until then. In addition to liabilities, the statement of financial position may report a separate section for deferred inflows of resources. This separate financial statement element, deferred inflows of resources, represents an acquisition of net position that applies to a future period and so will not be recognized as an inflow of resources (revenue) until that time.

MARICOPA UNIFIED SCHOOL DISTRICT NO. 20 NOTES TO FINANCIAL STATEMENTS
JUNE 30, 2015
Page 36
NOTE 1 – SUMMARY OF SIGNIFICANT ACCOUNTING POLICIES K. Compensated Absences The District’s employee vacation and sick leave policies generally provide for granting vacation and sick leave with pay in varying amounts. Only benefits considered vested are recognized in the financial statements. The liability for vacation and sick leave is reported in the government-wide financial statements. A liability for these amounts is reported in governmental funds only if they have matured, for example, as a result of employee leave, resignations and retirements. Generally, resources from the General Fund are used to pay for compensated absences. L. Pensions
For purposes of measuring the net pension liability, deferred outflows of resources and deferred inflows of resources related to pensions, and pension expense, information about the pension plan’s fiduciary net position and additions to/deductions from the plan’s fiduciary net position have been determined on the same basis as they are reported by the plan. For this purpose, benefit payments (including refunds of employee contributions) are recognized when due and payable in accordance with the benefit terms. Investments are reported at fair value.
M. Long-term Obligations In the government-wide financial statements, long-term debt and other long-term obligations are reported as liabilities on the statement of net position. Bond premiums and discounts, as well as the difference between the reacquisition price and the net carrying amount of the old debt, are deferred and amortized over the life of the bonds using the straight-line method over the term of the related debt. In the fund financial statements, governmental fund types recognize bond premiums and discounts, as well as bond issuance costs, during the current period. The face amount of debt issued is reported as other financing sources. Premiums received on debt issuances are reported as other financing sources while discounts on debt issuances are reported as other financing uses. Issuance costs, whether or not withheld from the actual debt proceeds received, are reported as debt service expenditures. N. Interfund Activity Flows of cash from one fund to another without a requirement for repayment are reported as interfund transfers. Interfund transfers between governmental funds are eliminated in the Statement of Activities. Interfund transfers in the fund financial statements are reported as other financing sources/uses in governmental funds.
MARICOPA UNIFIED SCHOOL DISTRICT NO. 20 NOTES TO FINANCIAL STATEMENTS
JUNE 30, 2015
Page 37
NOTE 1 – SUMMARY OF SIGNIFICANT ACCOUNTING POLICIES O. Net Position Flow Assumption In the government-wide financial statements the District applies restricted resources first when outlays are incurred for purposes for which either restricted or unrestricted amounts are available. P. Estimates The preparation of the financial statements in conformity with accounting principles generally accepted in the United States of America requires management to make estimates and assumptions that affect the amounts reported in the financial statements and accompanying notes. Actual results may differ from those estimates.
NOTE 2 – FUND BALANCE CLASSIFICATIONS
Fund balances of the governmental funds are reported separately within classifications based on a hierarchy of the constraints placed on the use of those resources. The classifications are based on the relative strength of the constraints that control how the specific amounts can be spent. The classifications are nonspendable, restricted, and unrestricted, which includes committed, assigned, and unassigned fund balance classifications. Nonspendable. The nonspendable fund balance classification includes amounts that cannot be spent because they are not in spendable form, or legally or contractually required to be maintained intact. Restricted. Fund balance is reported as restricted when constraints placed on the use of resources are either externally imposed by creditors (such as through debt covenants), grantors, contributors, or laws or regulations of other governments or is imposed by law through constitutional provisions or enabling legislation. Committed. The committed fund balance classification includes amounts that can be used only for the specific purposes imposed by formal action of the Governing Board. Those committed amounts cannot be used for any other purpose unless the Governing Board removes or changes the specified use by taking the same type of action it employed to previously commit those amounts. The District does not have a formal policy or procedures for the utilization of committed fund balance, accordingly, no committed fund balance amounts are reported.

MARICOPA UNIFIED SCHOOL DISTRICT NO. 20 NOTES TO FINANCIAL STATEMENTS
JUNE 30, 2015
Page 38
NOTE 2 – FUND BALANCE CLASSIFICATIONS
Assigned. Amounts in the assigned fund balance classification are intended to be used by the District for specific purposes but do not meet the criteria to be classified as restricted or committed. In governmental funds other than the General Fund, assigned fund balance represents the remaining amount that is not restricted or committed. In the General Fund, assigned amounts represent intended uses established by the Governing Board or a management official delegated that authority by the formal Governing Board action. The District does not have a formal policy or procedures for the utilization of assigned fund balance, accordingly, no assigned fund balance amounts are reported. Unassigned. Unassigned fund balance is the residual classification for the General Fund and includes all spendable amounts not contained in the other classifications. In other governmental funds, the unassigned classification is used only to report a deficit balance resulting from overspending for specific purposes for which amounts had been restricted, committed, or assigned.
The District applies restricted resources first when outlays are incurred for purposes for which either restricted or unrestricted (committed, assigned, and unassigned) amounts are available. Similarly, within unrestricted fund balance, committed amounts are reduced first followed by assigned, and then unassigned amounts when expenditures are incurred for purposes for which amounts in any of the unrestricted fund balance classifications could be used. The table below provides detail of the major components of the District’s fund balance classifications at year end.
General Fund
Unrestricted Capital Outlay
Fund
Non-Major Governmental
Funds Fund Balances:
Restricted: Debt service $ $ $ 283,000 Capital projects 4,798,814 643,155 Voter approved initiatives: Classroom site 94,807 Instructional improvement 390,975Federal and state projects 393,681 Food service 1,060,839 Civic center 475,339 Community school 257,740 Extracurricular activities 139,101 County, City, and Town grants 361,286 Other purposes 111,875
Unassigned 3,223,047 Total fund balances $ 3,223,047 $ 4,798,814 $ 4,211,798
MARICOPA UNIFIED SCHOOL DISTRICT NO. 20 NOTES TO FINANCIAL STATEMENTS
JUNE 30, 2015
Page 39
NOTE 3 – STEWARDSHIP, COMPLIANCE AND ACCOUNTABILITY Excess Expenditures Over Budget – At year end, the District had expenditures in funds that exceeded the budgets, however, this does not constitute a violation of any legal provisions.
NOTE 4 – CASH AND INVESTMENTS Custodial Credit Risk – Deposits. Custodial credit risk is the risk that in the event of bank failure the District’s deposits may not be returned to the District. The District does not have a deposit policy for custodial credit risk. At year end, the carrying amount of the District’s deposits was $564,999, and the bank balance was $1,581,489. At year end, $1,310,206 of the District’s deposits were covered by collateral held by the pledging financial institution in the District’s name. The County Treasurer’s pool is an external investment pool with no regulatory oversight. The pool is not required to register (and is not registered) with the Securities and Exchange Commission. The fair value of each participant’s position in the County Treasurer investment pool approximates the value of the participant’s shares in the pool and the participants’ shares are not identified with specific investments. At year end, the District’s investments consisted of the following:
Average Maturities Fair Value County Treasurer’s investment pool 1.66 years $ 1,615,145 Total $ 1,615,145
Interest Rate Risk. The District does not have a formal investment policy that limits investment maturities as a means of managing its exposure to fair value losses arising from increasing interest rates. Credit Risk. The District has no investment policy that would further limit its investment choices. As of year end, the District’s investment in the County Treasurer’s investment pool did not receive a credit quality rating from a national rating agency. Custodial Credit Risk – Investments. The District’s investment in the County Treasurer’s investment pool represents a proportionate interest in the pool’s portfolio; however, the District’s portion is not identified with specific investments and is not subject to custodial credit risk.

MARICOPA UNIFIED SCHOOL DISTRICT NO. 20 NOTES TO FINANCIAL STATEMENTS
JUNE 30, 2015
Page 40
NOTE 5 – RECEIVABLES Receivable balances, net of allowance for uncollectibles, have been disaggregated by type and presented separately in the financial statements with the exception of due from governmental entities. Due from governmental entities, net of allowance for uncollectibles, as of year end for the District’s individual major funds and non-major governmental funds in the aggregate, were as follows:
General Fund
Unrestricted Capital Outlay
Fund
Non-MajorGovernmental
FundsDue from other governmental entities:
Due from federal government $ $ $ 1,149,590Due from state government 6,999,364 1,469,626 271,832 Due from county government 988,279 201,129
Net due from governmental entities $ 7,987,643 $ 1,670,755 $ 1,421,422 NOTE 6 – CAPITAL ASSETS
A summary of capital asset activity for the current fiscal year follows:
Governmental Activities Beginning Balance Increase Decrease
Ending Balance
Capital assets, not being depreciated: Land $ 14,512,800 $ $ $ 14,512,800 Construction in progress 101,686 101,811 203,497
Total capital assets, not being depreciated 14,614,486 101,811 203,497 14,512,800 Capital assets, being depreciated:
Land improvements 2,862,345 417,165 3,279,510 Buildings and improvements 154,780,350 57,663 154,838,013 Vehicles, furniture and equipment 10,191,753 724,143 160,340 10,755,556
Total capital assets being depreciated 167,834,448 1,198,971 160,340 168,873,079 Less accumulated depreciation for:
Land improvements (1,356,668) (209,511) (1,566,179)Buildings and improvements (23,012,018) (2,916,613) (25,928,631)Vehicles, furniture and equipment (7,567,379) (509,409) (125,825) (7,950,963)
Total accumulated depreciation (31,936,065) (3,635,533) (125,825) (35,445,773)
Total capital assets, being depreciated, net 135,898,383 (2,436,562) 34,515 133,427,306 Governmental activities capital assets, net $ 150,512,869 $ (2,334,751) $ 238,012 $ 147,940,106
MARICOPA UNIFIED SCHOOL DISTRICT NO. 20 NOTES TO FINANCIAL STATEMENTS
JUNE 30, 2015
Page 41
NOTE 6 – CAPITAL ASSETS Depreciation expense was charged to governmental functions as follows:
Instruction $ 2,881,155 Support services – students and staff 11,394 Support services – administration 206,285 Operation and maintenance of plant services 165,789 Student transportation services 363,068 Operation of non-instructional services 7,842 Total depreciation expense – governmental activities $ 3,635,533
NOTE 7 – OBLIGATIONS UNDER CAPITAL LEASES
The District has acquired copiers under the provisions of long-term lease agreements classified as capital leases. These lease agreements qualify as capital leases for accounting purposes and, therefore, have been recorded at the present value of their future minimum lease payments as of the inception date. Revenues from the Unrestricted Capital Outlay Fund are used to pay the capital lease obligations. Amortization of assets recorded under capital leases is included with depreciation expense. The assets acquired through capital leases that meet the District’s capitalization threshold are as follows:
Governmental
Activities Asset:
Vehicles, furniture and equipment $ 167,388 Less: Accumulated depreciation 50,099
Total $ 117,289

MARICOPA UNIFIED SCHOOL DISTRICT NO. 20 NOTES TO FINANCIAL STATEMENTS
JUNE 30, 2015
Page 42
NOTE 7 – OBLIGATIONS UNDER CAPITAL LEASES The future minimum lease obligations and the net present value of these minimum lease payments at year end were as follows:
Year Ending June 30: Governmental
Activities 2016 $ 50,726 2017 42,160 2018 24,347 2019 10,685
Total minimum lease payments 127,918 Less: amount representing interest 16,036 Present value of minimum lease payments 111,882 Due within one year $ 42,575
NOTE 8 – GENERAL OBLIGATION BONDS PAYABLE
Bonds payable at year end, consisted of the following outstanding general obligation bonds. The bonds are both callable and noncallable with interest payable semiannually. Property taxes from the Debt Service Fund are used to pay bonded debt.
Purpose
Original Amount Issued
Interest Rates
Remaining Maturities
Outstanding Principal
June 30, 2015Due WithinOne Year
Governmental activities: School Improvement Bonds, Project of 2006, A, Series 2007
$ 11,250,000 4.0-5.0% 7/1/16-26 $ 8,180,000 $ 585,000
School Improvement Bonds, Project of 2006, B, Series 2007
16,705,000 4.125-5.0% 7/1/16-27 12,635,000 555,000
School Improvement Bonds, Project of 2006, C, Series 2008
14,500,000 4.0-5.0% 7/1/16-28 10,735,000 630,000
School Improvement Bonds, Project of 2006, D, Series 2010
3,865,000 3.0-4.125% 7/1/16-29 1,410,000 85,000
School Improvement Bonds, Project of 2006, E, Series 2010
3,160,000 4.5% 7/1/28-29 3,160,000
Refunding Bonds, Series 2011 2,260,000 4.0-5.0% 7/1/20-25 2,260,000 Total $ 38,380,000 $ 1,855,000
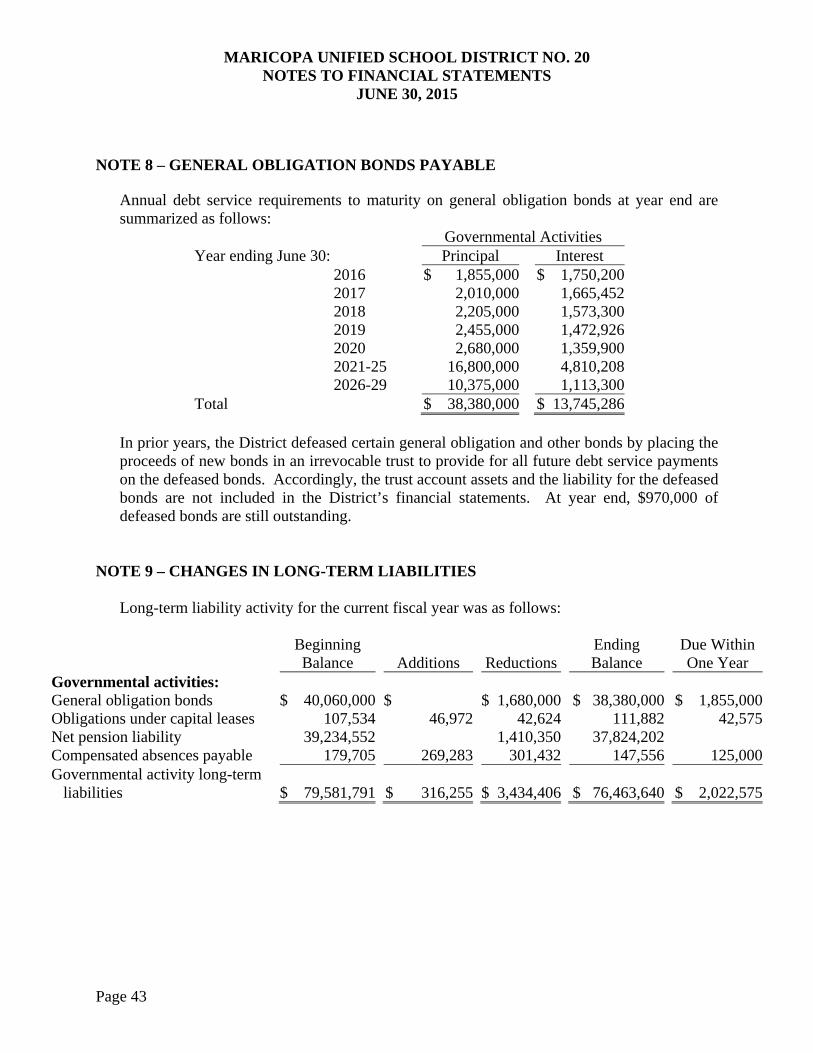
MARICOPA UNIFIED SCHOOL DISTRICT NO. 20 NOTES TO FINANCIAL STATEMENTS
JUNE 30, 2015
Page 43
NOTE 8 – GENERAL OBLIGATION BONDS PAYABLE Annual debt service requirements to maturity on general obligation bonds at year end are summarized as follows:
Governmental Activities Year ending June 30: Principal Interest
2016 $ 1,855,000 $ 1,750,200 2017 2,010,000 1,665,452 2018 2,205,000 1,573,300 2019 2,455,000 1,472,926 2020 2,680,000 1,359,900 2021-25 16,800,000 4,810,208 2026-29 10,375,000 1,113,300
Total $ 38,380,000 $ 13,745,286 In prior years, the District defeased certain general obligation and other bonds by placing the proceeds of new bonds in an irrevocable trust to provide for all future debt service payments on the defeased bonds. Accordingly, the trust account assets and the liability for the defeased bonds are not included in the District’s financial statements. At year end, $970,000 of defeased bonds are still outstanding.
NOTE 9 – CHANGES IN LONG-TERM LIABILITIES
Long-term liability activity for the current fiscal year was as follows:
Beginning Balance Additions Reductions
Ending Balance
Due Within One Year
Governmental activities: General obligation bonds $ 40,060,000 $ $ 1,680,000 $ 38,380,000 $ 1,855,000 Obligations under capital leases 107,534 46,972 42,624 111,882 42,575 Net pension liability 39,234,552 1,410,350 37,824,202 Compensated absences payable 179,705 269,283 301,432 147,556 125,000 Governmental activity long-term
liabilities $ 79,581,791 $ 316,255 $ 3,434,406 $ 76,463,640 $ 2,022,575

MARICOPA UNIFIED SCHOOL DISTRICT NO. 20 NOTES TO FINANCIAL STATEMENTS
JUNE 30, 2015
Page 44
NOTE 10 – INTERFUND RECEIVABLES, PAYABLES, AND TRANSFERS At year end, interfund balances were as follows: Due to/from other funds:
Unrestricted Capital Outlay
Fund
Non-Major Governmental
Funds
Total Due to Other Funds
General Fund $ 3,179,144 $ 1,368,471 $ 4,547,615 Non-Major Governmental Funds 931,067 931,067 Total Due from Other Funds $ 3,179,144 $ 2,299,538 $ 5,478,682 At year end, several funds had a negative cash balance in the Treasurer’s pooled cash accounts. Negative cash on deposit with the County Treasurer was reduced by interfund borrowing with other funds. All interfund balances are expected to be paid within one year. At year end, interfund balances were as follows: Interfund transfers:
Transfers in
Transfers outGeneral
FundUnrestricted Capital Outlay Fund $ 3,000,000 Non-Major Governmental Funds 303,617Total $ 3,303,617
Transfers between funds were used to (1) move federal grant funds restricted for indirect costs and (2) to move excess cash to the General Fund to reduce taxes as allowed by statute.
NOTE 11 – CONTINGENT LIABILITIES
Compliance – Amounts received or receivable from grantor agencies are subject to audit and adjustment by grantor agencies, principally the federal government. Any disallowed claims, including amounts already collected, may constitute a liability of the applicable funds. The amount, if any, of expenditures/expenses that may be disallowed by the grantor cannot be determined at this time, although the District expects such amounts, if any, to be immaterial.
MARICOPA UNIFIED SCHOOL DISTRICT NO. 20 NOTES TO FINANCIAL STATEMENTS
JUNE 30, 2015
Page 45
NOTE 12 – RISK MANAGEMENT The District is exposed to various risks of loss related to torts; theft of, damage to, and destruction of assets; errors and omissions; injuries to employees; and natural disasters. The District was unable to obtain general property, liability and workers’ compensation insurance at a cost it considered to be economically justifiable. Therefore, the District joined the Arizona School Risk Retention Trust, Inc. (ASRRT). ASRRT is a public entity risk pool currently operating as a common risk management and insurance program for school districts and community colleges in the State. The District pays an annual premium to ASRRT for its general insurance coverage. The agreement provides that ASRRT will be self-sustaining through member premiums and will reinsure through commercial companies for claims in excess of specified amounts. The District’s employees have health and accident insurance coverage with the Arizona School Board Association Insurance Trust (ASBAIT). ASBAIT is a public entity risk pool currently operating as a common risk management and insurance program for school districts in the State. The District pays a monthly premium to ASBAIT for employees’ health and accident insurance coverage. The agreement provides that ASBAIT will be self-sustaining through member premiums and will reinsure through commercial companies for claims in excess of specified amounts. The District joined the Arizona School Alliance for Workers’ Compensation, Inc. (Alliance) together with other school districts in the state for risks of loss related to workers’ compensation claims. The Alliance is a public entity risk pool currently operating as a common risk management and insurance program for school districts in the State. The District pays quarterly premiums to the Alliance for its employee workers’ compensation coverage. The agreement provides that the Alliance will be self-sustaining through members’ premiums and will reinsure through commercial companies for claims in excess of specified amounts for each insured event. The District continues to carry commercial insurance for all other risks of loss, including dental, vision, life, and disability. Settled claims resulting from these risks have not exceeded commercial insurance coverage in any of the past three fiscal years.
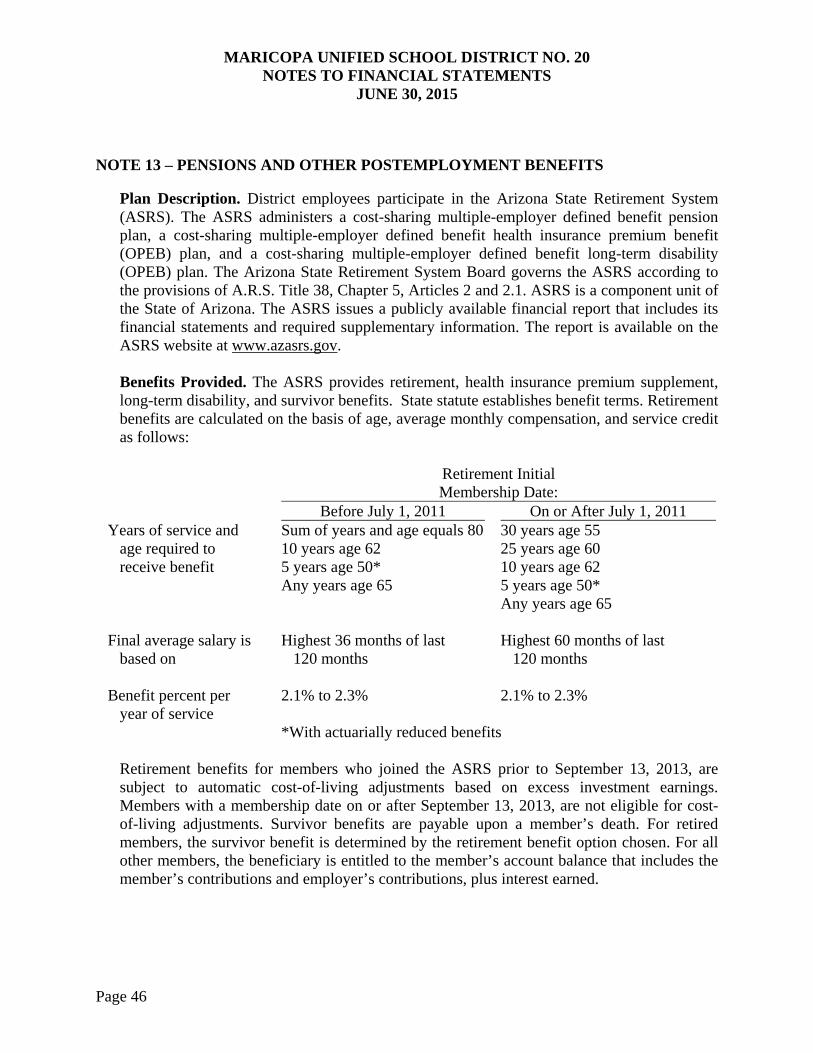
MARICOPA UNIFIED SCHOOL DISTRICT NO. 20 NOTES TO FINANCIAL STATEMENTS
JUNE 30, 2015
Page 46
NOTE 13 – PENSIONS AND OTHER POSTEMPLOYMENT BENEFITS Plan Description. District employees participate in the Arizona State Retirement System (ASRS). The ASRS administers a cost-sharing multiple-employer defined benefit pension plan, a cost-sharing multiple-employer defined benefit health insurance premium benefit (OPEB) plan, and a cost-sharing multiple-employer defined benefit long-term disability (OPEB) plan. The Arizona State Retirement System Board governs the ASRS according to the provisions of A.R.S. Title 38, Chapter 5, Articles 2 and 2.1. ASRS is a component unit of the State of Arizona. The ASRS issues a publicly available financial report that includes its financial statements and required supplementary information. The report is available on the ASRS website at www.azasrs.gov. Benefits Provided. The ASRS provides retirement, health insurance premium supplement, long-term disability, and survivor benefits. State statute establishes benefit terms. Retirement benefits are calculated on the basis of age, average monthly compensation, and service credit as follows:
Retirement Initial Membership Date:
Before July 1, 2011 On or After July 1, 2011 Years of service and
age required to receive benefit
Sum of years and age equals 80 10 years age 62 5 years age 50* Any years age 65
30 years age 55 25 years age 60 10 years age 62 5 years age 50* Any years age 65
Final average salary is
based on Highest 36 months of last
120 months Highest 60 months of last
120 months Benefit percent per
year of service 2.1% to 2.3% 2.1% to 2.3%
*With actuarially reduced benefits
Retirement benefits for members who joined the ASRS prior to September 13, 2013, are subject to automatic cost-of-living adjustments based on excess investment earnings. Members with a membership date on or after September 13, 2013, are not eligible for cost-of-living adjustments. Survivor benefits are payable upon a member’s death. For retired members, the survivor benefit is determined by the retirement benefit option chosen. For all other members, the beneficiary is entitled to the member’s account balance that includes the member’s contributions and employer’s contributions, plus interest earned.
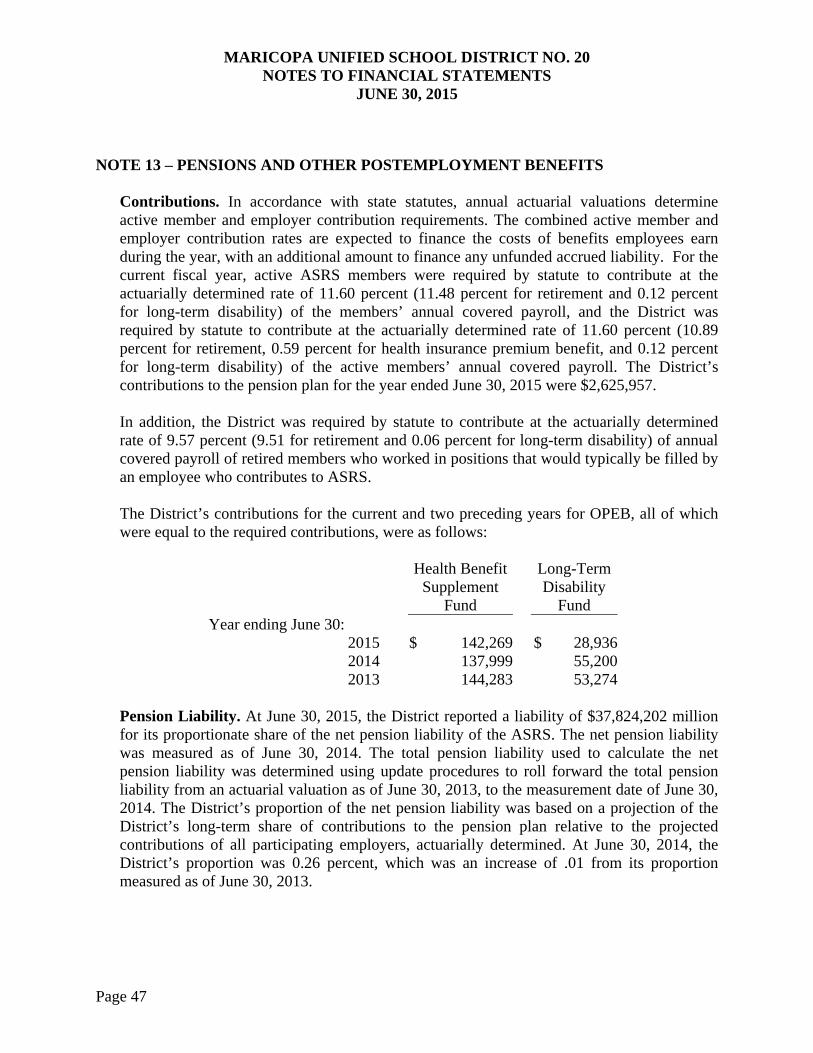
MARICOPA UNIFIED SCHOOL DISTRICT NO. 20 NOTES TO FINANCIAL STATEMENTS
JUNE 30, 2015
Page 47
NOTE 13 – PENSIONS AND OTHER POSTEMPLOYMENT BENEFITS Contributions. In accordance with state statutes, annual actuarial valuations determine active member and employer contribution requirements. The combined active member and employer contribution rates are expected to finance the costs of benefits employees earn during the year, with an additional amount to finance any unfunded accrued liability. For the current fiscal year, active ASRS members were required by statute to contribute at the actuarially determined rate of 11.60 percent (11.48 percent for retirement and 0.12 percent for long-term disability) of the members’ annual covered payroll, and the District was required by statute to contribute at the actuarially determined rate of 11.60 percent (10.89 percent for retirement, 0.59 percent for health insurance premium benefit, and 0.12 percent for long-term disability) of the active members’ annual covered payroll. The District’s contributions to the pension plan for the year ended June 30, 2015 were $2,625,957. In addition, the District was required by statute to contribute at the actuarially determined rate of 9.57 percent (9.51 for retirement and 0.06 percent for long-term disability) of annual covered payroll of retired members who worked in positions that would typically be filled by an employee who contributes to ASRS.
The District’s contributions for the current and two preceding years for OPEB, all of which were equal to the required contributions, were as follows:
Health Benefit Supplement
Fund
Long-Term Disability
Fund Year ending June 30:
2015 $ 142,269 $ 28,9362014 137,999 55,2002013 144,283 53,274
Pension Liability. At June 30, 2015, the District reported a liability of $37,824,202 million for its proportionate share of the net pension liability of the ASRS. The net pension liability was measured as of June 30, 2014. The total pension liability used to calculate the net pension liability was determined using update procedures to roll forward the total pension liability from an actuarial valuation as of June 30, 2013, to the measurement date of June 30, 2014. The District’s proportion of the net pension liability was based on a projection of the District’s long-term share of contributions to the pension plan relative to the projected contributions of all participating employers, actuarially determined. At June 30, 2014, the District’s proportion was 0.26 percent, which was an increase of .01 from its proportion measured as of June 30, 2013.
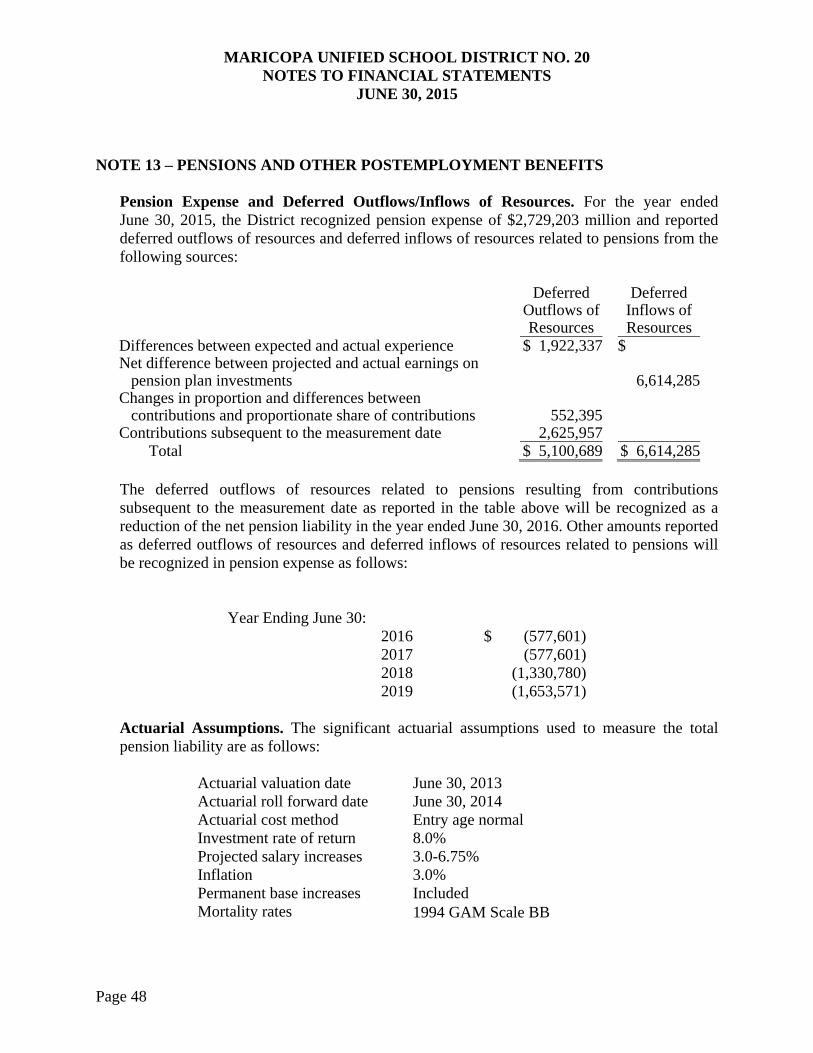
MARICOPA UNIFIED SCHOOL DISTRICT NO. 20 NOTES TO FINANCIAL STATEMENTS
JUNE 30, 2015
Page 48
NOTE 13 – PENSIONS AND OTHER POSTEMPLOYMENT BENEFITS
Pension Expense and Deferred Outflows/Inflows of Resources. For the year ended June 30, 2015, the District recognized pension expense of $2,729,203 million and reported deferred outflows of resources and deferred inflows of resources related to pensions from the following sources:
Deferred Outflows of Resources
Deferred Inflows of Resources
Differences between expected and actual experience $ 1,922,337 $ Net difference between projected and actual earnings on
pension plan investments 6,614,285Changes in proportion and differences between
contributions and proportionate share of contributions 552,395Contributions subsequent to the measurement date 2,625,957
Total $ 5,100,689 $ 6,614,285 The deferred outflows of resources related to pensions resulting from contributions subsequent to the measurement date as reported in the table above will be recognized as a reduction of the net pension liability in the year ended June 30, 2016. Other amounts reported as deferred outflows of resources and deferred inflows of resources related to pensions will be recognized in pension expense as follows:
Year Ending June 30:
2016 $ (577,601)2017 (577,601)2018 (1,330,780)2019 (1,653,571)
Actuarial Assumptions. The significant actuarial assumptions used to measure the total pension liability are as follows:
Actuarial valuation date June 30, 2013 Actuarial roll forward date June 30, 2014 Actuarial cost method Entry age normal Investment rate of return 8.0% Projected salary increases 3.0-6.75% Inflation 3.0% Permanent base increases Included Mortality rates 1994 GAM Scale BB
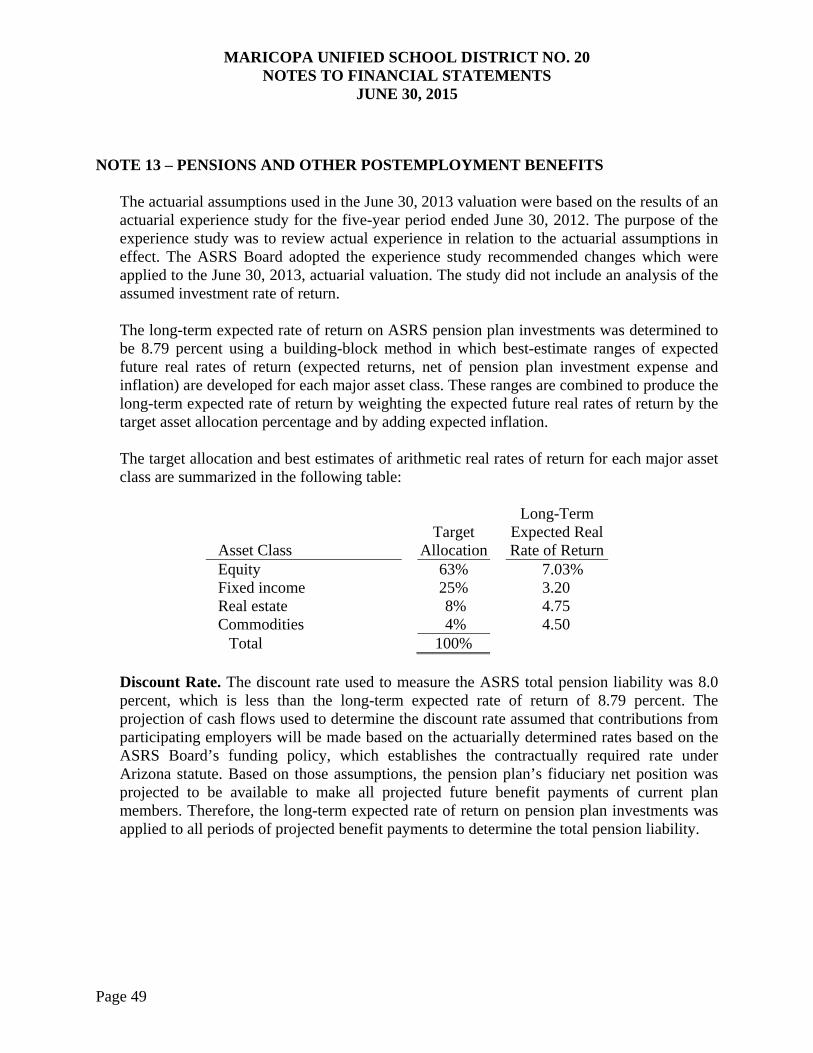
MARICOPA UNIFIED SCHOOL DISTRICT NO. 20 NOTES TO FINANCIAL STATEMENTS
JUNE 30, 2015
Page 49
NOTE 13 – PENSIONS AND OTHER POSTEMPLOYMENT BENEFITS
The actuarial assumptions used in the June 30, 2013 valuation were based on the results of an actuarial experience study for the five-year period ended June 30, 2012. The purpose of the experience study was to review actual experience in relation to the actuarial assumptions in effect. The ASRS Board adopted the experience study recommended changes which were applied to the June 30, 2013, actuarial valuation. The study did not include an analysis of the assumed investment rate of return. The long-term expected rate of return on ASRS pension plan investments was determined to be 8.79 percent using a building-block method in which best-estimate ranges of expected future real rates of return (expected returns, net of pension plan investment expense and inflation) are developed for each major asset class. These ranges are combined to produce the long-term expected rate of return by weighting the expected future real rates of return by the target asset allocation percentage and by adding expected inflation. The target allocation and best estimates of arithmetic real rates of return for each major asset class are summarized in the following table:
Asset Class Target
Allocation
Long-Term Expected Real Rate of Return
Equity 63% 7.03% Fixed income 25% 3.20 Real estate 8% 4.75 Commodities 4% 4.50
Total 100%
Discount Rate. The discount rate used to measure the ASRS total pension liability was 8.0 percent, which is less than the long-term expected rate of return of 8.79 percent. The projection of cash flows used to determine the discount rate assumed that contributions from participating employers will be made based on the actuarially determined rates based on the ASRS Board’s funding policy, which establishes the contractually required rate under Arizona statute. Based on those assumptions, the pension plan’s fiduciary net position was projected to be available to make all projected future benefit payments of current plan members. Therefore, the long-term expected rate of return on pension plan investments was applied to all periods of projected benefit payments to determine the total pension liability.
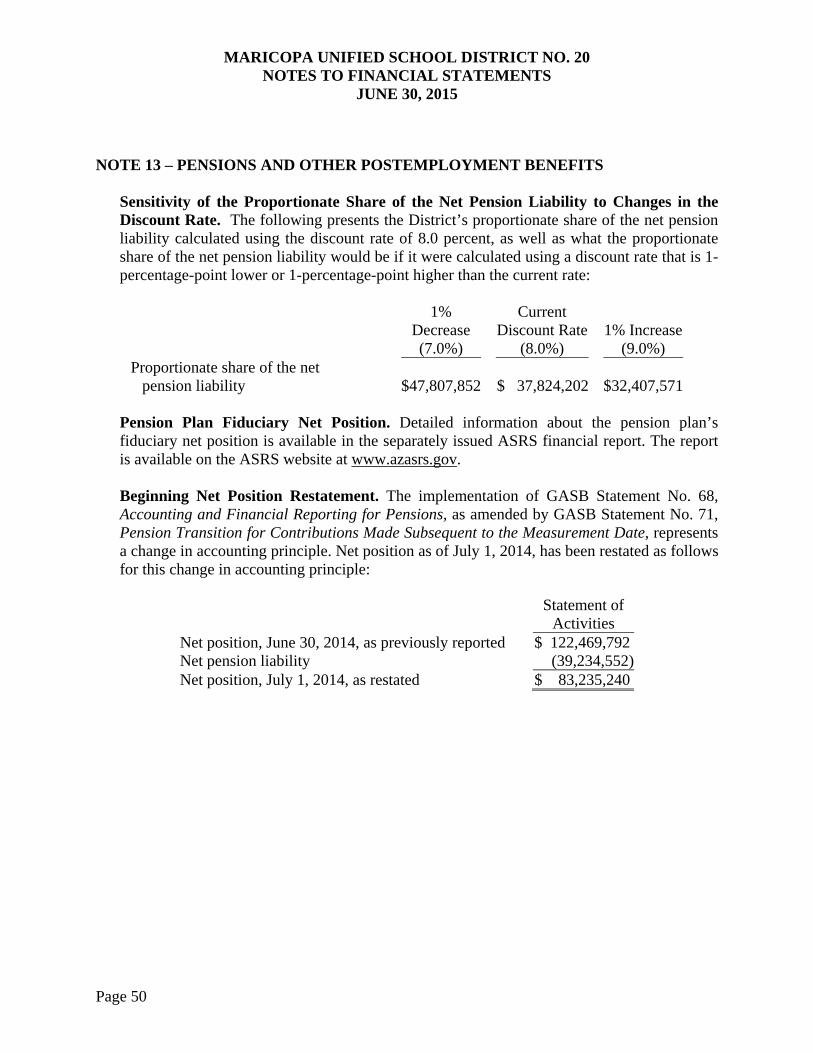
MARICOPA UNIFIED SCHOOL DISTRICT NO. 20 NOTES TO FINANCIAL STATEMENTS
JUNE 30, 2015
Page 50
NOTE 13 – PENSIONS AND OTHER POSTEMPLOYMENT BENEFITS
Sensitivity of the Proportionate Share of the Net Pension Liability to Changes in the Discount Rate. The following presents the District’s proportionate share of the net pension liability calculated using the discount rate of 8.0 percent, as well as what the proportionate share of the net pension liability would be if it were calculated using a discount rate that is 1-percentage-point lower or 1-percentage-point higher than the current rate:
1%
Decrease (7.0%)
Current Discount Rate
(8.0%) 1% Increase
(9.0%) Proportionate share of the net
pension liability $47,807,852 $ 37,824,202 $32,407,571
Pension Plan Fiduciary Net Position. Detailed information about the pension plan’s fiduciary net position is available in the separately issued ASRS financial report. The report is available on the ASRS website at www.azasrs.gov. Beginning Net Position Restatement. The implementation of GASB Statement No. 68, Accounting and Financial Reporting for Pensions, as amended by GASB Statement No. 71, Pension Transition for Contributions Made Subsequent to the Measurement Date, represents a change in accounting principle. Net position as of July 1, 2014, has been restated as follows for this change in accounting principle:
Statement of
Activities Net position, June 30, 2014, as previously reported $ 122,469,792 Net pension liability (39,234,552)Net position, July 1, 2014, as restated $ 83,235,240

Page 51
REQUIRED SUPPLEMENTARY INFORMATION
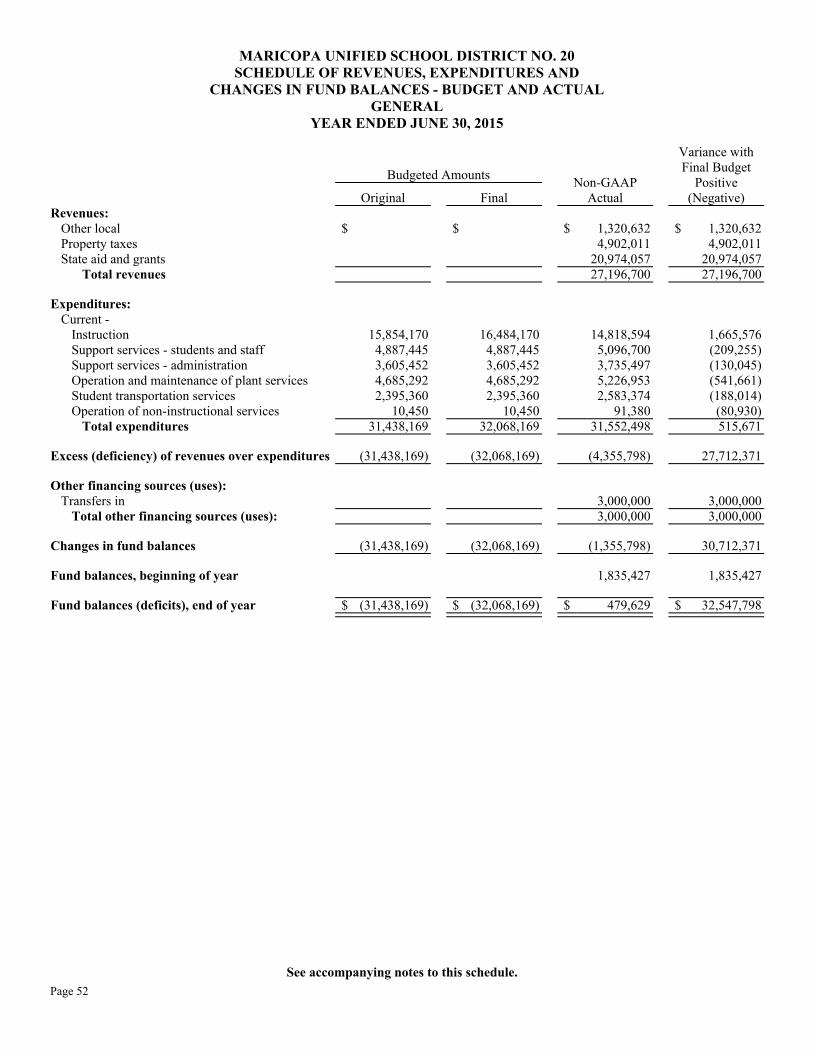
Revenues:Other localProperty taxesState aid and grants
Total revenues
Expenditures:Current -
InstructionSupport services - students and staffSupport services - administrationOperation and maintenance of plant servicesStudent transportation servicesOperation of non-instructional services
Total expenditures
Excess (deficiency) of revenues over expenditures
Other financing sources (uses):Transfers in
Total other financing sources (uses):
Changes in fund balances
Fund balances, beginning of year
Fund balances (deficits), end of year
Budgeted Amounts
Original
$
15,854,1704,887,4453,605,4524,685,2922,395,360
10,45031,438,169
(31,438,169)
(31,438,169)
$ (31,438,169)
Final
$
16,484,1704,887,4453,605,4524,685,2922,395,360
10,45032,068,169
(32,068,169)
(32,068,169)
$ (32,068,169)
Non-GAAP Actual
$ 1,320,6324,902,011
20,974,05727,196,700
14,818,5945,096,7003,735,4975,226,9532,583,374
91,38031,552,498
(4,355,798)
3,000,0003,000,000
(1,355,798)
1,835,427
$ 479,629
Variance with Final Budget
Positive (Negative)
$ 1,320,6324,902,011
20,974,05727,196,700
1,665,576(209,255)(130,045)(541,661)(188,014)(80,930)515,671
27,712,371
3,000,0003,000,000
30,712,371
1,835,427
$ 32,547,798
MARICOPA UNIFIED SCHOOL DISTRICT NO. 20SCHEDULE OF REVENUES, EXPENDITURES AND
CHANGES IN FUND BALANCES - BUDGET AND ACTUALGENERAL
YEAR ENDED JUNE 30, 2015
Page 52See accompanying notes to this schedule.
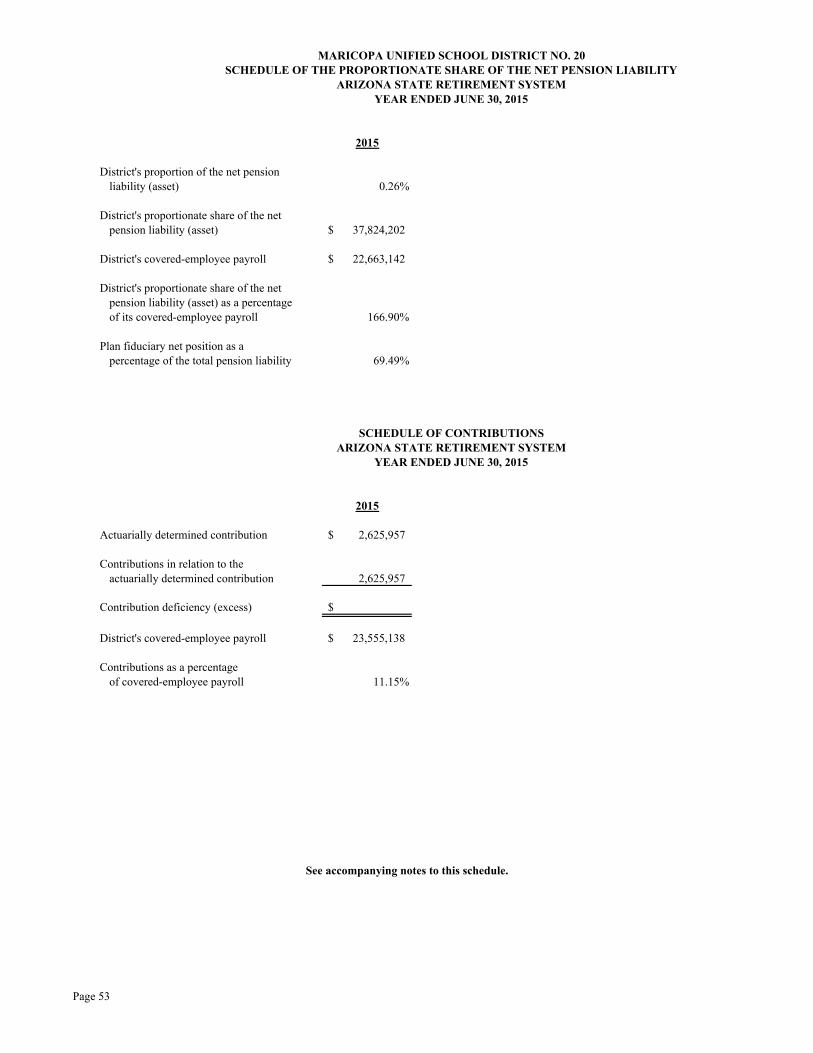
2015 2014 2013 2012
District's proportion of the net pensionliability (asset) 0.26% 0.00% 0.00% 0.00%
District's proportionate share of the netpension liability (asset) 37,824,202$ $ $ $
District's covered-employee payroll 22,663,142$ $ $ $
District's proportionate share of the net pension liability (asset) as a percentageof its covered-employee payroll 166.90% #DIV/0! #DIV/0! #DIV/0!
Plan fiduciary net position as a percentage of the total pension liability 69.49% 0.00% 0.00% 0.00%
2015 2014 2013 2012
Actuarially determined contribution 2,625,957$ $ $ $
Contributions in relation to the actuarially determined contribution 2,625,957
Contribution deficiency (excess) $ $ $ $
District's covered-employee payroll 23,555,138$ $ $ $
Contributions as a percentageof covered-employee payroll 11.15% #DIV/0! #DIV/0! #DIV/0!
ARIZONA STATE RETIREMENT SYSTEM
YEAR ENDED JUNE 30, 2015
MARICOPA UNIFIED SCHOOL DISTRICT NO. 20SCHEDULE OF THE PROPORTIONATE SHARE OF THE NET PENSION LIABILITY
YEAR ENDED JUNE 30, 2015
See accompanying notes to this schedule.
SCHEDULE OF CONTRIBUTIONSARIZONA STATE RETIREMENT SYSTEM
Page 53
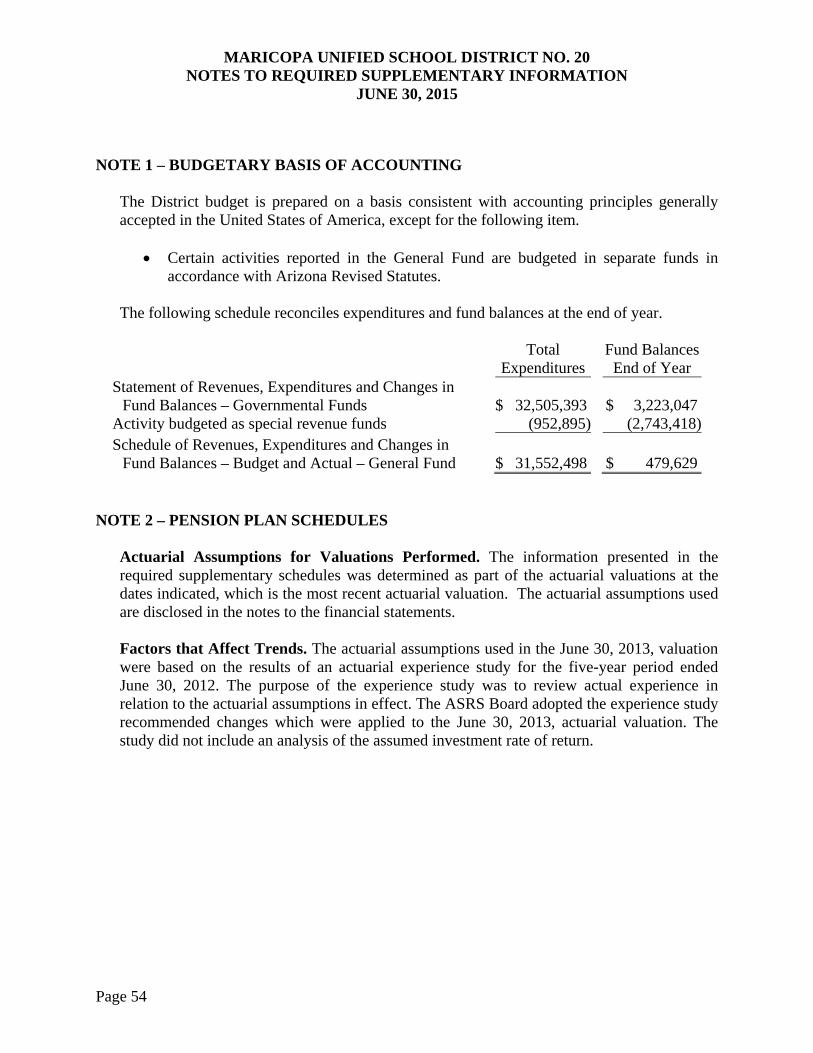
MARICOPA UNIFIED SCHOOL DISTRICT NO. 20 NOTES TO REQUIRED SUPPLEMENTARY INFORMATION
JUNE 30, 2015
Page 54
NOTE 1 – BUDGETARY BASIS OF ACCOUNTING The District budget is prepared on a basis consistent with accounting principles generally accepted in the United States of America, except for the following item.
Certain activities reported in the General Fund are budgeted in separate funds in accordance with Arizona Revised Statutes.
The following schedule reconciles expenditures and fund balances at the end of year.
Total
Expenditures Fund Balances
End of Year Statement of Revenues, Expenditures and Changes in
Fund Balances – Governmental Funds $ 32,505,393 $ 3,223,047 Activity budgeted as special revenue funds (952,895) (2,743,418)Schedule of Revenues, Expenditures and Changes in
Fund Balances – Budget and Actual – General Fund $ 31,552,498 $ 479,629
NOTE 2 – PENSION PLAN SCHEDULES Actuarial Assumptions for Valuations Performed. The information presented in the required supplementary schedules was determined as part of the actuarial valuations at the dates indicated, which is the most recent actuarial valuation. The actuarial assumptions used are disclosed in the notes to the financial statements. Factors that Affect Trends. The actuarial assumptions used in the June 30, 2013, valuation were based on the results of an actuarial experience study for the five-year period ended June 30, 2012. The purpose of the experience study was to review actual experience in relation to the actuarial assumptions in effect. The ASRS Board adopted the experience study recommended changes which were applied to the June 30, 2013, actuarial valuation. The study did not include an analysis of the assumed investment rate of return.

Page 55
COMBINING AND INDIVIDUAL FUND FINANCIAL STATEMENTS
AND SCHEDULES

Page 56
(This page intentionally left blank)

Page 57
GOVERNMENTAL FUNDS

ASSETSCash and investmentsProperty taxes receivableDepositsDue from governmental entitiesDue from other funds
Total assets
LIABILITIES, DEFERRED INFLOWS OF RESOURCES AND FUND BALANCESLiabilities:
Accounts payableDue to other fundsAccrued payroll and employee benefitsUnearned revenues
Total liabilities
Deferred inflows of resources:Unavailable revenues - property taxesUnavailable revenues - intergovernmental
Total deferred inflows of resources
Fund balances:Restricted
Total fund balances
Total liabilities, deferred inflows of resourcesand fund balances
Special Revenue
$ 1,231,101
73,2641,421,4221,815,518
$ 4,541,305
$ 125,977931,06740,6745,525
1,103,243
152,419152,419
3,285,6433,285,643
$ 4,541,305
Debt Service
$ 257,53953,249
$ 310,788
$
27,788
27,788
283,000283,000
$ 310,788
Capital Projects
$ 167,179352
484,020$ 651,551
$ 8,229
8,229
167
167
643,155643,155
$ 651,551
MARICOPA UNIFIED SCHOOL DISTRICT NO. 20COMBINING BALANCE SHEET - ALL NON-MAJOR GOVERNMENTAL FUNDS - BY FUND TYPE
JUNE 30, 2015
Page 58
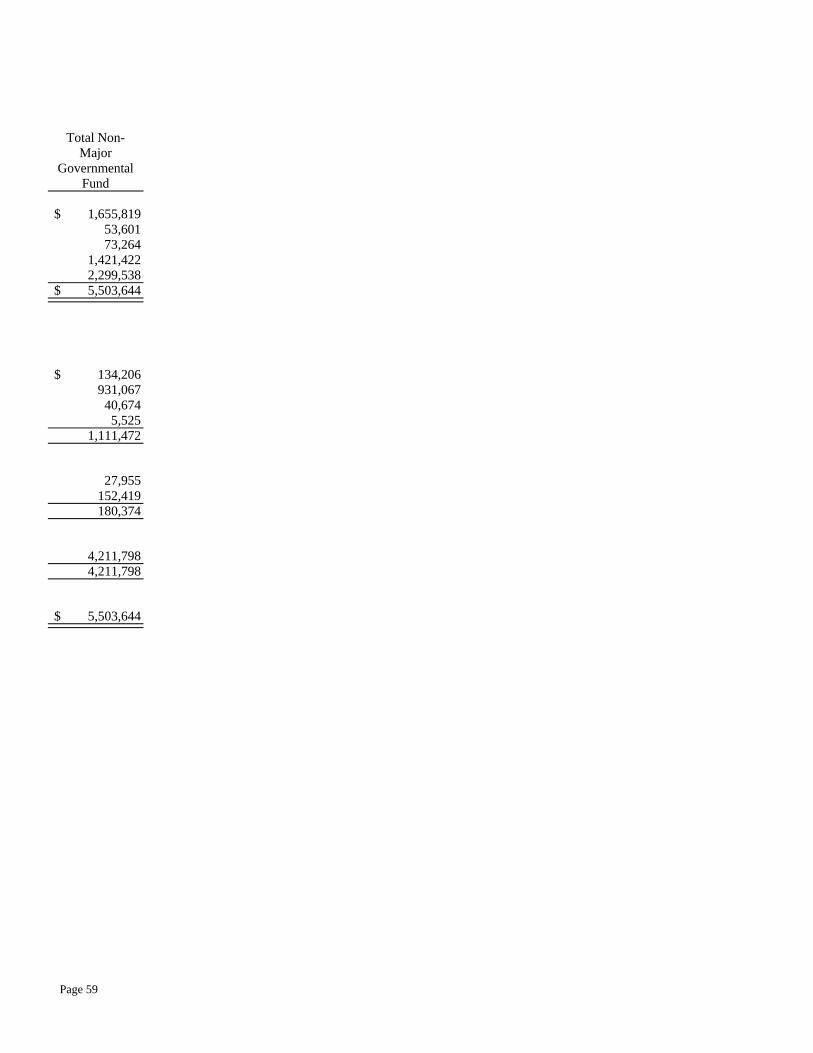
Total Non-Major
Governmental Fund
$ 1,655,81953,60173,264
1,421,4222,299,538
$ 5,503,644
$ 134,206931,06740,6745,525
1,111,472
27,955152,419180,374
4,211,7984,211,798
$ 5,503,644
Page 59

Revenues:Other localProperty taxesState aid and grantsFederal aid, grants and reimbursements
Total revenues
Expenditures:Current -
InstructionSupport services - students and staffSupport services - administrationOperation and maintenance of plant servicesStudent transportation servicesOperation of non-instructional services
Capital outlayDebt service -
Principal retirementInterest and fiscal charges
Total expenditures
Excess (deficiency) of revenues over expenditures
Other financing sources (uses):Transfers out
Total other financing sources (uses):
Changes in fund balances
Fund balances, beginning of year
Fund balances, end of year
Special Revenue
$ 1,920,266
2,392,6164,954,8639,267,745
4,881,2991,220,889
241,772186,04542,250
2,128,590415,755
9,116,600
151,145
(303,617)(303,617)
(152,472)
3,438,115
$ 3,285,643
Debt Service
$ 3,6633,397,944
3,401,607
1,680,0001,826,3043,506,304
(104,697)
(104,697)
387,697
$ 283,000
Capital Projects
$ 57,44422,832
80,276
172,660
172,660
(92,384)
(92,384)
735,539
$ 643,155
MARICOPA UNIFIED SCHOOL DISTRICT NO. 20COMBINING STATEMENT OF REVENUES, EXPENDITURES AND CHANGES IN FUND BALANCES -
ALL NON-MAJOR GOVERNMENTAL FUNDS - BY FUND TYPEYEAR ENDED JUNE 30, 2015
Page 60

Total Non-Major
Governmental Funds
$ 1,981,3733,420,7762,392,6164,954,863
12,749,628
4,881,2991,220,889
241,772186,04542,250
2,128,590588,415
1,680,0001,826,304
12,795,564
(45,936)
(303,617)(303,617)
(349,553)
4,561,351
$ 4,211,798
Page 61
Page 62
SPECIAL REVENUE FUNDS Classroom Site - to account for the financial activity for the portion of state sales tax collections and permanent state school fund earnings as approved by the voters in 2000. Instructional Improvement - to account for the activity of monies received from gaming revenue. County, City and Town Grants - to account for monies received from county, city and town grants. Structured English Immersion - to account for monies received to provide for the incremental cost of instruction to English language learners. Student Success - to account for student success monies. Title I Grants - to account for financial assistance received for the purpose of improving the teaching and learning of children failing, or most at-risk of failing, to meet challenging state academic standards. Professional Development and Technology Grants - to account for financial assistance received to increase student academic achievement through improving teacher quality. Title IV Grants - to account for financial assistance received for chemical abuse awareness programs and expanding projects that benefit educational and health needs of the communities. Limited English and Immigrant Students - to account for financial assistance received for educational services and costs for limited English and immigrant children. Indian Education - to account for financial assistance received for Indian education at preschool, elementary, secondary and adult levels. Special Education Grants - to account for supplemental financial assistance received to provide a free, appropriate public education to disabled children. Vocational Education - to account for financial assistance received for preparation of individuals for employment or advancement in a career not requiring a baccalaureate or advanced degree. Homeless Education - to account for financial assistance received for the education of homeless students. Medicaid Reimbursement - to account for reimbursements related to specific health services provided to eligible students. Taylor Grazing Fees - to account for financial assistance from fees charged for sale or use of public lands, minerals and vegetation for general operating purposes. E-Rate - to account for financial assistance received for broadband internet and telecommunication costs.

Page 63
Impact Aid - to account for the activity of monies received from impact aid. Other Federal Projects - to account for financial assistance received for other supplemental federal projects. State Vocational Education - to account for financial assistance received for the preparation of individuals for employment. Other State Projects - to account for financial assistance received for other state projects. School Plant - to account for proceeds from the sale or lease of school property. Food Service - to account for the financial activity of school activities that have as their purpose the preparation and serving of regular and incidental meals and snacks in connection with school functions. Civic Center - to account for monies received from the rental of school facilities for civic activities. Community School - to account for activity related to academic and skill development for all citizens. Auxiliary Operations - to account for activity arising from bookstore, athletic and miscellaneous District related operations. Extracurricular Activities Fees Tax Credit - to account for activity related to monies collected in support of extracurricular activities to be taken as a tax credit by the tax payer in accordance with A.R.S. §43-1089.01. Gifts and Donations - to account for activity related to gifts, donations, bequests and private grants made to the District. Fingerprint - to account for activity of fingerprinting employees as mandated by the State. Textbooks - to account for monies received from students to replace or repair lost or damaged textbooks. Litigation Recovery - to account for monies received for and derived from litigation. Indirect Costs - to account for monies received from federal projects for administrative costs. Insurance Refund - to account for insurance premium payments that are refunded to the District. Grants and Gifts to Teachers - to account for grants and gifts under $1,500 received from private sources that are designated for use by a teacher for instructional purposes. Advertisement - to account for monies received from the sale of advertising. Joint Technical Education - to account for monies received from Joint Technological Education Districts for vocational education programs.

ASSETSCash and investmentsDepositsDue from governmental entitiesDue from other funds
Total assets
LIABILITIES, DEFERRED INFLOWS OF RESOURCES AND FUND BALANCESLiabilities:
Accounts payableDue to other fundsAccrued payroll and employee benefitsUnearned revenues
Total liabilities
Deferred inflows of resources:Unavailable revenues - intergovernmental
Fund balances:Restricted
Total fund balances
Total liabilities, deferred inflows of resourcesand fund balances
Classroom Site
$ 23,858
171,154
$ 195,012
$76,34723,858
100,205
94,80794,807
$ 195,012
Instructional Improvement
$ 290,297
100,678
$ 390,975
$
390,975390,975
$ 390,975
County, City, and Town
Grants
$ 386,737
$ 386,737
$ 25,451
25,451
361,286361,286
$ 386,737
MARICOPA UNIFIED SCHOOL DISTRICT NO. 20COMBINING BALANCE SHEET - ALL SPECIAL REVENUE FUNDS
JUNE 30, 2015
Page 64

Structured English
Immersion
$ 47
$ 47
$
4747
$ 47
Title I Grants
$ 7,809
260,673
$ 268,482
$ 63,578197,095
7,809
268,482
$ 268,482
Professional Development
and Technology Grants
$
46,602
$ 46,602
$46,602
46,602
$ 46,602
Title IV Grants
$
158,719
$ 158,719
$ 7,796150,923
158,719
$ 158,719
Limited English & Immigrant
Students
$
7,749
$ 7,749
$7,749
7,749
$ 7,749
Indian Education
$
18,762
$ 18,762
$18,762
18,762
$ 18,762
Page 65
(Continued)
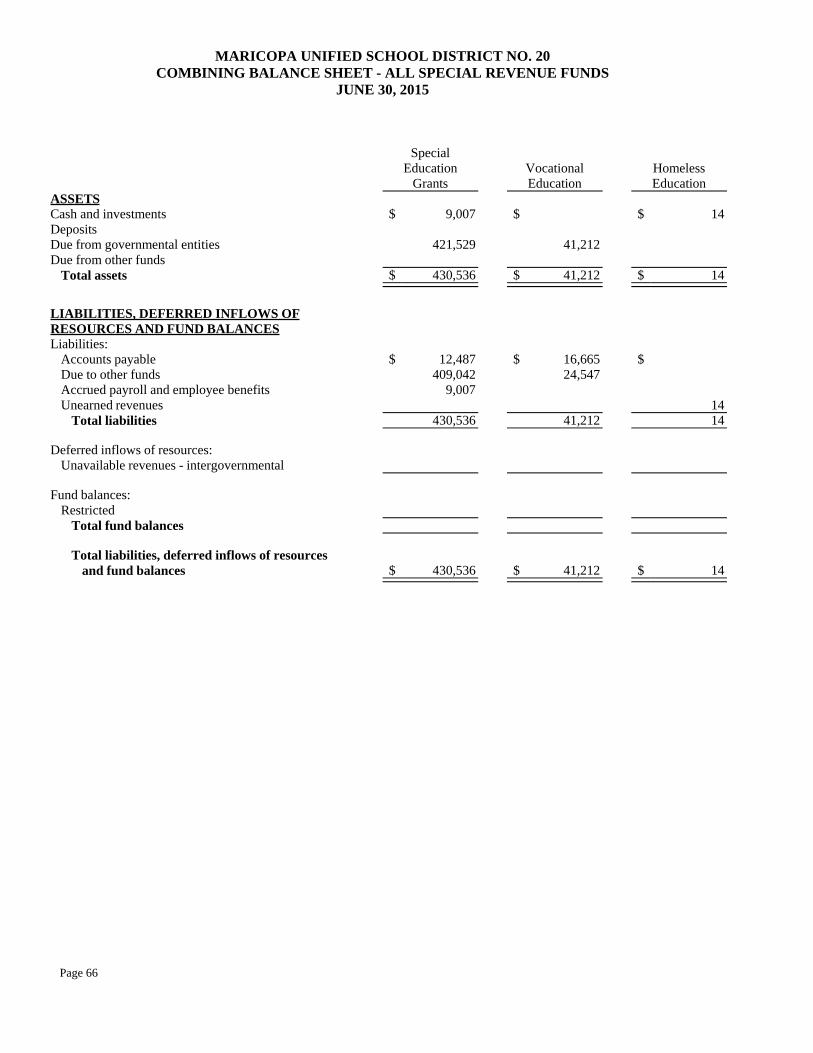
ASSETSCash and investmentsDepositsDue from governmental entitiesDue from other funds
Total assets
LIABILITIES, DEFERRED INFLOWS OF RESOURCES AND FUND BALANCESLiabilities:
Accounts payableDue to other fundsAccrued payroll and employee benefitsUnearned revenues
Total liabilities
Deferred inflows of resources:Unavailable revenues - intergovernmental
Fund balances:Restricted
Total fund balances
Total liabilities, deferred inflows of resourcesand fund balances
Special Education
Grants
$ 9,007
421,529
$ 430,536
$ 12,487409,042
9,007
430,536
$ 430,536
Vocational Education
$
41,212
$ 41,212
$ 16,66524,547
41,212
$ 41,212
Homeless Education
$ 14
$ 14
$
1414
$ 14
MARICOPA UNIFIED SCHOOL DISTRICT NO. 20COMBINING BALANCE SHEET - ALL SPECIAL REVENUE FUNDS
JUNE 30, 2015
Page 66

E-Rate
$ 327,458
152,419
$ 479,877
$
152,419
327,458327,458
$ 479,877
Other Federal Projects
$ 58,603
7,620
$ 66,223
$
66,22366,223
$ 66,223
State Vocational Education
$ 5,423
$ 5,423
$
5,4235,423
$ 5,423
Other State Projects
$ 41
$ 41
$
4141
$ 41
Food Service
$73,26434,305
953,270$ 1,060,839
$
1,060,8391,060,839
$ 1,060,839
Civic Center
$
475,339$ 475,339
$
475,339475,339
$ 475,339
Page 67
(Continued)

ASSETSCash and investmentsDepositsDue from governmental entitiesDue from other funds
Total assets
LIABILITIES, DEFERRED INFLOWS OF RESOURCES AND FUND BALANCESLiabilities:
Accounts payableDue to other fundsAccrued payroll and employee benefitsUnearned revenues
Total liabilities
Deferred inflows of resources:Unavailable revenues - intergovernmental
Fund balances:Restricted
Total fund balances
Total liabilities, deferred inflows of resourcesand fund balances
Community School
$
257,740$ 257,740
$
257,740257,740
$ 257,740
Extracurricular Activities Fees
Tax Credit
$ 9,932
129,169$ 139,101
$
139,101139,101
$ 139,101
Fingerprint
$ 1,116
$ 1,116
$
1,1161,116
$ 1,116
MARICOPA UNIFIED SCHOOL DISTRICT NO. 20COMBINING BALANCE SHEET - ALL SPECIAL REVENUE FUNDS
JUNE 30, 2015
Page 68
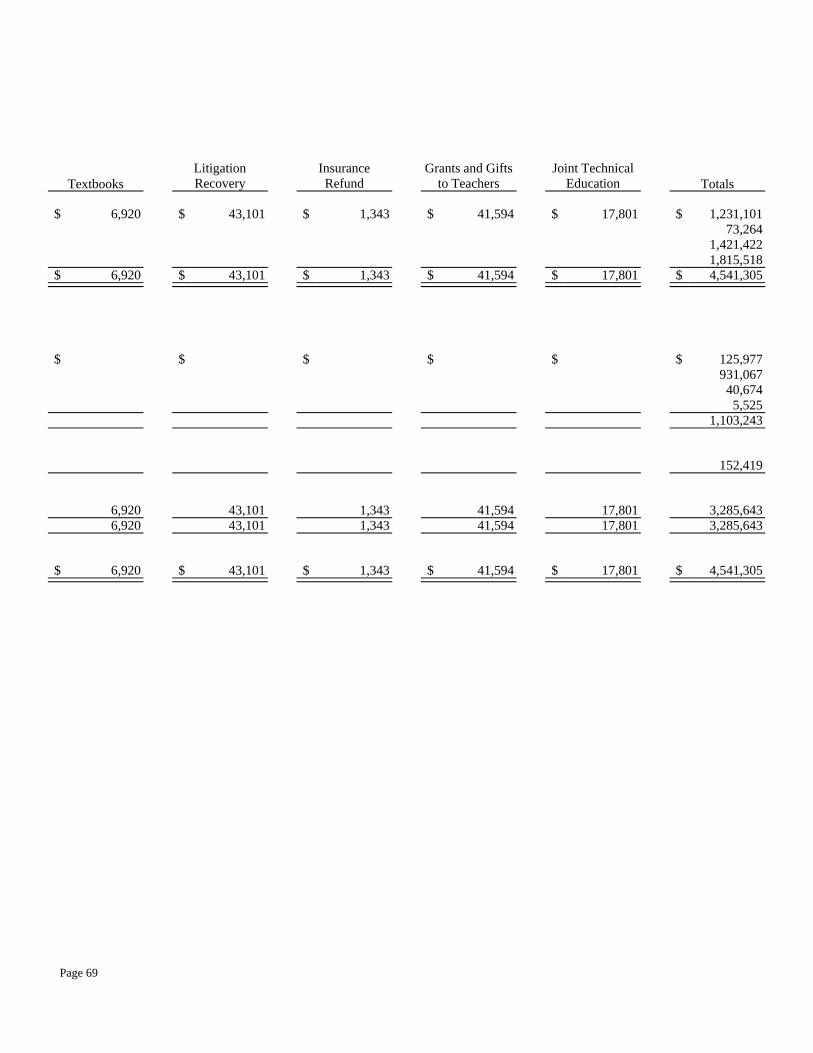
Textbooks
$ 6,920
$ 6,920
$
6,9206,920
$ 6,920
Litigation Recovery
$ 43,101
$ 43,101
$
43,10143,101
$ 43,101
Insurance Refund
$ 1,343
$ 1,343
$
1,3431,343
$ 1,343
Grants and Gifts to Teachers
$ 41,594
$ 41,594
$
41,59441,594
$ 41,594
Joint Technical Education
$ 17,801
$ 17,801
$
17,80117,801
$ 17,801
Totals
$ 1,231,10173,264
1,421,4221,815,518
$ 4,541,305
$ 125,977931,06740,6745,525
1,103,243
152,419
3,285,6433,285,643
$ 4,541,305
Page 69
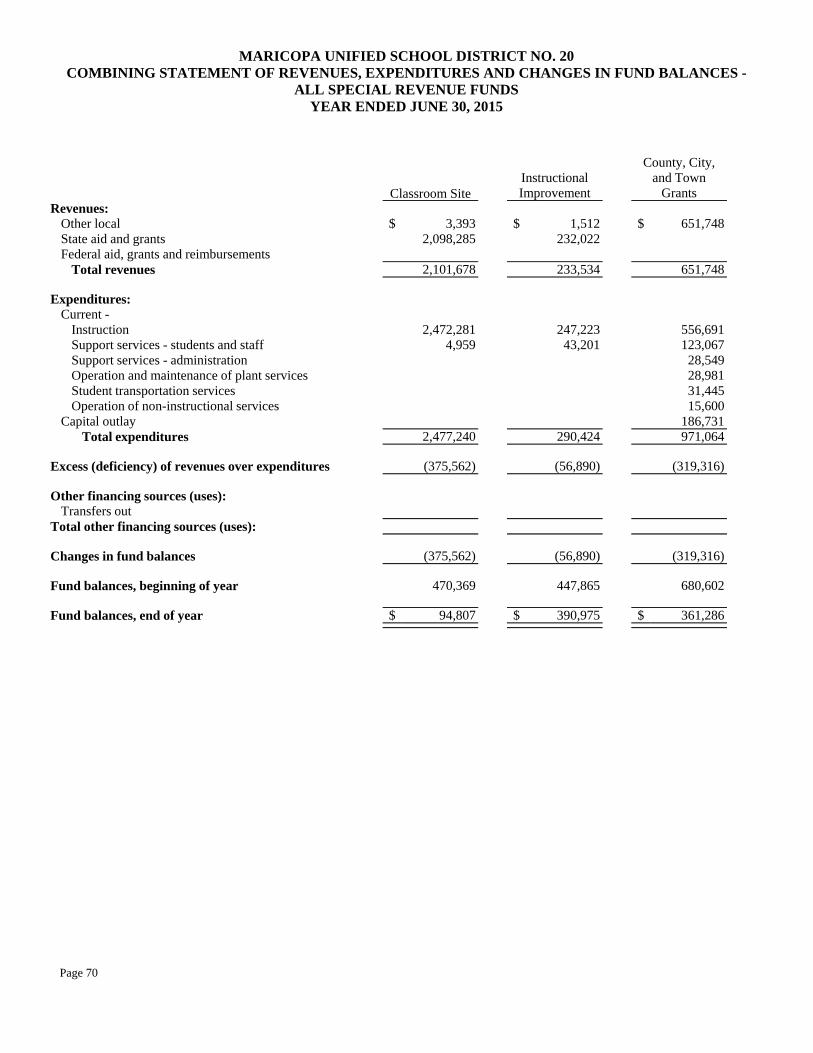
Revenues:Other localState aid and grantsFederal aid, grants and reimbursements
Total revenues
Expenditures:Current -
InstructionSupport services - students and staffSupport services - administrationOperation and maintenance of plant servicesStudent transportation servicesOperation of non-instructional services
Capital outlayTotal expenditures
Excess (deficiency) of revenues over expenditures
Other financing sources (uses):Transfers out
Total other financing sources (uses):
Changes in fund balances
Fund balances, beginning of year
Fund balances, end of year
Classroom Site
$ 3,3932,098,285
2,101,678
2,472,2814,959
2,477,240
(375,562)
(375,562)
470,369
$ 94,807
Instructional Improvement
$ 1,512232,022
233,534
247,22343,201
290,424
(56,890)
(56,890)
447,865
$ 390,975
County, City, and Town
Grants
$ 651,748
651,748
556,691123,067
28,54928,98131,44515,600
186,731971,064
(319,316)
(319,316)
680,602
$ 361,286
MARICOPA UNIFIED SCHOOL DISTRICT NO. 20COMBINING STATEMENT OF REVENUES, EXPENDITURES AND CHANGES IN FUND BALANCES -
ALL SPECIAL REVENUE FUNDSYEAR ENDED JUNE 30, 2015
Page 70

Structured English
Immersion
$11,367
11,367
11,367
11,367
$
Title I Grants
$
947,763947,763
350,854486,75222,277
54,794914,677
33,086
(33,086)(33,086)
$
Professional Development
and Technology Grants
$
83,76283,762
80,546
80,546
3,216
(3,216)(3,216)
$
Title IV Grants
$
512,434512,434
370,7871,902
104,608
16,630493,927
18,507
(18,507)(18,507)
$
Limited English & Immigrant
Students
$
48,92648,926
2,44335,622
9,90147,966
960
(960)(960)
$
Indian Education
$
61,60361,603
24,72732,3572,198
176
59,458
2,145
(2,145)(2,145)
$
Page 71
(Continued)

Revenues:Other localState aid and grantsFederal aid, grants and reimbursements
Total revenues
Expenditures:Current -
InstructionSupport services - students and staffSupport services - administrationOperation and maintenance of plant servicesStudent transportation servicesOperation of non-instructional services
Capital outlayTotal expenditures
Excess (deficiency) of revenues over expenditures
Other financing sources (uses):Transfers out
Total other financing sources (uses):
Changes in fund balances
Fund balances, beginning of year
Fund balances, end of year
Special Education
Grants
$
704,746704,746
338,915299,46226,741
14,641679,759
24,987
(24,987)(24,987)
$
Vocational Education
$
84,32484,324
32,33923,483
2,226
24,92582,973
1,351
(1,351)(1,351)
$
E-Rate
$
329,700329,700
150,118
150,118
179,582
179,582
147,876
$ 327,458
MARICOPA UNIFIED SCHOOL DISTRICT NO. 20COMBINING STATEMENT OF REVENUES, EXPENDITURES AND CHANGES IN FUND BALANCES -
ALL SPECIAL REVENUE FUNDSYEAR ENDED JUNE 30, 2015
Page 72
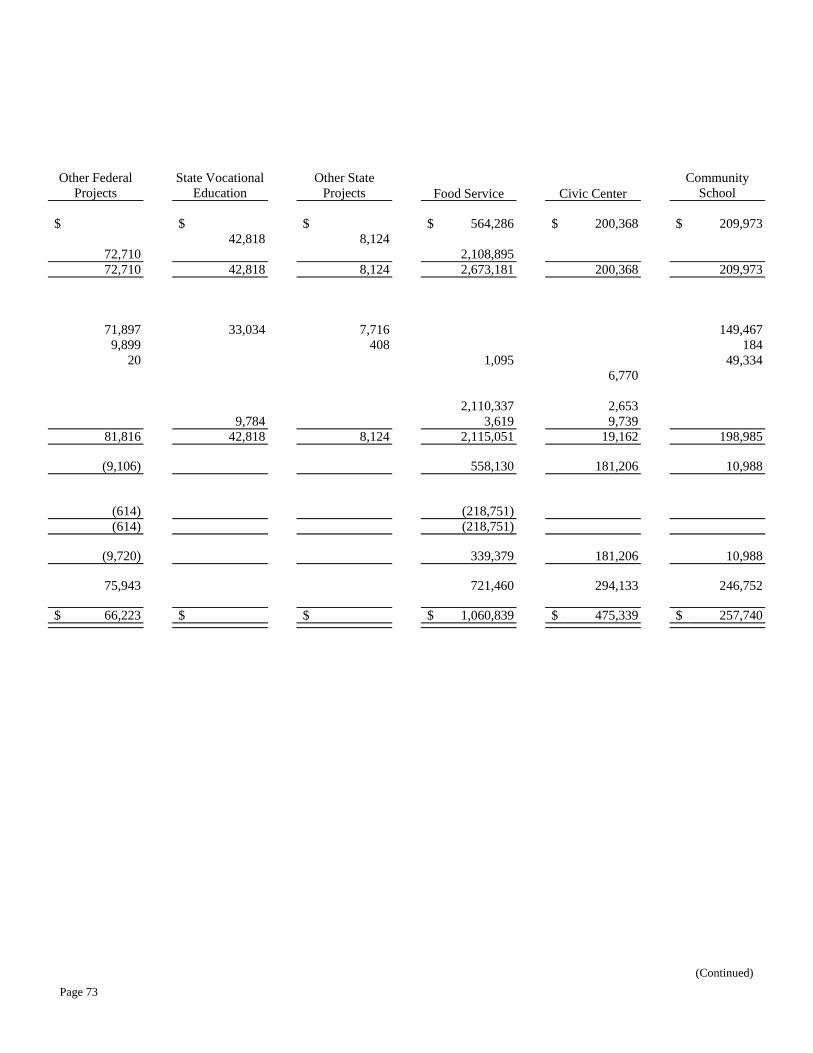
Other Federal Projects
$
72,71072,710
71,8979,899
20
81,816
(9,106)
(614)(614)
(9,720)
75,943
$ 66,223
State Vocational Education
$42,818
42,818
33,034
9,78442,818
$
Other State Projects
$8,124
8,124
7,716408
8,124
$
Food Service
$ 564,286
2,108,8952,673,181
1,095
2,110,3373,619
2,115,051
558,130
(218,751)(218,751)
339,379
721,460
$ 1,060,839
Civic Center
$ 200,368
200,368
6,770
2,6539,739
19,162
181,206
181,206
294,133
$ 475,339
Community School
$ 209,973
209,973
149,467184
49,334
198,985
10,988
10,988
246,752
$ 257,740
Page 73
(Continued)

Revenues:Other localState aid and grantsFederal aid, grants and reimbursements
Total revenues
Expenditures:Current -
InstructionSupport services - students and staffSupport services - administrationOperation and maintenance of plant servicesStudent transportation servicesOperation of non-instructional services
Capital outlayTotal expenditures
Excess (deficiency) of revenues over expenditures
Other financing sources (uses):Transfers out
Total other financing sources (uses):
Changes in fund balances
Fund balances, beginning of year
Fund balances, end of year
Extracurricular Activities Fees
Tax Credit
$ 56,148
56,148
52,965
3,400
10,805
67,170
(11,022)
(11,022)
150,123
$ 139,101
Fingerprint
$
1,116
$ 1,116
Textbooks
$ 3,222
3,222
39,631
39,631
(36,409)
(36,409)
43,329
$ 6,920
MARICOPA UNIFIED SCHOOL DISTRICT NO. 20COMBINING STATEMENT OF REVENUES, EXPENDITURES AND CHANGES IN FUND BALANCES -
ALL SPECIAL REVENUE FUNDSYEAR ENDED JUNE 30, 2015
Page 74

Litigation Recovery
$ 5,337
5,337
60,65660,656
(55,319)
(55,319)
98,420
$ 43,101
Insurance Refund
$
1,343
$ 1,343
Grants and Gifts to Teachers
$ 9,676
9,676
1,890
200
1,3963,486
6,190
6,190
35,404
$ 41,594
Joint Technical Education
$ 214,603
214,603
117,07279,0471,124
22,939220,182
(5,579)
(5,579)
23,380
$ 17,801
Totals
$ 1,920,2662,392,6164,954,8639,267,745
4,881,2991,220,889
241,772186,04542,250
2,128,590415,755
9,116,600
151,145
(303,617)(303,617)
(152,472)
3,438,115
$ 3,285,643
Page 75
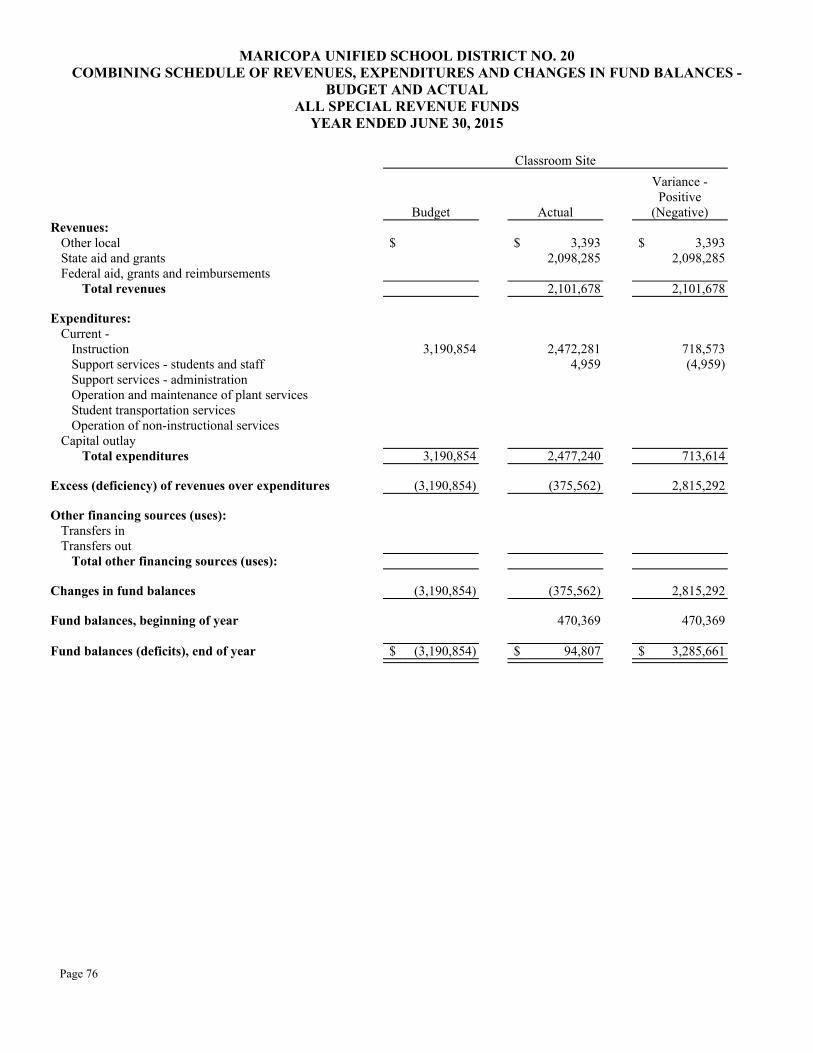
Total revenues
Revenues:Other localState aid and grantsFederal aid, grants and reimbursements
Expenditures:Current -
InstructionSupport services - students and staffSupport services - administrationOperation and maintenance of plant servicesStudent transportation servicesOperation of non-instructional services
Capital outlayTotal expenditures
Excess (deficiency) of revenues over expenditures
Other financing sources (uses):Transfers inTransfers out
Total other financing sources (uses):
Changes in fund balances
Fund balances, beginning of year
Fund balances (deficits), end of year
Classroom Site
Budget
$
3,190,854
3,190,854
(3,190,854)
(3,190,854)
$ (3,190,854)
Actual
$ 3,3932,098,285
2,101,678
2,472,2814,959
2,477,240
(375,562)
(375,562)
470,369
$ 94,807
Variance - Positive
(Negative)
$ 3,3932,098,285
2,101,678
718,573(4,959)
713,614
2,815,292
2,815,292
470,369
$ 3,285,661
MARICOPA UNIFIED SCHOOL DISTRICT NO. 20COMBINING SCHEDULE OF REVENUES, EXPENDITURES AND CHANGES IN FUND BALANCES -
BUDGET AND ACTUALALL SPECIAL REVENUE FUNDS
YEAR ENDED JUNE 30, 2015
Page 76
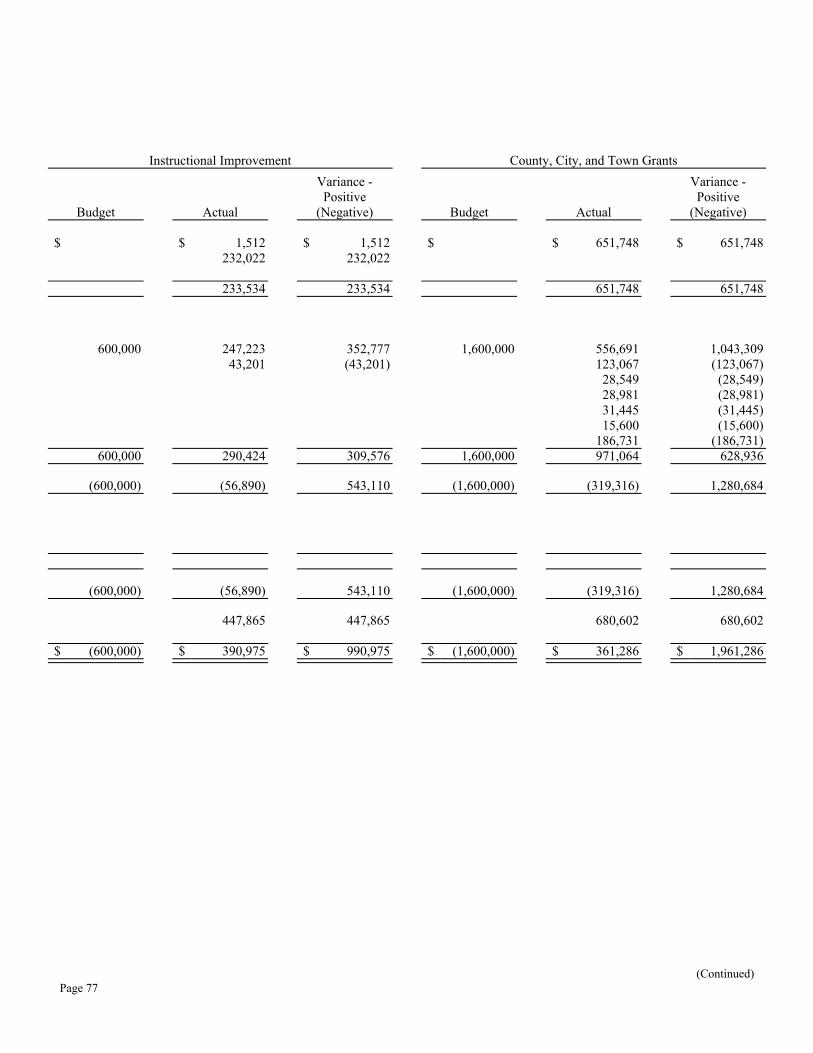
Instructional Improvement
Budget
$
600,000
600,000
(600,000)
(600,000)
$ (600,000)
Actual
$ 1,512232,022
233,534
247,22343,201
290,424
(56,890)
(56,890)
447,865
$ 390,975
Variance - Positive
(Negative)
$ 1,512232,022
233,534
352,777(43,201)
309,576
543,110
543,110
447,865
$ 990,975
County, City, and Town Grants
Budget
$
1,600,000
1,600,000
(1,600,000)
(1,600,000)
$ (1,600,000)
Actual
$ 651,748
651,748
556,691123,06728,54928,98131,44515,600
186,731971,064
(319,316)
(319,316)
680,602
$ 361,286
Variance - Positive
(Negative)
$ 651,748
651,748
1,043,309(123,067)(28,549)(28,981)(31,445)(15,600)
(186,731)628,936
1,280,684
1,280,684
680,602
$ 1,961,286
Page 77(Continued)

Total revenues
Revenues:Other localState aid and grantsFederal aid, grants and reimbursements
Expenditures:Current -
InstructionSupport services - students and staffSupport services - administrationOperation and maintenance of plant servicesStudent transportation servicesOperation of non-instructional services
Capital outlayTotal expenditures
Excess (deficiency) of revenues over expenditures
Other financing sources (uses):Transfers inTransfers out
Total other financing sources (uses):
Changes in fund balances
Fund balances, beginning of year
Fund balances (deficits), end of year
Structured English Immersion
Budget
$
100,000
100,000
(100,000)
(100,000)
$ (100,000)
Actual
$ 11,367
11,367
11,367
11,367
$
Variance - Positive
(Negative)
$ 11,367
11,367
88,633
88,633
100,000
100,000
$ 100,000
MARICOPA UNIFIED SCHOOL DISTRICT NO. 20COMBINING SCHEDULE OF REVENUES, EXPENDITURES AND CHANGES IN FUND BALANCES -
BUDGET AND ACTUALALL SPECIAL REVENUE FUNDS
YEAR ENDED JUNE 30, 2015
Page 78

Student Success
Budget
$
111,837
111,837
(111,837)
(111,837)
$ (111,837)
Non-GAAP Actual
$ 187111,839
112,026
51,491
51,491
60,535
60,535
$ 60,535
Variance - Positive
(Negative)
$ 187111,839
112,026
60,346
60,346
172,372
172,372
$ 172,372
Title I Grants
Budget
$
450,000500,000
950,000
(950,000)
(950,000)
$ (950,000)
Actual
$
947,763947,763
350,854486,75222,277
54,794914,677
33,086
(33,086)(33,086)
$
Variance - Positive
(Negative)
$
947,763947,763
99,14613,248
(22,277)
(54,794)35,323
983,086
(33,086)(33,086)
950,000
$ 950,000
Page 79(Continued)

Total revenues
Revenues:Other localState aid and grantsFederal aid, grants and reimbursements
Expenditures:Current -
InstructionSupport services - students and staffSupport services - administrationOperation and maintenance of plant servicesStudent transportation servicesOperation of non-instructional services
Capital outlayTotal expenditures
Excess (deficiency) of revenues over expenditures
Other financing sources (uses):Transfers inTransfers out
Total other financing sources (uses):
Changes in fund balances
Fund balances, beginning of year
Fund balances (deficits), end of year
Professional Development and Technology Grants
Budget
$
280,000
280,000
(280,000)
(280,000)
$ (280,000)
Actual
$
83,76283,762
80,546
80,546
3,216
(3,216)(3,216)
$
Variance - Positive
(Negative)
$
83,76283,762
199,454
199,454
283,216
(3,216)(3,216)
280,000
$ 280,000
MARICOPA UNIFIED SCHOOL DISTRICT NO. 20COMBINING SCHEDULE OF REVENUES, EXPENDITURES AND CHANGES IN FUND BALANCES -
BUDGET AND ACTUALALL SPECIAL REVENUE FUNDS
YEAR ENDED JUNE 30, 2015
Page 80

Title IV Grants
Budget
$
670,000
670,000
(670,000)
(670,000)
$ (670,000)
Actual
$
512,434512,434
370,7871,902
104,608
16,630493,927
18,507
(18,507)(18,507)
$
Variance - Positive
(Negative)
$
512,434512,434
299,213(1,902)
(104,608)
(16,630)176,073
688,507
(18,507)(18,507)
670,000
$ 670,000
Limited English & Immigrant Students
Budget
$
70,000
70,000
(70,000)
(70,000)
$ (70,000)
Actual
$
48,92648,926
2,44335,622
9,90147,966
960
(960)(960)
$
Variance - Positive
(Negative)
$
48,92648,926
(2,443)34,378
(9,901)22,034
70,960
(960)(960)
70,000
$ 70,000
Page 81(Continued)
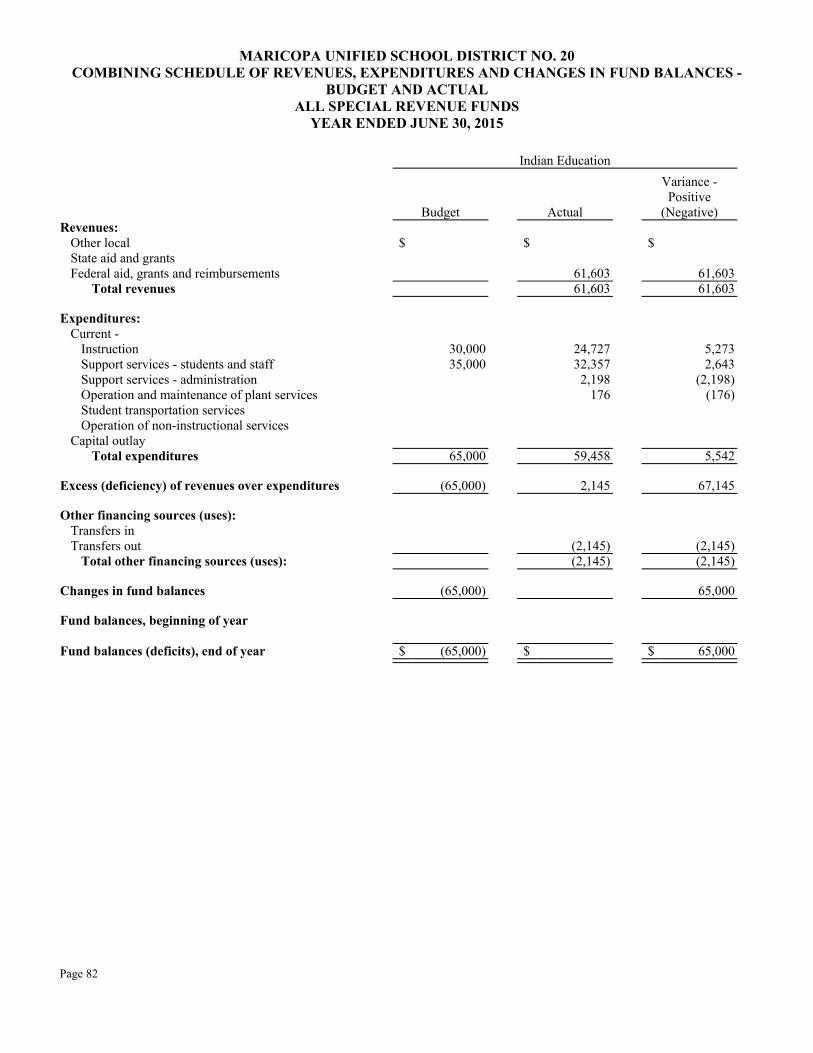
Total revenues
Revenues:Other localState aid and grantsFederal aid, grants and reimbursements
Expenditures:Current -
InstructionSupport services - students and staffSupport services - administrationOperation and maintenance of plant servicesStudent transportation servicesOperation of non-instructional services
Capital outlayTotal expenditures
Excess (deficiency) of revenues over expenditures
Other financing sources (uses):Transfers inTransfers out
Total other financing sources (uses):
Changes in fund balances
Fund balances, beginning of year
Fund balances (deficits), end of year
Indian Education
Budget
$
30,00035,000
65,000
(65,000)
(65,000)
$ (65,000)
Actual
$
61,60361,603
24,72732,3572,198
176
59,458
2,145
(2,145)(2,145)
$
Variance - Positive
(Negative)
$
61,60361,603
5,2732,643
(2,198)(176)
5,542
67,145
(2,145)(2,145)
65,000
$ 65,000
MARICOPA UNIFIED SCHOOL DISTRICT NO. 20COMBINING SCHEDULE OF REVENUES, EXPENDITURES AND CHANGES IN FUND BALANCES -
BUDGET AND ACTUALALL SPECIAL REVENUE FUNDS
YEAR ENDED JUNE 30, 2015
Page 82
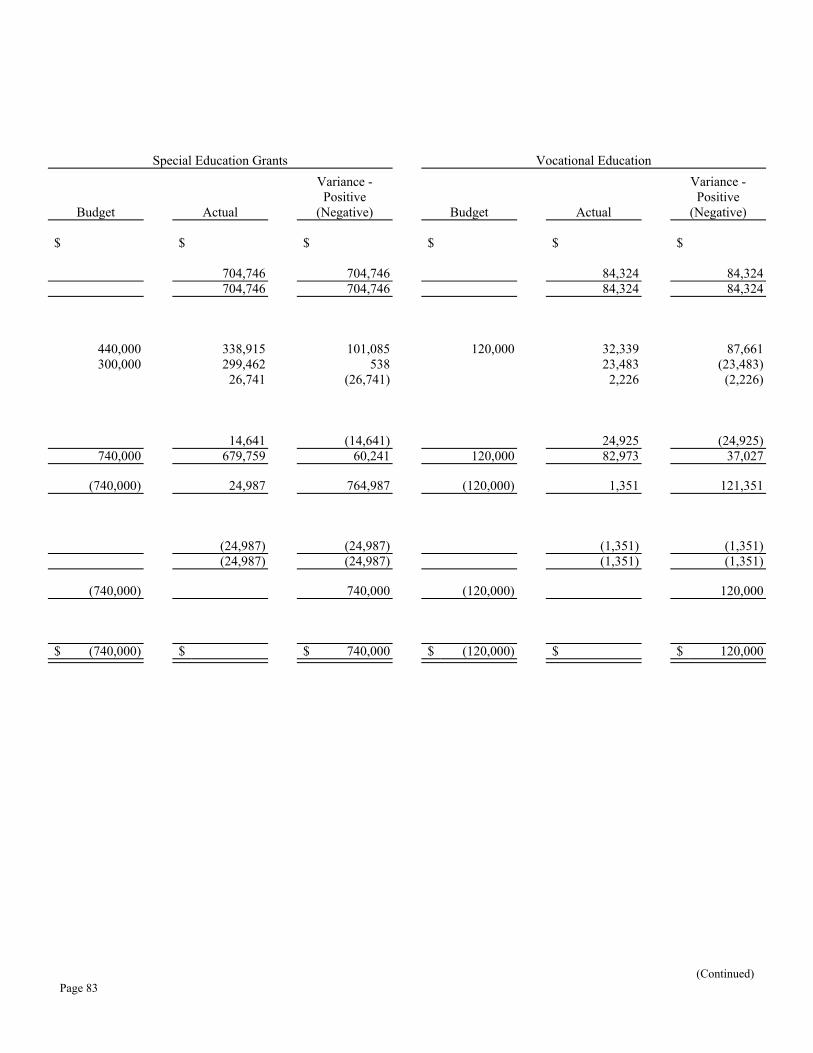
Special Education Grants
Budget
$
440,000300,000
740,000
(740,000)
(740,000)
$ (740,000)
Actual
$
704,746704,746
338,915299,46226,741
14,641679,759
24,987
(24,987)(24,987)
$
Variance - Positive
(Negative)
$
704,746704,746
101,085538
(26,741)
(14,641)60,241
764,987
(24,987)(24,987)
740,000
$ 740,000
Vocational Education
Budget
$
120,000
120,000
(120,000)
(120,000)
$ (120,000)
Actual
$
84,32484,324
32,33923,4832,226
24,92582,973
1,351
(1,351)(1,351)
$
Variance - Positive
(Negative)
$
84,32484,324
87,661(23,483)(2,226)
(24,925)37,027
121,351
(1,351)(1,351)
120,000
$ 120,000
Page 83(Continued)

Total revenues
Revenues:Other localState aid and grantsFederal aid, grants and reimbursements
Expenditures:Current -
InstructionSupport services - students and staffSupport services - administrationOperation and maintenance of plant servicesStudent transportation servicesOperation of non-instructional services
Capital outlayTotal expenditures
Excess (deficiency) of revenues over expenditures
Other financing sources (uses):Transfers inTransfers out
Total other financing sources (uses):
Changes in fund balances
Fund balances, beginning of year
Fund balances (deficits), end of year
Medicaid Reimbursement
Budget
$
250,000
250,000
(250,000)
(250,000)
$ (250,000)
Non-GAAP Actual
$
301,074301,074
301,074
301,074
353,056
$ 654,130
Variance - Positive
(Negative)
$
301,074301,074
250,000
250,000
551,074
551,074
353,056
$ 904,130
MARICOPA UNIFIED SCHOOL DISTRICT NO. 20COMBINING SCHEDULE OF REVENUES, EXPENDITURES AND CHANGES IN FUND BALANCES -
BUDGET AND ACTUALALL SPECIAL REVENUE FUNDS
YEAR ENDED JUNE 30, 2015
Page 84
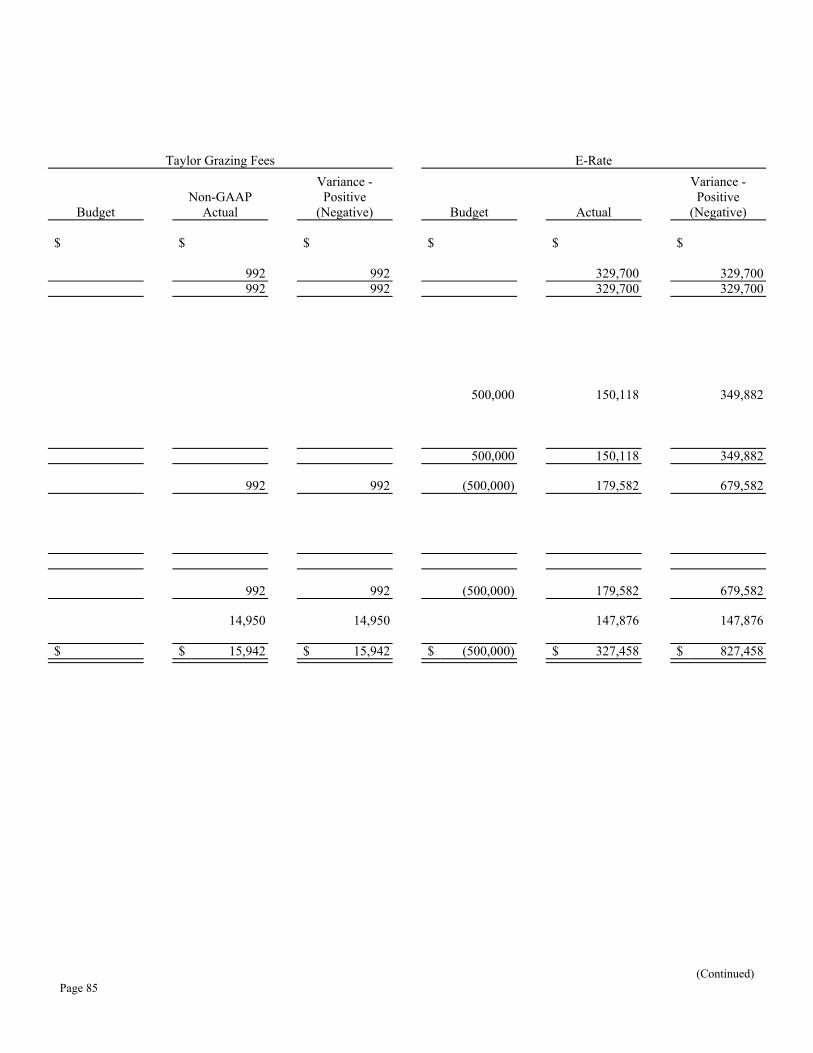
Taylor Grazing Fees
Budget
$
$
Non-GAAP Actual
$
992992
992
992
14,950
$ 15,942
Variance - Positive
(Negative)
$
992992
992
992
14,950
$ 15,942
E-Rate
Budget
$
500,000
500,000
(500,000)
(500,000)
$ (500,000)
Actual
$
329,700329,700
150,118
150,118
179,582
179,582
147,876
$ 327,458
Variance - Positive
(Negative)
$
329,700329,700
349,882
349,882
679,582
679,582
147,876
$ 827,458
Page 85(Continued)
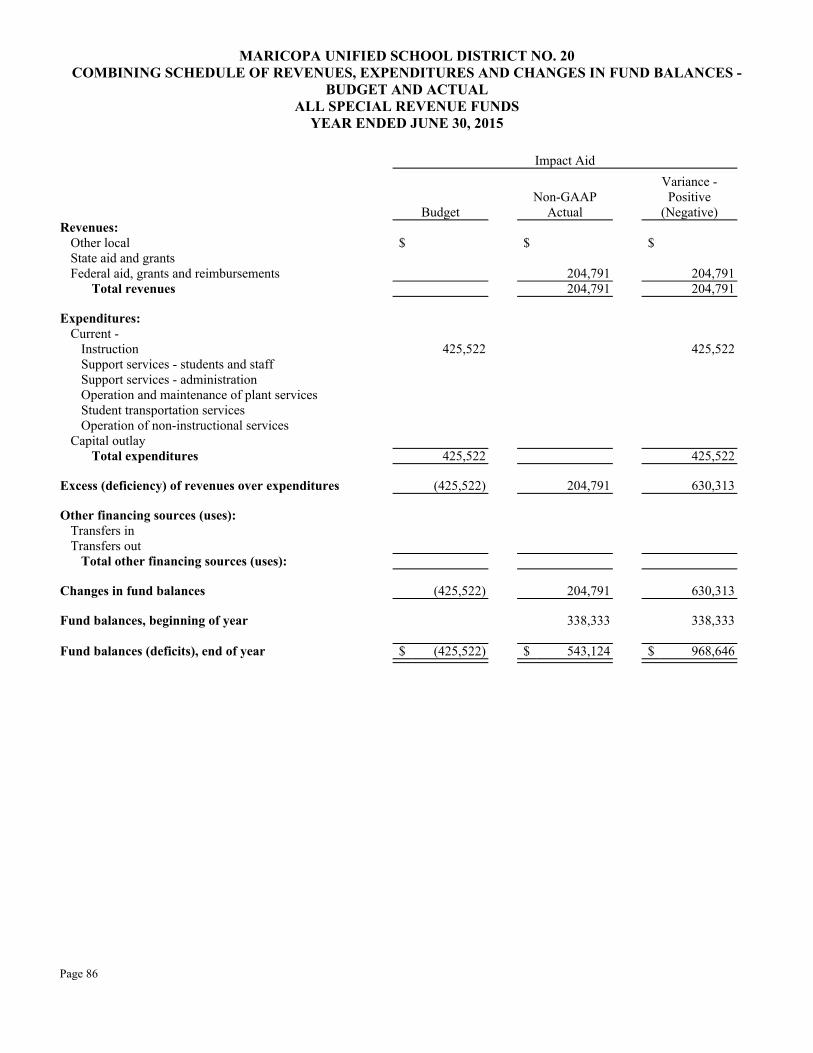
Total revenues
Revenues:Other localState aid and grantsFederal aid, grants and reimbursements
Expenditures:Current -
InstructionSupport services - students and staffSupport services - administrationOperation and maintenance of plant servicesStudent transportation servicesOperation of non-instructional services
Capital outlayTotal expenditures
Excess (deficiency) of revenues over expenditures
Other financing sources (uses):Transfers inTransfers out
Total other financing sources (uses):
Changes in fund balances
Fund balances, beginning of year
Fund balances (deficits), end of year
Impact Aid
Budget
$
425,522
425,522
(425,522)
(425,522)
$ (425,522)
Non-GAAP Actual
$
204,791204,791
204,791
204,791
338,333
$ 543,124
Variance - Positive
(Negative)
$
204,791204,791
425,522
425,522
630,313
630,313
338,333
$ 968,646
MARICOPA UNIFIED SCHOOL DISTRICT NO. 20COMBINING SCHEDULE OF REVENUES, EXPENDITURES AND CHANGES IN FUND BALANCES -
BUDGET AND ACTUALALL SPECIAL REVENUE FUNDS
YEAR ENDED JUNE 30, 2015
Page 86
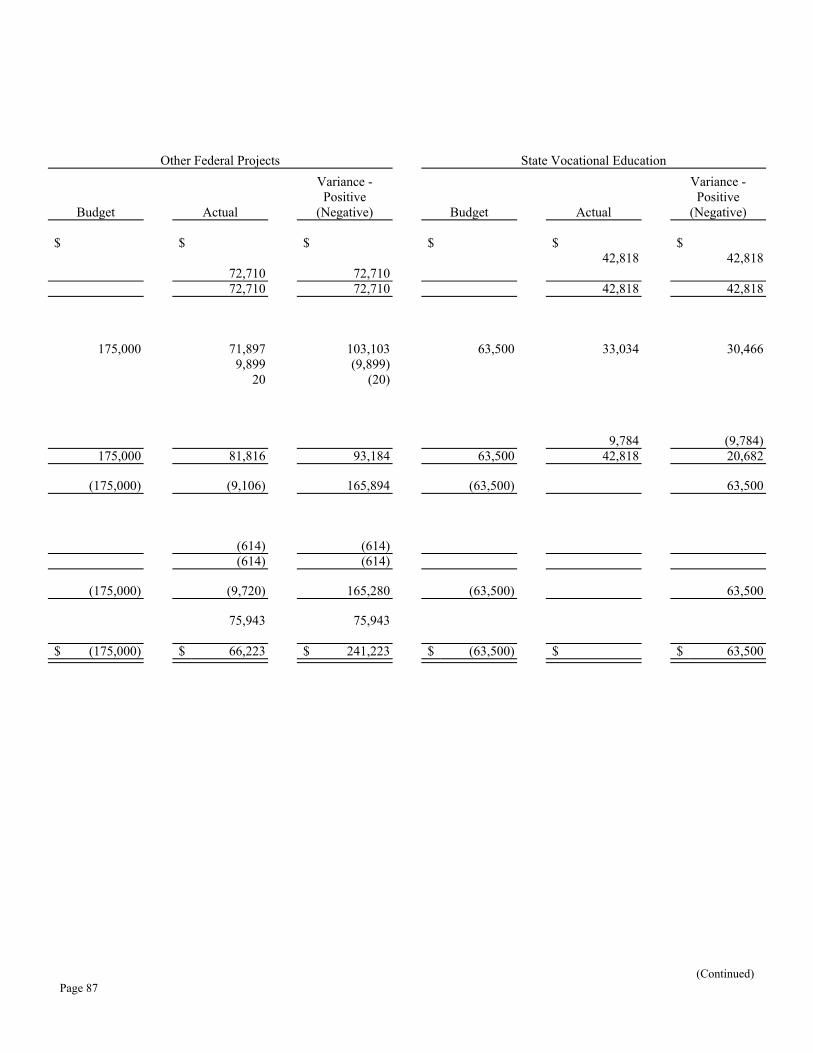
Other Federal Projects
Budget
$
175,000
175,000
(175,000)
(175,000)
$ (175,000)
Actual
$
72,71072,710
71,8979,899
20
81,816
(9,106)
(614)(614)
(9,720)
75,943
$ 66,223
Variance - Positive
(Negative)
$
72,71072,710
103,103(9,899)
(20)
93,184
165,894
(614)(614)
165,280
75,943
$ 241,223
State Vocational Education
Budget
$
63,500
63,500
(63,500)
(63,500)
$ (63,500)
Actual
$ 42,818
42,818
33,034
9,78442,818
$
Variance - Positive
(Negative)
$ 42,818
42,818
30,466
(9,784)20,682
63,500
63,500
$ 63,500
Page 87(Continued)

Total revenues
Revenues:Other localState aid and grantsFederal aid, grants and reimbursements
Expenditures:Current -
InstructionSupport services - students and staffSupport services - administrationOperation and maintenance of plant servicesStudent transportation servicesOperation of non-instructional services
Capital outlayTotal expenditures
Excess (deficiency) of revenues over expenditures
Other financing sources (uses):Transfers inTransfers out
Total other financing sources (uses):
Changes in fund balances
Fund balances, beginning of year
Fund balances (deficits), end of year
Other State Projects
Budget
$
15,000
15,000
(15,000)
(15,000)
$ (15,000)
Actual
$ 8,124
8,124
7,716408
8,124
$
Variance - Positive
(Negative)
$ 8,124
8,124
7,284(408)
6,876
15,000
15,000
$ 15,000
MARICOPA UNIFIED SCHOOL DISTRICT NO. 20COMBINING SCHEDULE OF REVENUES, EXPENDITURES AND CHANGES IN FUND BALANCES -
BUDGET AND ACTUALALL SPECIAL REVENUE FUNDS
YEAR ENDED JUNE 30, 2015
Page 88

School Plant
Budget
$
16,000
16,000
(16,000)
(16,000)
$ (16,000)
Non-GAAP Actual
$ 28
28
28
28
7,295
$ 7,323
Variance - Positive
(Negative)
$ 28
28
16,000
16,000
16,028
16,028
7,295
$ 23,323
Food Service
Budget
$
3,100,000
3,100,000
(3,100,000)
(3,100,000)
$ (3,100,000)
Actual
$ 564,286
2,108,8952,673,181
1,095
2,110,3373,619
2,115,051
558,130
(218,751)(218,751)
339,379
721,460
$ 1,060,839
Variance - Positive
(Negative)
$ 564,286
2,108,8952,673,181
(1,095)
989,663(3,619)
984,949
3,658,130
(218,751)(218,751)
3,439,379
721,460
$ 4,160,839
Page 89(Continued)
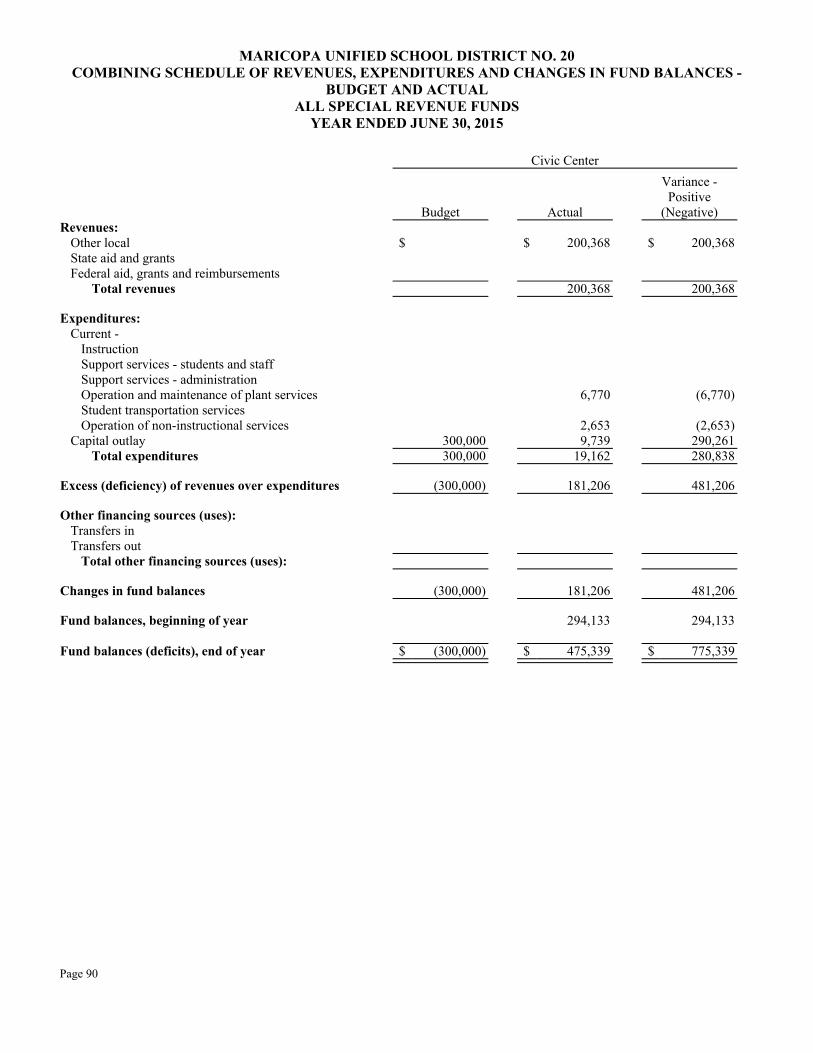
Total revenues
Revenues:Other localState aid and grantsFederal aid, grants and reimbursements
Expenditures:Current -
InstructionSupport services - students and staffSupport services - administrationOperation and maintenance of plant servicesStudent transportation servicesOperation of non-instructional services
Capital outlayTotal expenditures
Excess (deficiency) of revenues over expenditures
Other financing sources (uses):Transfers inTransfers out
Total other financing sources (uses):
Changes in fund balances
Fund balances, beginning of year
Fund balances (deficits), end of year
Civic Center
Budget
$
300,000300,000
(300,000)
(300,000)
$ (300,000)
Actual
$ 200,368
200,368
6,770
2,6539,739
19,162
181,206
181,206
294,133
$ 475,339
Variance - Positive
(Negative)
$ 200,368
200,368
(6,770)
(2,653)290,261280,838
481,206
481,206
294,133
$ 775,339
MARICOPA UNIFIED SCHOOL DISTRICT NO. 20COMBINING SCHEDULE OF REVENUES, EXPENDITURES AND CHANGES IN FUND BALANCES -
BUDGET AND ACTUALALL SPECIAL REVENUE FUNDS
YEAR ENDED JUNE 30, 2015
Page 90

Community School
Budget
$
400,000
400,000
(400,000)
(400,000)
$ (400,000)
Actual
$ 209,973
209,973
149,467184
49,334
198,985
10,988
10,988
246,752
$ 257,740
Variance - Positive
(Negative)
$ 209,973
209,973
250,533(184)
(49,334)
201,015
410,988
410,988
246,752
$ 657,740
Auxiliary Operations
Budget
$
90,000
90,000
(90,000)
(90,000)
$ (90,000)
Non-GAAP Actual
$ 148,801
148,801
130,073
6,182
136,255
12,546
12,546
131,834
$ 144,380
Variance - Positive
(Negative)
$ 148,801
148,801
(40,073)
(6,182)
(46,255)
102,546
102,546
131,834
$ 234,380
Page 91(Continued)

Total revenues
Revenues:Other localState aid and grantsFederal aid, grants and reimbursements
Expenditures:Current -
InstructionSupport services - students and staffSupport services - administrationOperation and maintenance of plant servicesStudent transportation servicesOperation of non-instructional services
Capital outlayTotal expenditures
Excess (deficiency) of revenues over expenditures
Other financing sources (uses):Transfers inTransfers out
Total other financing sources (uses):
Changes in fund balances
Fund balances, beginning of year
Fund balances (deficits), end of year
Extracurricular Activities Fees Tax Credit
Budget
$
20,000
20,000
(20,000)
(20,000)
$ (20,000)
Actual
$ 56,148
56,148
52,965
3,400
10,805
67,170
(11,022)
(11,022)
150,123
$ 139,101
Variance - Positive
(Negative)
$ 56,148
56,148
(32,965)
(3,400)
(10,805)
(47,170)
8,978
8,978
150,123
$ 159,101
MARICOPA UNIFIED SCHOOL DISTRICT NO. 20COMBINING SCHEDULE OF REVENUES, EXPENDITURES AND CHANGES IN FUND BALANCES -
BUDGET AND ACTUALALL SPECIAL REVENUE FUNDS
YEAR ENDED JUNE 30, 2015
Page 92
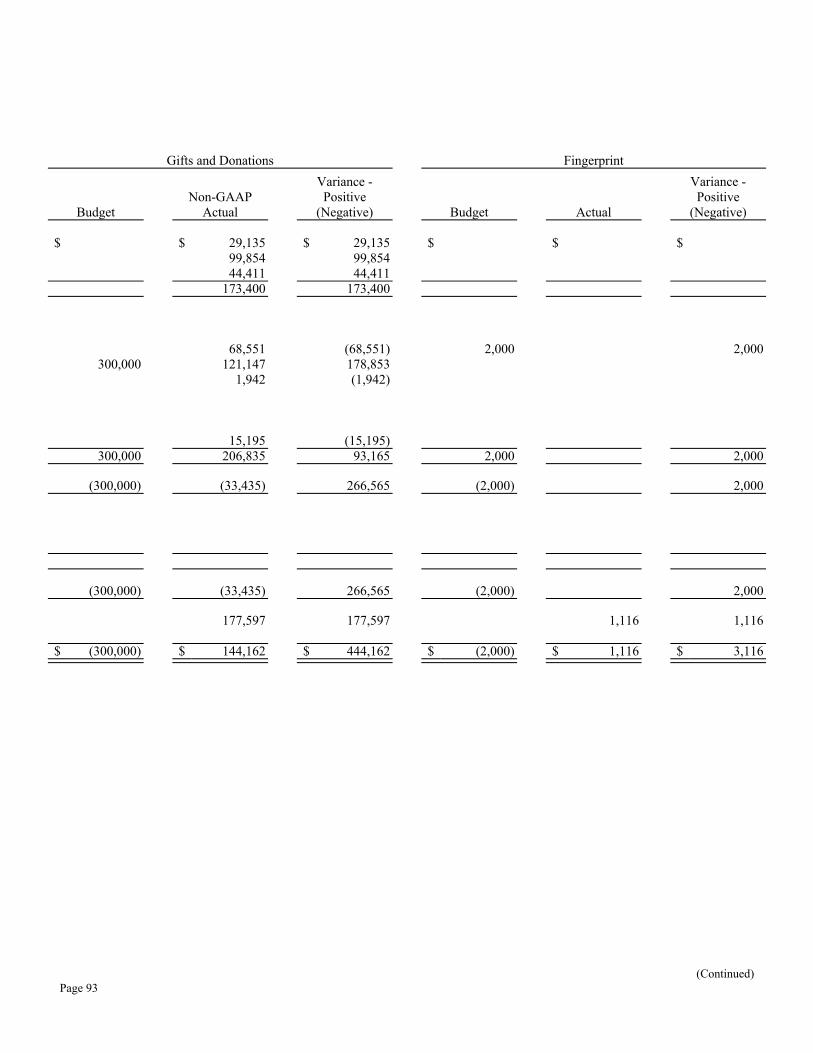
Gifts and Donations
Budget
$
300,000
300,000
(300,000)
(300,000)
$ (300,000)
Non-GAAP Actual
$ 29,13599,85444,411
173,400
68,551121,147
1,942
15,195206,835
(33,435)
(33,435)
177,597
$ 144,162
Variance - Positive
(Negative)
$ 29,13599,85444,411
173,400
(68,551)178,853(1,942)
(15,195)93,165
266,565
266,565
177,597
$ 444,162
Fingerprint
Budget
$
2,000
2,000
(2,000)
(2,000)
$ (2,000)
Actual
$
1,116
$ 1,116
Variance - Positive
(Negative)
$
2,000
2,000
2,000
2,000
1,116
$ 3,116
Page 93(Continued)
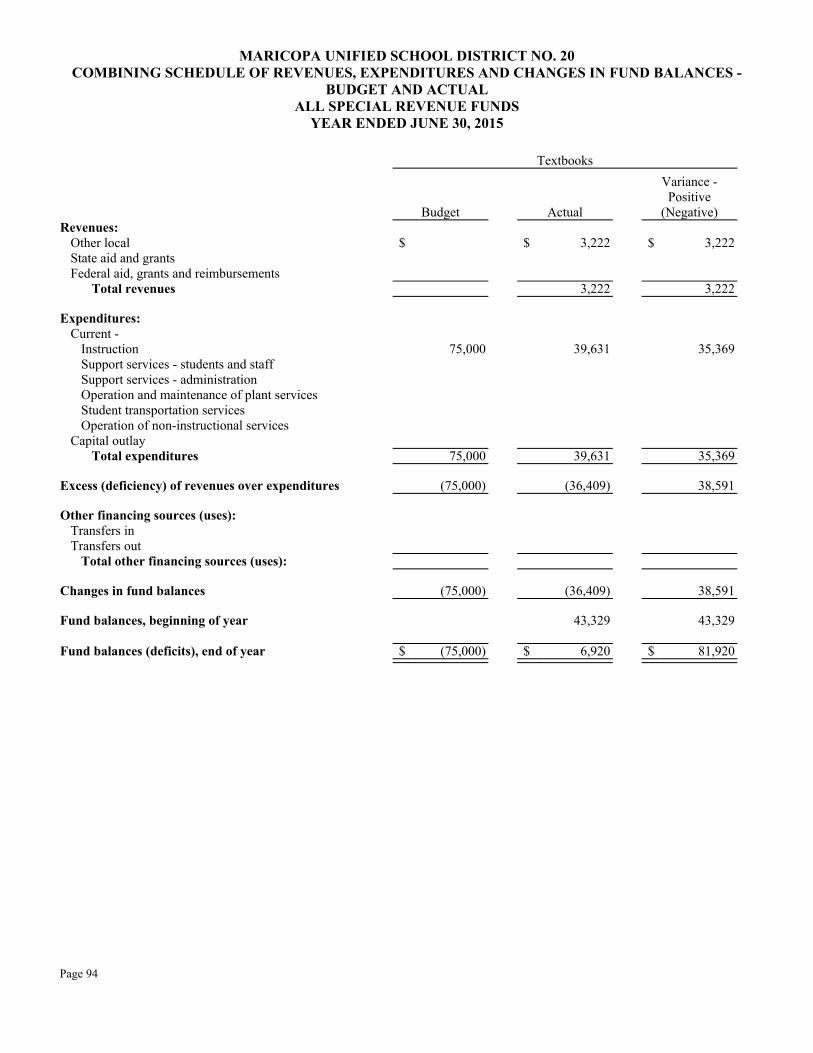
Total revenues
Revenues:Other localState aid and grantsFederal aid, grants and reimbursements
Expenditures:Current -
InstructionSupport services - students and staffSupport services - administrationOperation and maintenance of plant servicesStudent transportation servicesOperation of non-instructional services
Capital outlayTotal expenditures
Excess (deficiency) of revenues over expenditures
Other financing sources (uses):Transfers inTransfers out
Total other financing sources (uses):
Changes in fund balances
Fund balances, beginning of year
Fund balances (deficits), end of year
Textbooks
Budget
$
75,000
75,000
(75,000)
(75,000)
$ (75,000)
Actual
$ 3,222
3,222
39,631
39,631
(36,409)
(36,409)
43,329
$ 6,920
Variance - Positive
(Negative)
$ 3,222
3,222
35,369
35,369
38,591
38,591
43,329
$ 81,920
MARICOPA UNIFIED SCHOOL DISTRICT NO. 20COMBINING SCHEDULE OF REVENUES, EXPENDITURES AND CHANGES IN FUND BALANCES -
BUDGET AND ACTUALALL SPECIAL REVENUE FUNDS
YEAR ENDED JUNE 30, 2015
Page 94

Litigation Recovery
Budget
$
110,000110,000
(110,000)
(110,000)
$ (110,000)
Actual
$ 5,337
5,337
60,65660,656
(55,319)
(55,319)
98,420
$ 43,101
Variance - Positive
(Negative)
$ 5,337
5,337
49,34449,344
54,681
54,681
98,420
$ 153,101
Indirect Costs
Budget
$
800,000
800,000
(800,000)
(800,000)
$ (800,000)
Non-GAAP Actual
$
21,100
16,761395,596
124,857558,314
(558,314)
303,617
303,617
(254,697)
1,423,852
$ 1,169,155
Variance - Positive
(Negative)
$
(21,100)
(16,761)404,404
(124,857)241,686
241,686
303,617
303,617
545,303
1,423,852
$ 1,969,155
Page 95(Continued)

Total revenues
Revenues:Other localState aid and grantsFederal aid, grants and reimbursements
Expenditures:Current -
InstructionSupport services - students and staffSupport services - administrationOperation and maintenance of plant servicesStudent transportation servicesOperation of non-instructional services
Capital outlayTotal expenditures
Excess (deficiency) of revenues over expenditures
Other financing sources (uses):Transfers inTransfers out
Total other financing sources (uses):
Changes in fund balances
Fund balances, beginning of year
Fund balances (deficits), end of year
Insurance Refund
Budget
$
1,000
1,000
(1,000)
(1,000)
$ (1,000)
Actual
$
1,343
$ 1,343
Variance - Positive
(Negative)
$
1,000
1,000
1,000
1,000
1,343
$ 2,343
MARICOPA UNIFIED SCHOOL DISTRICT NO. 20COMBINING SCHEDULE OF REVENUES, EXPENDITURES AND CHANGES IN FUND BALANCES -
BUDGET AND ACTUALALL SPECIAL REVENUE FUNDS
YEAR ENDED JUNE 30, 2015
Page 96

Grants and Gifts to Teachers
Budget
$
50,000
50,000
(50,000)
(50,000)
$ (50,000)
Actual
$ 9,676
9,676
1,890
200
1,3963,486
6,190
6,190
35,404
$ 41,594
Variance - Positive
(Negative)
$ 9,676
9,676
48,110
(200)
(1,396)46,514
56,190
56,190
35,404
$ 91,594
Advertisement
Budget
$
10,000
10,000
(10,000)
(10,000)
$ (10,000)
Non-GAAP Actual
$
4,667
$ 4,667
Variance - Positive
(Negative)
$
10,000
10,000
10,000
10,000
4,667
$ 14,667
Page 97(Continued)

Total revenues
Revenues:Other localState aid and grantsFederal aid, grants and reimbursements
Expenditures:Current -
InstructionSupport services - students and staffSupport services - administrationOperation and maintenance of plant servicesStudent transportation servicesOperation of non-instructional services
Capital outlayTotal expenditures
Excess (deficiency) of revenues over expenditures
Other financing sources (uses):Transfers inTransfers out
Total other financing sources (uses):
Changes in fund balances
Fund balances, beginning of year
Fund balances (deficits), end of year
Joint Technical Education
Budget
$
300,000
300,000
(300,000)
(300,000)
$ (300,000)
Actual
$ 214,603
214,603
117,07279,0471,124
22,939220,182
(5,579)
(5,579)
23,380
$ 17,801
Variance - Positive
(Negative)
$ 214,603
214,603
182,928(79,047)(1,124)
(22,939)79,818
294,421
294,421
23,380
$ 317,801
MARICOPA UNIFIED SCHOOL DISTRICT NO. 20COMBINING SCHEDULE OF REVENUES, EXPENDITURES AND CHANGES IN FUND BALANCES -
BUDGET AND ACTUALALL SPECIAL REVENUE FUNDS
YEAR ENDED JUNE 30, 2015
Page 98
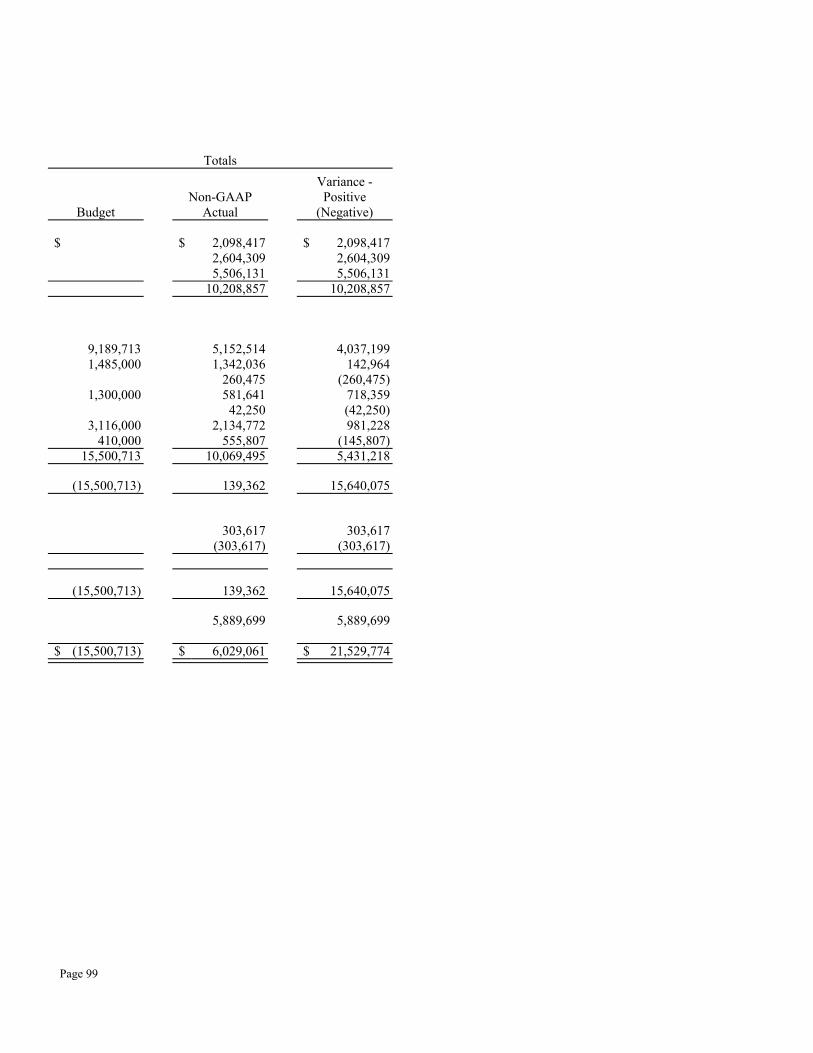
Totals
Budget
$
9,189,7131,485,000
1,300,000
3,116,000
410,00015,500,713
(15,500,713)
(15,500,713)
$ (15,500,713)
Non-GAAP Actual
$ 2,098,4172,604,3095,506,131
10,208,857
5,152,5141,342,036
260,475581,64142,250
2,134,772555,807
10,069,495
139,362
303,617
(303,617)
139,362
5,889,699
$ 6,029,061
Variance - Positive
(Negative)
$ 2,098,4172,604,3095,506,131
10,208,857
4,037,199142,964
(260,475)718,359(42,250)981,228
(145,807)5,431,218
15,640,075
303,617
(303,617)
15,640,075
5,889,699
$ 21,529,774
Page 99

Page 100
(This page intentionally left blank)

Page 101
DEBT SERVICE FUND Debt Service - to account for the accumulation of resources for, and the payment of, long-term debt principal, interest and related costs.
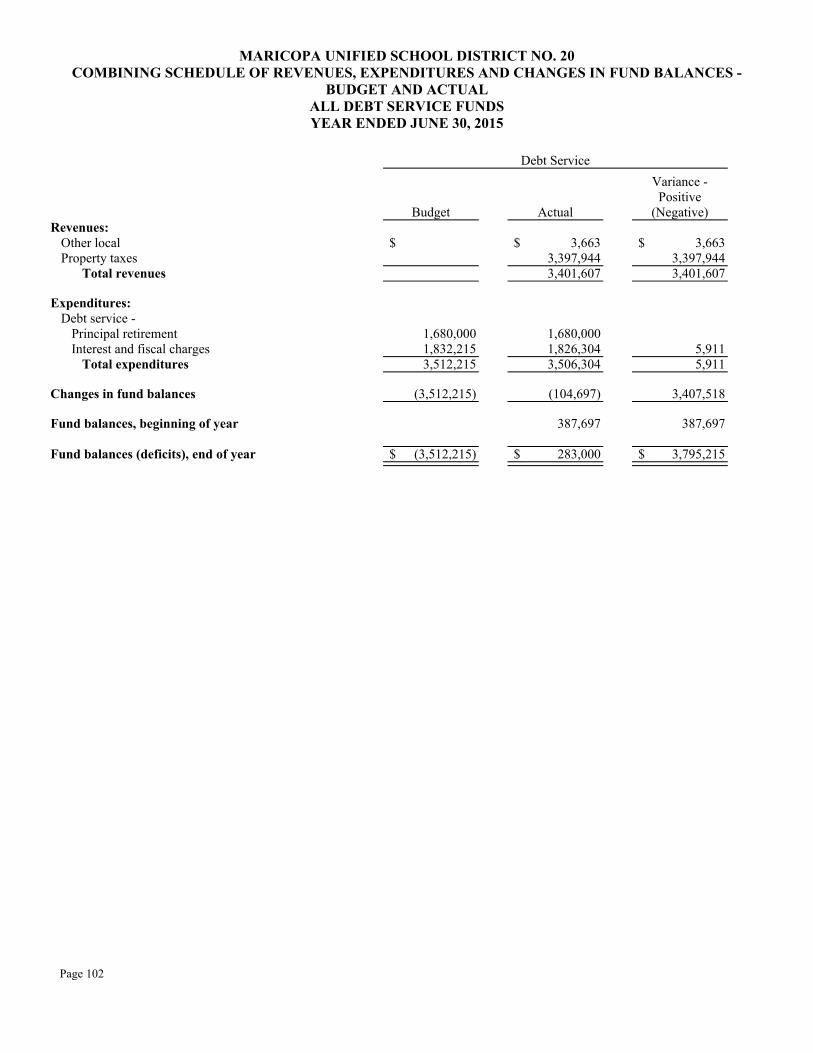
Total revenues
Revenues:Other localProperty taxes
Expenditures:Debt service -
Principal retirementInterest and fiscal charges
Total expenditures
Changes in fund balances
Fund balances, beginning of year
Fund balances (deficits), end of year
Debt Service
Budget
$
1,680,0001,832,2153,512,215
(3,512,215)
$ (3,512,215)
Actual
$ 3,6633,397,9443,401,607
1,680,0001,826,3043,506,304
(104,697)
387,697
$ 283,000
Variance - Positive
(Negative)
$ 3,6633,397,9443,401,607
5,9115,911
3,407,518
387,697
$ 3,795,215
MARICOPA UNIFIED SCHOOL DISTRICT NO. 20COMBINING SCHEDULE OF REVENUES, EXPENDITURES AND CHANGES IN FUND BALANCES -
BUDGET AND ACTUALALL DEBT SERVICE FUNDSYEAR ENDED JUNE 30, 2015
Page 102

Page 103
CAPITAL PROJECTS FUNDS Insurance Proceeds - to account for the monies received from insurance claims. Unrestricted Capital Outlay - to account for transactions relating to the acquisition of capital items. Adjacent Ways - to account for monies received to finance improvements of public ways adjacent to school property. Bond Building - to account for proceeds from District bond issues that are expended on the acquisition or lease of sites; construction or renovation of school buildings; supplying school buildings with furniture, equipment, and technology; improving school grounds; or purchasing pupil transportation vehicles. New School Facilities – to account for monies received from the School Facilities Board to be used for constructing new school facilities and purchasing land for new school sites.
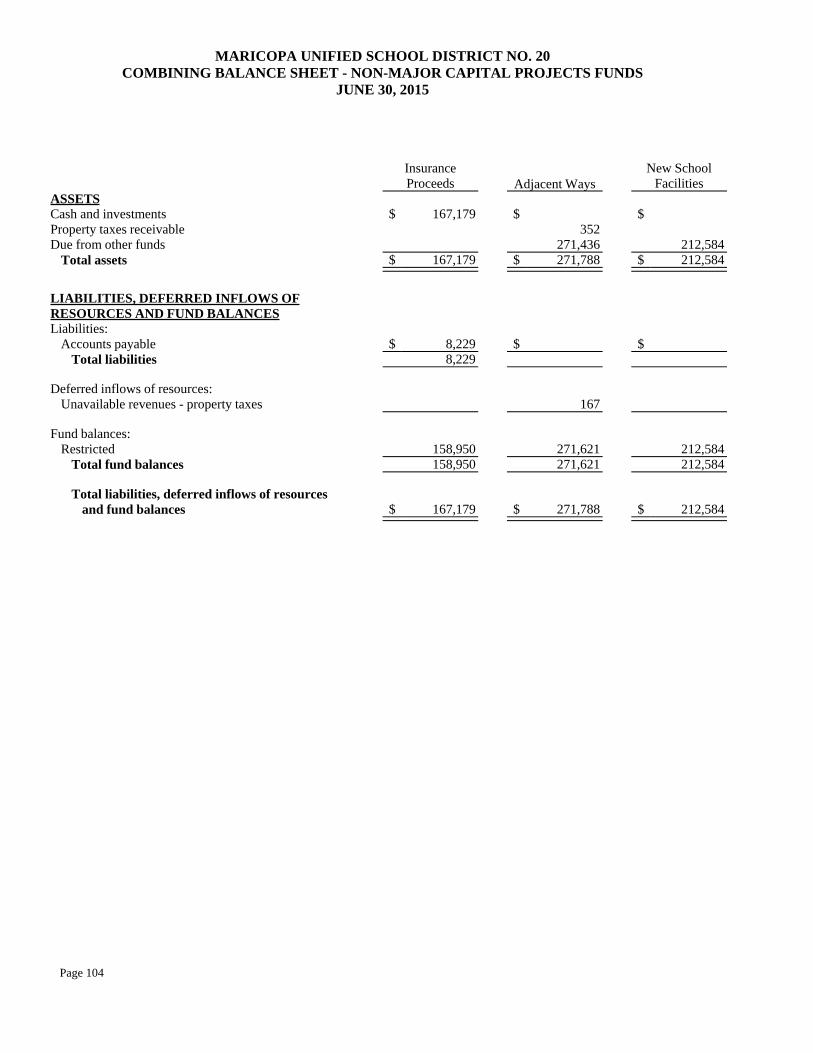
ASSETSCash and investmentsProperty taxes receivableDue from other funds
Total assets
LIABILITIES, DEFERRED INFLOWS OF RESOURCES AND FUND BALANCESLiabilities:
Accounts payableTotal liabilities
Deferred inflows of resources:Unavailable revenues - property taxes
Fund balances:Restricted
Total fund balances
Total liabilities, deferred inflows of resourcesand fund balances
Insurance Proceeds
$ 167,179
$ 167,179
$ 8,2298,229
158,950158,950
$ 167,179
Adjacent Ways
$352
271,436$ 271,788
$
167
271,621271,621
$ 271,788
New School Facilities
$
212,584$ 212,584
$
212,584212,584
$ 212,584
MARICOPA UNIFIED SCHOOL DISTRICT NO. 20COMBINING BALANCE SHEET - NON-MAJOR CAPITAL PROJECTS FUNDS
JUNE 30, 2015
Page 104
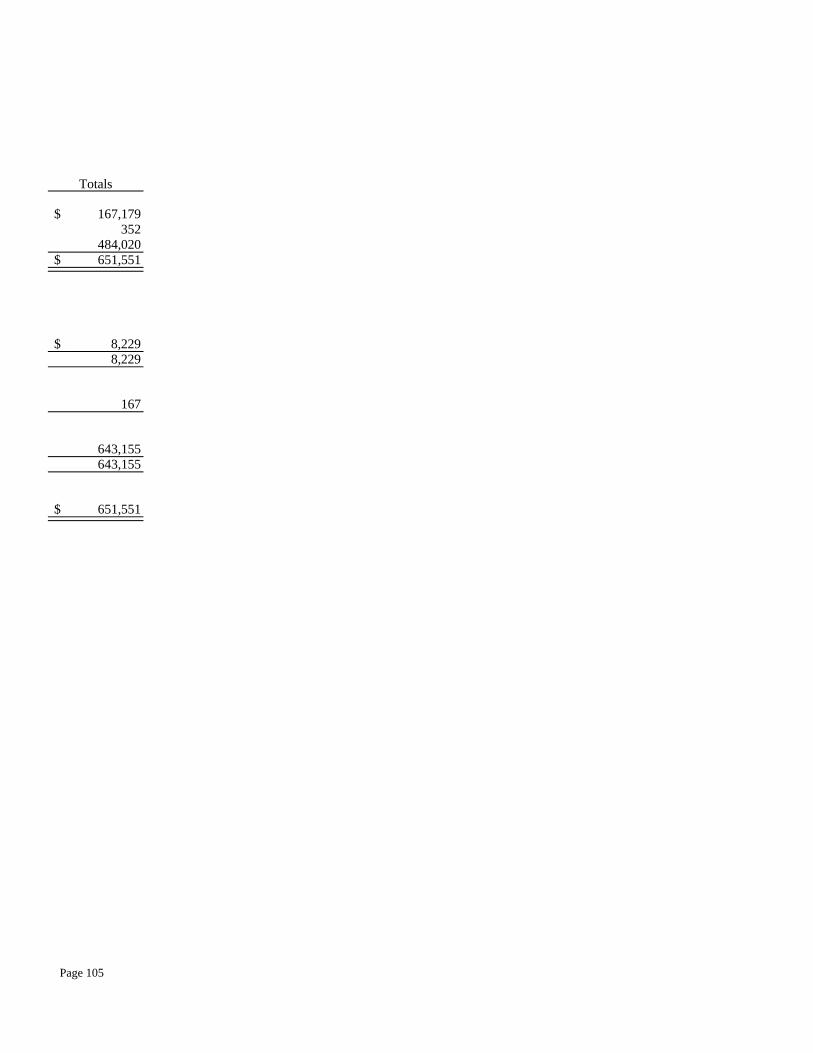
Totals
$ 167,179352
484,020$ 651,551
$ 8,2298,229
167
643,155643,155
$ 651,551
Page 105

Revenues:Other localProperty taxes
Total revenues
Expenditures:Capital outlay
Total expenditures
Changes in fund balances
Fund balances, beginning of year
Fund balances, end of year
Insurance Proceeds
$ 55,557
55,557
55,557
103,393
$ 158,950
Adjacent Ways
$ 78722,83223,619
29,93629,936
(6,317)
277,938
$ 271,621
New School Facilities
$ 1,100
1,100
142,724142,724
(141,624)
354,208
$ 212,584
MARICOPA UNIFIED SCHOOL DISTRICT NO. 20COMBINING STATEMENT OF REVENUES, EXPENDITURES AND CHANGES IN FUND BALANCES -
NON-MAJOR CAPITAL PROJECTS FUNDSYEAR ENDED JUNE 30, 2015
Page 106

Totals
$ 57,44422,83280,276
172,660172,660
(92,384)
735,539
$ 643,155
Page 107
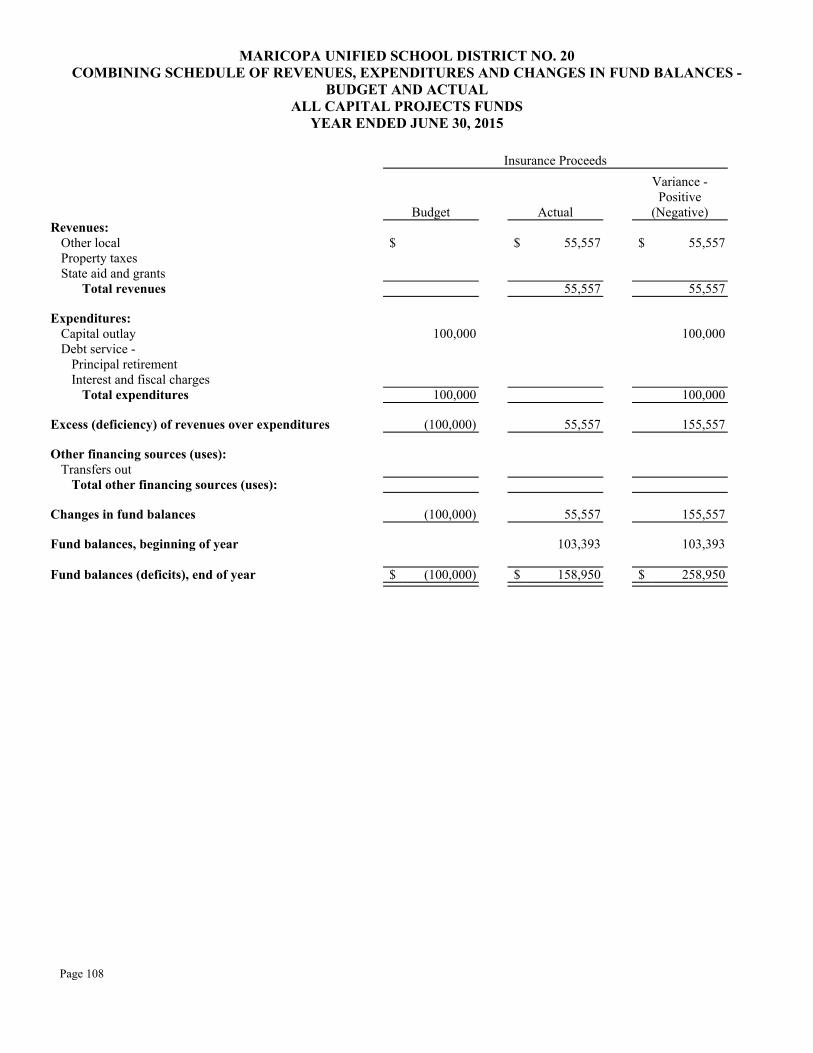
Total revenues
Revenues:Other localProperty taxesState aid and grants
Expenditures:Capital outlayDebt service -
Principal retirementInterest and fiscal charges
Total expenditures
Excess (deficiency) of revenues over expenditures
Other financing sources (uses):Transfers out
Total other financing sources (uses):
Changes in fund balances
Fund balances, beginning of year
Fund balances (deficits), end of year
Insurance Proceeds
Budget
$
100,000
100,000
(100,000)
(100,000)
$ (100,000)
Actual
$ 55,557
55,557
55,557
55,557
103,393
$ 158,950
Variance - Positive
(Negative)
$ 55,557
55,557
100,000
100,000
155,557
155,557
103,393
$ 258,950
MARICOPA UNIFIED SCHOOL DISTRICT NO. 20COMBINING SCHEDULE OF REVENUES, EXPENDITURES AND CHANGES IN FUND BALANCES -
BUDGET AND ACTUALALL CAPITAL PROJECTS FUNDS
YEAR ENDED JUNE 30, 2015
Page 108
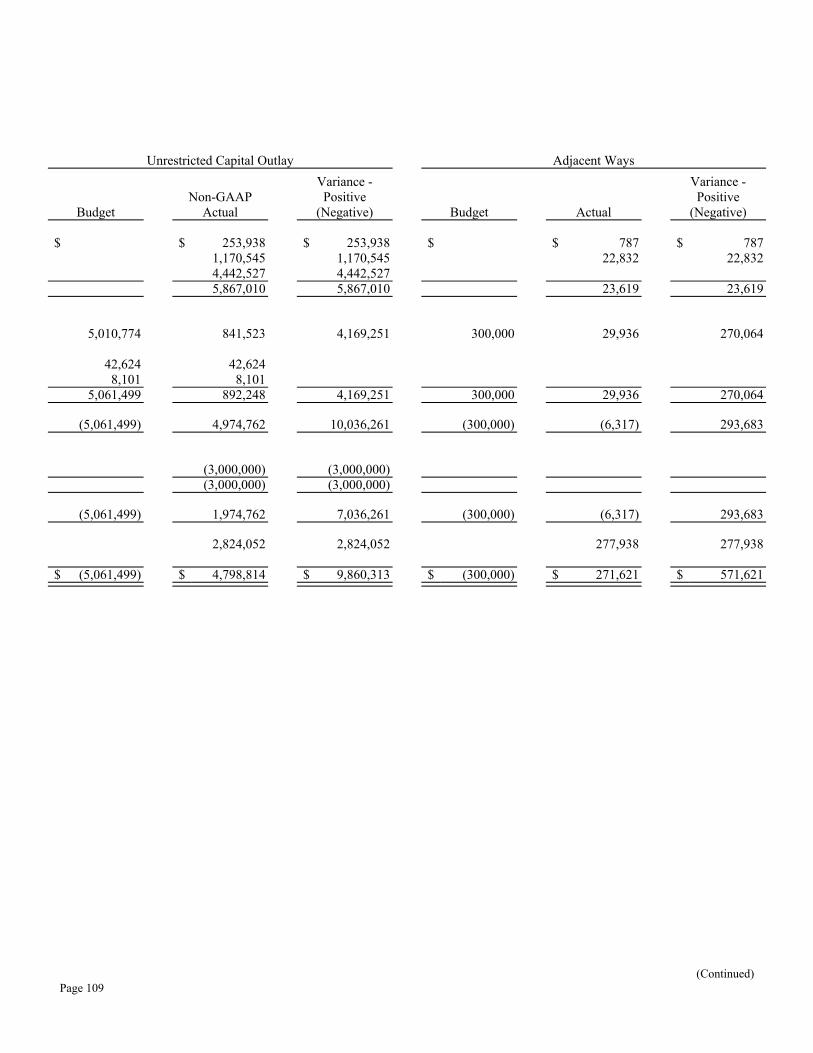
Unrestricted Capital Outlay
Budget
$
5,010,774
42,6248,101
5,061,499
(5,061,499)
(5,061,499)
$ (5,061,499)
Non-GAAP Actual
$ 253,9381,170,5454,442,5275,867,010
841,523
42,6248,101
892,248
4,974,762
(3,000,000)(3,000,000)
1,974,762
2,824,052
$ 4,798,814
Variance - Positive
(Negative)
$ 253,9381,170,5454,442,5275,867,010
4,169,251
4,169,251
10,036,261
(3,000,000)(3,000,000)
7,036,261
2,824,052
$ 9,860,313
Adjacent Ways
Budget
$
300,000
300,000
(300,000)
(300,000)
$ (300,000)
Actual
$ 78722,832
23,619
29,936
29,936
(6,317)
(6,317)
277,938
$ 271,621
Variance - Positive
(Negative)
$ 78722,832
23,619
270,064
270,064
293,683
293,683
277,938
$ 571,621
Page 109(Continued)

Total revenues
Revenues:Other localProperty taxesState aid and grants
Expenditures:Capital outlayDebt service -
Principal retirementInterest and fiscal charges
Total expenditures
Excess (deficiency) of revenues over expenditures
Other financing sources (uses):Transfers out
Total other financing sources (uses):
Changes in fund balances
Fund balances, beginning of year
Fund balances (deficits), end of year
Bond Building
Budget
$
50,000
50,000
(50,000)
(50,000)
$ (50,000)
Actual
$
$
Variance - Positive
(Negative)
$
50,000
50,000
50,000
50,000
$ 50,000
MARICOPA UNIFIED SCHOOL DISTRICT NO. 20COMBINING SCHEDULE OF REVENUES, EXPENDITURES AND CHANGES IN FUND BALANCES -
BUDGET AND ACTUALALL CAPITAL PROJECTS FUNDS
YEAR ENDED JUNE 30, 2015
Page 110

New School Facilities
Budget
$
350,000
350,000
(350,000)
(350,000)
$ (350,000)
Actual
$ 1,100
1,100
142,724
142,724
(141,624)
(141,624)
354,208
$ 212,584
Variance - Positive
(Negative)
$ 1,100
1,100
207,276
207,276
208,376
208,376
354,208
$ 562,584
Totals
Budget
$
5,810,774
42,6248,101
5,861,499
(5,861,499)
(5,861,499)
$ (5,861,499)
Non-GAAP Actual
$ 311,3821,193,3774,442,5275,947,286
1,014,183
42,6248,101
1,064,908
4,882,378
(3,000,000)(3,000,000)
1,882,378
3,559,591
$ 5,441,969
Variance - Positive
(Negative)
$ 311,3821,193,3774,442,5275,947,286
4,796,591
4,796,591
10,743,877
(3,000,000)(3,000,000)
7,743,877
3,559,591
$ 11,303,468
Page 111

Page 112
(This page intentionally left blank)
Page 113
AGENCY FUNDS Student Activities - to account for monies raised by students to finance student clubs and organizations but held by the District as an agent. Employee Withholding - to account for voluntary deductions temporarily held by the District as an agent.

ASSETSCash and investments
Total assets
LIABILITIESDeposits held for othersDue to student groups
Total liabilities
Student Activities
$ 78,365$ 78,365
$78,365
$ 78,365
Employee Withholding
$ 63,041$ 63,041
$ 63,041
$ 63,041
Totals
$ 141,406$ 141,406
$ 63,04178,365
$ 141,406
MARICOPA UNIFIED SCHOOL DISTRICT NO. 20COMBINING STATEMENT OF ASSETS AND LIABILITIES
AGENCY FUNDSJUNE 30, 2015
Page 114
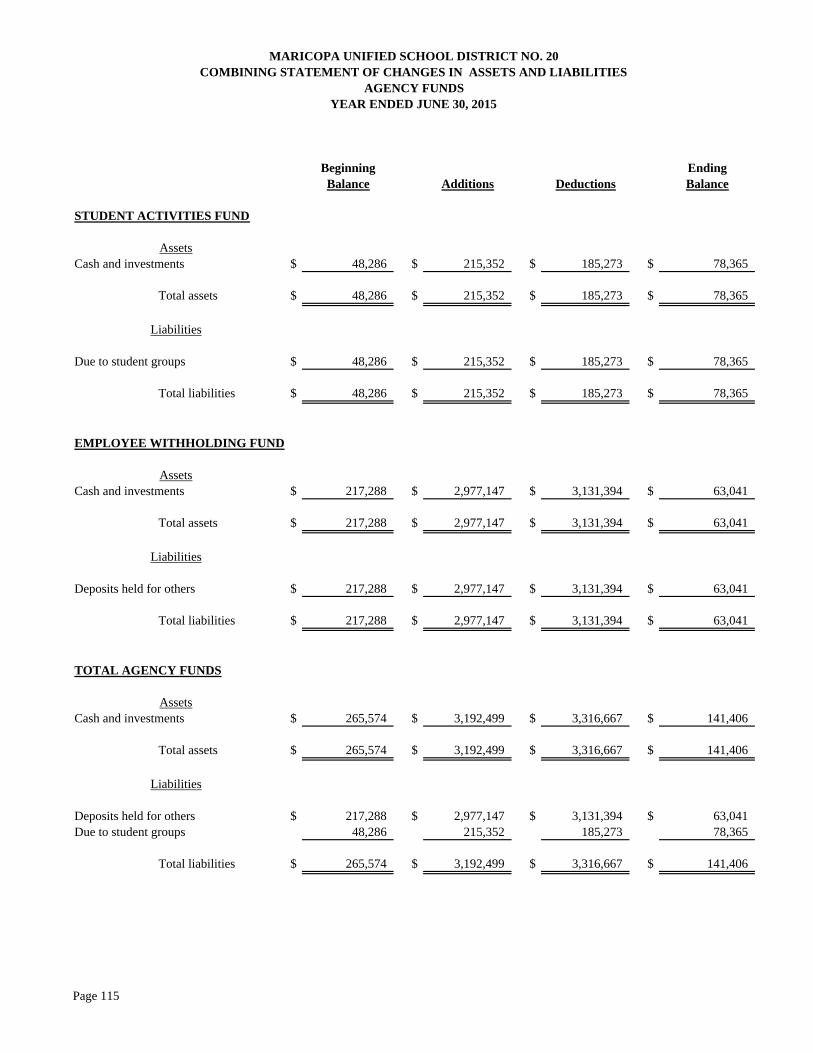
Beginning EndingBalance Additions Deductions Balance
STUDENT ACTIVITIES FUND
AssetsCash and investments $ 48,286 $ 215,352 $ 185,273 $ 78,365
Total assets $ 48,286 $ 215,352 $ 185,273 $ 78,365
Liabilities
Due to student groups $ 48,286 $ 215,352 $ 185,273 $ 78,365
Total liabilities $ 48,286 $ 215,352 $ 185,273 $ 78,365
EMPLOYEE WITHHOLDING FUND
AssetsCash and investments $ 217,288 $ 2,977,147 $ 3,131,394 $ 63,041
Total assets $ 217,288 $ 2,977,147 $ 3,131,394 $ 63,041
Liabilities
Deposits held for others $ 217,288 $ 2,977,147 $ 3,131,394 $ 63,041
Total liabilities $ 217,288 $ 2,977,147 $ 3,131,394 $ 63,041
TOTAL AGENCY FUNDS
AssetsCash and investments $ 265,574 $ 3,192,499 $ 3,316,667 $ 141,406
Total assets $ 265,574 $ 3,192,499 $ 3,316,667 $ 141,406
Liabilities
Deposits held for others $ 217,288 $ 2,977,147 $ 3,131,394 $ 63,041Due to student groups 48,286 215,352 185,273 78,365
Total liabilities $ 265,574 $ 3,192,499 $ 3,316,667 $ 141,406
MARICOPA UNIFIED SCHOOL DISTRICT NO. 20COMBINING STATEMENT OF CHANGES IN ASSETS AND LIABILITIES
AGENCY FUNDSYEAR ENDED JUNE 30, 2015
Page 115

Page 116
(This page intentionally left blank)
Page 117
STATISTICAL SECTION
The statistical section presents financial statement trends as well as detailed financial and operational information not available elsewhere in the report. The statistical section is intended to enhance the reader’s understanding of the information presented in the financial statements, notes to the financial statements, and other supplementary information presented in this report. The statistical section is comprised of the five categories of statistical information presented below.
Financial Trends
These schedules contain information on financial trends to help the reader understand how the District’s financial position and financial activities have changed over time.
Revenue Capacity
These schedules contain information to help the reader assess the factors affecting the District’s ability to generate revenue.
Debt Capacity
These schedules present information to help the reader evaluate the District’s current levels of outstanding debt as well as assess the District’s ability to make debt payments and/or issue additional debt in the future.
Demographic and Economic Information These schedules present various demographic and economic indicators to help the reader understand the environment in which the District’s financial activities take place and to help make comparisons with other school districts.
Operating Information
These schedules contain information about the District’s operations and various resources to help the reader draw conclusions as to how the District’s financial information relates to the services provided by the District.

2015 2014 2013 2012 2011Net Position:
Net investment in capital assets 109,448,224$ 110,345,335$ 109,442,916$ 111,152,701$ 113,438,370$ Restricted 9,227,251 7,817,319 6,448,034 5,629,217 6,810,892 Unrestricted (36,156,411) 4,307,138 4,648,176 5,134,099 4,681,059
Total net position 82,519,064$ 122,469,792$ 120,539,126$ 121,916,017$ 124,930,321$
2010 2009 2008 2007 2006Net Position:
Net investment in capital assets 108,430,073$ 107,722,747$ 99,337,359$ 44,288,704$ 29,294,068$ Restricted 7,704,441 6,944,523 2,555,493 1,705,862 2,929,179 Unrestricted 6,718,788 2,017,402 8,658,250 8,566,042 1,466,334
Total net position 122,853,302$ 116,684,672$ 110,551,102$ 54,560,608$ 33,689,581$
The source of this information is the District's financial records.Source:
MARICOPA UNIFIED SCHOOL DISTRICT NO. 20NET POSITION BY COMPONENT
LAST TEN FISCAL YEARS
Fiscal Year Ended June 30
(Accrual basis of accounting)
Page 118
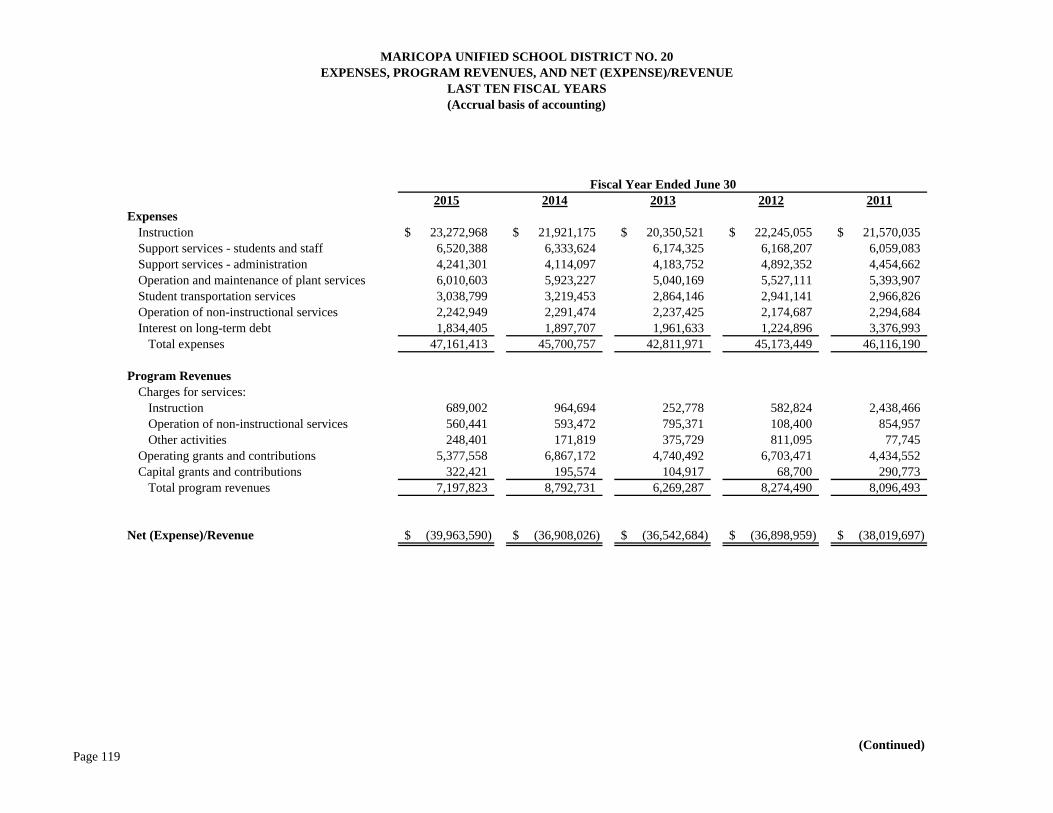
2015 2014 2013 2012 2011
Instruction 23,272,968$ 21,921,175$ 20,350,521$ 22,245,055$ 21,570,035$ Support services - students and staff 6,520,388 6,333,624 6,174,325 6,168,207 6,059,083 Support services - administration 4,241,301 4,114,097 4,183,752 4,892,352 4,454,662 Operation and maintenance of plant services 6,010,603 5,923,227 5,040,169 5,527,111 5,393,907 Student transportation services 3,038,799 3,219,453 2,864,146 2,941,141 2,966,826 Operation of non-instructional services 2,242,949 2,291,474 2,237,425 2,174,687 2,294,684 Interest on long-term debt 1,834,405 1,897,707 1,961,633 1,224,896 3,376,993
Total expenses 47,161,413 45,700,757 42,811,971 45,173,449 46,116,190
Program RevenuesCharges for services:
Instruction 689,002 964,694 252,778 582,824 2,438,466 Operation of non-instructional services 560,441 593,472 795,371 108,400 854,957 Other activities 248,401 171,819 375,729 811,095 77,745
Operating grants and contributions 5,377,558 6,867,172 4,740,492 6,703,471 4,434,552 Capital grants and contributions 322,421 195,574 104,917 68,700 290,773
Total program revenues 7,197,823 8,792,731 6,269,287 8,274,490 8,096,493
Net (Expense)/Revenue (39,963,590)$ (36,908,026)$ (36,542,684)$ (36,898,959)$ (38,019,697)$
The source of this information is the District's financial records.The provisions of the Governmental Accounting Standards Board (GASB) Statement No. 34 were adopted in fiscal year 2001 therefore
only six years are shown.
(Continued)
Note:
LAST TEN FISCAL YEARS(Accrual basis of accounting)
Fiscal Year Ended June 30
Expenses
MARICOPA UNIFIED SCHOOL DISTRICT NO. 20EXPENSES, PROGRAM REVENUES, AND NET (EXPENSE)/REVENUE
Source:
Page 119

2010 2009 2008 2007 2006Expenses
Instruction 25,300,375$ 27,944,133$ 20,096,799$ 18,715,267$ 9,534,432$ Support services - students and staff 6,089,521 6,890,832 4,751,864 3,080,515 1,612,555 Support services - administration 4,822,925 5,201,614 4,497,214 2,624,405 2,213,088 Operation and maintenance of plant services 5,910,357 6,231,803 3,769,095 2,235,664 1,640,909 Student transportation services 3,414,262 4,704,966 4,591,235 1,375,817 1,197,577 Operation of non-instructional services 2,500,755 2,475,028 1,992,490 1,455,769 941,824 Interest on long-term debt 2,279,879 1,914,889 1,282,216 123,293 210,169
Total expenses 50,318,074 55,363,265 40,980,913 29,610,730 17,350,554
Program RevenuesCharges for services:
Instruction 684,423 629,953 537,101 365,832 161,191 Operation of non-instructional services 1,012,292 1,019,207 912,854 725,738 439,388 Other activities 65,014 67,593 64,348 232,534 83,630
Operating grants and contributions 4,553,510 3,343,018 2,553,639 1,667,042 3,954,111 Capital grants and contributions 87,925 142,328 6,857,319 1,076,505 13,637,708
Total program revenues 6,403,164 5,202,099 10,925,261 4,067,651 18,276,028
Net (Expense)/Revenue (43,914,910)$ (50,161,166)$ (30,055,652)$ (25,543,079)$ 925,474$
(Concluded)
(Accrual basis of accounting)LAST TEN FISCAL YEARS
Fiscal Year Ended June 30
Source: The source of this information is the District's financial records.
MARICOPA UNIFIED SCHOOL DISTRICT NO. 20EXPENSES, PROGRAM REVENUES, AND NET (EXPENSE)/REVENUE
Page 120
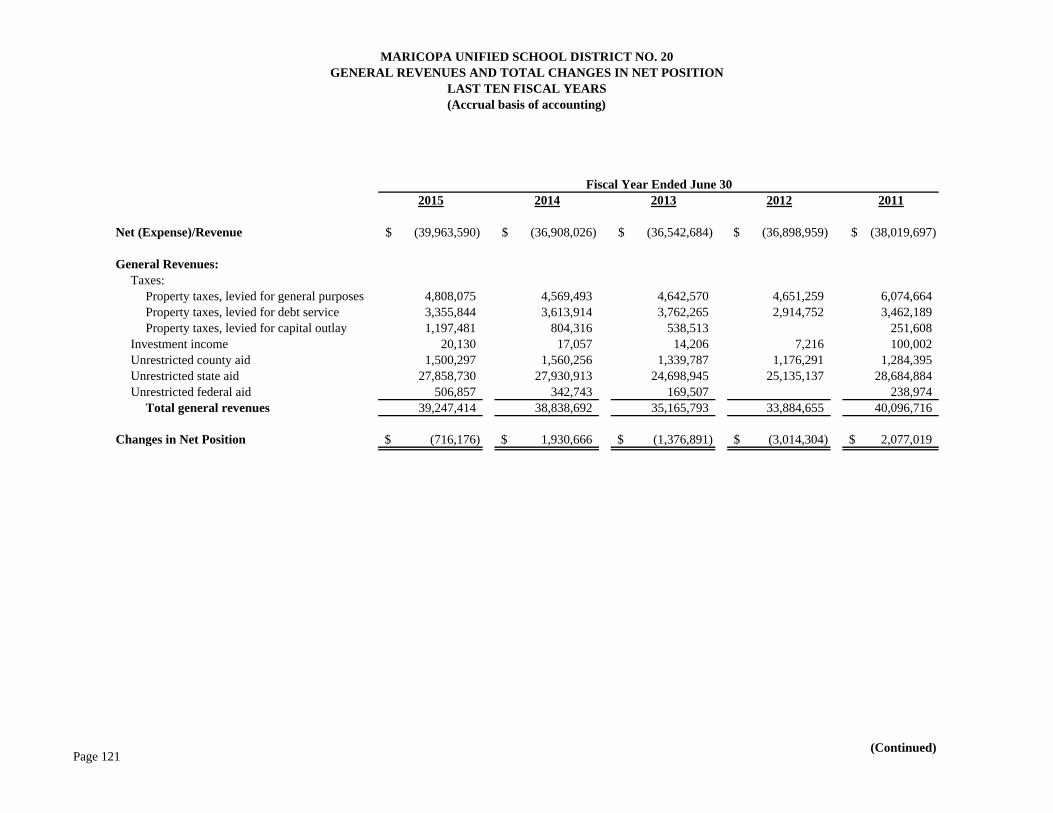
2015 2014 2013 2012 2011
Net (Expense)/Revenue (39,963,590)$ (36,908,026)$ (36,542,684)$ (36,898,959)$ (38,019,697)$
General Revenues: Taxes:
Property taxes, levied for general purposes 4,808,075 4,569,493 4,642,570 4,651,259 6,074,664 Property taxes, levied for debt service 3,355,844 3,613,914 3,762,265 2,914,752 3,462,189 Property taxes, levied for capital outlay 1,197,481 804,316 538,513 251,608
Investment income 20,130 17,057 14,206 7,216 100,002 Unrestricted county aid 1,500,297 1,560,256 1,339,787 1,176,291 1,284,395 Unrestricted state aid 27,858,730 27,930,913 24,698,945 25,135,137 28,684,884 Unrestricted federal aid 506,857 342,743 169,507 238,974
Total general revenues 39,247,414 38,838,692 35,165,793 33,884,655 40,096,716
Changes in Net Position (716,176)$ 1,930,666$ (1,376,891)$ (3,014,304)$ 2,077,019$
Source: The source of this information is the District's financial records.
Note: The provisions of the Governmental Accounting Standards Board (GASB) Statement No. 34 were adopted in fiscal year 2001 therefore only six years are shown.
(Continued)
Fiscal Year Ended June 30
MARICOPA UNIFIED SCHOOL DISTRICT NO. 20GENERAL REVENUES AND TOTAL CHANGES IN NET POSITION
LAST TEN FISCAL YEARS(Accrual basis of accounting)
Page 121
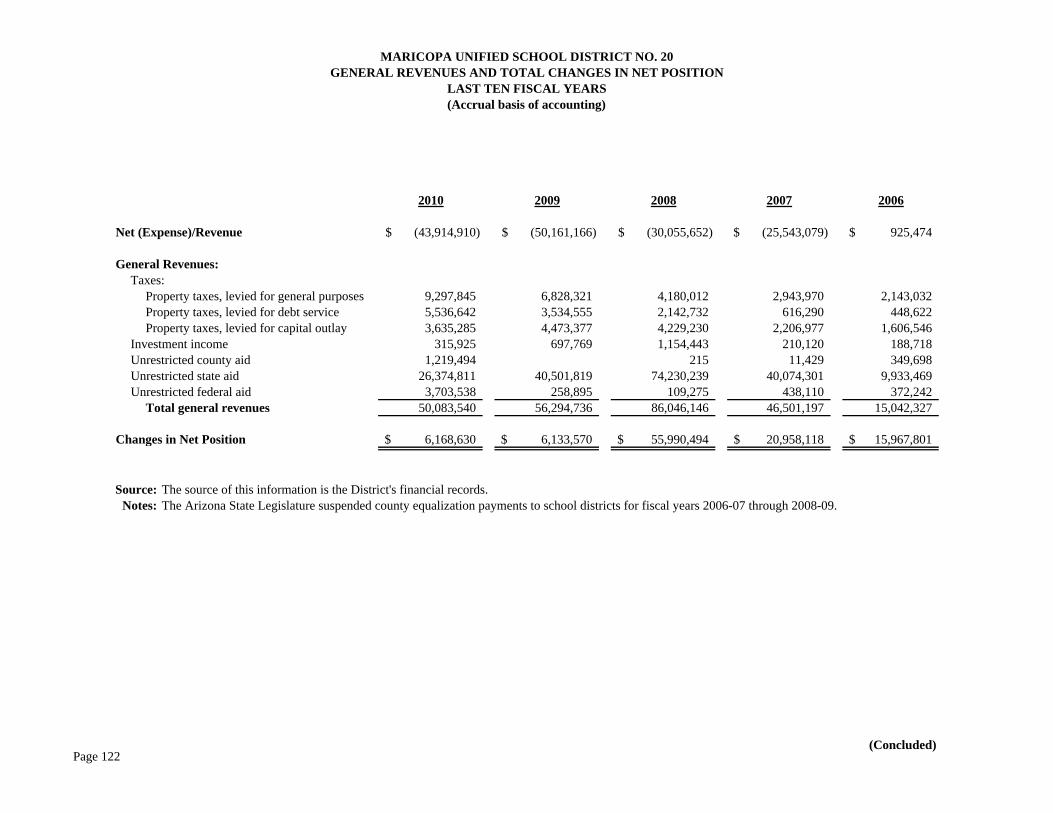
2010 2009 2008 2007 2006
Net (Expense)/Revenue (43,914,910)$ (50,161,166)$ (30,055,652)$ (25,543,079)$ 925,474$
General Revenues: Taxes:
Property taxes, levied for general purposes 9,297,845 6,828,321 4,180,012 2,943,970 2,143,032 Property taxes, levied for debt service 5,536,642 3,534,555 2,142,732 616,290 448,622 Property taxes, levied for capital outlay 3,635,285 4,473,377 4,229,230 2,206,977 1,606,546
Investment income 315,925 697,769 1,154,443 210,120 188,718 Unrestricted county aid 1,219,494 215 11,429 349,698 Unrestricted state aid 26,374,811 40,501,819 74,230,239 40,074,301 9,933,469 Unrestricted federal aid 3,703,538 258,895 109,275 438,110 372,242
Total general revenues 50,083,540 56,294,736 86,046,146 46,501,197 15,042,327
Changes in Net Position 6,168,630$ 6,133,570$ 55,990,494$ 20,958,118$ 15,967,801$
The Arizona State Legislature suspended county equalization payments to school districts for fiscal years 2006-07 through 2008-09.
(Concluded)
GENERAL REVENUES AND TOTAL CHANGES IN NET POSITIONLAST TEN FISCAL YEARS
MARICOPA UNIFIED SCHOOL DISTRICT NO. 20
(Accrual basis of accounting)
The source of this information is the District's financial records.
Fiscal Year Ended June 30
Source: Notes:
Page 122

2015 2014 2013 2012 2011General Fund:
Unassigned 3,223,047$ 4,287,011$ 2,709,258$ 3,202,585$ 4,492,003$ Reserved Unreserved
Total General Fund 3,223,047$ 4,287,011$ 2,709,258$ 3,202,585$ 4,492,003$
All Other Governmental Funds:Nonspendable $ $ $ $ 73,261$ Restricted 9,010,612 7,385,403 5,944,422 5,889,947 7,485,264 Unassigned (390,613) Unreserved, reported in:
Special revenue funds Capital projects funds Debt service fund
Total all other governmental funds 9,010,612$ 7,385,403$ 5,944,422$ 5,889,947$ 7,167,912$
(Continued)
MARICOPA UNIFIED SCHOOL DISTRICT NO. 20FUND BALANCES - GOVERNMENTAL FUNDS
Fiscal Year Ended June 30
LAST TEN FISCAL YEARS(Modified accrual basis of accounting)
Page 123
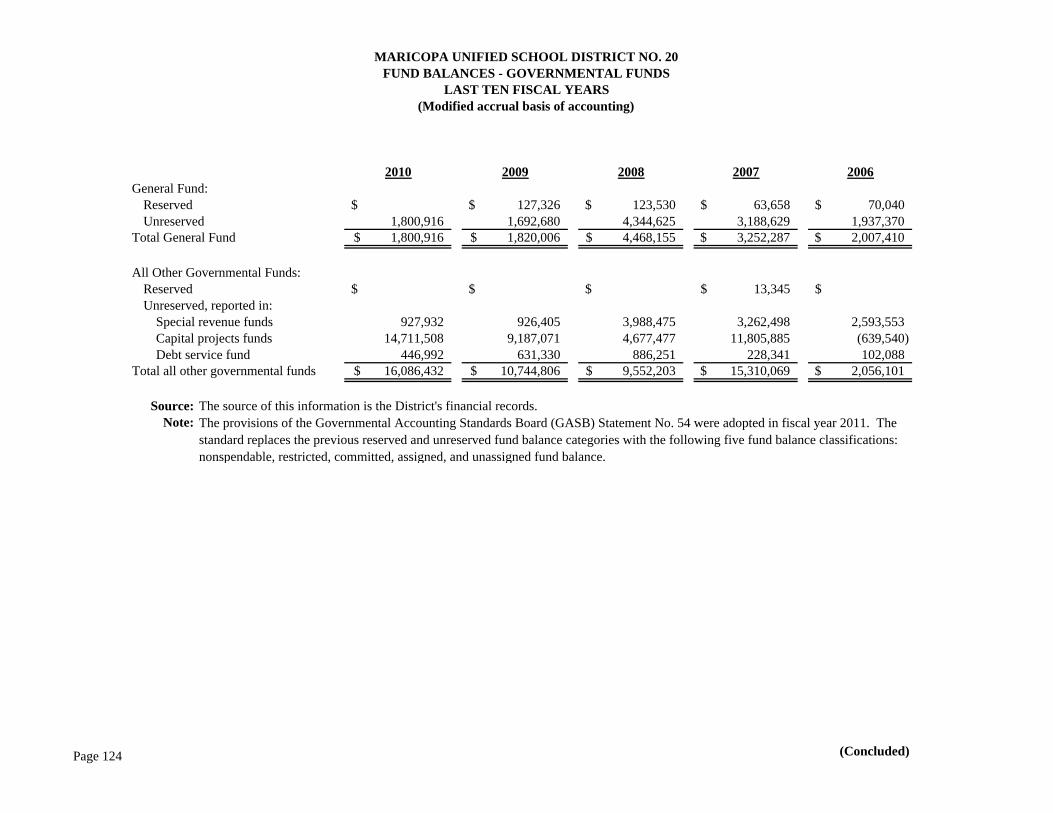
2010 2009 2008 2007 2006General Fund:
Reserved $ 127,326$ 123,530$ 63,658$ 70,040$ Unreserved 1,800,916 1,692,680 4,344,625 3,188,629 1,937,370
Total General Fund 1,800,916$ 1,820,006$ 4,468,155$ 3,252,287$ 2,007,410$
All Other Governmental Funds:Reserved $ $ $ 13,345$ $ Unreserved, reported in:
Special revenue funds 927,932 926,405 3,988,475 3,262,498 2,593,553 Capital projects funds 14,711,508 9,187,071 4,677,477 11,805,885 (639,540) Debt service fund 446,992 631,330 886,251 228,341 102,088
Total all other governmental funds 16,086,432$ 10,744,806$ 9,552,203$ 15,310,069$ 2,056,101$
Source:Note:
(Concluded)
The provisions of the Governmental Accounting Standards Board (GASB) Statement No. 54 were adopted in fiscal year 2011. The standard replaces the previous reserved and unreserved fund balance categories with the following five fund balance classifications: nonspendable, restricted, committed, assigned, and unassigned fund balance.
The source of this information is the District's financial records.
MARICOPA UNIFIED SCHOOL DISTRICT NO. 20FUND BALANCES - GOVERNMENTAL FUNDS
LAST TEN FISCAL YEARS(Modified accrual basis of accounting)
Page 124
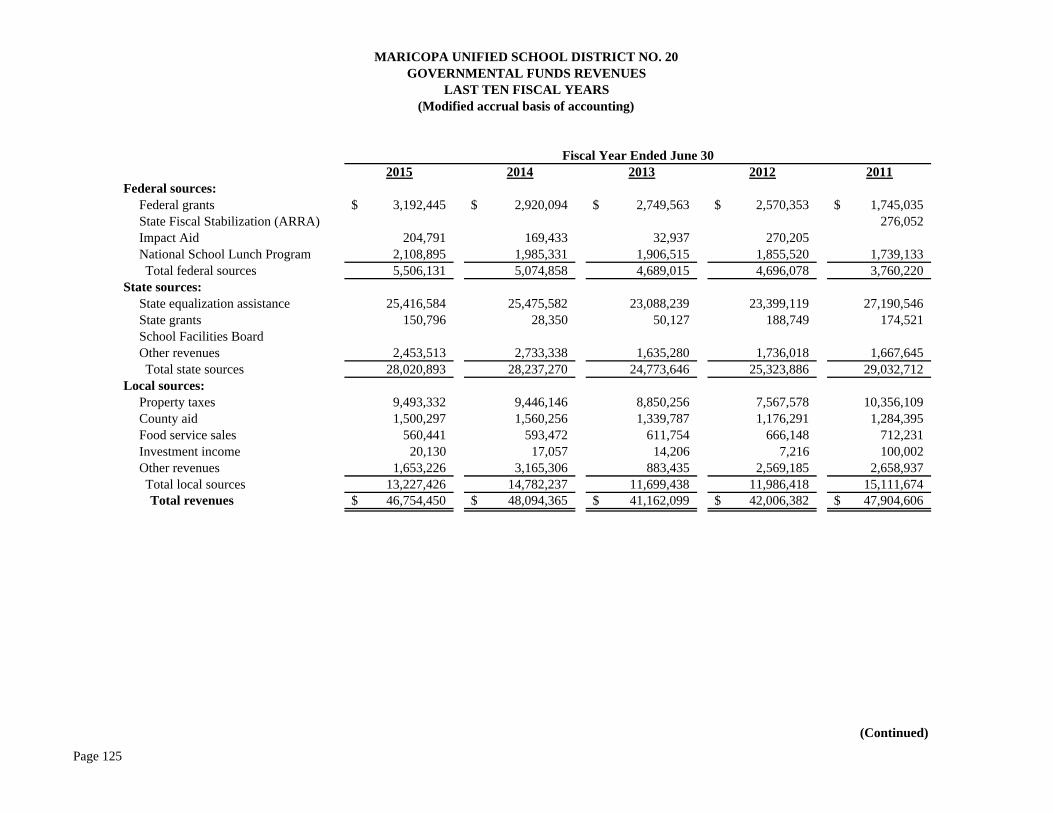
2015 2014 2013 2012 2011Federal sources:
Federal grants 3,192,445$ 2,920,094$ 2,749,563$ 2,570,353$ 1,745,035$ State Fiscal Stabilization (ARRA) 276,052 Impact Aid 204,791 169,433 32,937 270,205 National School Lunch Program 2,108,895 1,985,331 1,906,515 1,855,520 1,739,133 Total federal sources 5,506,131 5,074,858 4,689,015 4,696,078 3,760,220
State sources:State equalization assistance 25,416,584 25,475,582 23,088,239 23,399,119 27,190,546 State grants 150,796 28,350 50,127 188,749 174,521 School Facilities Board Other revenues 2,453,513 2,733,338 1,635,280 1,736,018 1,667,645 Total state sources 28,020,893 28,237,270 24,773,646 25,323,886 29,032,712
Local sources:Property taxes 9,493,332 9,446,146 8,850,256 7,567,578 10,356,109 County aid 1,500,297 1,560,256 1,339,787 1,176,291 1,284,395 Food service sales 560,441 593,472 611,754 666,148 712,231 Investment income 20,130 17,057 14,206 7,216 100,002 Other revenues 1,653,226 3,165,306 883,435 2,569,185 2,658,937 Total local sources 13,227,426 14,782,237 11,699,438 11,986,418 15,111,674 Total revenues 46,754,450$ 48,094,365$ 41,162,099$ 42,006,382$ 47,904,606$
(Continued)
MARICOPA UNIFIED SCHOOL DISTRICT NO. 20GOVERNMENTAL FUNDS REVENUES
LAST TEN FISCAL YEARS
Fiscal Year Ended June 30
(Modified accrual basis of accounting)
Page 125
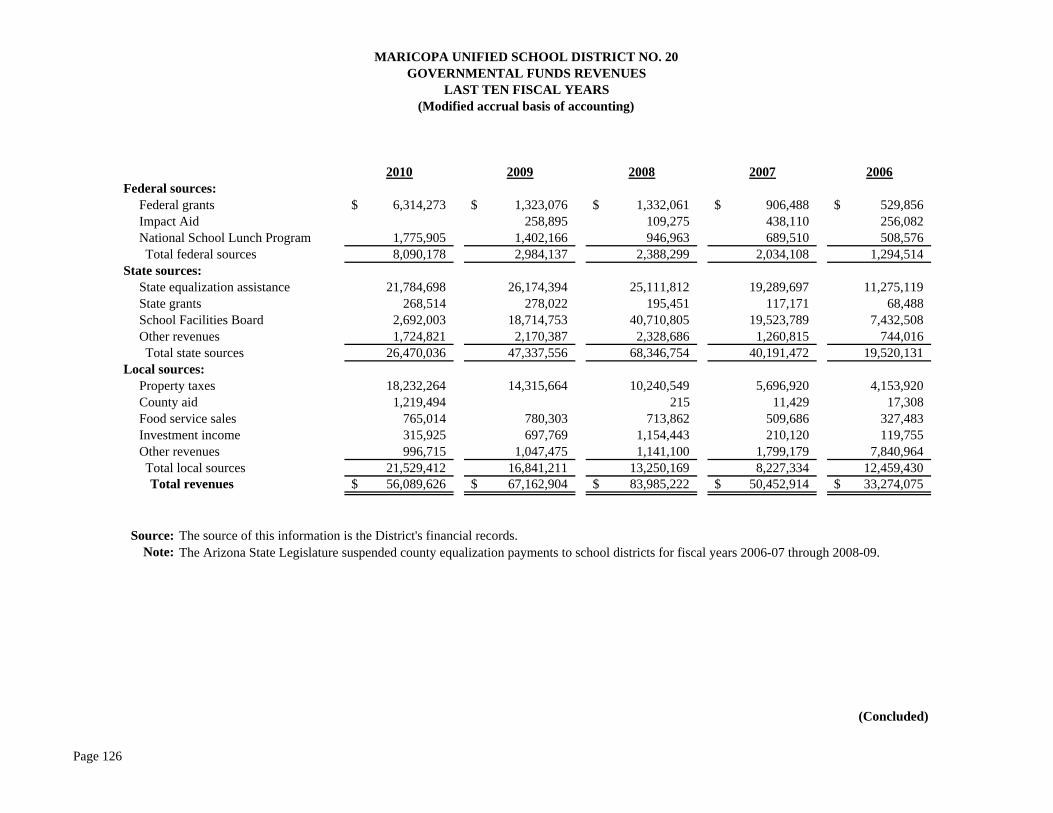
2010 2009 2008 2007 2006Federal sources:
Federal grants 6,314,273$ 1,323,076$ 1,332,061$ 906,488$ 529,856$ Impact Aid 258,895 109,275 438,110 256,082 National School Lunch Program 1,775,905 1,402,166 946,963 689,510 508,576 Total federal sources 8,090,178 2,984,137 2,388,299 2,034,108 1,294,514
State sources:State equalization assistance 21,784,698 26,174,394 25,111,812 19,289,697 11,275,119 State grants 268,514 278,022 195,451 117,171 68,488 School Facilities Board 2,692,003 18,714,753 40,710,805 19,523,789 7,432,508 Other revenues 1,724,821 2,170,387 2,328,686 1,260,815 744,016 Total state sources 26,470,036 47,337,556 68,346,754 40,191,472 19,520,131
Local sources:Property taxes 18,232,264 14,315,664 10,240,549 5,696,920 4,153,920 County aid 1,219,494 215 11,429 17,308 Food service sales 765,014 780,303 713,862 509,686 327,483 Investment income 315,925 697,769 1,154,443 210,120 119,755 Other revenues 996,715 1,047,475 1,141,100 1,799,179 7,840,964 Total local sources 21,529,412 16,841,211 13,250,169 8,227,334 12,459,430 Total revenues 56,089,626$ 67,162,904$ 83,985,222$ 50,452,914$ 33,274,075$
The Arizona State Legislature suspended county equalization payments to school districts for fiscal years 2006-07 through 2008-09.
(Concluded)
Note:Source: The source of this information is the District's financial records.
MARICOPA UNIFIED SCHOOL DISTRICT NO. 20GOVERNMENTAL FUNDS REVENUES
LAST TEN FISCAL YEARS(Modified accrual basis of accounting)
Page 126
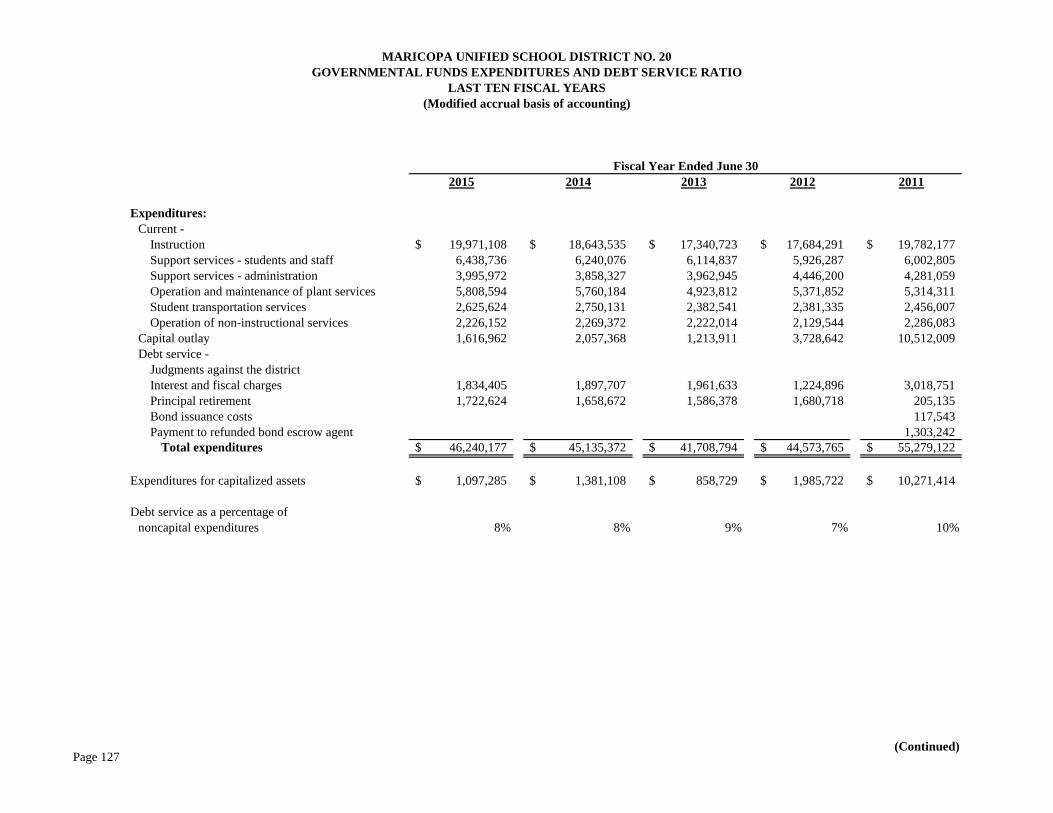
2015 2014 2013 2012 2011
Expenditures:Current -
Instruction 19,971,108$ 18,643,535$ 17,340,723$ 17,684,291$ 19,782,177$ Support services - students and staff 6,438,736 6,240,076 6,114,837 5,926,287 6,002,805 Support services - administration 3,995,972 3,858,327 3,962,945 4,446,200 4,281,059 Operation and maintenance of plant services 5,808,594 5,760,184 4,923,812 5,371,852 5,314,311 Student transportation services 2,625,624 2,750,131 2,382,541 2,381,335 2,456,007 Operation of non-instructional services 2,226,152 2,269,372 2,222,014 2,129,544 2,286,083
Capital outlay 1,616,962 2,057,368 1,213,911 3,728,642 10,512,009 Debt service -
Judgments against the district Interest and fiscal charges 1,834,405 1,897,707 1,961,633 1,224,896 3,018,751 Principal retirement 1,722,624 1,658,672 1,586,378 1,680,718 205,135 Bond issuance costs 117,543 Payment to refunded bond escrow agent 1,303,242
Total expenditures 46,240,177$ 45,135,372$ 41,708,794$ 44,573,765$ 55,279,122$
Expenditures for capitalized assets 1,097,285$ 1,381,108$ 858,729$ 1,985,722$ 10,271,414$
Debt service as a percentage ofnoncapital expenditures 8% 8% 9% 7% 10%
Source: The source of this information is the District's financial records.Notes:
(Continued)
MARICOPA UNIFIED SCHOOL DISTRICT NO. 20GOVERNMENTAL FUNDS EXPENDITURES AND DEBT SERVICE RATIO
Fiscal Year Ended June 30
LAST TEN FISCAL YEARS(Modified accrual basis of accounting)
Page 127
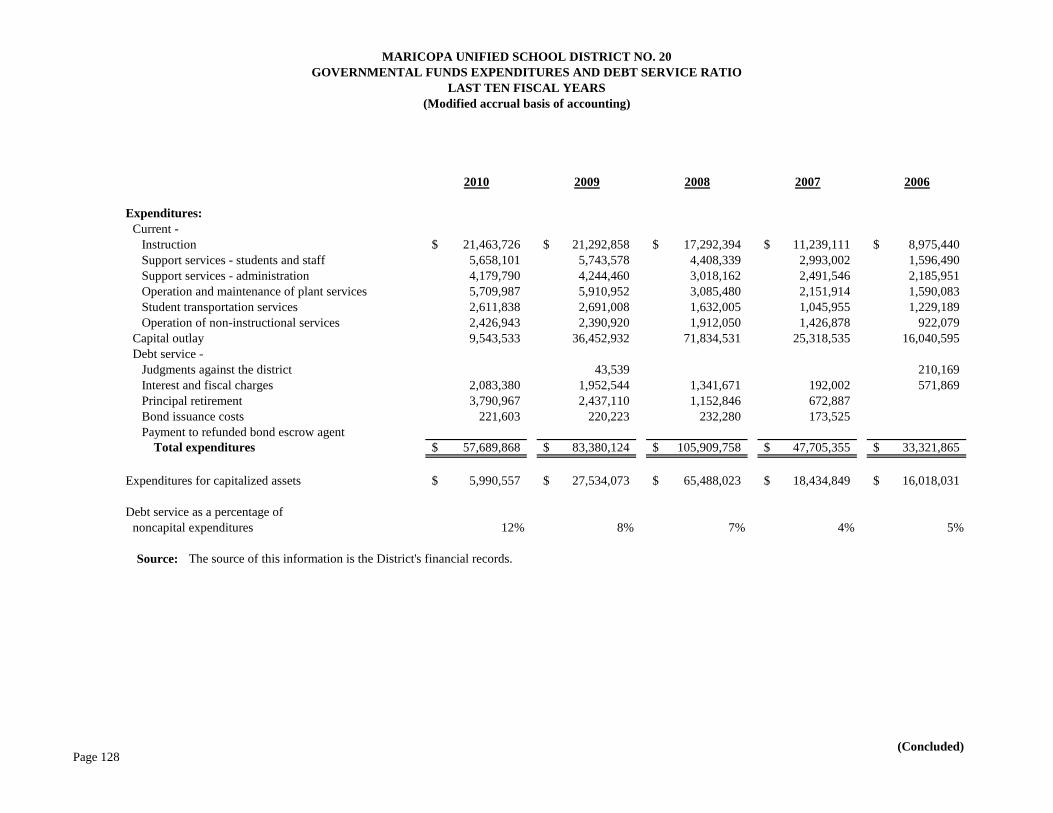
2010 2009 2008 2007 2006
Expenditures:Current -
Instruction 21,463,726$ 21,292,858$ 17,292,394$ 11,239,111$ 8,975,440$ Support services - students and staff 5,658,101 5,743,578 4,408,339 2,993,002 1,596,490 Support services - administration 4,179,790 4,244,460 3,018,162 2,491,546 2,185,951 Operation and maintenance of plant services 5,709,987 5,910,952 3,085,480 2,151,914 1,590,083 Student transportation services 2,611,838 2,691,008 1,632,005 1,045,955 1,229,189 Operation of non-instructional services 2,426,943 2,390,920 1,912,050 1,426,878 922,079
Capital outlay 9,543,533 36,452,932 71,834,531 25,318,535 16,040,595 Debt service -
Judgments against the district 43,539 210,169 Interest and fiscal charges 2,083,380 1,952,544 1,341,671 192,002 571,869 Principal retirement 3,790,967 2,437,110 1,152,846 672,887 Bond issuance costs 221,603 220,223 232,280 173,525 Payment to refunded bond escrow agent
Total expenditures 57,689,868$ 83,380,124$ 105,909,758$ 47,705,355$ 33,321,865$
Expenditures for capitalized assets 5,990,557$ 27,534,073$ 65,488,023$ 18,434,849$ 16,018,031$
Debt service as a percentage ofnoncapital expenditures 12% 8% 7% 4% 5%
Source:
(Concluded)
MARICOPA UNIFIED SCHOOL DISTRICT NO. 20GOVERNMENTAL FUNDS EXPENDITURES AND DEBT SERVICE RATIO
The source of this information is the District's financial records.
Fiscal Year Ended June 30
LAST TEN FISCAL YEARS(Modified accrual basis of accounting)
Page 128
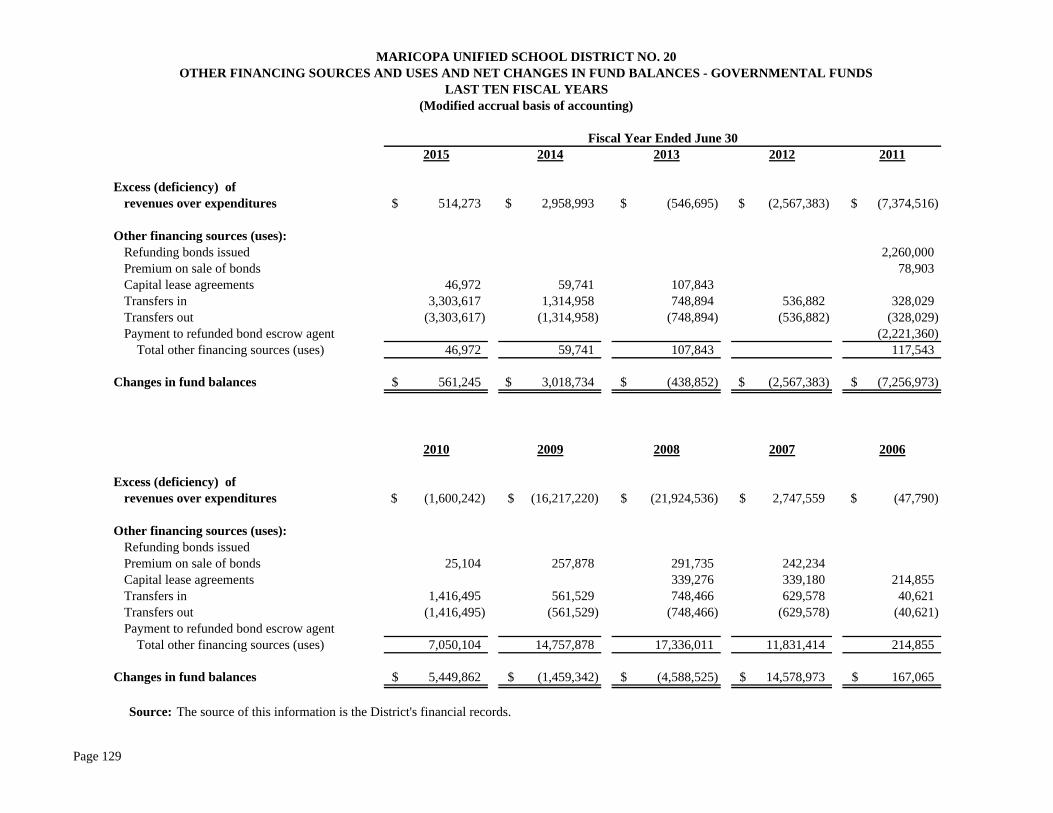
2015 2014 2013 2012 2011
Excess (deficiency) of revenues over expenditures 514,273$ 2,958,993$ (546,695)$ (2,567,383)$ (7,374,516)$
Other financing sources (uses):Refunding bonds issued 2,260,000 Premium on sale of bonds 78,903 Capital lease agreements 46,972 59,741 107,843 Transfers in 3,303,617 1,314,958 748,894 536,882 328,029 Transfers out (3,303,617) (1,314,958) (748,894) (536,882) (328,029) Payment to refunded bond escrow agent (2,221,360)
Total other financing sources (uses) 46,972 59,741 107,843 117,543
Changes in fund balances 561,245$ 3,018,734$ (438,852)$ (2,567,383)$ (7,256,973)$
2010 2009 2008 2007 2006
Excess (deficiency) of revenues over expenditures (1,600,242)$ (16,217,220)$ (21,924,536)$ 2,747,559$ (47,790)$
Other financing sources (uses):Refunding bonds issued Premium on sale of bonds 25,104 257,878 291,735 242,234 Capital lease agreements 339,276 339,180 214,855 Transfers in 1,416,495 561,529 748,466 629,578 40,621 Transfers out (1,416,495) (561,529) (748,466) (629,578) (40,621) Payment to refunded bond escrow agent
Total other financing sources (uses) 7,050,104 14,757,878 17,336,011 11,831,414 214,855
Changes in fund balances 5,449,862$ (1,459,342)$ (4,588,525)$ 14,578,973$ 167,065$
Source: The source of this information is the District's financial records.
MARICOPA UNIFIED SCHOOL DISTRICT NO. 20OTHER FINANCING SOURCES AND USES AND NET CHANGES IN FUND BALANCES - GOVERNMENTAL FUNDS
LAST TEN FISCAL YEARS
Fiscal Year Ended June 30
(Modified accrual basis of accounting)
Page 129

Class 2015 2014 2013 2012 2011
Commercial, Industrial, Utilities and Mining $ 38,979,194 $ 46,731,414 $ 49,528,106 $ 45,074,519 $ 38,711,153
Agricultural and Vacant 24,396,355 25,568,361 25,516,271 26,226,089 40,018,826
Residential (Owner Occupied) 115,931,506 111,873,300 133,369,904 147,560,637 185,829,714
Residential (Rental) 48,963,892 36,627,549 22,310,937 13,661,268 16,607,017
Railroad, Private Cars and Airlines 2,106,407 1,641,389 1,233,309 979,381 453,212
Historical Property 286,425 2,568,212 2,944,292
Total $ 230,663,779 $ 222,442,013 $ 231,958,527 $ 236,070,106 $ 284,564,214
Estimated Actual Value (Full Cash Value) $ 2,131,161,433 $ 1,989,580,753 $ 2,061,909,793 $ 2,163,643,102 $ 2,616,440,719
Ratio of Primary Assessed Value to Estimated Actual Value 10.82% 11.18% 11.25% 10.91% 10.88%Total Direct Rate 6.63 6.60 6.60 5.45 5.51
Class 2010 2009 2008 2007 2006
Commercial, Industrial, Utilities and Mining $ 34,533,408 $ 30,112,919 $ 24,800,443 $ 18,352,295 $ 14,036,610
Agricultural and Vacant 56,465,726 49,451,202 31,670,165 20,333,083 15,050,723
Residential (Owner Occupied) 255,188,042 198,386,553 139,514,882 58,303,308 31,970,731
Residential (Rental) 19,304,031 13,353,273 7,632,011 4,375,259 1,033,050
Railroad, Private Cars and Airlines 419,318 453,888 474,852 773,950 757,602
Historical Property 2,676,284 14,652
Total $ 368,586,809 $ 291,772,487 $ 204,092,353 $ 102,137,895 $ 62,848,716
Estimated Actual Value (Full Cash Value) $ 3,855,797,951 $ 3,700,464,802 $ 2,444,151,104 $ 925,964,186 $ 569,434,622
Ratio of Primary Value to Estimated Actual Value 9.56% 7.88% 8.35% 11.03% 11.04%
Total Direct Rate 5.97 6.43 7.17 7.99 7.95
Source:
Note: The primary assessed value generates revenues for general District operations.
MARICOPA UNIFIED SCHOOL DISTRICT NO. 20PRIMARY ASSESSED VALUE AND ESTIMATED ACTUAL VALUE OF TAXABLE PROPERTY BY CLASS
LAST TEN FISCAL YEARS
Fiscal Year
Fiscal Year
The source of this information is the State and County Abstract of the Assessment Roll, Arizona Department of Revenue.
Page 130
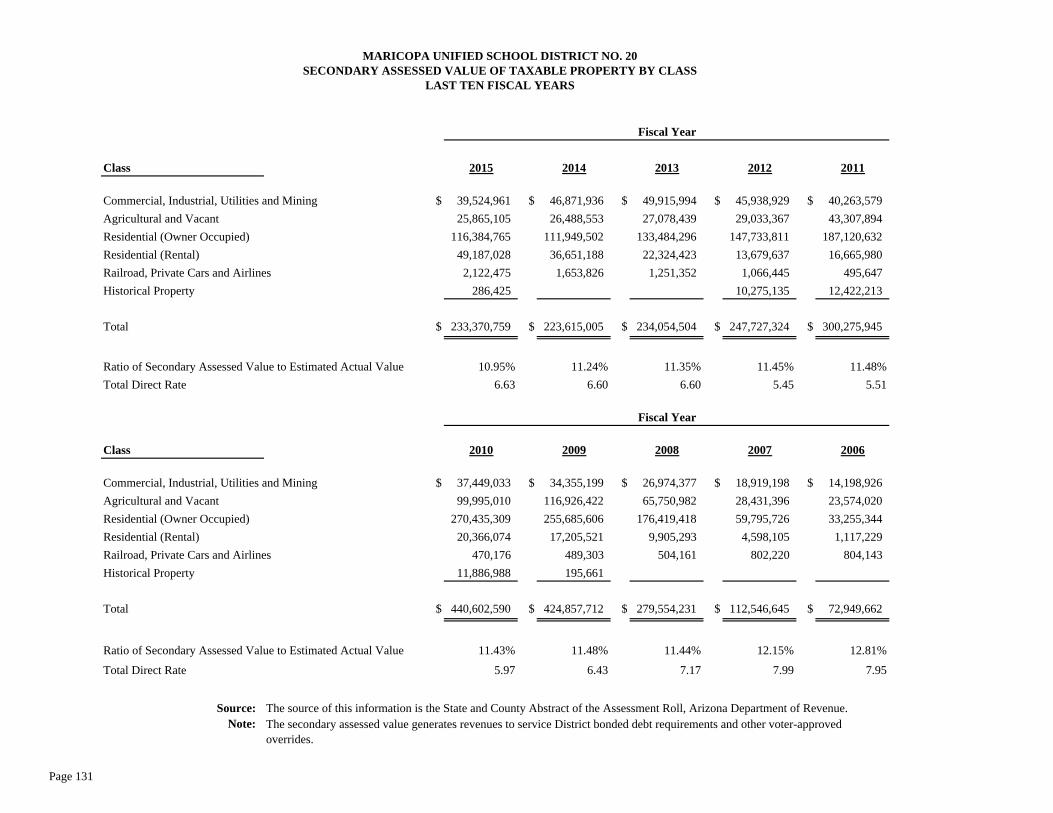
Class 2015 2014 2013 2012 2011
Commercial, Industrial, Utilities and Mining $ 39,524,961 $ 46,871,936 $ 49,915,994 $ 45,938,929 $ 40,263,579
Agricultural and Vacant 25,865,105 26,488,553 27,078,439 29,033,367 43,307,894
Residential (Owner Occupied) 116,384,765 111,949,502 133,484,296 147,733,811 187,120,632
Residential (Rental) 49,187,028 36,651,188 22,324,423 13,679,637 16,665,980
Railroad, Private Cars and Airlines 2,122,475 1,653,826 1,251,352 1,066,445 495,647
Historical Property 286,425 10,275,135 12,422,213
Total $ 233,370,759 $ 223,615,005 $ 234,054,504 $ 247,727,324 $ 300,275,945
Ratio of Secondary Assessed Value to Estimated Actual Value 10.95% 11.24% 11.35% 11.45% 11.48%
Total Direct Rate 6.63 6.60 6.60 5.45 5.51
Class 2010 2009 2008 2007 2006
Commercial, Industrial, Utilities and Mining $ 37,449,033 $ 34,355,199 $ 26,974,377 $ 18,919,198 $ 14,198,926
Agricultural and Vacant 99,995,010 116,926,422 65,750,982 28,431,396 23,574,020
Residential (Owner Occupied) 270,435,309 255,685,606 176,419,418 59,795,726 33,255,344
Residential (Rental) 20,366,074 17,205,521 9,905,293 4,598,105 1,117,229
Railroad, Private Cars and Airlines 470,176 489,303 504,161 802,220 804,143
Historical Property 11,886,988 195,661
Total $ 440,602,590 $ 424,857,712 $ 279,554,231 $ 112,546,645 $ 72,949,662
Ratio of Secondary Assessed Value to Estimated Actual Value 11.43% 11.48% 11.44% 12.15% 12.81%
Total Direct Rate 5.97 6.43 7.17 7.99 7.95
Source: Note: The secondary assessed value generates revenues to service District bonded debt requirements and other voter-approved
overrides.
The source of this information is the State and County Abstract of the Assessment Roll, Arizona Department of Revenue.
MARICOPA UNIFIED SCHOOL DISTRICT NO. 20SECONDARY ASSESSED VALUE OF TAXABLE PROPERTY BY CLASS
LAST TEN FISCAL YEARS
Fiscal Year
Fiscal Year
Page 131
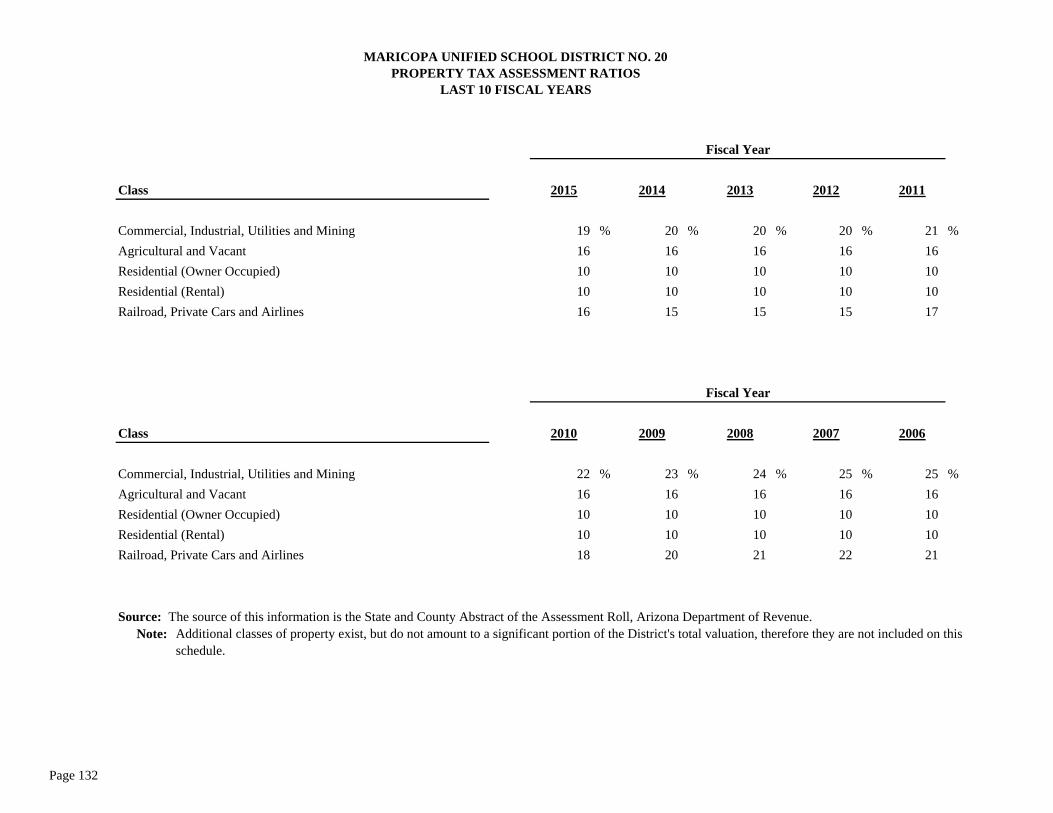
Class 2015 2014 2013 2012 2011
Commercial, Industrial, Utilities and Mining 19 % 20 % 20 % 20 % 21 %
Agricultural and Vacant 16 16 16 16 16
Residential (Owner Occupied) 10 10 10 10 10
Residential (Rental) 10 10 10 10 10
Railroad, Private Cars and Airlines 16 15 15 15 17
Class 2010 2009 2008 2007 2006
Commercial, Industrial, Utilities and Mining 22 % 23 % 24 % 25 % 25 %
Agricultural and Vacant 16 16 16 16 16
Residential (Owner Occupied) 10 10 10 10 10
Residential (Rental) 10 10 10 10 10
Railroad, Private Cars and Airlines 18 20 21 22 21
Source: The source of this information is the State and County Abstract of the Assessment Roll, Arizona Department of Revenue.Note: Additional classes of property exist, but do not amount to a significant portion of the District's total valuation, therefore they are not included on this
schedule.
MARICOPA UNIFIED SCHOOL DISTRICT NO. 20PROPERTY TAX ASSESSMENT RATIOS
LAST 10 FISCAL YEARS
Fiscal Year
Fiscal Year
Page 132

Fiscal Year City
Ended ofJune 30 County Maricopa Primary Secondary Total
2015 0.51 3.80 0.10 0.17 2.26 0.07 0.14 7.34 0.05 5.16 1.47 6.63 2014 0.51 3.80 0.10 0.17 2.25 0.07 0.14 6.85 0.05 4.97 1.63 6.60 2013 0.47 3.80 0.10 0.17 1.88 0.08 0.10 5.57 0.05 4.95 1.65 6.60 2012 0.43 4.00 0.10 0.17 1.85 0.06 0.10 5.46 0.05 3.85 1.60 5.45 2011 0.36 4.00 0.10 0.17 1.59 0.05 0.10 4.57 0.05 3.58 1.93 5.51 2010 0.33 3.36 0.10 0.17 1.46 0.04 0.10 2.89 0.05 4.05 1.92 5.97 2009 3.56 0.10 0.15 1.41 0.04 0.10 3.23 0.05 5.57 0.86 6.43 2008 4.14 0.08 0.13 1.80 0.05 0.10 3.76 0.05 5.69 1.48 7.17 2007 4.44 0.06 0.11 2.05 0.09 0.12 3.20 0.05 6.43 1.56 7.99 2006 4.59 0.06 0.09 2.10 0.09 0.12 0.05 6.12 1.83 7.95
There was no state equalization tax rate overlap prior to 2010.Source:
MARICOPA UNIFIED SCHOOL DISTRICT NO. 20DIRECT AND OVERLAPPING PROPERTY TAX RATES
LAST TEN FISCAL YEARS
Source:
District Direct Rates
The source of this information is the Property Tax Rates and Assessed Values, Arizona Tax Research Foundation.
Overlapping Rates
State Equalization
County Free
Library
Flood Control District
Community College District
Fire District
Assistance
Central Arizona Water
Central Arizona Valley Institute of Technology
Page 133
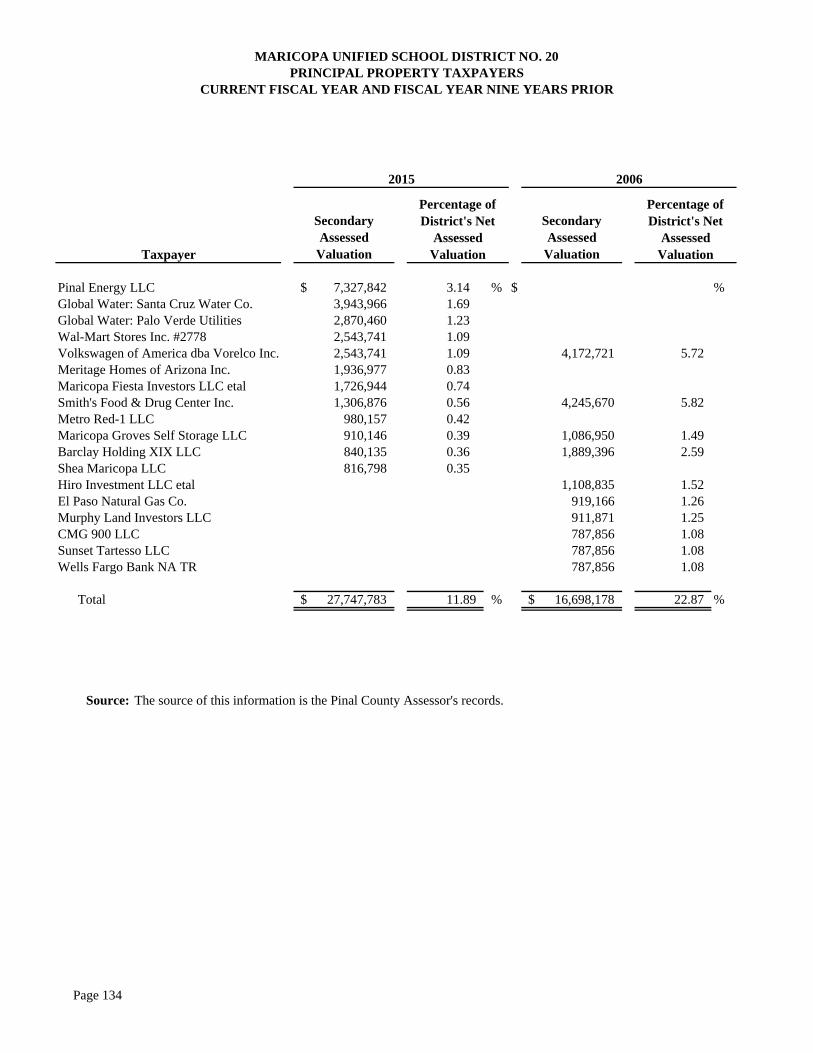
Secondary Assessed
Valuation
Secondary Assessed
Valuation
Pinal Energy LLC 7,327,842$ 3.14 % $ %Global Water: Santa Cruz Water Co. 3,943,966 1.69Global Water: Palo Verde Utilities 2,870,460 1.23Wal-Mart Stores Inc. #2778 2,543,741 1.09Volkswagen of America dba Vorelco Inc. 2,543,741 1.09 4,172,721 5.72 Meritage Homes of Arizona Inc. 1,936,977 0.83Maricopa Fiesta Investors LLC etal 1,726,944 0.74Smith's Food & Drug Center Inc. 1,306,876 0.56 4,245,670 5.82 Metro Red-1 LLC 980,157 0.42Maricopa Groves Self Storage LLC 910,146 0.39 1,086,950 1.49 Barclay Holding XIX LLC 840,135 0.36 1,889,396 2.59 Shea Maricopa LLC 816,798 0.35Hiro Investment LLC etal 1,108,835 1.52 El Paso Natural Gas Co. 919,166 1.26 Murphy Land Investors LLC 911,871 1.25 CMG 900 LLC 787,856 1.08 Sunset Tartesso LLC 787,856 1.08 Wells Fargo Bank NA TR 787,856 1.08
Total 27,747,783$ 11.89 % 16,698,178$ 22.87 %
Source: The source of this information is the Pinal County Assessor's records.
MARICOPA UNIFIED SCHOOL DISTRICT NO. 20PRINCIPAL PROPERTY TAXPAYERS
CURRENT FISCAL YEAR AND FISCAL YEAR NINE YEARS PRIOR
Percentage of District's Net
Assessed Valuation
Percentage of District's Net
Assessed Valuation
2006
Taxpayer
2015
Page 134

FiscalYear Taxes Levied Collections in
Ended for the Subsequent June 30 Fiscal Year Amount Fiscal Years Amount(2)
2015 9,151,412$ 8,957,236$ 97.88 % $ 8,957,236$ 97.88 %2014 8,673,371 8,412,802 97.00 256,835 8,669,637 99.962013 8,399,830 7,679,318 91.42 717,363 8,396,681 99.962012 7,036,117 6,569,072 93.36 460,417 7,029,489 99.912011 9,196,600 8,763,377 95.29 431,278 9,194,655 99.982010 17,707,459 15,238,042 86.05 2,467,980 17,706,022 99.992009 14,334,851 13,266,069 92.54 1,066,811 14,332,880 99.992008 10,135,409 9,554,681 94.27 579,765 10,134,446 99.992007 5,369,358 5,157,541 96.06 211,804 5,369,345 100.002006 3,925,628 3,803,830 96.90 121,798 3,925,628 100.00
Source:Notes: 1)
2)
Fiscal Year of the LevyCollected within the
of the Current Fiscal Year
MARICOPA UNIFIED SCHOOL DISTRICT NO. 20PROPERTY TAX LEVIES AND COLLECTIONS
LAST TEN FISCAL YEARS
Collected to the End
Unsecured personal property taxes are not included in this schedule because the dates of the monthly rollsvary each year. On the average, 90% of unsecured property taxes are collected within 90 days after thedue date.
Amounts collected are on a cash basis.The source of this information is the Pinal County Treasurer's records.
of LevyPercentage
of LevyPercentage
Page 135

Fiscal Less: Percentage of Percentage of Year Estimated Estimated Percentage of
Ended Actual Value Per Actual Value Per Personal June 30 Total (Full Cash Value) Capita Total (Full Cash Value) Capita Income
2015 38,380,000$ 310,788$ 38,069,212$ 1.79 % 793$ 111,882$ 38,491,882$ 1.81 % 802$ 0.37 %2014 40,060,000 457,585 39,602,415 1.99 858 107,534 40,167,534 2.02 871 0.40 2013 43,245,000 180,447 43,064,553 2.09 961 81,465 43,326,465 2.10 967 0.45 2012 44,780,000 21,316 44,758,684 2.07 1,029 44,780,000 2.07 1,029 0.51 2011 44,805,000 44,805,000 1.71 1,030 145,718 44,950,718 1.72 1,033 0.54 2010 49,370,000 3,620,000 45,750,000 1.19 1,160 325,853 49,695,853 1.29 1,260 0.63 2009 44,595,000 2,250,000 42,345,000 1.14 931 496,820 45,091,820 1.22 991 0.65 2008 31,020,000 925,000 30,095,000 1.23 813 683,930 31,703,930 1.30 857 0.52 2007 14,735,000 420,000 14,315,000 1.55 409 572,500 15,307,500 1.65 437 0.31 2006 3,885,000 400,000 3,485,000 0.61 135 486,207 4,371,207 0.77 169 0.10
Source: The source of this information is the District's financial records.
General Obligation Bonds
MARICOPA UNIFIED SCHOOL DISTRICT NO. 20OUTSTANDING DEBT BY TYPE
LAST TEN FISCAL YEARS
Total Outstanding Debt
General Obligation
Bonds
Amounts Restricted
for PrincipalCapital Leases
Page 136
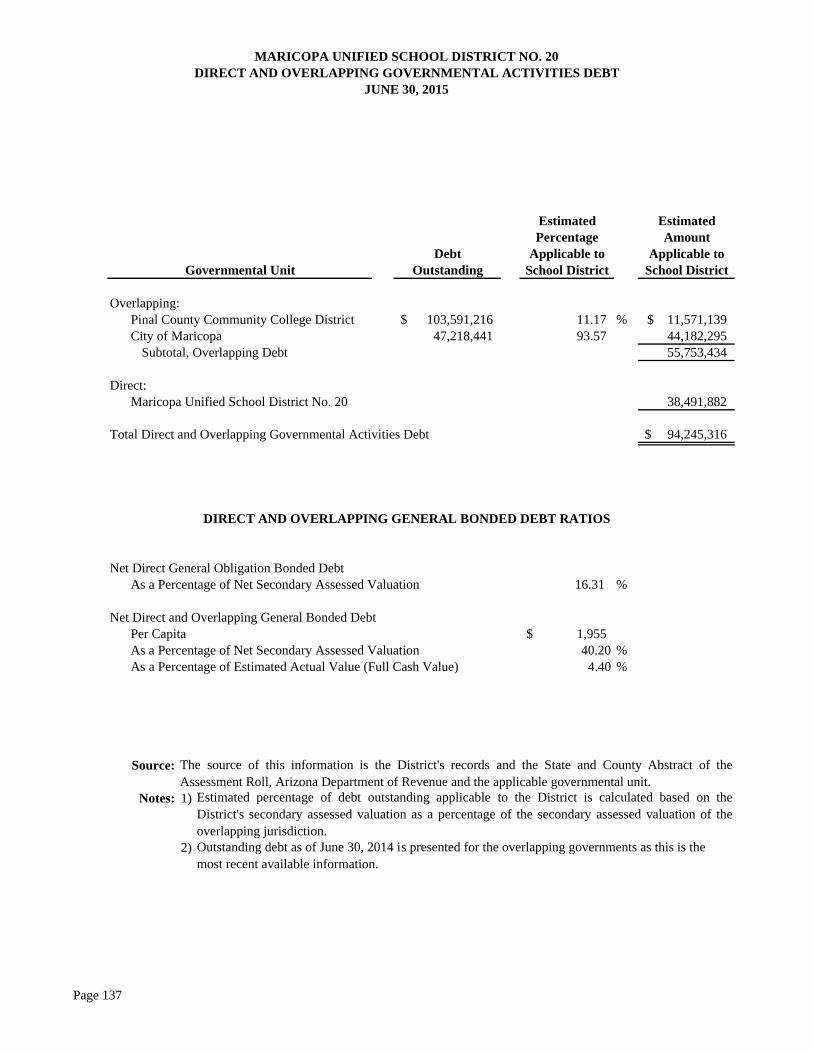
Estimated EstimatedPercentage Amount
Debt Applicable to Applicable toOutstanding School District School District
Overlapping:Pinal County Community College District 103,591,216$ 11.17 % 11,571,139$ City of Maricopa 47,218,441 93.57 44,182,295
Subtotal, Overlapping Debt 55,753,434
Direct:Maricopa Unified School District No. 20 38,491,882
Total Direct and Overlapping Governmental Activities Debt 94,245,316$
Net Direct General Obligation Bonded DebtAs a Percentage of Net Secondary Assessed Valuation 16.31 %
Net Direct and Overlapping General Bonded DebtPer Capita 1,955$ As a Percentage of Net Secondary Assessed Valuation 40.20 %As a Percentage of Estimated Actual Value (Full Cash Value) 4.40 %
Source:
Notes: 1)
2)
The source of this information is the District's records and the State and County Abstract of theAssessment Roll, Arizona Department of Revenue and the applicable governmental unit.
Estimated percentage of debt outstanding applicable to the District is calculated based on theDistrict's secondary assessed valuation as a percentage of the secondary assessed valuation of theoverlapping jurisdiction.Outstanding debt as of June 30, 2014 is presented for the overlapping governments as this is the most recent available information.
MARICOPA UNIFIED SCHOOL DISTRICT NO. 20DIRECT AND OVERLAPPING GOVERNMENTAL ACTIVITIES DEBT
JUNE 30, 2015
Governmental Unit
DIRECT AND OVERLAPPING GENERAL BONDED DEBT RATIOS
Page 137

Class B Bond Legal Debt Margin Calculation for Fiscal Year 2015: Total Legal Debt Margin Calculation for Fiscal Year 2015:Secondary assessed valuation 233,370,759$ Secondary assessed valuation 233,370,759$ Debt limit (20% of assessed value) 46,674,152 Debt limit (30% of assessed value) 70,011,228 Debt applicable to limit 38,380,000 Debt applicable to limit 38,380,000 Legal debt margin 8,294,152$ Legal debt margin 31,631,228$
2015 2014 2013 2012 2011
Debt Limit 70,011,228$ 67,084,502$ 70,216,351$ 74,318,197$ 90,082,784$
Total net debt applicable to limit 38,380,000 40,060,000 43,245,000 44,758,684 44,805,000
Legal debt margin 31,631,228$ 27,024,502$ 26,971,351$ 29,559,513$ 45,277,784$
Total net debt applicable to the limit as a percentage of debt limit 55% 60% 62% 60% 50%
2010 2009 2008 2007 2006
Debt Limit 132,180,777$ 127,457,314$ 83,866,269$ 33,763,994$ 21,730,387$
Total net debt applicable to limit 45,750,000 42,345,000 30,095,000 14,315,000 3,485,000
Legal debt margin 86,430,777$ 85,112,314$ 53,771,269$ 19,448,994$ 18,245,387$
Total net debt applicable to the limit as a percentage of debt limit 35% 33% 36% 42% 16%
Source:Notes: 1)
2) Bond premium is not subject to the statutory debt limit.
The District’s general obligation bonds are subject to two limits; the Constitutional debt limit (total debt limit) on all general obligationbonds and the statutory debt limit on Class B bonds. The calculations of the debt margins are presented in detail for the current fiscal yearonly.
MARICOPA UNIFIED SCHOOL DISTRICT NO. 20LEGAL DEBT MARGIN INFORMATION
LAST TEN FISCAL YEARS
Fiscal Year Ended June 30
The source of this information is the District's financial records.
Page 138
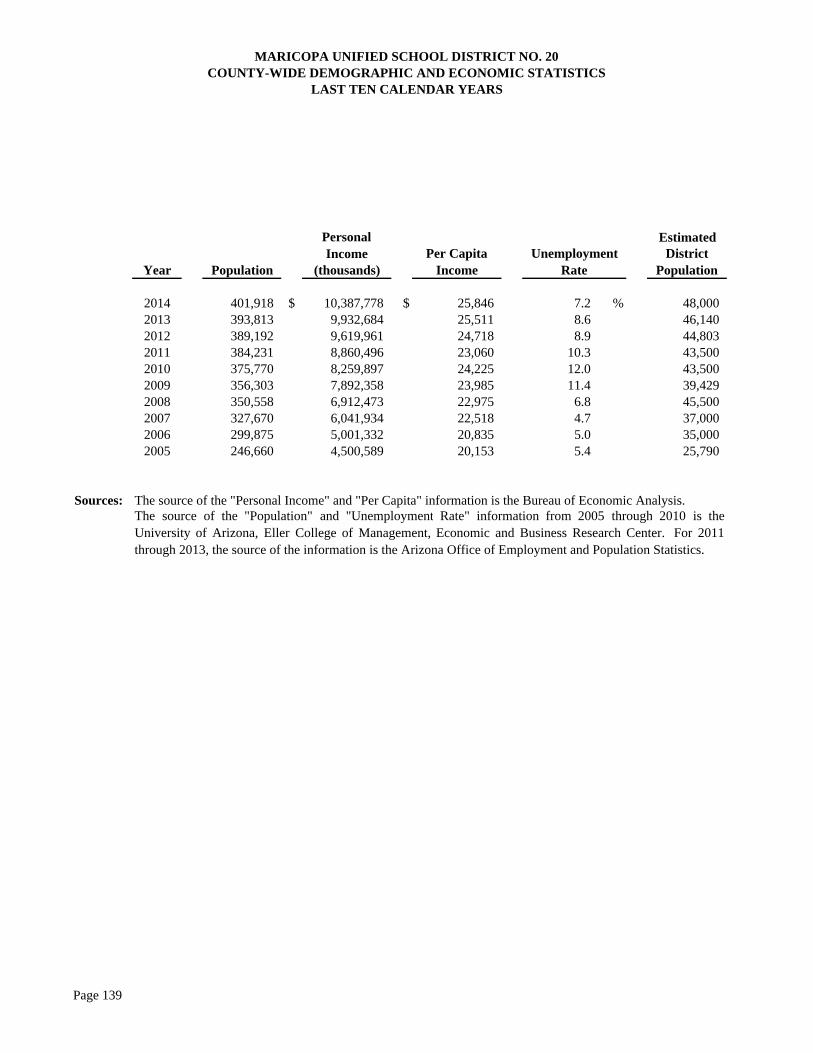
Estimated
Year Population (thousands)
2014 401,918 $ 10,387,778 $ 25,846 % 48,000 2013 393,813 9,932,684 25,511 46,140 2012 389,192 9,619,961 24,718 44,803 2011 384,231 8,860,496 23,060 43,500 2010 375,770 8,259,897 24,225 43,500 2009 356,303 7,892,358 23,985 39,429 2008 350,558 6,912,473 22,975 45,500 2007 327,670 6,041,934 22,518 37,000 2006 299,875 5,001,332 20,835 35,000 2005 246,660 4,500,589 20,153 25,790
Sources:
MARICOPA UNIFIED SCHOOL DISTRICT NO. 20COUNTY-WIDE DEMOGRAPHIC AND ECONOMIC STATISTICS
LAST TEN CALENDAR YEARS
Personal Income Per Capita
IncomeUnemployment
RateDistrict
Population
The source of the "Personal Income" and "Per Capita" information is the Bureau of Economic Analysis.The source of the "Population" and "Unemployment Rate" information from 2005 through 2010 is theUniversity of Arizona, Eller College of Management, Economic and Business Research Center. For 2011through 2013, the source of the information is the Arizona Office of Employment and Population Statistics.
7.2 8.6 8.9
10.3 12.0 11.4
6.8 4.7 5.0 5.4
Page 139
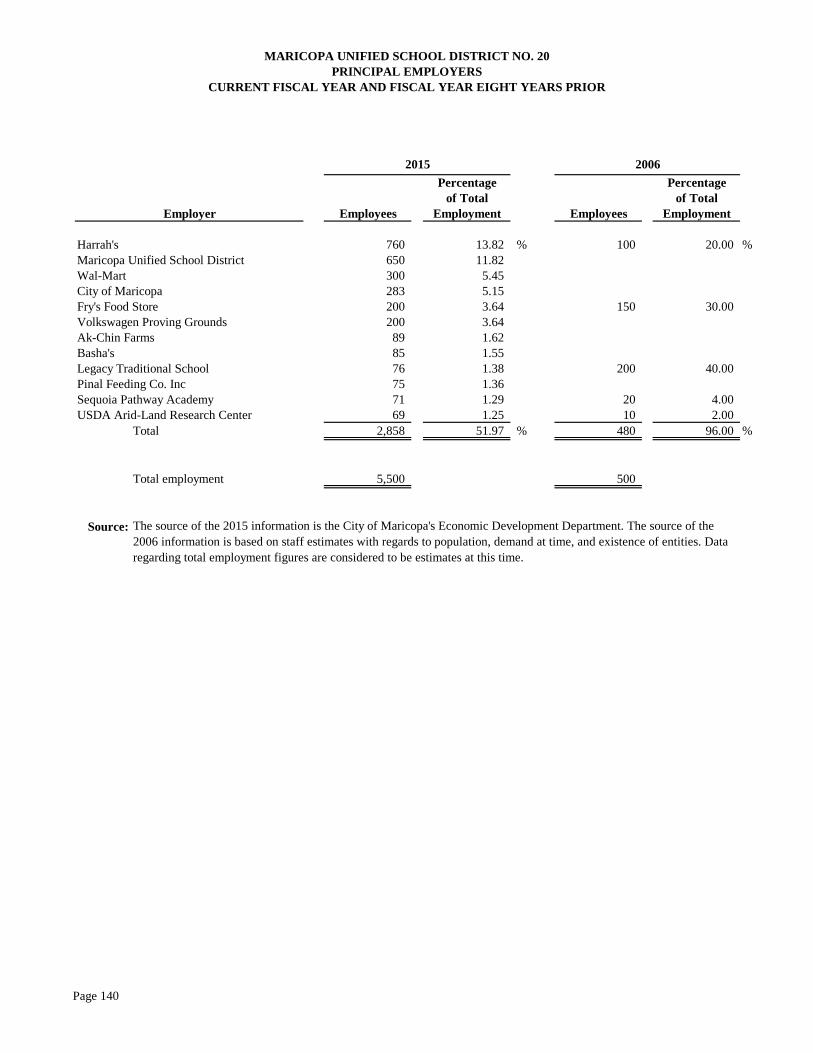
Percentage Percentageof Total of Total
Employees Employment Employees Employment
Harrah's 760 13.82 % 100 20.00 %Maricopa Unified School District 650 11.82 Wal-Mart 300 5.45 City of Maricopa 283 5.15 Fry's Food Store 200 3.64 150 30.00 Volkswagen Proving Grounds 200 3.64 Ak-Chin Farms 89 1.62 Basha's 85 1.55 Legacy Traditional School 76 1.38 200 40.00 Pinal Feeding Co. Inc 75 1.36 Sequoia Pathway Academy 71 1.29 20 4.00 USDA Arid-Land Research Center 69 1.25 10 2.00
Total 2,858 51.97 % 480 96.00 %
Total employment 5,500 500
Source:
MARICOPA UNIFIED SCHOOL DISTRICT NO. 20PRINCIPAL EMPLOYERS
CURRENT FISCAL YEAR AND FISCAL YEAR EIGHT YEARS PRIOR
Employer
2015 2006
The source of the 2015 information is the City of Maricopa's Economic Development Department. The source of the 2006 information is based on staff estimates with regards to population, demand at time, and existence of entities. Data regarding total employment figures are considered to be estimates at this time.
Page 140
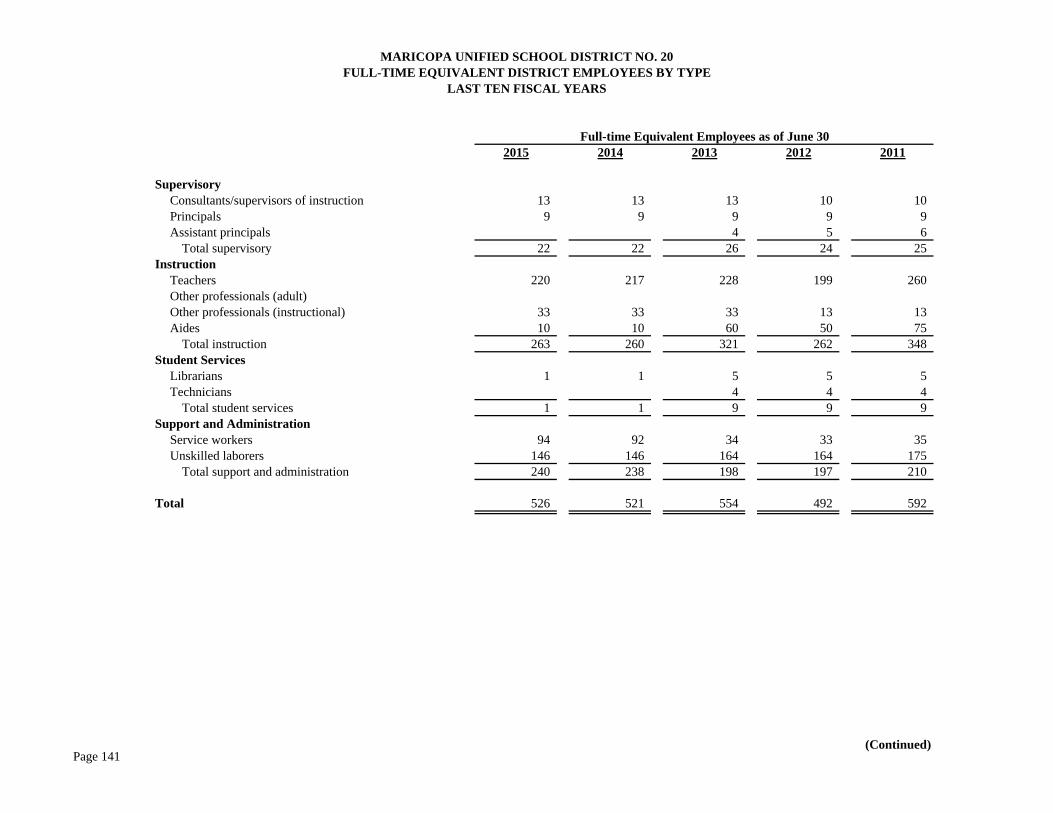
2015 2014 2013 2012 2011
SupervisoryConsultants/supervisors of instruction 13 13 13 10 10 Principals 9 9 9 9 9 Assistant principals 4 5 6
Total supervisory 22 22 26 24 25 Instruction
Teachers 220 217 228 199 260 Other professionals (adult) Other professionals (instructional) 33 33 33 13 13 Aides 10 10 60 50 75
Total instruction 263 260 321 262 348 Student Services
Librarians 1 1 5 5 5 Technicians 4 4 4
Total student services 1 1 9 9 9 Support and Administration
Service workers 94 92 34 33 35 Unskilled laborers 146 146 164 164 175
Total support and administration 240 238 198 197 210
Total 526 521 554 492 592
(Continued)
Full-time Equivalent Employees as of June 30
LAST TEN FISCAL YEARS
MARICOPA UNIFIED SCHOOL DISTRICT NO. 20FULL-TIME EQUIVALENT DISTRICT EMPLOYEES BY TYPE
Page 141
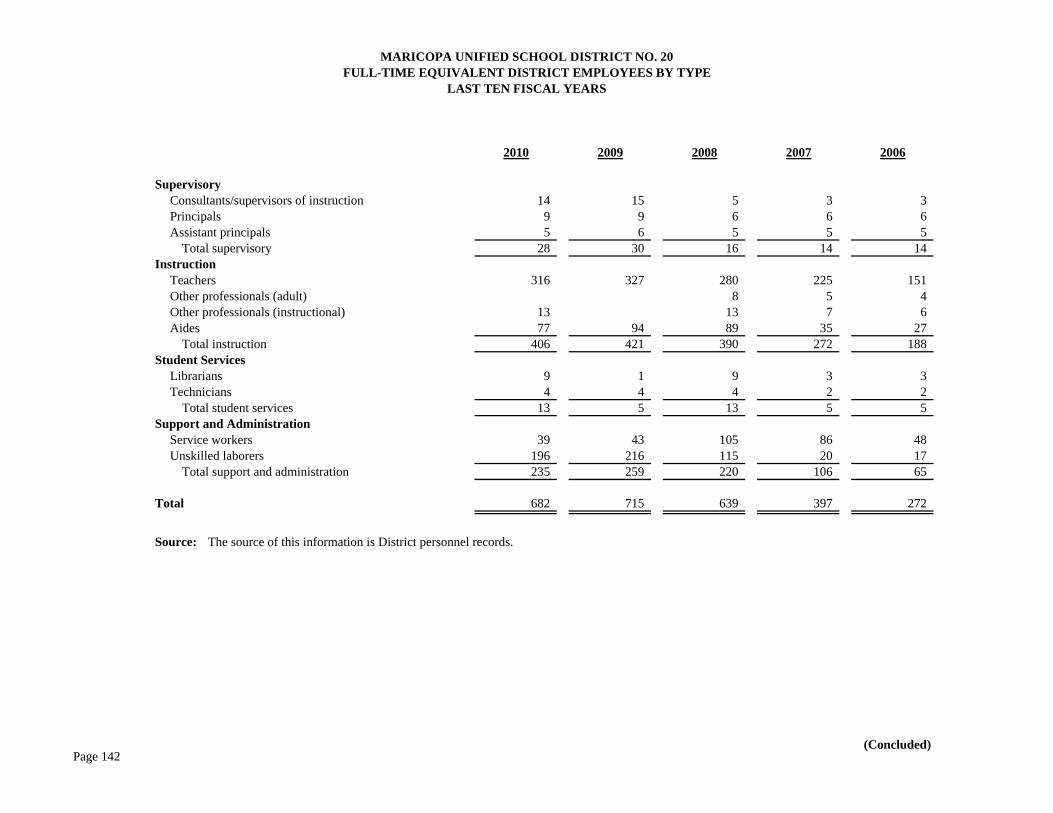
2010 2009 2008 2007 2006
SupervisoryConsultants/supervisors of instruction 14 15 5 3 3 Principals 9 9 6 6 6 Assistant principals 5 6 5 5 5
Total supervisory 28 30 16 14 14 Instruction
Teachers 316 327 280 225 151 Other professionals (adult) 8 5 4 Other professionals (instructional) 13 13 7 6 Aides 77 94 89 35 27
Total instruction 406 421 390 272 188 Student Services
Librarians 9 1 9 3 3 Technicians 4 4 4 2 2
Total student services 13 5 13 5 5 Support and Administration
Service workers 39 43 105 86 48 Unskilled laborers 196 216 115 20 17
Total support and administration 235 259 220 106 65
Total 682 715 639 397 272
Source:
(Concluded)
The source of this information is District personnel records.
MARICOPA UNIFIED SCHOOL DISTRICT NO. 20FULL-TIME EQUIVALENT DISTRICT EMPLOYEES BY TYPE
LAST TEN FISCAL YEARS
Page 142

FiscalYear Cost Cost Pupil-
Ended per Percentage per Percentage Teaching TeacherJune 30 Pupil Change Expenses Pupil Change Staff Ratio
2015 5,618 41,066,186$ 7,310$ 10.27 % 47,161,413$ 8,395$ 9.52 % 263 21.4 58.0 %2014 5,962 39,521,625 6,629 (2.40) 45,700,757 7,665 (2.60) 260 22.9 61.0 2013 5,440 36,946,872 6,792 0.25 42,811,971 7,870 (2.44) 321 16.9 58.1 2012 5,600 37,939,509 6,775 (4.65) 45,173,449 8,067 (1.22) 262 21.4 57.0 2011 5,647 40,122,442 7,105 2.98 46,116,190 8,166 (1.08) 348 16.2 53.2 2010 6,095 42,050,385 6,899 (2.47) 50,318,074 8,256 (10.89) 406 15.0 51.9 2009 5,976 42,273,776 7,074 16.08 55,363,265 9,264 16.29 421 14.2 47.9 2008 5,144 31,348,430 6,094 18.30 40,980,913 7,967 11.49 390 13.2 35.6 2007 4,144 21,348,406 5,152 (18.94) 29,610,730 7,145 6.91 272 15.2 32.1 2006 2,596 16,499,232 6,356 (3.45) 17,350,554 6,684 (8.42) 188 13.8 31.0 2005 1,713 11,275,922 6,583 #DIV/0! - #DIV/0!
Operating expenditures are total expenditures less debt service and capital outlay.
MARICOPA UNIFIED SCHOOL DISTRICT NO. 20OPERATING STATISTICSLAST TEN FISCAL YEARS
Percentage of
StudentsFree/Reduced
The source of this information is the District's financial records.Source:Notes:
Average Daily
MembershipOperating
Expenditures
Page 143
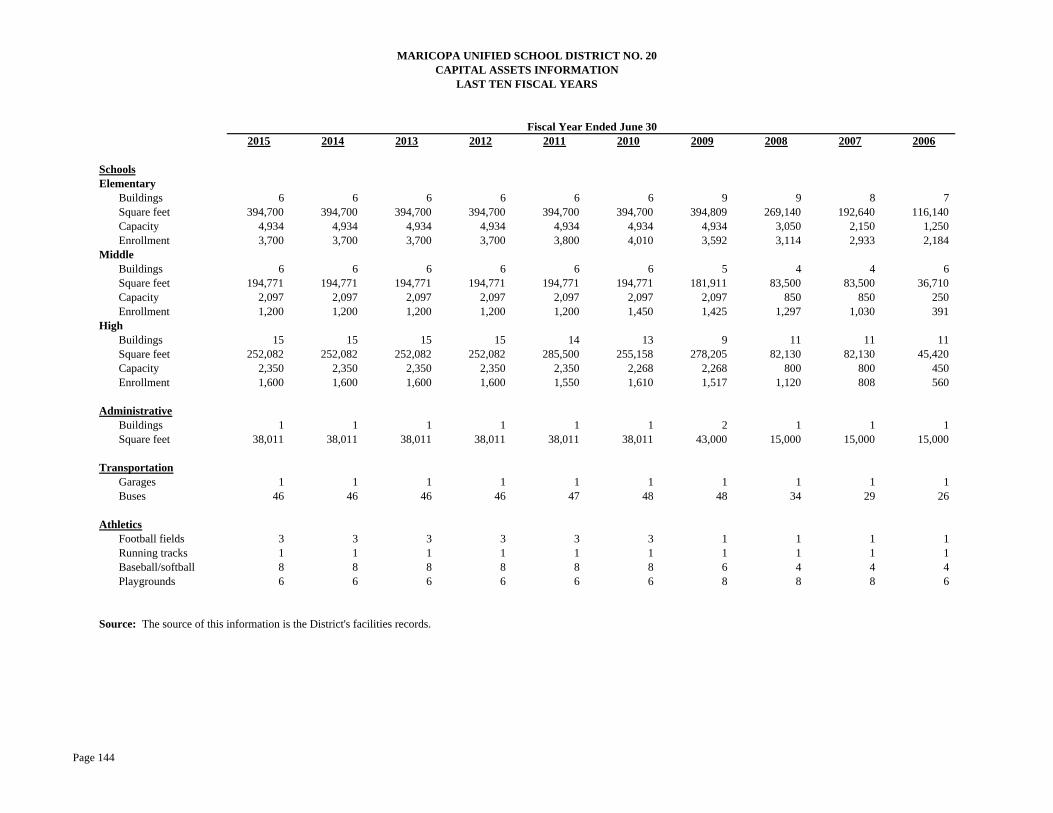
2015 2014 2013 2012 2011 2010 2009 2008 2007 2006
SchoolsElementary
Buildings 6 6 6 6 6 6 9 9 8 7 Square feet 394,700 394,700 394,700 394,700 394,700 394,700 394,809 269,140 192,640 116,140 Capacity 4,934 4,934 4,934 4,934 4,934 4,934 4,934 3,050 2,150 1,250 Enrollment 3,700 3,700 3,700 3,700 3,800 4,010 3,592 3,114 2,933 2,184
MiddleBuildings 6 6 6 6 6 6 5 4 4 6 Square feet 194,771 194,771 194,771 194,771 194,771 194,771 181,911 83,500 83,500 36,710 Capacity 2,097 2,097 2,097 2,097 2,097 2,097 2,097 850 850 250 Enrollment 1,200 1,200 1,200 1,200 1,200 1,450 1,425 1,297 1,030 391
HighBuildings 15 15 15 15 14 13 9 11 11 11 Square feet 252,082 252,082 252,082 252,082 285,500 255,158 278,205 82,130 82,130 45,420 Capacity 2,350 2,350 2,350 2,350 2,350 2,268 2,268 800 800 450 Enrollment 1,600 1,600 1,600 1,600 1,550 1,610 1,517 1,120 808 560
AdministrativeBuildings 1 1 1 1 1 1 2 1 1 1 Square feet 38,011 38,011 38,011 38,011 38,011 38,011 43,000 15,000 15,000 15,000
TransportationGarages 1 1 1 1 1 1 1 1 1 1 Buses 46 46 46 46 47 48 48 34 29 26
AthleticsFootball fields 3 3 3 3 3 3 1 1 1 1 Running tracks 1 1 1 1 1 1 1 1 1 1 Baseball/softball 8 8 8 8 8 8 6 4 4 4 Playgrounds 6 6 6 6 6 6 8 8 8 6
Source: The source of this information is the District's facilities records.
MARICOPA UNIFIED SCHOOL DISTRICT NO. 20CAPITAL ASSETS INFORMATION
LAST TEN FISCAL YEARS
Fiscal Year Ended June 30
Page 144