market situation report – september 2008 realising the ... update market situation... · market...
TRANSCRIPT

Market Situation Report – September 2008
Realising the value of recovered glass: An update

Winter 2008China: a special report
Spring 2009Paper update
To subscribe to forthcoming Market Situation Reports visit www.wrap.org.uk/marketreports
Welcome to the recycled glass Market Situation Report update, the latest in a series of reports examining current economic conditions in the markets for recovered materials.
In January 2007, we published the first glass Market Situation Report. This update considers how the market for recovered glass (cullet) in the UK has since been impacted by developments in the UK glass manufacturing sector, collection trends and prices of cullet and packaging recovery notes (PRNs). In addition, this report focuses on the influence of recent increases in energy and raw materials prices, and trends in the international trade in cullet.
Key themes have emerged from the glass recycling sector in 2007/08:
the cost of producing glass has continued to increase, driven by rising energy costs and raw materials prices;
glass recovery has increased over the past year, yet cullet consumption by UK container manufacturers remains below its peak;
industry contacts indicate that shortages of high-quality cullet have intensified; and accordingly,
prices for colour-separated cullet have increased.
1 Recycled Glass Market Situation Report update
ContentsAn overview of the market 2Collection trends 4Recent developments in the UK glass manufacturing sector 5Cullet and PRN prices 6Raw materials and energy prices 6International trade 8Challenges ahead 9Case Study: Recresco 10
Did you know?
Glass containers produced in the UK have an average recycled content of 30 per cent.
Glass recycling saved around 385,000 tonnes of CO2 emissions over the past year, equivalent to taking more than 120,000 cars off the road.
Typical prices (as at end Aug 2008):Clear cullet:£30-£35 per tonneAmber:£25-£28 per tonneGreen:£18-£24 per tonneMixed glass:£15-£20 per tonne
30%
385,000
£

Year2002 2003
500
1,000
1,500
2,000
Graph 1: Glass packaging recovery and recyclingthousand tonnes
2008 data annualised from Q1 and Q2 returns. Data for 2009-10 from Defra projections. Sources: Defra, NWPD and British Glass. Note: Alternative domestic markets include glass wool and aggregates.
2004 2005 2006 2007 2008 2009 2010
EstimatedUK container remeltOther UK useExportedAdditional growthrequired to meet 2008 target
An overview of the marketAround 1.5 million tonnes of container glass were recycled in the twelve months to June 2008, 200,000 tonnes more than a year earlier. However, although there was an increase in the amount of cullet going into remelt applications – including domestic container manufacture, glass wool and export – the majority of the increase was absorbed by the aggregates market. Moreover, the amount of cullet used by the UK container manufacturing industry remains substantially below the peak reached in 2006.
In 2007, and for the first time, less than half of the container glass recovered for recycling was used in domestic container remelt (Graph 1). Glass industry sources indicate that this reflects a shortage of high quality colour-separated cullet, which they attribute to increases in both mixed-colour and co-mingled glass collections.
The combination of increasing production and falling cullet use has led to a fall in the recycled content of UK-produced glass containers, from 36 per cent in 2005 to around 30 per cent in 2007 (Graph 2). The most significant decline has been in green furnaces, which are currently operating with a cullet content of less than 70 per cent, compared with around 85 per cent in 2005. This is significantly lower than the technical limit, which suggests that the so-called ‘green glass mountain’ may have disappeared, a stark contrast to the story of recent years.
In addition, it is estimated that around 80,000 tonnes of flat glass was used in domestic container glass furnaces in 2007. Industry contacts have indicated that they are using more flat cullet, in part owing to shortages of clear container cullet, although there are technical limitations due to differing glass chemistries.
Exports of cullet for overseas container manufacture rose by over 40,000 tonnes in the year to June 2008. Although this increase – against a background of declining UK usage – seems surprising, it reflects two key factors.
Clear
20
40
60
80
100
Graph 2: Glass packaging recycled content
per cent
Source: British Glass Note: Calculated as cullet use as a percentage of overall production
Amber Green Total
20052007
Back tocontents
2 Recycled Glass Market Situation Report update

First, the colour specifications for green and clear bottles manufactured in Europe tend to be less stringent than those for UK bottles – hence it can be more cost-effective to prepare furnace-ready cullet for European manufacturers than for those in the UK. Second, glass manufacturing companies are multinational and move material between their European facilities to balance internal demand-supply imbalances. The section on international trade in recovered glass, page 8, explores this topic in more detail.
The volume of recovered container glass destined for other remelt and alternative uses, including mineral wool and aggregates, increased by over 30 per cent over the year to June 2008 to almost 550,000 tonnes, and has more than doubled since 2005. Cullet consumption (both flat and container glass) by the mineral wool sector is believed to be around 200,000 tonnes, about one third higher than in 2005.
In early 2008, Defra announced revised packaging recovery targets for 2008 to 2010. If the targets are to be met, overall recovered glass volumes might need to reach 1.8 million tonnes by 2010.
In the first half of 2008, cullet recovery was almost 15 per cent higher than during the same period of 2007. Recovery during the remainder of the year will need to be almost 20 per cent higher than during the same period of 2007 in order for the 2008 target to be met.
The recycled content of flat glass produced in the UK is around 20-30 per cent.1 Due to its end use, flat glass has very strict quality requirements. Therefore, the main barrier to increasing the proportion of recycled glass is the availability of glass of an acceptable quality.
1 Source: WRAP, Collection of flat glass for use in flat glass manufacture (2008).
3 Recycled Glass Market Situation Report update
Back tocontents
1.5 million tonnes of container glass were
recycled in the UK in the year to June 2008.
1.5million tonnes
Cullet exports from the UK increased by 40,000 tonnes in the
year to June 2008.
40thousand
tonnes

30%Municipal glass collections rose by almost 30 per cent in 2006/07.
Collection trendsMunicipal glass collections rose by almost 30 per cent in 2006/07 to almost 1.2 million tonnes.
The increase in the municipal collection rate continues to be driven by an increase in kerbside collections. Around 55 per cent of the glass recovered from the municipal waste stream is now collected via kerbside schemes (Table 1) compared with 50 per cent a year earlier. However, the number of local authorities with kerbside glass collection schemes has remained unchanged over the past year at around 300, representing 70 per cent of the UK’s local authorities.
Collections from bring and civic amenity (CA) sites (including front-of-store recycling facilities) also grew in 2006/07, albeit at a slower pace. Collection volumes increased by over 30,000 tonnes to 480,000 tonnes, a rise of around 7 per cent.
The continued increase in the volume of glass collected at kerbside is consistent with an increase in the proportion of glass that is collected colour-mixed. In addition, the collection of glass co-mingled with other materials has become more prevalent. Around 15 per cent of local authorities operate fully co-mingled glass collections, with a similar number operating partial (two-stream) co-mingled systems (where glass is collected with plastic and aluminium containers). Local authority contacts have indicated that more materials recovery facilities (MRFs) are now prepared to accept glass, which may lead to a further increase in co-mingled collections.
4 Recycled Glass Market Situation Report update
Back tocontents
Table 1: Glass recovered from the municipal waste stream (2006/07)thousand tonnes
Region Kerbside Bring/ Other TotalCA sites
England 565 406 15 986
Wales 32 19 8 59
Scotland 39 44 14 97
Northern Ireland 4 12 1 17
Total 640 481 38 1,159(55%) (42%) (3%)
Note: ‘Other’ includes municipal collections of commercial, industrial and other non-household waste, and private/voluntary schemes. Data include an assumed glass fraction from co-mingled kerbside collections.Source: WasteDataFlow

Recent developments in the UK glass manufacturing sectorThe UK glass manufacturing industry produced around 4 million tonnes of glass in 2007, about 15 per cent more than in 2005 (Table 2).
Between 2005 and 2007, container glass production increased by around 200,000 tonnes to 2.3 million tonnes. Roughly half of the increase came from higher amber glass production (Graph 3). Industry data suggest that container output is likely to continue to grow steadily over the coming years – production is forecast to increase by 1-2 per cent per annum – although competition from other materials, such as plastic, and initiatives to lightweight glass containers, may lead to weaker growth.
Production of glass wool insulation continued to grow strongly over the same period, with output estimated to have grown by 100,000 tonnes to 400,000 tonnes. Industry contacts predict that this pace of growth will continue over the medium term despite the slowdown in the construction industry, because most of the insulation is for existing buildings rather than the new build sector. This output expansion is being supported by significant capital investment.
Production in the flat glass sector increased by 350,000 tonnes to 1.1 million tonnes between 2005 and 2007. As with glass wool insulation, growth in future demand is dependent on the construction sector. However, unlike glass wool, the majority of demand for building glass comes from the new build sector, which may be more vulnerable to the downturn in the construction sector.
The pressure on glass manufacturers’ margins appears to have eased slightly since the previous glass Market Situation Report. Input prices have continued to increase as energy and raw materials prices have risen. However, this appears to have been matched by an increase in output prices (Graph 4). This mirrors conditions elsewhere in the UK manufacturing sector as producers have passed on the increases in their input costs to their customers. The pressure on margins may also have been eased by the adjustment to recent industry consolidation. The section on raw materials and energy prices, page 6, explores recent trends in more detail.
5 Recycled Glass Market Situation Report update
Year2004
200
Graph 3: UK container glass production by colourthousand tonnes
Source: British Glass
2005 2006 2007
Green
Amber400
600
800
1000
1200
1400 Clear
Year2003 2004 2005 2006 2007 2008
100
110
120
130
Input prices
Graph 4: Glass manufacturing input and output pricesJanuary 2003=100
Output prices
Source: ONS Producer Price Indices
Back tocontents
Table 2: UK glass manufacturing industryGlass type Volume
thousand tonnesEstimated turnover
£ millions
Container glass 2,300 670
Flat glass 1,100 315
Glass wool 400 385
Other 175 310
Total 3,975 1,680
Note: Data are for 2007 or the most recent available data Sources: British Glass, ONS and WRAP estimates

Cullet and PRN pricesAfter a period of stability in 2007, prices for colour-separated cullet have increased in recent months (Graph 5). Market contacts indicate that this reflects a number of factors. First, a shortage of high-quality colour-separated cullet, which is attributed to the growth in mixed-colour and co-mingled kerbside collections. Second, rising virgin materials and energy prices, which have increased demand for cullet. The sharp increase in green cullet prices since early 2007 is consistent with the market for green cullet no longer being in excess supply. Mixed cullet prices, meanwhile, have received support from strong export and aggregate demand.
Glass PRN prices have remained stable at around £20 per tonne during 2008, broadly in line with their average over the same period of 2007.
Raw materials and energy pricesThe main raw materials required to manufacture virgin container glass are silica sand, soda ash and limestone. By looking at the total batch costs for these materials it is possible to derive a shadow price for cullet used as a substitute for these raw materials.
Soda ash comprises over half, by value, of the raw materials used to manufacture container glass. The extraction and production of soda ash is an energy-intensive process, hence soda ash prices have risen sharply in recent years, from £115 per tonne in 2005 to over £130 per tonne by mid 2008, and recently spiking to over £180 per tonne (Graph 6). Prices have also increased due to rising world demand, which stems in part from the use of soda ash in steel production.
Silica sand is the largest component, by volume, of virgin container glass. Clear containers require sand with higher silica content than that required to produce green or amber glass. High silica sand prices are around £20 per tonne, while lower silica sand prices are around £11 per tonne. Industry contacts indicate that silica sand prices have remained relatively stable in recent years.
Finally, limestone and dolomite prices have also been broadly stable in recent years, at around £15-£20 per tonne for limestone from domestic quarrying and £35-£45 per tonne for dolomite, typically supplied from overseas sources.
6 Recycled Glass Market Situation Report update
10
20
30
40
Graph 5: Glass cullet prices£ per tonne
Clear
Amber
Mixed
Green
Source: Materials Pricing Report, midpoints of range
Year2004 2005 2006 2007 2008
2005 2006
75
100
50
125
150
175
200
25
50
75
100
150
125
Graph 6: UK wholesale gas prices and soda ash prices
£ per tonnepence per
therm
Source: Spectron, International Exchange (www.theice.com) and Thomson Datastream
2007 2008
Soda ash (LHS)Gas (RHS)Gas futures price
Year
Back tocontents
As manufacture of one tonne of glass requires 1.2 tonnes of virgin materials, the batch costs per output tonne of clear and green glass stood at around £53 and £47, respectively, in mid 2008 (Table 3), about £5 per tonne more than in 2005. The most recent increase in soda ash prices adds a further £10 per tonne to the batch cost.
Glass industry contacts indicate that the price of processed, furnace-ready cullet is set relative to the virgin batch price, with a 3-5 per cent discount which reflects the contamination risk. The batch prices calculated above are consistent with furnace-ready cullet prices of around £50 per tonne for clear glass and £45 per tonne for green glass in mid 2008. The increase in batch costs between 2005 and mid 2008 was broadly in line with reported increases in furnace-ready cullet prices of £5-£10 per tonne over the same period. Industry contacts indicate that it is too soon for the recent spike in soda ash prices to be reflected in cullet prices but, if it persists, it is expected to place further upward pressure on furnace-ready cullet prices.
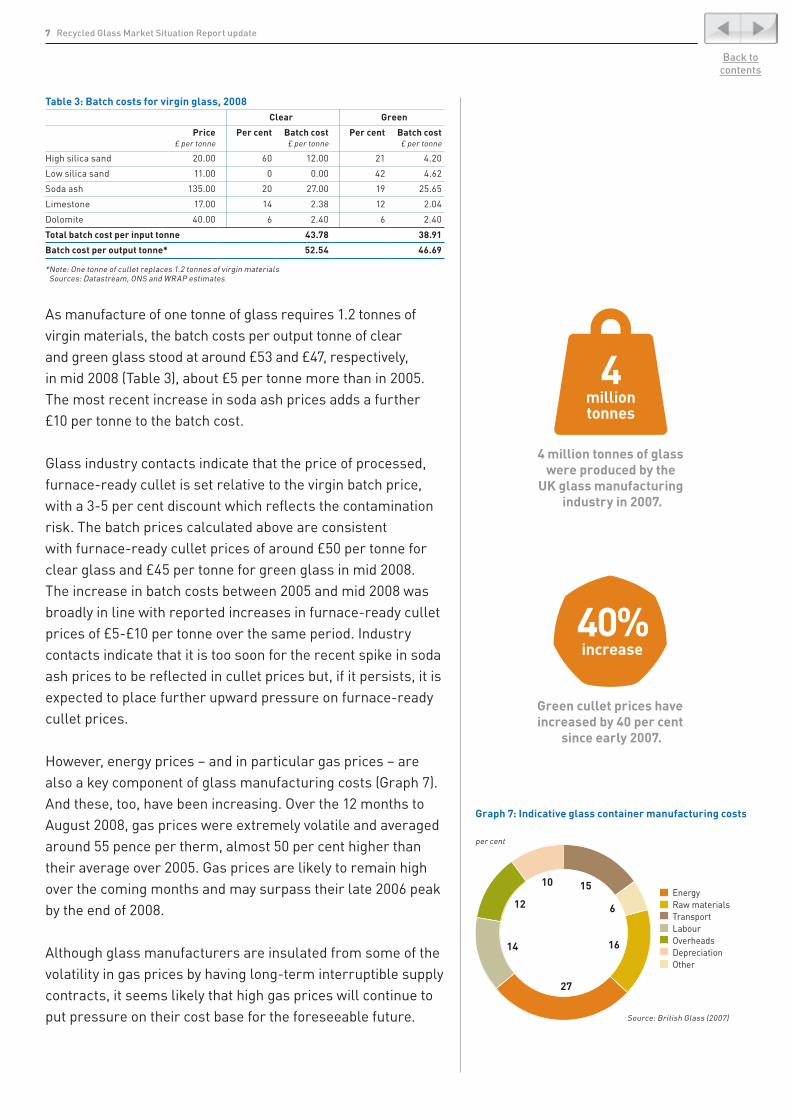
However, energy prices – and in particular gas prices – are also a key component of glass manufacturing costs (Graph 7). And these, too, have been increasing. Over the 12 months to August 2008, gas prices were extremely volatile and averaged around 55 pence per therm, almost 50 per cent higher than their average over 2005. Gas prices are likely to remain high over the coming months and may surpass their late 2006 peak by the end of 2008.
Although glass manufacturers are insulated from some of the volatility in gas prices by having long-term interruptible supply contracts, it seems likely that high gas prices will continue to put pressure on their cost base for the foreseeable future.
7 Recycled Glass Market Situation Report update
Table 3: Batch costs for virgin glass, 2008Clear Green
Price£ per tonne
Per cent Batch cost£ per tonne
Per cent Batch cost£ per tonne
High silica sand 20.00 60 12.00 21 4.20
Low silica sand 11.00 0 0.00 42 4.62
Soda ash 135.00 20 27.00 19 25.65
Limestone 17.00 14 2.38 12 2.04
Dolomite 40.00 6 2.40 6 2.40
Total batch cost per input tonne 43.78 38.91
Batch cost per output tonne* 52.54 46.69
* Note: One tonne of cullet replaces 1.2 tonnes of virgin materials Sources: Datastream, ONS and WRAP estimates
Graph 7: Indicative glass container manufacturing costs
15
16
27
14
12
10
6
EnergyRaw materialsTransportLabourOverheadsDepreciationOther
per cent
Source: British Glass (2007)
Back tocontents
4 million tonnes of glass were produced by the
UK glass manufacturing industry in 2007.
4million tonnes
Green cullet prices have increased by 40 per cent
since early 2007.
40%increase

Using cullet, rather than raw materials, to manufacture glass uses approximately 25 per cent less energy than making glass just from raw materials – equivalent to 11 therms (322 KWh) per tonne of glass.2 Given recent increases in energy prices, the value of this saving has increased by approximately £2 per tonne since 2005 to about £6 per tonne in 2008.
Looking forward, it seems likely that the value of cullet to glass manufacturers will increase further as it will be a key strategy for meeting the carbon savings required under the EU emissions trading scheme. Based on recent carbon prices of around ¤24 (£18) per tonne, the emissions reductions from using cullet rather than raw materials3 could be worth between £5 and £6 per tonne.
The clear economic incentives for container manufacturers to use cullet make the recent decline in cullet usage by the industry all the more striking, and further highlights the current bottlenecks in the cullet supply chain.
International tradeExports of cullet from the UK have increased sharply in recent years. The majority of exports from the UK are to Spain, Italy and Portugal for closed-loop recycling into wine bottles (Graph 8), with exports to Portugal in particular growing rapidly.
As previously discussed, the international trade in cullet in part reflects the multinational nature of the glass industry, with companies moving material around Europe to balance internal demand-supply imbalances. Recent industry consolidation – for example, the purchase of Rexam’s glass container business by Ardagh Glass in mid-June 2007, making Ardagh the third largest glass container business in Europe – is likely to have underpinned the increase in international cullet movements.
However, the trend towards mixed-colour collection in the UK is also contributing to the increase in exports. Much of the colour-sorting capacity in the UK is two-colour sort (where the high-value clear cullet is separated out from the rest). The residual green and amber mix tends not to meet the tight colour specifications for green (mostly beer) bottles manufactured in the UK. However, the tolerances for ‘antique green’ wine bottles are often wider, so this cullet can be used cost-effectively in European furnaces.
8 Recycled Glass Market Situation Report update
2 Source: The Carbon Trust (2004). 3 Each tonne of cullet reduces CO2 emissions for container and glass wool manufacturers by 314kg and 275kg, respectively. Source: Enviros, Glass Recycling – Life Cycle Carbon Dioxide Emissions (2003).
Exports
50
100
150
250
300
200
Graph 8: UK cullet trade, 2007thousand tonnes
Source: HM Revenue & Customs
Imports
OtherSpainPortugalDenmarkItaly
NorwayIrelandNetherlandsBelgium
Back tocontents
50%50% increase in UK gas prices from 2005 to 2008.

Temporary regional demand-supply imbalances can also affect cullet trade flows. For example, an early grape harvest in 2007 led to strong demand for green cullet in Southern Europe which was partly met by higher exports from the UK.
Imports of cullet into the UK have also grown in recent years. After remaining stable at around 50,000 tonnes per annum between 2002 and 2005, imports in 2006 and 2007 were sharply higher at 80,000-90,000 tonnes. Some of the imports are clear cullet to redress the UK’s colour imbalance; unlike many other countries in Europe, the UK produces more clear glass than it consumes, resulting in a deficit rather than excess of clear cullet. The remainder is from countries with insufficient domestic processing and manufacturing capacity. Industry contacts have indicated that the recent increase in imports reflects intensifying shortages of domestic cullet.
Over the past two years, Ireland has overtaken the Netherlands as the source of the majority of the UK’s cullet imports (the latter likely includes trans-shipments from other countries). The growth in imports from Ireland reflects a sharp increase in Irish collections combined with a lack of remelt capacity. As Ireland does not have any container glass furnaces, cullet has to be exported or used in alternative markets. Although Glassco Recycling has opened a 50,000 tonne capacity reprocessing plant in Ireland, it is intended that this glass will continue to be imported into the UK, most likely to Quinn’s Northern Ireland plant.
Europe-wide demand for cullet is strong at the moment, in part reflecting the price factors discussed in the previous section. To meet this demand, cullet is increasingly being sourced from eastern Europe, although there are limits to the trade owing to the higher lead content in eastern European glass.
Trade in recovered glass is also affected by the exchange rate between the pound and the Euro. The depreciation in sterling has increased the competitiveness of UK cullet exports, but has made imported cullet more expensive.
The UK’s surplus of green and mixed cullet is forecast to rise to over 400,000 tonnes by 2010.4 The opportunity for green and mixed cullet export from the UK – assuming suitable markets – is expected to remain significant. Meanwhile, imports of cullet, particularly clear cullet, are likely to remain more stable in coming years, with the clear cullet deficit expected to remain near 400,000 tonnes.
9 Recycled Glass Market Situation Report update
4 Source: GTS, Assessment of the International Trading Markets for Recycled Glass (2007).
Challenges ahead Despite an increase in glass recovery, cullet consumption by UK container glass manufacturers fell in 2007.
Recent increases in energy and raw materials prices have increased the economic incentives to use cullet. However, glass industry sources state that the decline reflects a shortage in high-quality cullet, for which they blame the trend towards mixed-colour and co-mingled collections.
The environmental benefits of using cullet in remelt applications underline the importance of resolving the bottlenecks in the cullet supply chain. At present, the solution to this problem and its potential financing is unclear. To help guide the debate, WRAP has developed a best-practice guide on glass collections methods and processing routes and is examining whether it is technically, economically and environmentally feasible for MRFs to produce glass suitable for remelt applications.
Back tocontents

10 Recycled Glass Market Situation Report update
Case study: Recresco Recresco is an innovative glass recycling company with major processing plants at Nottingham, Southampton and the Wirral, and a new plant due to open at Avonmouth later this year.
By meeting the growing demand for high-quality cullet from mixed-colour glass sources, the company has seen its annual throughput increasing from 15,000 tonnes in 2003 to a predicted 260,000 tonnes for 2008. More than 90 per cent of the mixed-colour glass processed by Recresco is subsequently used in the production of new glass bottles and containers, with the remainder destined for applications such as grit blasting or filtration.
In fact, the rise in mixed-colour glass has led to Recresco securing financial backing for new state-of-the-art equipment, including two glass separators and a tri-colour processing plant that can handle up to 30 tonnes of mixed-colour glass per hour.
According to Recresco’s Business Development Manager John Ferguson: “The trend towards kerbside collections means we are being asked to process increasing quantities of mixed-colour glass. By investing in the latest technologies we are ensuring that we maintain capacity, and that our processed cullet, whether clear, amber or green, is ready for high-quality end markets.”
Back tocontents

Back tocontents
Waste & Resources Action Programme
The Old Academy 21 Horse Fair Banbury, Oxon OX16 0AH
Tel: 01295 819 900 Fax: 01295 819 911 E-mail: [email protected]
Helpline freephone 0808 100 2040
www.wrap.org.uk
WRAP works in partnership to encourage and enable businesses and consumers to be more efficient in their use of materials and recycle more things more often. This helps to minimise landfill, reduce carbon emissions and improve our environment.
You can learn more about WRAP at:www.wrap.org.uk
Or to learn more about recycling, visit:www.recyclenow.com