master in space applications for early warning and...
TRANSCRIPT

1
Master in Space Applications for Early Warning and Response to Emergencies
Final Report
Gustavo Leonhard
Instituto de Altos Estudios Espaciales “Mario Gulich”
Istituto Zooprofilattico Sperimentale delle Venezie
Director
Nicola Ferrè

2
SUMMARY
The objective of this report is inform about the activities developed during the period January - March
in the IZSVe under the supervision of Dr. Nicola Ferrè. Key words: worldview 2, GIS, Mosquitoes, Cosmo-SkyMed.
3
CONTENTS 1. Summery
2. Introduction
3. Objectives
4. Study Area
5. Experimental Data Set description
5.1 Satellite Images
5.2 Auxiliary Information Sources
6. Data Processing
6.1 Classification analysis
6.2 Corrections Radiometric
6.3 Multi-band fusion - "Pan-Sharpening"
6.4 Indexes
6.5 Classification data
6.6 Vector topology creations
6.7 Object-based classification
6.8 Synthetic Aperture Radar
7. Conclusions
8. Bibliography
9. Imagines
10. Annexes
9.1 Abstract for the veterinary congress

4
CHAPTER
ONE
INTRODUCTION
The use of remote sensing has had a high positive impact in the field of epidemiology over the
past decades, allowing the acquisition of information of large areas, which complemented with field data, allows the construction of models that attempt to predict the risk of human diseases. The emergence of new technologies create a range of opportunities for the development of health surveillance tools.
The Worldview-2 (WV2) is a commercial very high resolution satellite with many applications (Agriculture, Cadastre and Land Records, Coastal Management Environmental, Monitoring Forestry, Geospatial Global Warming, Hurricane Mitigation, Land Cover and Change Detection, Wildlife and Marine Conservation) but has not fully applied yet to epidemiology studies.
The West Nile Virus (WNV) is a flavivirus commonly found in Africa, West Asia and the Middle East, but in recent years has emerged in temperate regions of Europe and North America and has become a threat for public and animal health. The WNV is a viral infection transmitted by the bite of infected mosquitoes, which affects mainly birds. Man and horses are only an accidental host of the virus and are not involved in the basic cycle of the agent. The most serious manifestation of WNV infection is fatal encephalitis (inflammation of the brain) in humans and horses, as well as mortality from certain domestic and wild birds.
Is in this context, that we intents to presents a method of site-selection for the positioning of mosquitoes traps for the identify areas with high present of vectors, based on a site selection method and remote sensing data.
Objectives of the stay.
Following as a theoretical framework the report: Fornitura di immagini georeferenziate acquisite da piattaforma satellitare e drone-UAV su un’area test della provincia di Vicenza per la caratterizzazione dei siti idonei all’installazione di trappole per zanzare, made by IZSVe working group, I'm going to perform the following activities:
Presents a method of site-selection for the positioning of mosquitoes traps for the identify areas whit high present of vectors, based on a site selection method and remote sensing data. The site-selection method used is based on a combination of the Simple Additive Weighting method (SAW). The main field information are derived from an analysis of World View 2 image.
Improve knowledge of worldview2 images (high-resolution) applied to epidemiology.

5
Compare the region of interest identified by the expert entomologist with the places of greatest importance from the point of view of vector niche that arise from the application of indices such as NDVI and NDWI.
Perform an extrapolation by a confusion matrix comparing Landsat and worldview2 images to observe the associated error and the level of correlation between the two types of images, which have different levels of resolution. This will allow us obtain certain confidence interval to work with the Landsat images (free) and not with worldview2 (expensive).
Participate in the confection of a scientific paper of the work described above.
Conduct an abstract for the presentation of the work in the veterinary congress in 21-22 August 2013 GeoVet 2013 in London (UK)

6
CHAPTER
TWO
MATERIALS AND METHODS
The area identified for the study is located in the municipality of Villaverla at the Vicenza province in northeastern Italy (Fig. 1). The area extends for 25 kilometers square The land does not present elevations and is characterized mainly by agricultural areas and urban centers where there are also, small areas of high natural value.
Figure 1: Study area. Vicenza province.
Experimental Data Set description. 5.1 Satellite Images The recording image of the WorldView-2 satellite was acquired on January 8, 2012 at 10:29 completely cloud free. The extent of the area is 25 square kilometers. This satellite has a sun-synchronous orbit at
7
an altitude of 770 km. and is able to collect nearly 1 million square kilometers per day, with an average time of revisits of 1.1 days. The radiometric resolution with which the recorded signal is discretized by the sensors is 11 bits. WV2 is able to acquire a 0.5 m. Panchromatic satellite image data, and, along with the four typical bands (Blue, Green, Red and Near Infrared), four additional bands multi-spectral: the "Coastal" band (400 - 450 nm), which is useful for the study of coastal areas, thanks to its penetration into the water, and used to improve the results in the process of atmospheric correction; the "Yellow" band (585-625 nm), very important for make better the natural colors of the images and to optimize the processes of classification; the "Red Edge" band (705-745 nm), fundamental for the in-depth analysis of the health of the vegetation and the "Near Infrared 2" band (860 - 1040 nm), a second band in the "near-infrared", less influenced by weather and extremely useful to support the analysis of vegetation and biomass. This satellite provides 1.84 m. resolution at multi-spectral band, and therefore, enables fine details information and discrimination (Digitalglobe, 2010). The RGB compositions can be made more effective in the "false true colors" with the following composition: · R: band of "Yellow" · G: band of "Green" · B: bandwidth of the "Coastal".
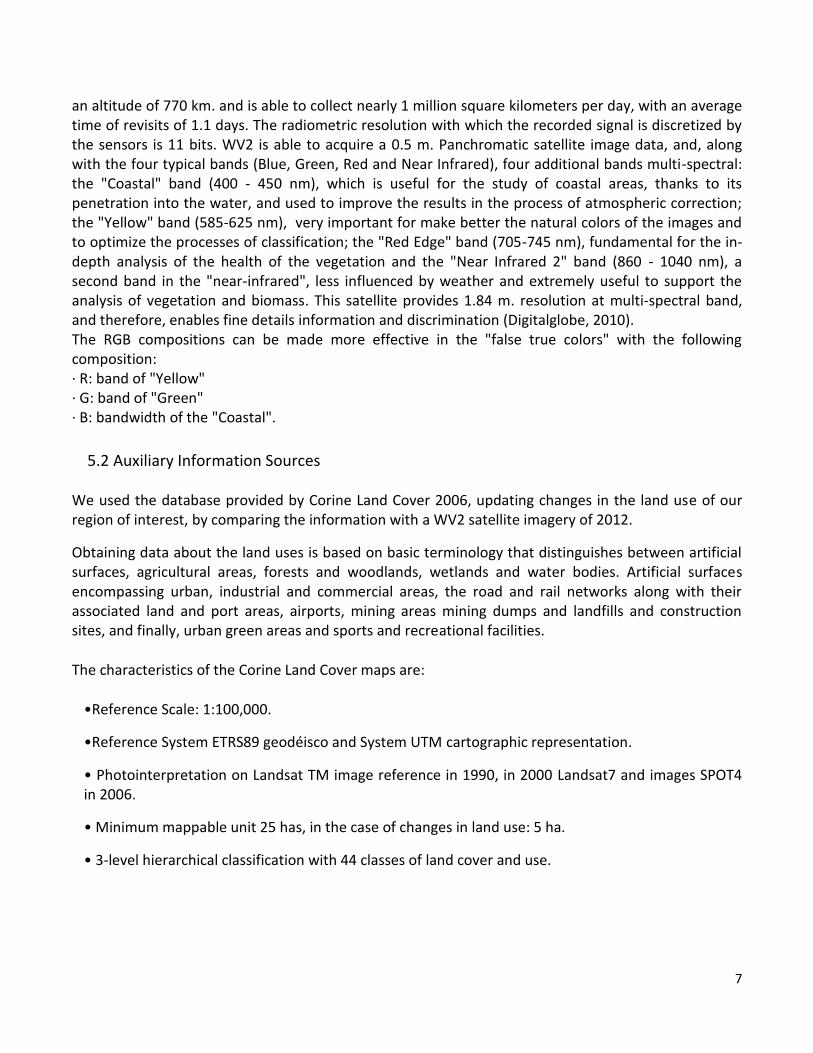
5.2 Auxiliary Information Sources We used the database provided by Corine Land Cover 2006, updating changes in the land use of our region of interest, by comparing the information with a WV2 satellite imagery of 2012.
Obtaining data about the land uses is based on basic terminology that distinguishes between artificial surfaces, agricultural areas, forests and woodlands, wetlands and water bodies. Artificial surfaces encompassing urban, industrial and commercial areas, the road and rail networks along with their associated land and port areas, airports, mining areas mining dumps and landfills and construction sites, and finally, urban green areas and sports and recreational facilities.
The characteristics of the Corine Land Cover maps are:
•Reference Scale: 1:100,000.
•Reference System ETRS89 geodéisco and System UTM cartographic representation.
• Photointerpretation on Landsat TM image reference in 1990, in 2000 Landsat7 and images SPOT4 in 2006.
• Minimum mappable unit 25 has, in the case of changes in land use: 5 ha.
• 3-level hierarchical classification with 44 classes of land cover and use.

8
6. Data Processing 6.1 Classification analysis
The image were corrected geometrically and then orthorectified with the aid of GCP (Ground Control
Point) collected from tablets CTR raster to 10000 and a DTM (Veneto Region 5 m) in reference system
Gauss Boaga West zone, Datum Roma 40. the final mean squared error (MSE) is 0.91.
6.2 Corrections Radiometric
Before proceeding to the classification of the image and the extraction of information, we make a
radiometric correction. In this process the digital value of the single pixel (recorded by the transducer
to the edge of the sensor) is converted to a physical quantity which expresses the amount of energy
transmitted by an object.
This physical quantity is expressed in watts per square meter steradians.
The function to be applied is as follows:
Where SFi is the absolute scale factor, DN is the pixel value Current and Δλ i is the width of the band.
6.3 Multi-band fusion - "Pan-Sharpening"
The operation of pan-sharpening is a technique of "spatial enhancement" that combines the high spectral resolution available from images acquired by satellite WorldView2 with the high content geometric information contained in the accuracy of the data panchromatic (Fig. 2).
a) b)
9
Figure 2: The Wv2 Image multiband 1.84 meters of resolution. b) Same image with pan-sharpening applied.
The result of this operation is a new image that has multiband spectral resolution equal to 8 (the same bands acquired by the sensor multispectral of WV2) and spatial resolution of 50 cm per pixel (the geometric accuracy of the panchromatic sensor). The technique used is the algorithm called "Hyperspherical Color Sharpening (HCS)" considered one of the top performing using the images acquired by satellite WorldView2. (Padwick et al. 2010).
6.4 Indexes
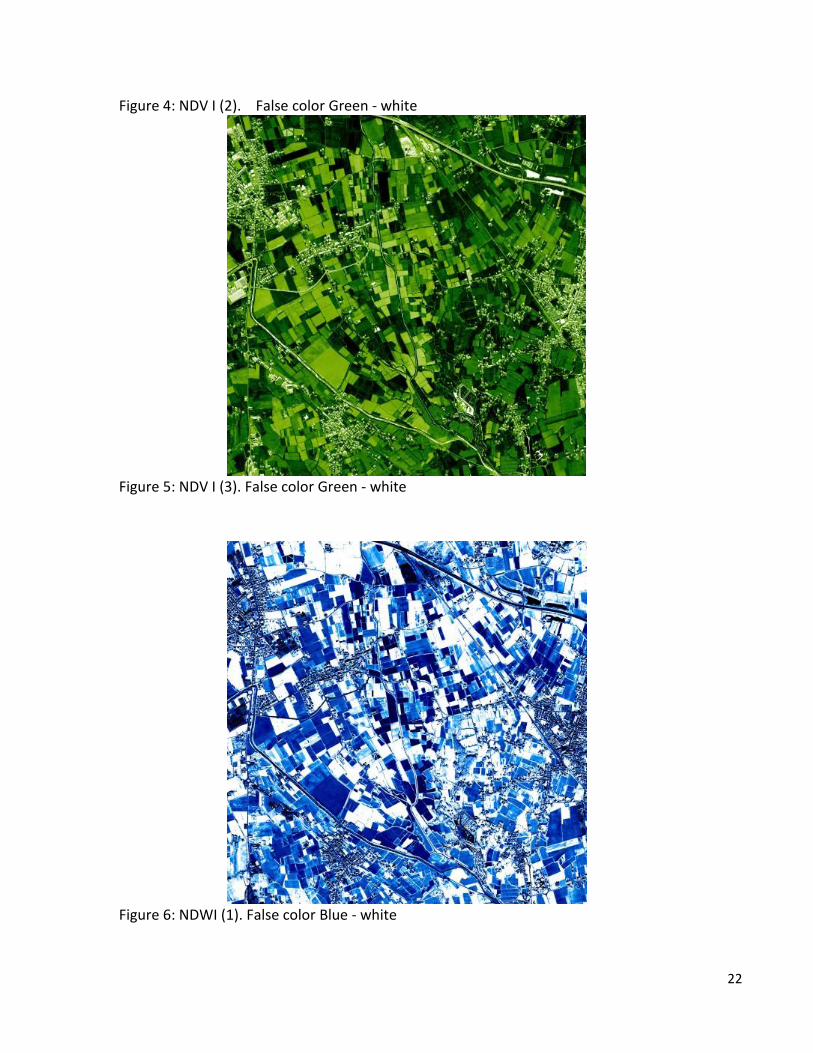
Two indices, potentially indicative of the mosquito habitat existence, may be derived from the satellite images: the normalized difference vegetation index (NDVI) and the normalized difference water index (NDWI). A vegetation index can be defined as a calculated parameter from the values of reflectance at different wavelengths, and particularly sensitive to vegetation cover (Gilabert et al, 1997). The NDVI is an estimation of green vegetation biomass because it is a combination of reflectance measurements that are sensitive to the associate effects of foliage chlorophyll concentration, canopy leaf area, foliage clumping, and canopy architecture. This index compares reflectance measurements from the reflectance peak of vegetation in the near-infrared range with measurements in the red range (Sims et al. 2002). The NDVI has been widely used for remote sensing of vegetation and has been applied to mosquito studies for many years (Hay et al. 1998), as well as in many other applications including health and studies on vector-borne diseases (Linthicum et al. 1987, Pope et al. 1992). NDVI is mainly dependent on the green leaf material of the vegetation cover (Gitelson et al. 1996).
The NDVI indexes adapted to WV2 sensor were defined by the following equations:
NDV I (1)= (NIR 1 - RED)/ (NIR 1 + RED) (Fig.3) NDV I (2)= (RED - NIR 2)/ (RED + NIR 2) (Fig.4) NDV I (3)= (RED_EDGE – NIR2)/ (RED_EDGE + NIR2) (Fig.5)
the band to NIR 1 wavelength is center at 833 nm, the band to NIR 2 wavelength is center at 949 nm, the band to Red Edge wavelength is center at 724 nm and the band corresponding to RED wavelength is center at 659 nm. The NDWI is an indicator of the liquid water molecules (vegetation water content) in vegetation canopies that interact with the incoming solar radiation and also the level of saturation of the ground. (Gao 1996). NDWI increases as the leaf layer increases, indicating that it is sensitive to the total amount of liquid water stacked in the leaves. This index is less susceptible to atmospheric scattering effects than the NDVI (Gao 1996). The vegetation water content is also used to retrieve the soil moisture from microwave remote sensing observations (Jackson et al. 1993). The NDWI indexes adapted to WV2 sensor were defined by the following equations:
NDWI (1)= (GREEN - NIR2)/(GREEN + NIR2) (Fig.6) NDWI (2)= (COASTAL - NIR2)/(COASTAL + NIR2) (Fig.7)

10
The band corresponding to Green wavelength is center at 546nm, the band corresponding to Coastal wavelength is center at 427nm. and the band corresponding to NIR2 wavelength is center at 949 nm. Other indexes was calculated in order of characterized the area: The normalized difference bare soil index (NDBSI):
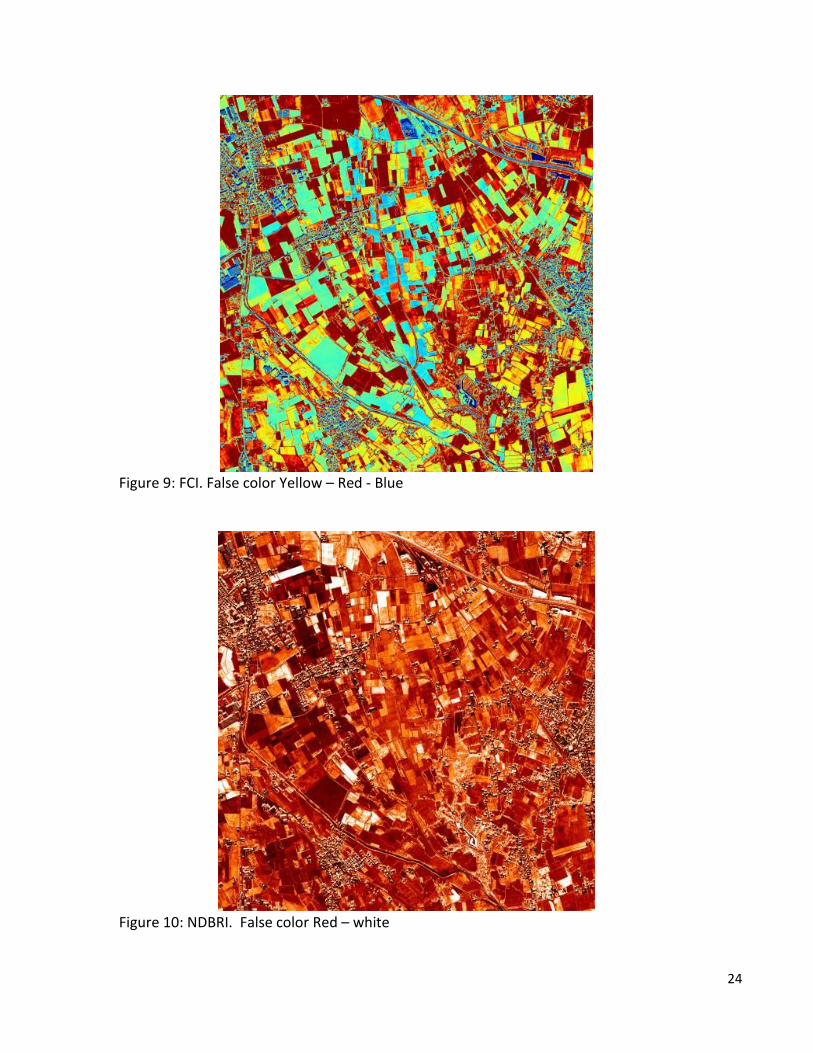
NDBSI = (blue - coastal) / (blue + coastal) (Fig.8) The Forest and Crop index (FCI):
FCI = (NIR1 - Red Edge) / (NIR1 + Red Edge) (Fig.9) The brick roof normalized difference index (NDBRI):
NDBRI = (yellow - green) / (yellow + green) (Fig.10)
6.5 Classification data
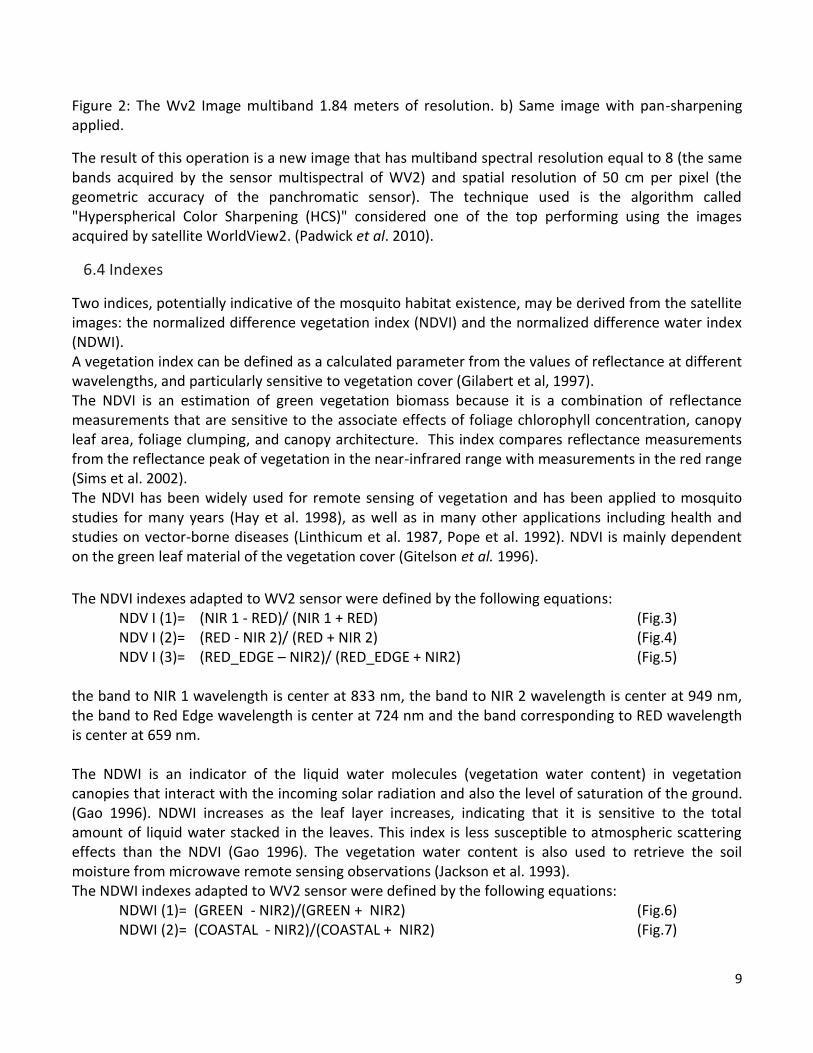
A unsupervised classification ISODATA (Iterative Self-Organizing Data Analysis Technique) was made from the pan sharpening image creating a map with 20 classes and 20 iterations. (Fig.11). Also perform a Principal component analysis (mathematical procedure that uses an orthogonal transformation to convert a set of observations of possibly correlated variables into a set of values of linearly uncorrelated variables. The objective of the PCA is to build one or more images to increase their ability to differentiate soil coverages. To make a colored composition we use the main components 1, 2 and 3 respectively in the sequence RGB (Chuvieco, 1996) ( Fig. 12)
Figure 11: Unsupervised classification ISODATA with 20 classes and 20 iterations
11
Figure 12: Principal component maps (RGB - 123).
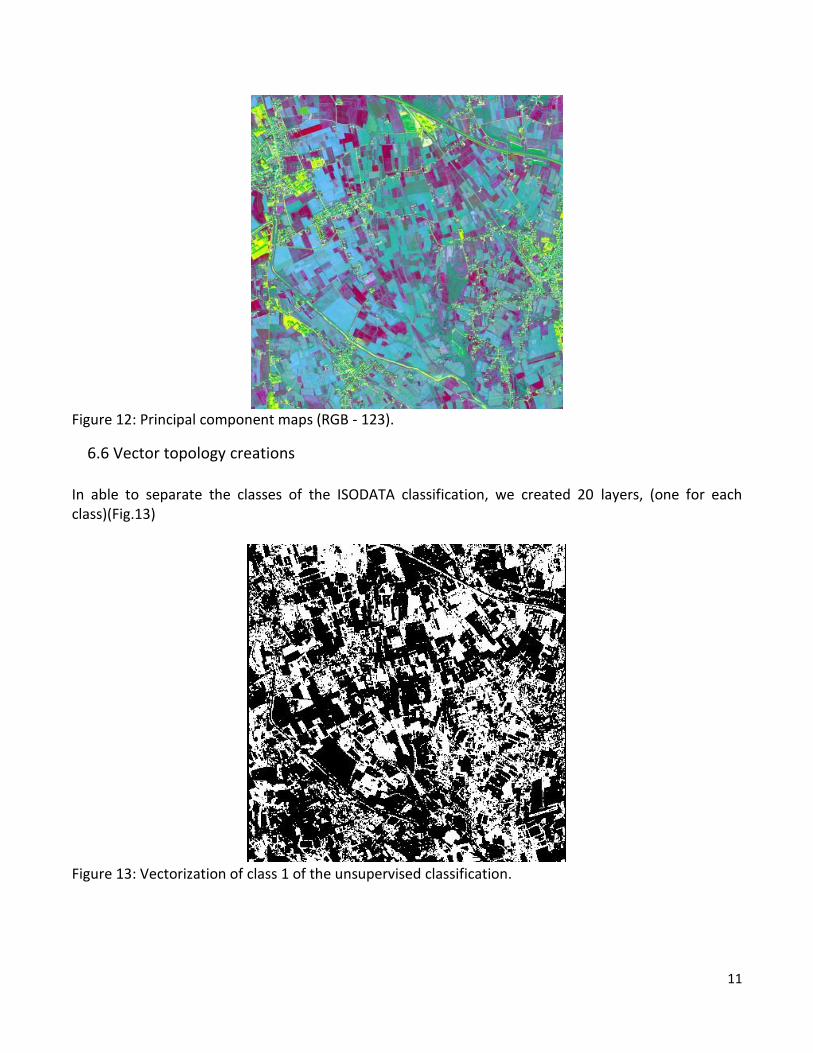
6.6 Vector topology creations In able to separate the classes of the ISODATA classification, we created 20 layers, (one for each class)(Fig.13)
Figure 13: Vectorization of class 1 of the unsupervised classification.

12
6.7 Object-based classification The traditional classification techniques, basically pixel-based approaches, are limited and typically are unable to extract objects of interest. These techniques have considerable difficulties in dealing with the rich information content of high-resolution images (Perea et al., 2009). The prerequisite of object based analysis is image segmentation. The quality of segmentation results directly affects the accuracy of the subsequent image classification. Studies showed that multilevel (hierarchical) image segmentation results more appropriate for real applications (Bruzzones et al., 2006; Carleer et al., 2005; Carleer and Wolff, 2006). A image segmentation was made using eCognition software, which allows homogeneous image object extraction.
Figure 14: Image segmentation.
13
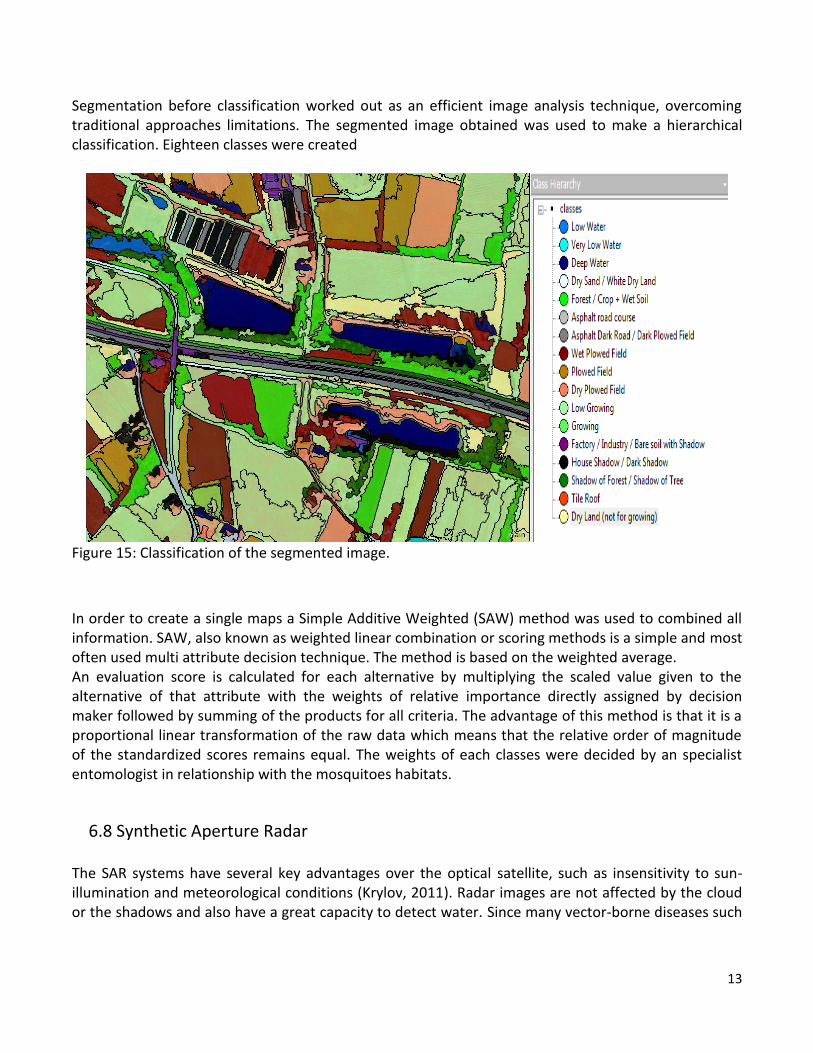
Segmentation before classification worked out as an efficient image analysis technique, overcoming traditional approaches limitations. The segmented image obtained was used to make a hierarchical classification. Eighteen classes were created
Figure 15: Classification of the segmented image.
In order to create a single maps a Simple Additive Weighted (SAW) method was used to combined all information. SAW, also known as weighted linear combination or scoring methods is a simple and most often used multi attribute decision technique. The method is based on the weighted average. An evaluation score is calculated for each alternative by multiplying the scaled value given to the alternative of that attribute with the weights of relative importance directly assigned by decision maker followed by summing of the products for all criteria. The advantage of this method is that it is a proportional linear transformation of the raw data which means that the relative order of magnitude of the standardized scores remains equal. The weights of each classes were decided by an specialist entomologist in relationship with the mosquitoes habitats.
6.8 Synthetic Aperture Radar
The SAR systems have several key advantages over the optical satellite, such as insensitivity to sun-illumination and meteorological conditions (Krylov, 2011). Radar images are not affected by the cloud or the shadows and also have a great capacity to detect water. Since many vector-borne diseases such
14
as WNV, are prevalent in tropical and subtropical areas, the use of Radar remote sensing becomes an important tool because it allows the observation of the ground surface. (Kaya et al., 2002).
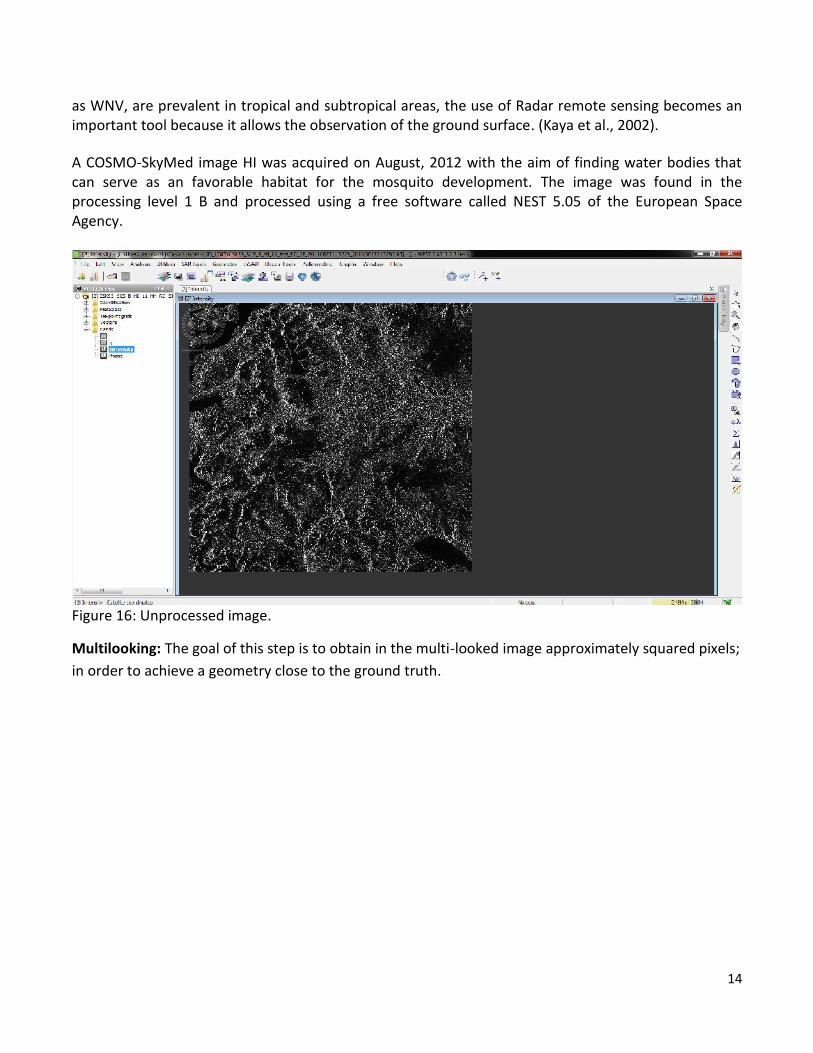
A COSMO-SkyMed image HI was acquired on August, 2012 with the aim of finding water bodies that can serve as an favorable habitat for the mosquito development. The image was found in the processing level 1 B and processed using a free software called NEST 5.05 of the European Space Agency.
Figure 16: Unprocessed image.
Multilooking: The goal of this step is to obtain in the multi-looked image approximately squared pixels;
in order to achieve a geometry close to the ground truth.
15
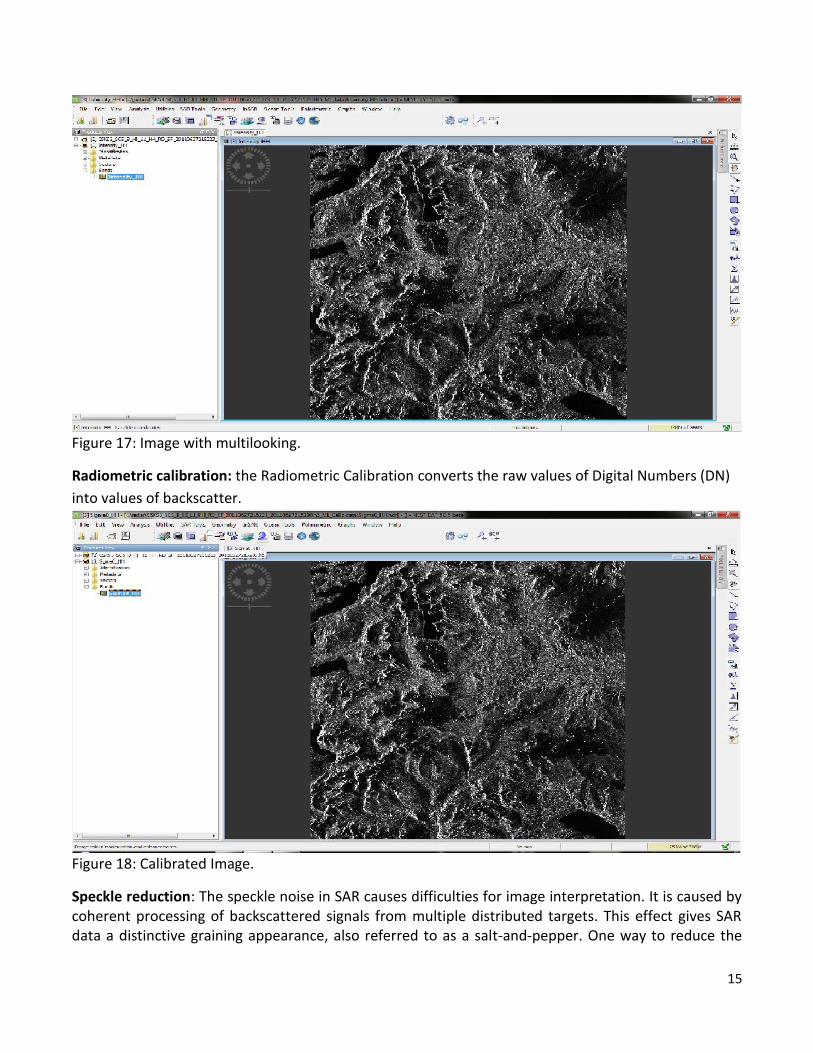
Figure 17: Image with multilooking.
Radiometric calibration: the Radiometric Calibration converts the raw values of Digital Numbers (DN)
into values of backscatter.
Figure 18: Calibrated Image.
Speckle reduction: The speckle noise in SAR causes difficulties for image interpretation. It is caused by coherent processing of backscattered signals from multiple distributed targets. This effect gives SAR data a distinctive graining appearance, also referred to as a salt-and-pepper. One way to reduce the
16
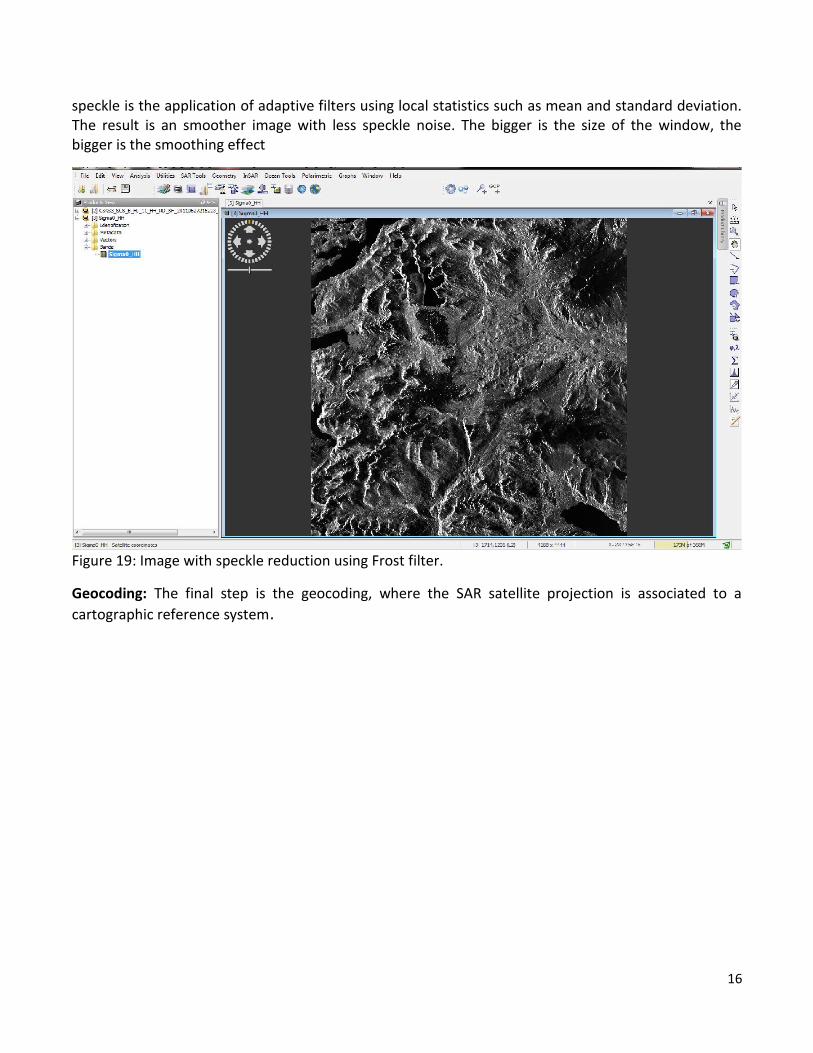
speckle is the application of adaptive filters using local statistics such as mean and standard deviation. The result is an smoother image with less speckle noise. The bigger is the size of the window, the bigger is the smoothing effect
Figure 19: Image with speckle reduction using Frost filter.
Geocoding: The final step is the geocoding, where the SAR satellite projection is associated to a
cartographic reference system.
17
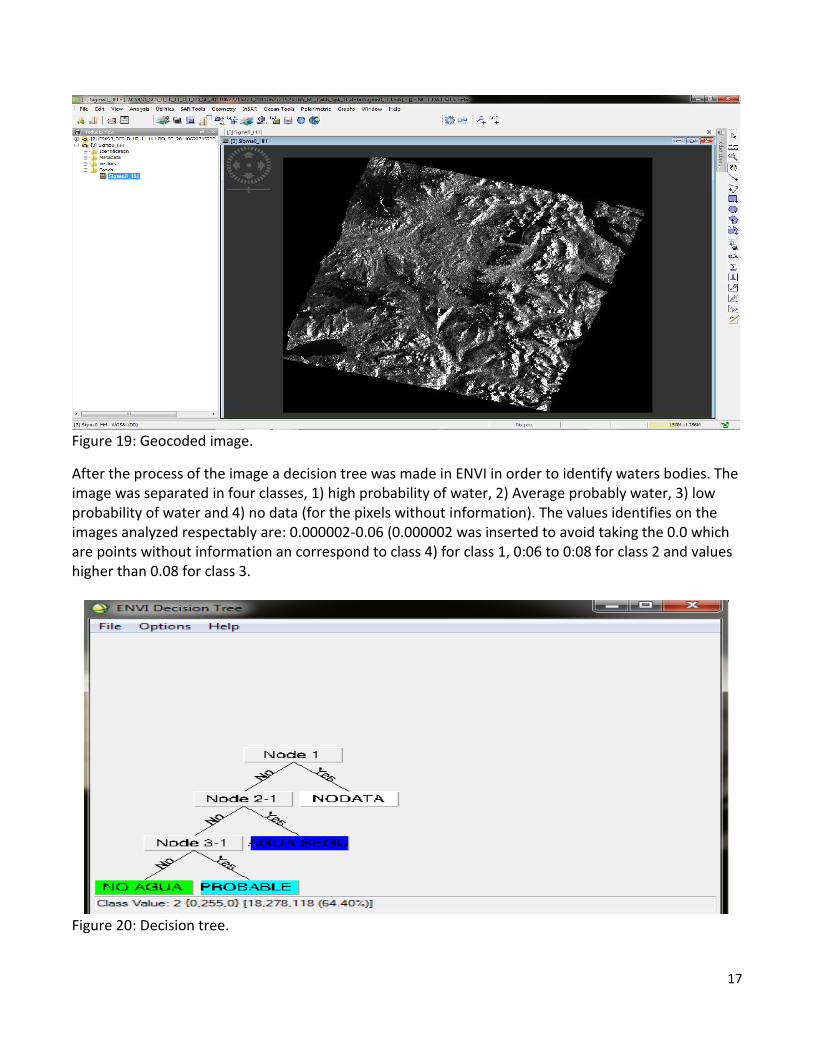
Figure 19: Geocoded image.
After the process of the image a decision tree was made in ENVI in order to identify waters bodies. The image was separated in four classes, 1) high probability of water, 2) Average probably water, 3) low probability of water and 4) no data (for the pixels without information). The values identifies on the images analyzed respectably are: 0.000002-0.06 (0.000002 was inserted to avoid taking the 0.0 which are points without information an correspond to class 4) for class 1, 0:06 to 0:08 for class 2 and values higher than 0.08 for class 3.
Figure 20: Decision tree.
18
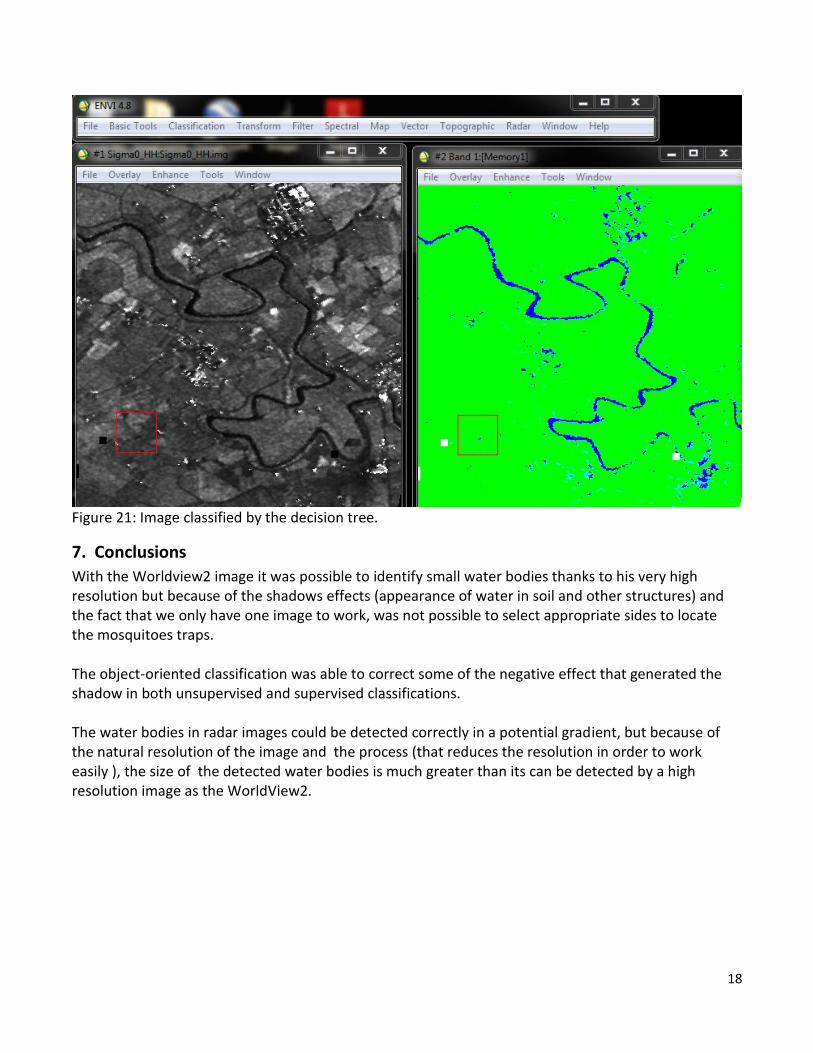
Figure 21: Image classified by the decision tree.
7. Conclusions
With the Worldview2 image it was possible to identify small water bodies thanks to his very high resolution but because of the shadows effects (appearance of water in soil and other structures) and the fact that we only have one image to work, was not possible to select appropriate sides to locate the mosquitoes traps. The object-oriented classification was able to correct some of the negative effect that generated the shadow in both unsupervised and supervised classifications. The water bodies in radar images could be detected correctly in a potential gradient, but because of the natural resolution of the image and the process (that reduces the resolution in order to work easily ), the size of the detected water bodies is much greater than its can be detected by a high resolution image as the WorldView2.

19
Bibliography.
Bruzzone L., Carlin L., 2006. “A multilevel contextbased system for classification of very high
spatial resolution images,” IEEE Trans. Geosc. and Remote Sens., vol. 44, no. 9, pp. 2587–2600, Sept.
Carleer A.P., O. Debeir, E. Wolff, 2005. Assessment of very high spatial resolution satellite image segmentations, Photogrammetric Engineering & Remote Sensing, 71(11), 1285-1294.
Carleer, A. P. and Wolff, E., 2006. Urban land cover multi-level region-based features. International Journal of Remote Sensing, 27(6), pp. 1035–1051
Chuvieco, E., 1996. Fundamentos de Teledetección Espacial (3ª ed.). Rialp, Madrid.
DIGITALGLOBE. WhitePaper – The benefits of the 8 Spectral Bands of WorldView-II. March
2010. Available at: http://Worldview2.digitalglobe.com/docs/Worldview-2_8-Band_Applications_Whitepaper.pdf .
Gao, B., 1996. NDWI. A normalized difference water index for remote sensing of vegetation liquid water from space, Remote Sens. Environ., 58(3), 257–266.
Gilabert, M.A., González-Piqueras, J. y García-Haro. J., 1997. Acerca de los índices de vegetación. Revista de Teledetección. 8. Pp. 35-45
Gitelson, A. A., Kaufman, Y., and Merzlyak, M., 1996. Use of a green channel in remote sensing of globalvegetation from eos-modis. Remote Sensing of Environment, 58:289-298.
Hay, S. I., Snow, R. W., & Rogers, D. J., 1998. From predicting mosquito habitat to malaria seasons using remotely sensed data: Practice, problems and perspectives. Parasitology Today, 14, 306−313.
Jackson, T,. 1993. Measuring large scale surface soil moisture using passive microwave remote sensing. Hydrol. Proc., 7, 139–152.
Kaya, S., Pultz, T., Mbogo, P., Beier, P. & E. Mushinzimana., 2002. The use of radar remote sensing for identifying environmental factors associated with malaria risk in coastal Kenya. International Geoscience and Remote Sensing Symposium (IGARSS ’02). Toronto.
Krylov, V. A., Moser, G. S., Serpico, B. and Zerubia, J., 2011. “Enhanced dictionary-based SAR amplitude distribution estimation and its validation with very high-resolution data,” IEEE Geosci. Remote Sens. Lett., vol. 8, no. 1, pp. 148–152.
20
Linthicum, K.J., Bailey, C.L., Davies, F.G. & Tucker, C.J. , 1987. Detection of Rift Valley fever viral activity in Kenya by satellite remote sensing imagery. Science, 235, 1656-1659.
Padwick, Deskevich, Pacifici and Smallwood in "WorldView-2 Pan-Sharpening", published the ASPRS 2010 Annual Conference, San Diego, California in April 2010).
Perea, A.J., Merono, J.E., Aguilera, M.J., 2009. Clasificación orientada a objetos en fotografías aéreas digitales para la discriminación de usos del suelo. INCI, v.34, n.9, p.612-616
Pope, K.O., E.J. Sheffner, K.J. Linthicum, C.L. Bailey, T.M. Logan, E.S. Kasischke, K. Birney, A.R. Njogu, and C.R. Roberts., 1992. Identification of central Kenyan Rift Valley fever virus vector habitats with Landsat TM and evaluation of their flooding status with airborne imaging radar. Remote Sens. Environ. 40:185-196.
Sims, D.A. and Gamon, J.A., 2002. Relationships between Leaf Pigment Content and Spectral Reflectance across a Wide Range of Species, Leaf Structures and Developmental Stages. Remote Sensing of Environment 81:337-354.
21
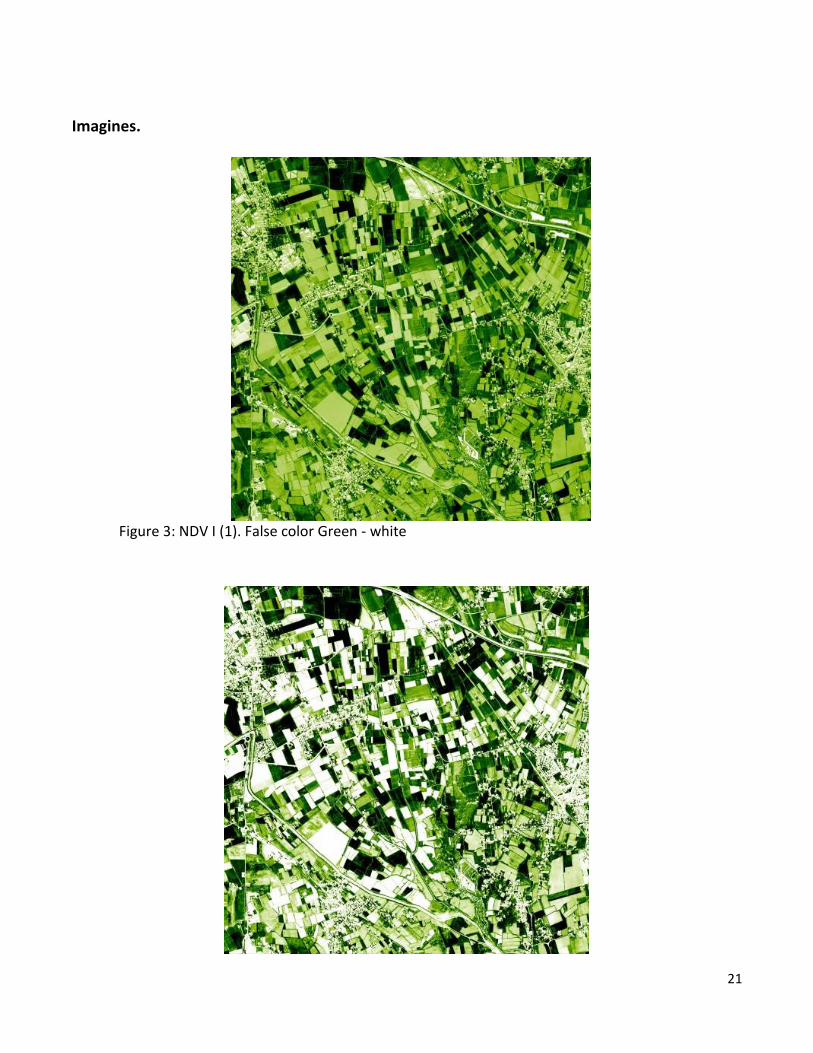
Imagines.
Figure 3: NDV I (1). False color Green - white
22
Figure 4: NDV I (2). False color Green - white
Figure 5: NDV I (3). False color Green - white
Figure 6: NDWI (1). False color Blue - white

23
Figure 7: NDWI (2). False color Blue - white
Figure 8: NDBSI. False color Red- white
24
Figure 9: FCI. False color Yellow – Red - Blue
Figure 10: NDBRI. False color Red – white
25
Annexes
Abstract for the veterinary congress
Site selection framework for mosquitoes traps positioning
Gustavo Leonhard (c), Matteo Mazzucato (a), Paolo Mulatti (b), Fabrizio Montarsi (b), Nicola
Ferrè (a)
(a) GIS Office - Istituto Zooprofilattico Sperimentale delle Venezie, Legnaro, Padova
(b) Istituto Zooprofilattico Sperimentale delle Venezie, Legnaro, Padova
(c) Comisión Nacional de Actividades Espaciales – Córdoba, Argentina.
The management of vector borne diseases heavily relies on environmental factors and land
use. Remote Sensing techniques applied to images acquired by the new generation of
satellites may help to identify regions of interests like areas with high probability of presence
of Tiger mosquito's eggs.
The study area is a plain surface of 25 km2 located in northeastern Italy . This area is
characterized by a high variability in the landscape composition. A WorldView-2 satellite image
with high resolution (0,5m in panchromatic and eight multi-spectral bands) was acquired on
January 8, 2012 at 10:29 and was used to calculate Normalized Difference Vegetation Index
(NDVI) and Normalized Difference Water Index (NDWI). These indexes were calculated using
the two new satellite bands: the Coastal (400 – 450 nm) and the Near infrared 2 (860 - 1040
nm). Index images were then classified using the Natural Break Algorithm (Jenks). The urban
cover was extracted from the Veneto Region Land Use and a Simple Additive Weighted (SAW)
method was used to create a single map that combined all information. All the analysis were
performed with ENVI 4.8 software.
The output map represents the distribution of the zones that maximize the values of biomass,
water and urban building, all of which are important factors in the reproduction dynamics of
Tiger mosquitoes.
The proposed methodology provides a set of candidate sites for placing ovitraps to collect
Tiger mosquito's eggs. WorldView-2 provides information that, combined with additional land
use data, helps to choose the most suitable locations for trapping.