measurement of sediment acidity fluxes to boggy and ... · measurement of sediment acidity fluxes...
TRANSCRIPT

Measurement of sediment acidity fluxes to Boggy and Hunters Creeks
Environment Protection Authority

Measurement of sediment acidity fluxes to Boggy and Hunters Creeks
Authors: Ben Hamilton, Luke Mosley, Dylan Stone and Benjamin Zammit
This work was funded by the Department of Environment, Water and Natural Resources as part of the Coorong, Lower Lakes and Murray Mouth Program. Lower Lakes and Coorong Recovery is part of the South Australian Government’s $610 million Murray Futures program funded by the Australian Government’s $12.9 billion Water for the Future program.
Cover picture: Benjamin Zammit (left) and Benjamin Hamilton install a solar panel which provides power to the benthic chamber stirring mechanism seen in the foreground.
For further information please contact:
Information Officer Environment Protection Authority GPO Box 2607 Adelaide SA 5001
Telephone: (08) 8204 2004 Facsimile: (08) 8124 4670 Free call (country): 1800 623 445
Website: <www.epa.sa.gov.au>
Email: <[email protected]>
ISBN 978-1-921495-50-2
May 20144
Disclaimer
This publication is a guide only and does not necessarily provide adequate information in relation to every situation. This publication seeks to explain your possible obligations in a helpful and accessible way. In doing so, however, some detail may not be captured. It is important, therefore, that you seek information from the EPA itself regarding your possible obligations and, where appropriate, that you seek your own legal advice.
© Environment Protection Authority
This document may be reproduced in whole or part for the purpose of study or training, subject to the inclusion of an acknowledgment of the source and to it not being used for commercial purposes or sale. Reproduction for purposes other than those given above requires the prior written permission of the Environment Protection Authority.

Contents Abbreviations ...................................................................................................................................................................... 1
Summary .............................................................................................................................................................................. 3
1 Introduction ................................................................................................................................................................... 5
2 Methods ......................................................................................................................................................................... 7 2.1 Chamber Installation ............................................................................................................................................ 7 2.2 Calculations ......................................................................................................................................................... 8
3 Results ........................................................................................................................................................................... 9 3.1 Concentrations .................................................................................................................................................... 9 3.2 Fluxes ................................................................................................................................................................ 29
4 Discussion ................................................................................................................................................................... 32 4.1 Sediment:surface water interactions ................................................................................................................. 32 4.2 Risk of acidification under future lower flow conditions ..................................................................................... 34 4.2 Limitations of the current study .......................................................................................................................... 35 4.3 Recommendations for further research ............................................................................................................. 35
5 References................................................................................................................................................................... 37
Appendix 1 ......................................................................................................................................................................... 39
List of figures Figure 1 The terminus end of the Murray–Darling Basin, with sites, including Boggy Creek (solid square) and
Hunters Creek (solid circle) where benthic chambers were installed .................................................................. 7 Figure 2 A photo taken prior to field testing of chamber 1. Photo includes the head unit (electronic components),
magnetic stirrer, gold taps, airline tubing, tie down points for weights and the series of o-rings and flanges separating each component are visible ............................................................................................................... 8
Figure 3 Soluble aluminium concentration (mg/L) inside (black fill) and outside (no fill) benthic chambers at (a) Boggy Creek and (b) Hunters Creek ............................................................................................................. 9
Figure 4 Total aluminium concentration (mg/L) inside (black fill) and outside (no fill) benthic chambers at (a) Boggy Creek and (b) Hunters Creek over time ............................................................................................ 10
Figure 5 Total arsenic concentration (mg/L) inside (black fill) and outside (no fill) benthic chambers at (a) Boggy Creek and (b) Hunters Creek over time. ........................................................................................... 11
Figure 6 Soluble iron concentration (mg/L) inside (black fill) and outside (no fill) benthic chambers at (a) Boggy Creek and (b) Hunters Creek over time ............................................................................................ 12
Figure 7 Total iron concentration (mg/L) inside (black fill) and outside (no fill) benthic chambers at (a) Boggy Creek and (b) Hunters Creek over time ............................................................................................ 13
Figure 8 Soluble zinc concentration (mg/L) inside (black fill) and outside (no fill) benthic chambers at (a) Boggy Creek and (b) Hunters Creek over time ............................................................................................ 14
Figure 9 Total zinc concentration (mg/L) inside (black fill) and outside (no fill) benthic chambers at (a) Boggy Creek and (b) Hunters Creek over time ............................................................................................ 15
Figure 10 Total chromium concentration (mg/L) inside (black fill) and outside (no fill) benthic chambers at (a) Boggy Creek and (b) Hunters Creek over time ............................................................................................ 16
Figure 11 Soluble manganese concentration (mg/L) inside (black fill) and outside (no fill) benthic chambers at (a) Boggy Creek and (b) Hunters Creek over time ............................................................................................ 17
Figure 12 Total manganese concentration (mg/L) inside (black fill) and outside (no fill) benthic chambers at (a) Boggy Creek and (b) Hunters Creek over time ............................................................................................ 18

Figure 13 Soluble nickel concentration (mg/L) inside (black fill) and outside (no fill) benthic chambers at (a) Boggy Creek and (b) Hunters Creek over time ............................................................................................ 19
Figure 14 Total nickel concentration (mg/L) inside (black fill) and outside (no fill) benthic chambers at (a) Boggy Creek and (b) Hunters Creek over time ............................................................................................ 20
Figure 15 Sulfur (presumed to be present as sulfate) concentration (mg/L) inside (black fill) and outside (no fill) benthic chambers at (a) Boggy Creek and (b) Hunters Creek over time. ......................................................... 21
Figure 16 Chloride concentration (mg/L) inside (black fill) and outside (no fill) benthic chambers at (a) Boggy Creek and (b) Hunters Creek over time ............................................................................................ 22
Figure 17 Ammonia (as N) concentration (mg/L) inside (black fill) and outside (no fill) benthic chambers at (a) Boggy Creek and (b) Hunters Creek over time ............................................................................................ 23
Figure 18 Nitrate and Nitrite (as N) concentration (mg/L) inside (black fill) and outside (no fill) benthic chambers at (a) Boggy Creek and (b) Hunters Creek over time ........................................................................................ 24
Figure 19 Phosphorous (filterable as P) concentration (mg/L) inside (black fill) and outside (no fill) benthic chambers at (a) Boggy Creek and (b) Hunters Creek over time ....................................................................... 25
Figure 20 pH (pH units) inside (black fill) and outside (no fill) benthic chambers at (a) Boggy Creek and (b) Hunters Creek over time .............................................................................................................................. 26
Figure 21 Acidity (mg/L) inside (black fill) and outside (no fill) benthic chambers at (a) Boggy Creek and (b) Hunters Creek over time. ................................................................................................................................................ 27
Figure 22 Alkalinity (mg/L) inside (black fill) and outside (no fill) benthic chambers at (a) Boggy Creek and (b) Hunters Creek over time. ............................................................................................................................. 28
Figure 23 Dissolved Oxygen (DO) (mg/L) inside (black fill) and outside (no fill) benthic chambers at (a) Boggy Creek and (b) Hunters Creek over time ............................................................................................ 29
Figure 24 Acidity (a), alkalinity (b), soluble iron (c) and manganese (d) in surface water of Boggy and Hunters Creeks from 2010–13. ....................................................................................................................................... 33
Figure 25 Conceptual model of processes that led to the observed acidity flux from the sediment to the water column of Boggy and Hunters Creeks. ............................................................................................................. 34
List of tables Table 1 Average (AVG) and standard deviation (SD) of flux (mg/m2/day) of soluble (S) and total (T) metals,
acidity, alkalinity and nutrients (NH4, NO3 & NO2, FRP), sulfate (SO4), dissolved oxygen (DO), and total dissolved solids (TDS) for the six week experimental period inside all replicate chambers for Boggy and Hunters Creeks .................................................................................................................................................. 31
Table 2 Analytes and their associated Limits of Reporting (LOR) .................................................................................. 39

Abbreviations CLLMM Coorong, Lower Lakes and Murray Mouth
DEWNR Department of Environment, Water and Natural Resources
EPA South Australian Environment Protection Authority
Al aluminium
As arsenic
B boron
Cd cadmium
Cr chromium
Fe iron
Mn manganese
Ni nickel
S/SO4 sulfur/sulfur dioxide
Zn zinc
P phosphorus
NO3- nitrate
NO2- nitrite
NH4 ammonia
FRP filterable Reactive Phosphorus
DO dissolved oxygen
TDS total dissolved oxygen
pH potential hydrogen
1


Summary Declining lake levels in the drought (2007–10) exposed large areas of acid sulfate soils in the Lower Lakes, which produced sulfuric (pH<4) material upon oxidation. In late 2010 (and into 2011), significant rain fell throughout the Murray−Darling catchment, and a return of significant flows broke the drought. Water levels returned to pre-drought averages in September 2010.
Upon refilling of the Lower Lakes these sediments were inundated, providing a pathway for acidity, dissolved metals and metalloids to be transported from the acidified soils into the overlying surface waters via diffusion and advection. Numerous embayments and marginal lake areas were subsequently acidified. Such fluxes had not previously been directly measured but detection of low levels of acidity in surface water monitoring and modelling results indicate that they were occurring.
The interactions between surface and groundwater was identified as a key knowledge gap in the 2012−13 Department of Environment, Water and Natural Resources (DEWNR) Acid Sulfate Soil Research Priorities Work Plan (key research need 4), specifically ‘What is the significance of surface and groundwater interactions in reducing or increasing the risk of acidification?’.
To answer this question the project aimed to:
• determine the surface:ground water interactions at selected sites
• determine the risk of re-acidification under lower flow conditions.
To achieve these objectives, surface and groundwater interactions were assessed using submerged benthic chambers to measure acidity fluxes from the sediment to surface waters of two ‘hotspot’ locations (Boggy Creek and Hunters Creek on Hindmarsh Island) over a six-week period. These locations acidified in the drought and have had persistent low levels of acidity since. The water quality results from the chambers would also be used to assess the risk of re-acidification under low flow conditions, as the chamber water was isolated from external alkalinity inputs from the Lake water, approximating a shallower stagnant water body at the hotspot locations.
Increases in concentrations of acidity, soluble and total metals (Al, As, Fe, Mn, Ni, Zn) occurred inside the chambers, indicating fluxes from the sediment to the surface water. Despite these fluxes, none of the chambers went acidic (pH<6.5, zero alkalinity) over the six-week experiment, although minor (<0.5 pH units) pH decreases were observed.
The benthic chambers likely represent a near worst case condition in a water body with low water levels and stagnant conditions with little external alkalinity inputs (minor inputs during chamber sampling) from inflows. Hence, based on the flux data from the two sites assessed, there appears to be a low risk of future water acidification under inundated low flow conditions. A key factor that likely reduced the impact of acidity flux in the chamber on pH levels was the alkalinity inputs.
Alkalinity fluxes occurred from the sediment, which were greater than the acidity fluxes, consistent with surface water monitoring observations. The sediment appears to be providing sufficient alkalinity to overcome the acidity inputs (net alkalinity present), regardless of water flows bringing external alkalinity inputs. The alkalinity flux from the sediment is likely occurring via a sulfate reduction reaction as sulfate was observed to be fluxing into the sediment.
Ammonia and filterable reactive phosphorus increased, and oxygen and nitrate generally decreased inside the chamber. This is likely a result of organic matter mineralisation, nitrification and denitification processes, although the increase in phosphorus may also result from iron oxide dissolution in the sediment. Sediment oxygen demand may have also contributed to the decrease in dissolved oxygen inside benthic chambers, but levels never fell to anoxic conditions which may have influenced the flux rate of dissolved metals and metalloids.
Despite these positive findings, the measured metal fluxes may pose an ecological risk, and caution is required in interpreting the overall risk arising from resubmerged acid sulfate soils in the Lower Lakes.
There was a great deal of spatial and temporal variability in the results which is a common feature of sediment flux studies. Key recommendations for further research include undertaking flux measurements at other sites (with different sediment and hydrological characteristics), use of ‘control’ chambers over non-acidic sediments, investigating seasonal variations in fluxes coupled with groundwater measurements, modelling of fluxes, and assessing macro-invertebrate abundance and diversity in relation to acid fluxes.
3


Measurement of sediment acid fluxes to Boggy and Hunters Creeks
1 Introduction In South Australia, the Coorong, Lower Lakes and Murray Mouth (CLLMM) region is a complex series of lakes, rivers, creeks, wetlands and lagoons spread over 1,405 km2 (Kingsford et al 2011), that converge to form the terminus end of the Murray–Darling Basin. The Murray River flows directly into two shallow freshwater lakes, Lake Alexandrina, a broad and shallow lake which joins the terminal Lake Albert, through a narrow channel known as the Narrung Narrows.
Lake Alexandrina flows further south, through the Goolwa Channel, joined by a series of rivers, creeks and tributaries. Built in the 1930s, the river channel is forced over a series of locks, weirs and barrages which regulate outflow and prevent seawater incursion upstream when outflow is at its lowest. Past the barrages, the relatively narrow Murray Mouth allows a connection between the Southern Ocean and the Coorong, an estuarine/hypersaline lagoon system 100 km in length. Almost a decade after Australia became a signatory to the Ramsar Convention on Wetlands in 1975, the CLLMM region was listed as a wetland of international importance in 1985 for its physically and biologically diverse freshwater, estuarine and marine ecosystems, and their ability to support significant populations of migratory shorebirds (Phillips & Muller 2006).
When submerged, sediments within the CLLMM region accumulate sulfidic materials via a natural sulfate reduction process. Several components are necessary for this to occur, including a source of sulfate, organic matter which is available for bacterial metabolism and iron containing minerals (Dent 1986). The process transforms sulfate to sulfide, which reacts with reduced iron to form iron sulfide minerals such as pyrite (FeS2) that are generally stable under reducing conditions (DEWNR 2010). It is only when these sediments, also known as acid sulfate soils, are exposed to air that sulfide reacts with oxygen to produce sulfuric acid and other acidic properties (Fitzpatrick et al 2009, DEWNR 2010).
Impacts from the drought (2007–10), and over-allocation of water upstream, have likely been most severe at the terminus end of the Murray−Darling Basin (Kingsford et al 2011). One such consequence during the drought was the severe drop in water level, falling as low as –1.0 m AHD in Lake Alexandrina during 2009 (DEWNR 2010). This exposed large areas of sediments containing sulfidic (pH>4) acid sulfate soil materials which oxidised to form sulfuric materials (pH<4).
In the Lower Lakes, there was an estimated 18,000 ha of sulfuric soils generated as a result of falling water levels during the drought (Fitzpatrick et al 2010). Following rewetting of the exposed sediments via rainfall and lake refill, dissolved metals and metalloids, including Aluminium (Al), Cadmium (Cd), Copper (Cu), Iron (Fe), Manganese (Mn), Nickel (Ni), Lead (Pb) and Zinc (Zn) were transported from acidified soil into overlying surface water, acidifying a number of marginal lake areas and embayments (Simpson et al 2008, Mosley et al 2013). More than 2,000 ha surface water were acidified.
In late 2010 and into 2011, rain fell throughout the catchment, and a return of significant flows reaching the terminus end of the river broke the drought with water levels returning to pre-drought averages in September 2010. Upon refilling of the Lower Lakes the sediments were inundated, providing a pathway for this acidity to be transported to the lake water via diffusion and advection (Cook and Mosley 2012).
Monitoring occurs on a continual basis throughout the CLLMM region, and results indicate several sites (eg Boggy and Hunters Creeks) have retained low levels of acidity in the water column, appearing to lower over time. This acidity can be the combination of H+ ions and dissolved metals, particular iron, aluminium and manganese (Mosley et al 2013). Net alkalinity still present in overlying water appeared to be sufficient to prevent the main water body turning acidic under moderate−high river inflow conditions.
Of growing concern is the increase in soluble metal concentrations (specifically iron and manganese) in locations such as Boggy and Hunters Creeks, a trend also observed across groundwater piezometers from sites throughout the region. Acidity in surface and pore waters can potentially have lethal and sub-lethal effects on biota, including macro-invertebrates, fish and vegetation (Roach 1997, Corfield 2000).
The interactions between surface and groundwater were identified as a key knowledge gap in a 2012–13 Department of Environment, Water and Natural Resources (DEWNR) Acid Sulfate Soil Research Priorities Work Plan, specifically key research need 4, ‘What is the significance of surface and groundwater interactions in reducing or increasing the risk of acidification?’.
5

Measurement of sediment acid fluxes to Boggy and Hunters Creeks
To answer this research need, this project aimed to:
• determine the surface:ground/pore water interactions at these sites
• determine the risk of re-acidification under lower flow conditions.
Surface and groundwater interactions were investigated using submerged benthic chambers to measured acidity fluxes from the sediment to surface waters of two ’hotspot‘ locations which acidified in the drought. The water quality results from the chambers were also used to assess the risk of re-acidification under low flow conditions, as the chamber water was isolated from external alkalinity inputs, approximating a stagnant water body with low water levels at the monitoring sites.
6

Measurement of sediment acid fluxes to Boggy and Hunters Creeks
2 Methods 2.1 Chamber installation
Between May to July 2013, acid flux from benthic sediments was investigated at two locations on Hindmarsh Island, South Australia (Figure 1). The locations were Boggy and Hunters Creeks, two small freshwater streams which run predominantly north–south from the Goolwa Channel and into Mundoo Channel.
Figure 1 The terminus end of the Murray–Darling Basin, with sites, including Boggy Creek (solid square) and Hunters Creek (solid circle) where benthic chambers were installed.
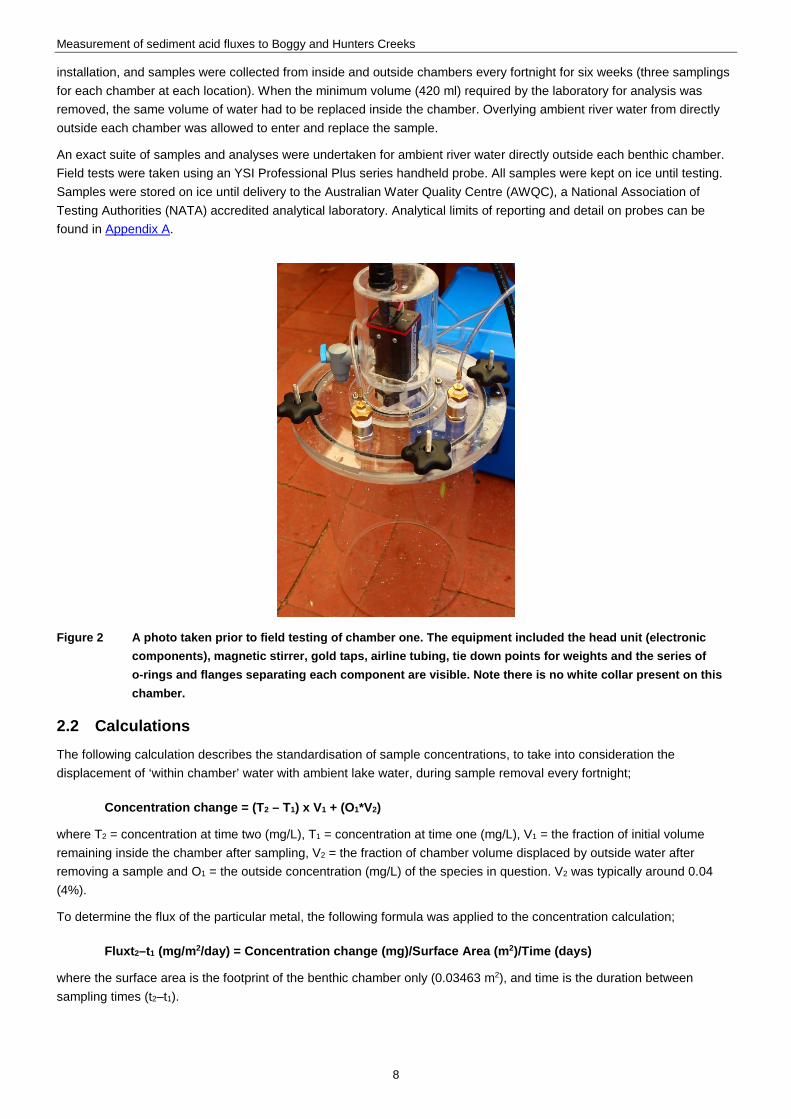
Acrylic (10 mm) chambers (AquanossTM brand) consisted of a head unit (where an electric motor and lead were housed) and a main body (370 mm deep, 210 mm wide), which were separated by a silicone and o-ring gasket (Figure 2). A 30-m lead ran from each chamber to deep-cycle marine grade batteries, which were charged through an independent solar panel per chamber. On the top flange, two gold adaptors connect 4-mm airline tubing to water within the chamber via a series of ball valve taps.
In each chamber, one of these gold adaptors had a 20-cm length of 10-mm hose which went down into the internal chamber. This prevented drawing sample volumes from near where ambient river water was entering at the same time. Taps and hoses were kept off the sediment with a labelled float. Chambers were eased into the sediment approximately 7 cm with the use of an adjustable acrylic ring on the external side of each chamber. Chambers were kept upright for the duration of the experiment by connecting four 10-kg weights to the chamber, and carefully placing them in the north, east, south and west directions. A white magnetic stirrer (visible in Figure 2, underneath the head unit and electronic components) ran inside each chamber at approximately 15–20 rpm.
Three replicate chambers were installed at Boggy Creek and left in-situ for six weeks between May to mid-June, before being moved to Hunters Creek for a repeated six weeks from late June to July. Chambers were randomly placed, filled with ambient river water, taking care not to trap air within the chamber before placement. Chambers were separated from 5–10 m at each site, in water depths of between 1 and 1.5 m AHD. Water was tested from outside the chamber upon
7
Measurement of sediment acid fluxes to Boggy and Hunters Creeks
installation, and samples were collected from inside and outside chambers every fortnight for six weeks (three samplings for each chamber at each location). When the minimum volume (420 ml) required by the laboratory for analysis was removed, the same volume of water had to be replaced inside the chamber. Overlying ambient river water from directly outside each chamber was allowed to enter and replace the sample.
An exact suite of samples and analyses were undertaken for ambient river water directly outside each benthic chamber. Field tests were taken using an YSI Professional Plus series handheld probe. All samples were kept on ice until testing. Samples were stored on ice until delivery to the Australian Water Quality Centre (AWQC), a National Association of Testing Authorities (NATA) accredited analytical laboratory. Analytical limits of reporting and detail on probes can be found in Appendix A.
Figure 2 A photo taken prior to field testing of chamber one. The equipment included the head unit (electronic components), magnetic stirrer, gold taps, airline tubing, tie down points for weights and the series of o-rings and flanges separating each component are visible. Note there is no white collar present on this chamber.
2.2 Calculations The following calculation describes the standardisation of sample concentrations, to take into consideration the displacement of ‘within chamber’ water with ambient lake water, during sample removal every fortnight;
Concentration change = (T2 – T1) x V1 + (O1*V2)
where T2 = concentration at time two (mg/L), T1 = concentration at time one (mg/L), V1 = the fraction of initial volume remaining inside the chamber after sampling, V2 = the fraction of chamber volume displaced by outside water after removing a sample and O1 = the outside concentration (mg/L) of the species in question. V2 was typically around 0.04 (4%).
To determine the flux of the particular metal, the following formula was applied to the concentration calculation;
Fluxt2–t1 (mg/m2/day) = Concentration change (mg)/Surface Area (m2)/Time (days)
where the surface area is the footprint of the benthic chamber only (0.03463 m2), and time is the duration between sampling times (t2–t1).
8

Measurement of sediment acid fluxes to Boggy and Hunters Creeks
3 Results 3.1 Concentrations Concentrations of various water quality parameters inside and outside of the benthic flux chambers are presented in this section. An increase in concentration inside the chamber indicates a flux from the sediment to the water column while a decrease inside the chamber indicates a flux from the water column to the sediment.
Aluminium
Concentrations of soluble aluminium (Al) varied not only between chambers, but between sites and over time (Figure 3a). Boggy Creek showed the most variation between chambers, where Al concentration inside chamber 1 was initially very high and then decreased over time, compared to increasing concentrations in chambers 2 and 3 following an initial lower concentration. However, Al concentrations were higher inside the chamber than outside (Figure 3a) , even though outside concentrations increased in two out of three chambers.
Hunters Creek was quite different in comparison to those at Boggy Creek, with inside soluble Al concentrations similar to outside concentrations (Figure 3b), with an initial peak at Time 1 (T1) and more variability over time. Soluble Al was slightly higher outside Chamber 3 on the third sampling at Hunter’s Creek and the reason for this is unclear.
Figure 3 Soluble aluminium concentration (mg/L) inside (black fill) and outside (no fill) benthic chambers at (a)
Boggy Creek and (b) Hunters Creek. Samples were taken over three fortnightly time periods, represented from left to right for each chamber with T1, T2 and T3.
9

Measurement of sediment acid fluxes to Boggy and Hunters Creeks
Total Al concentrations were more consistent between sites and chambers (Figure 4), but mostly lower inside chambers compared to outside. Chamber 1 in Boggy Creek showed the largest spike in total Al concentration over time, peaking in the last week at 1.440 mg/L, almost twice the concentration recorded inside any chamber at Boggy or Hunters Creeks.
Chambers 1 and 2 in Boggy Creek highlight variability captured within chambers, with Chamber 1 increasing, and Chamber 2 decreasing. But variability was also recorded in surface water outside the chambers, evident between chambers 2 and 3, also in Boggy Creek, where outside concentrations increased and decreased overtime. Interestingly, concentrations at Hunters Creek, both inside and outside of each chamber increased only at the second time period.
Figure 4 Total aluminium concentration (mg/L) inside (black fill) and outside (no fill) benthic chambers at (a) Boggy Creek and (b) Hunters Creek over time. See Figure 3 caption for further details.
10

Measurement of sediment acid fluxes to Boggy and Hunters Creeks
Arsenic
Total arsenic (As) inside chambers across both Boggy and Hunters Creeks tended to decrease over time, or decreased in the second week only to increase in the third and final fortnight to levels consistent with the first fortnight (Figure 5). Concentrations of As inside chambers throughout Boggy Creek were greater than outside concentrations, but the opposite was true in two out of three chambers within Hunters Creek. Hunters Creek chamber 1 had the only As concentration that was higher outside compared to inside. Inside-chamber As concentrations were more consistent than some other chemical species, but varied slightly between sites.
Figure 5 Total arsenic concentration (mg/L) inside (black fill) and outside (no fill) benthic chambers at (a) Boggy Creek and (b) Hunters Creek over time. See Figure 3 caption for further details.
Iron
The concentration of soluble iron (Fe) outside the chambers was consistently low across time, between replicate chambers and at both sites (Figure 6). Strong variation between the inside of chambers continued, with soluble Fe decreasing inside Boggy Creek chamber 1 from 1.4 mg/L to 0.300 mg/L, but increasing at Hunters Creek chamber 1 from 0.018 mg/L to 1.0 mg/L. Hunters Creek had higher soluble Fe concentrations in the water outside the chambers compared to Boggy Creek. Chambers 2 and 3 showed little change in soluble Fe concentrations inside which remained below the outside concentration.
11

Measurement of sediment acid fluxes to Boggy and Hunters Creeks
Figure 6 Soluble iron concentration (mg/L) inside (black fill) and outside (no fill) benthic chambers at (a) Boggy Creek and (b) Hunters Creek over time. See Figure 3 caption for further details.
Total Fe concentrations increased over time inside all benthic chambers at Boggy Creek (Figure 7). Chamber 1 had an increase in total Fe concentration far exceeding that of chambers 2 and 3, increasing from 4.43 mg/L to 13.53 mg/L over the six-week period. The concentrations from chamber 1 of Boggy Creek were also greater than all chambers in Hunters Creek over a similar six-week period. The influence of the benthic chamber is most clearly demonstrated by total Fe concentrations in Figure 7, with water outside every chamber remaining remarkably consistent in comparison to that inside each benthic chamber. Chamber to chamber variation is still evident, with chamber 1 in Hunters Creek showing concentrations almost double that found inside chambers 2 and 3 in the same location, which are all significantly lower than those in Boggy Creek.
12

Measurement of sediment acid fluxes to Boggy and Hunters Creeks
Figure 7 Total iron concentration (mg/L) inside (black fill) and outside (no fill) benthic chambers at (a) Boggy Creek and (b) Hunters Creek over time. See Figure 3 caption for further details.
Zinc
Both soluble (Figure 8) and total (Figure 9) zinc (Zn) inside their respective chambers showed remarkable differences between outside ambient concentrations, which were measured in the thousandths of milligrams per litre. Concentrations were greatest in Hunters Creek in comparison to Boggy Creek. Over the six-week experimental period, both soluble and total concentrations inside chambers increased at four out of the six chambers, and decreased in two, continuing to show between-chamber variation.
13

Measurement of sediment acid fluxes to Boggy and Hunters Creeks
Figure 8 Soluble zinc concentration (mg/L) inside (black fill) and outside (no fill) benthic chambers at (a) Boggy
Creek and (b) Hunters Creek over time. See Figure 3 caption for further details.
14

Measurement of sediment acid fluxes to Boggy and Hunters Creeks
Figure 9 Total zinc concentration (mg/L) inside (black fill) and outside (no fill) benthic chambers at (a) Boggy
Creek and (b) Hunters Creek over time. See Figure 3 caption for further details.
Chromium
Chambers 2 and 3 from both Boggy Creek (Figure 10a) and Hunters Creek (Figure 10b) showed similar total chromium (Cr) concentrations to outside concentrations. Chamber 1 from Boggy Creek showed the only consistent increase inside the chamber over the six-week sampling period. All other chambers showed a gradual decline in Cr concentrations. Inside chamber 1 from Hunters Creek peaked in total Cr concentration after the second week (Figure 10b). The range of concentration values inside other chambers remained relatively close to ambient outside water conditions, and did not vary significantly.
15

Measurement of sediment acid fluxes to Boggy and Hunters Creeks
Figure 10 Total chromium concentration (mg/L) inside (black fill) and outside (no fill) benthic chambers at (a) Boggy
Creek and (b) Hunters Creek over time. See Figure 3 caption for further details.
Manganese
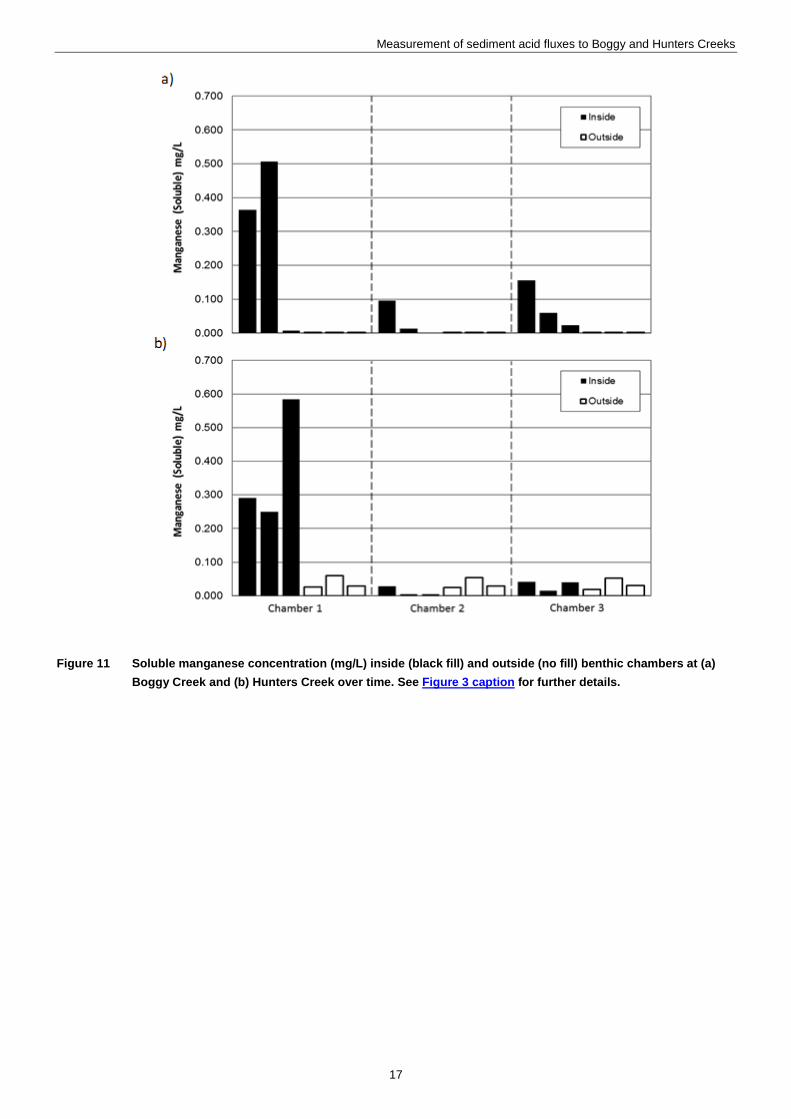
Both soluble (Figure 11) and total (Figure 12) manganese (Mn) concentrations were mostly higher inside the chambers compared to outside for both Boggy and Hunters Creeks. However, considerable variability existed between and within chambers. Outside chambers at Hunters Creek showed a spike of soluble and total Mn in the middle time period, only to decline into concentrations similar to initial concentrations (Figure 11b).
16
Measurement of sediment acid fluxes to Boggy and Hunters Creeks
Figure 11 Soluble manganese concentration (mg/L) inside (black fill) and outside (no fill) benthic chambers at (a)
Boggy Creek and (b) Hunters Creek over time. See Figure 3 caption for further details.
17

Measurement of sediment acid fluxes to Boggy and Hunters Creeks
Figure 12 Total manganese concentration (mg/L) inside (black fill) and outside (no fill) benthic chambers at (a)
Boggy Creek and (b) Hunters Creek over time. See Figure 3 caption for further details.
Nickel
Soluble (Figure 13) and total (Figure 14) nickel (Ni) concentrations were similar to Mn, that concentrations inside benthic chambers were all significantly higher compared with outside concentrations. Average outside concentrations were consistently measured in the low mg/L range (0.0011 and 0.0016 mg/L for soluble and total concentrations respectively), compared to an average inside concentration of 0.0737 and 0.0946 mg/L in Boggy and Hunters Creeks chambers respectively.
18

Measurement of sediment acid fluxes to Boggy and Hunters Creeks
Figure 13 Soluble nickel concentration (mg/L) inside (black fill) and outside (no fill) benthic chambers at (a) Boggy
Creek and (b) Hunters Creek over time. See Figure 3 caption for further details.
19

Measurement of sediment acid fluxes to Boggy and Hunters Creeks
Figure 14 Total nickel concentration (mg/L) inside (black fill) and outside (no fill) benthic chambers at (a) Boggy
Creek and (b) Hunters Creek over time. See Figure 3 caption for further details.
Sulfur/sulfate
The outside concentration of sulfur (S), presumed to be in the form of sulfate, SO4, in the oxygenated water, varied between Boggy and Hunters Creeks, but unlike most metal species explored already, SO4 showed remarkable similarities between chambers. In Boggy Creek, outside concentrations were above levels observed inside the chambers and rose slightly over the six weeks. Inside concentrations were similar, but inside chamber 1, concentrations of SO4 actually declined (Figure 15a). Hunters Creek showed greater differences inside compared to outside the chambers and higher concentrations of SO4 were observed outside the chamber in the second week of sampling, which were not reflected inside the chamber (Figure 15b).
20

Measurement of sediment acid fluxes to Boggy and Hunters Creeks
Figure 15 Sulfur (presumed to be present as sulfate) concentration (mg/L) inside (black fill) and outside (no fill)
benthic chambers at (a) Boggy Creek and (b) Hunters Creek over time. See Figure 3 caption for further details.
SO4 increases on the second sampling in Hunters Creek could be due to seawater intrusion (Hunters Creek is downstream of Mundoo barrage while Boggy Creek is upstream), but this requires further consideration and analysis of barrage opening and backflow calculation data.
Chloride
Chloride concentrations were very similar inside the chambers compared to outside at Boggy Creek (Figure 16). In Hunters Creek there were some large increases in chloride concentration outside the chamber, particularly in the second sampling period, which may have been due to seawater intrusion.
21

Measurement of sediment acid fluxes to Boggy and Hunters Creeks
Figure 16 Chloride concentration (mg/L) inside (black fill) and outside (no fill) benthic chambers at (a) Boggy Creek
and (b) Hunters Creek over time. See Figure 3 caption for further details.
Nutrients (ammonia, nitrate & nitrite, filterable reactive phosphorus)
Chamber 1 in Boggy Creek showed the largest concentration of ammonia (NH3). Initial concentrations of NH3 were low inside and outside each chamber at Hunters Creek, with initial outside concentrations decreasing during the course of the experiment. No significant traces were observed inside or outside each of the benthic chambers after the first week (Figure 17).
22

Measurement of sediment acid fluxes to Boggy and Hunters Creeks
Figure 17 Ammonia (as N) concentration (mg/L) inside (black fill) and outside (no fill) benthic chambers at (a) Boggy
Creek and (b) Hunters Creek over time. See Figure 3 caption for further details.
Nitrate (NO3-) and nitrite (NO2-) concentrations did not show the dissimilarities apparent in other physical−chemical parameters, with similar concentrations inside all chambers regardless of the site. Outside concentrations showed strong similarities within each site, but were much higher in Hunters Creek in the initial sampling period (Figure 18). Outside water was higher in NO3- and NO2- in both Boggy and Hunters Creeks. Initial outside concentrations peaked in the first fortnight after installation, and decreased thereafter, ending near concentrations close to those inside the chambers.
23

Measurement of sediment acid fluxes to Boggy and Hunters Creeks
Figure 18 Nitrate and Nitrite (as N) concentration (mg/L) inside (black fill) and outside (no fill) benthic chambers at
(a) Boggy Creek and (b) Hunters Creek over time. See Figure 3 caption for further details.
Filterable reactive phosphorous (P) (bioavailable/soluble form) concentrations inside chambers were well above outside concentrations in Boggy Creek (Figure 19), but were quite different in Hunters Creek. Hunters Creek had increased concentrations outside, decreasing in the middle sampling period, only to increase in the last sampling event. Chamber 1 saw a constant increase over time, but chamber 3 saw a marked decrease after the initial sampling period.
24

Measurement of sediment acid fluxes to Boggy and Hunters Creeks
Figure 19 Phosphorous (filterable as P) concentration (mg/L) inside (black fill) and outside (no fill) benthic
chambers at (a) Boggy Creek and (b) Hunters Creek over time. See Figure 3 caption for further details.
pH, acidity and alkalinity
pH was mostly lower inside the chambers in Boggy Creek, and tended to decrease over time. However the pH of ambient water was 7.5 upon chamber installation, and had only decreased inside chambers to 7.0 by the end of the experiment (Figure 20a) so the pH levels remained above the ANZECC guideline (pH 6.5). Hunters Creek had more variation, with chambers 1 and 3 decreasing over time, but chamber 2 pH increasing from 7.5 to 7.7 over the six-week sampling period (Figure 20b).
25

Measurement of sediment acid fluxes to Boggy and Hunters Creeks
Figure 20 pH (pH units) inside (black fill) and outside (no fill) benthic chambers at (a) Boggy Creek and (b) Hunters
Creek over time. See Figure 3 caption for further details.
Acidity was very consistent across Boggy Creek (Figure 21a), rising strongly every fortnight across the experiment, with some variation across chambers. Less acidity appeared to flux from sediments into chambers in Hunters Creek (Figure 21b), but acidity still increased slightly over time in chambers 1 and 2, and only chamber 3 of Hunters Creek decreased in acidity over time, but did start with more acidity than the other Hunters Creek chambers.
26

Measurement of sediment acid fluxes to Boggy and Hunters Creeks
Figure 21 Acidity (mg/L) inside (black fill) and outside (no fill) benthic chambers at (a) Boggy Creek and (b) Hunters
Creek over time. See Figure 3 caption for further details.
Alkalinity increased over time inside the chambers at Boggy Creek and Hunters Creek chamber 1 (Figure 22). Alkalinity outside the chambers remained quite stable apart from an unusually high alkalinity recorded on the second sampling in chamber 1 at Boggy Creek (the reasons for which are unclear).
27

Measurement of sediment acid fluxes to Boggy and Hunters Creeks
Figure 22 Alkalinity (mg/L) inside (black fill) and outside (no fill) benthic chambers at (a) Boggy Creek and (b)
Hunters Creek over time. See Figure 3 caption for further details.
Dissolved oxygen
Dissolved oxygen inside the chambers was initially low, almost half that of outside water after the first fortnight, and generally remained lower than the outside water (Figure 23). Interestingly, dissolved oxygen appeared to increase inside and outside of many chambers over time. Only chamber 1 of Hunters Creek showed a decline in dissolved oxygen in the chamber over time (Figure 23).
28

Measurement of sediment acid fluxes to Boggy and Hunters Creeks
Figure 23 Dissolved Oxygen (DO) (mg/L) inside (black fill) and outside (no fill) benthic chambers at (a) Boggy Creek
and (b) Hunters Creek over time. See Figure 3 caption for further details.
3.2 Fluxes Average flux (as well as standard deviation) from the sediment to the water for the three chambers was calculated for metals, alkalinity and acidity over the six-week experimental period at each site (Table 1). A positive flux value indicates transport is from the sediment to the water while a negative flux indicates transport from the water to the sediment. The results have been corrected for the withdrawal of a small portion (approx. 4%) of the water inside the chambers for fortnightly analysis and replacement of this volume with water outside of the chamber (see Methods section for calculations).
Most parameters showed high levels of variability, with large standard deviations in comparison to their average (Table 1).
There was an acidity flux from the sediment to the water at Boggy Creek, averaging 9.36 mg/m2/day (with a standard deviation of 15.07 mg/m2/day). On average the flux was negative (into the sediment) at Hunters Creek (average of –2.55 mg/m2/day) with less variability compared to Boggy Creek (standard deviation of 8.09 mg/m2/day).
An alkalinity flux was also measured from the sediment into surface water at both sites and this was higher at Boggy Creek (an average of 40.5 mg/m2/day) compared to Hunters Creek (average of 12.7 mg/m2/day).
Fluxes of soluble and total metals (Al, As, Fe, Mn, Ni, and Zn) occurred from the sediment to the water column. Other metals such as Cd and Cr showed no discernible flux but it should be noted that these metals may not have been present in high concentrations in the sediment. Fe had a positive flux from the sediment in both Boggy and Hunters Creeks (0.35 and 0.17 mg/m2/day soluble Fe respectively), with lower standard deviations in comparison to some other metal species.
29

Measurement of sediment acid fluxes to Boggy and Hunters Creeks
Mn also had a positive flux (0.02 and 0.12 mg/m2/day respectively for soluble Mn at Boggy and Hunters Creeks). Both soluble and total Zn showed some of the most consistent positive flux from the sediment to surface water, with soluble Zn increasing in Boggy and Hunters Creeks by an average of 0.24 and 0.64 mg/m2/day respectively.
S had a negative flux in both Boggy and Hunters Creeks, but was greatest in the latter, with an average of –28.52 compared to –1.45 mg/m2/day respectively. These results were quite dissimilar, even considering the large standard deviations (Table 1).
Nutrients, NH4- and FRP showed a positive flux from the sediment to the water column whereas NO3- and NO2- were (on average) fluxing into the sediment from the water column. On average, DO flux was into the sediment in Boggy Creek, and out of the sediment in Hunters Creek, with a similar level of variation between sites.
30

Measurement of sediment acid fluxes to Boggy and Hunters Creeks
Table 1 Average (AVG) and standard deviation (SD) of flux (mg/m2/day) of soluble (S) and total (T) metals, acidity, alkalinity and nutrients (NH4, NO3 & NO2, FRP), sulfate (SO4), dissolved oxygen (DO), and total dissolved solids (TDS) for the six week experimental period inside all replicate chambers for Boggy and Hunters Creeks. A positive flux value indicates transport is from the sediment to the water while a negative flux indicates transport from the water to the sediment. *Outliers which were likely caused by seawater intrusion. **Elements which were not represented in figures throughout the main text.
Site Value Mn (S) Mn (T) Ni (S) Ni (T) S/SO4 Zn (S) Zn (T) Chloride P NO3- & NO2- (as N)
Boggy Creek AVG 0.0204 0.1811 0.0554 0.0963 −1.4529 0.2414 0.3481 18.1049 0.0182 −0.0029
SD 0.4604 0.4190 0.0903 0.1081 10.2210 0.2609 0.2253 14.8841 0.0269 0.0084
Hunters Creek AVG 0.1246 0.1097 0.0517 0.0596 −28.5210 0.6390 0.7337 −99.8420 −0.0110 −0.0128
SD 0.2775 0.2655 0.1092 0.1608 78.5731 0.8364 0.9764 480.8781* 0.1369 0.0194
Site Value Al (S) Al (T) As (T) B** (S) Cd** (S) Cd** (T) Cr** (S) Cr (T) Fe (S) Fe (T)
Boggy Creek AVG 0.0026 0.1662 0.0006 0.0185 0.0000 0.0001 0.0000 0.0004 0.3493 3.9267
SD 0.0125 0.8410 0.0014 0.6475 0.0001 0.0002 0.0000 0.0011 1.2246 4.7998
Hunters Creek AVG −0.0020 −0.1086 0.0000 −0.0278 0.0000 0.0000 0.0000 −0.0001 0.1773 0.4281
SD 0.0033 0.6777 0.0006 0.1280 0.0000 0.0002 0.0000 0.0009 0.6248 0.9553
Site Value NH4 (as N) FRP** DO TDS** Alkalinity (as CaCO3) Acidity (as CaCO3) pH
Boggy Creek AVG 0.2149 0.0183 -0.4660 61.264 40.5004 9.3610 0.1348
SD 0.5115 0.0269 4.8816 24.7223 15.1390 15.0683 0.4999
Hunters Creek AVG −0.0140 −0.0110 0.1290 −164.0896 12.6829 −2.5451 0.4825
SD 0.0825 0.1369 3.1468 816.1346* 16.6736 8.0863 0.2676
31

Measurement of sediment acid fluxes to Boggy and Hunters Creeks
4 Discussion 4.1 Sediment:surface water interactions Acidity fluxes were directly measured for the first time from submerged sediments in the Lower Lakes in this study. Soluble Fe, Mn, Ni, Zn and in some chambers Al was fluxing from the sediment to the water column and it is likely this metal acidity comprised most of the total acidity flux from the sediment. These metals have previously been identified to pose a risk following rewetting of acid sulfate soils in the Lower Lakes (Simpson et al 2010, Mosley et al 2013). For many of these metals, in particular Fe and Al, the total metal concentration was much higher than the soluble concentration inside the chamber. This indicates oxidation, hydrolysis and precipitation of solid metal hydrous oxide phases likely occurred once the soluble metals reached the oxygenated chamber/surface water (Mosley et al 2013). There may have been some metal precipitation also in the oxic zone at the top of sediment but a substantial proportion still reached the surface water. Some of the total metal fraction may have settled to the sediment inside the chamber during the experiment so the results may underestimate the actual metal flux.
The flux results are generally consistent with surface water measurements in the EPA/DEWNR monitoring program over the last few years (2010 to 2013), which show acidity, soluble Fe and Mn persisting in the water column (Figure 24). This strongly supports our hypothesis that sediment:water fluxes are driving these trends, with slowly lowering fluxes over time as also predicted in modelling (Cook and Mosley 2012).
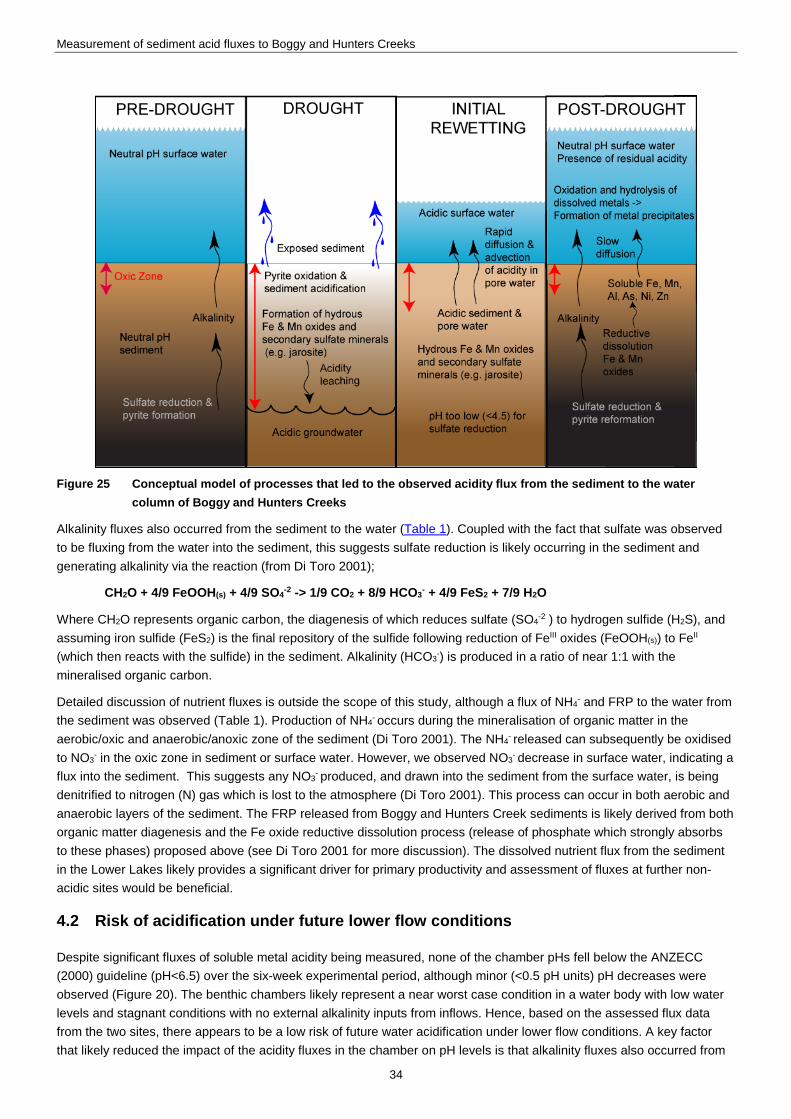
A conceptual model of the processes that are likely to have led to the observed acidity fluxes is expressed in Figure 25. Once the exposed acid sulfate soils were submerged, the decrease in the redox potential likely resulted in reductive dissolution of Fe and Mn oxides and secondary sulfate minerals such as jarosite. This has also been observed in the Lower Lakes groundwater monitoring program (Leyden et al 2013). Metals from these phases, and other metals adsorbed and co-precipitated, likely entered pore water, to add to elevated soluble metal levels present from the initial soil acidification. The high concentration of soluble metals in the pore water would have established a diffusion gradient to the surface water which has much lower metal concentrations. This likely resulted in a flux of these soluble metals and acidity to the surface water.
32

Measurement of sediment acid fluxes to Boggy and Hunters Creeks
Figure 24 Acidity (a), alkalinity (b), soluble iron (c) and manganese (d) in surface water of Boggy and Hunters Creeks from 2010–13
.
33
Measurement of sediment acid fluxes to Boggy and Hunters Creeks
Figure 25 Conceptual model of processes that led to the observed acidity flux from the sediment to the water
column of Boggy and Hunters Creeks
Alkalinity fluxes also occurred from the sediment to the water (Table 1). Coupled with the fact that sulfate was observed to be fluxing from the water into the sediment, this suggests sulfate reduction is likely occurring in the sediment and generating alkalinity via the reaction (from Di Toro 2001);
CH2O + 4/9 FeOOH(s) + 4/9 SO4-2 -> 1/9 CO2 + 8/9 HCO3- + 4/9 FeS2 + 7/9 H2O
Where CH2O represents organic carbon, the diagenesis of which reduces sulfate (SO4-2 ) to hydrogen sulfide (H2S), and assuming iron sulfide (FeS2) is the final repository of the sulfide following reduction of FeIII oxides (FeOOH(s)) to FeII (which then reacts with the sulfide) in the sediment. Alkalinity (HCO3-) is produced in a ratio of near 1:1 with the mineralised organic carbon.
Detailed discussion of nutrient fluxes is outside the scope of this study, although a flux of NH4- and FRP to the water from the sediment was observed (Table 1). Production of NH4- occurs during the mineralisation of organic matter in the aerobic/oxic and anaerobic/anoxic zone of the sediment (Di Toro 2001). The NH4- released can subsequently be oxidised to NO3- in the oxic zone in sediment or surface water. However, we observed NO3- decrease in surface water, indicating a flux into the sediment. This suggests any NO3- produced, and drawn into the sediment from the surface water, is being denitrified to nitrogen (N) gas which is lost to the atmosphere (Di Toro 2001). This process can occur in both aerobic and anaerobic layers of the sediment. The FRP released from Boggy and Hunters Creek sediments is likely derived from both organic matter diagenesis and the Fe oxide reductive dissolution process (release of phosphate which strongly absorbs to these phases) proposed above (see Di Toro 2001 for more discussion). The dissolved nutrient flux from the sediment in the Lower Lakes likely provides a significant driver for primary productivity and assessment of fluxes at further non-acidic sites would be beneficial.
4.2 Risk of acidification under future lower flow conditions
Despite significant fluxes of soluble metal acidity being measured, none of the chamber pHs fell below the ANZECC (2000) guideline (pH<6.5) over the six-week experimental period, although minor (<0.5 pH units) pH decreases were observed (Figure 20). The benthic chambers likely represent a near worst case condition in a water body with low water levels and stagnant conditions with no external alkalinity inputs from inflows. Hence, based on the assessed flux data from the two sites, there appears to be a low risk of future water acidification under lower flow conditions. A key factor that likely reduced the impact of the acidity fluxes in the chamber on pH levels is that alkalinity fluxes also occurred from
34

Measurement of sediment acid fluxes to Boggy and Hunters Creeks
the sediment which were greater than the acidity fluxes (Table 1). This is consistent with the surface water monitoring observations that water alkalinity has been maintained at high levels despite acidity fluxes (Figure 24). Hence the sediment appears to be providing sufficient alkalinity to overcome the acidity inputs (net alkalinity present), regardless of water flows bringing external alkalinity inputs. The alkalinity flux from the sediment is likely occurring via the sulfate reduction reaction presented above.
Despite these positive findings, the measured metal fluxes may pose an ecological risk in and of themselves, so caution is required in interpreting the overall risk arising from resubmerged acid sulfate soils in the Lower Lakes. It also noted that recent minor acidification events have been observed in the Point Sturt region (EPA unpublished data) that may relate to groundwater exfiltration following rainfall events and lake level changes (Cook et al 2011).
4.2 Limitations of the current study Our study successfully provided the first direct measurements of acidity flux from submerged sediments in the Lower Lakes, but we encountered some difficulties and limitations which are discussed here.
There was a great deal of variability in results between and within sites for many parameters which made interpretation more difficult. Some of this may relate to spatial variability in sediment properties, which has been observed in Boggy Creek over very short distances (see Hicks et al 2009). Large spatial and temporal variability is a common feature in sediment flux studies at other locations (Di Toro 2001). It would be beneficial to undertake longer-term measurements of acidity and nutrient fluxes at more locations to assess seasonal and spatial variability in greater detail.
This commercially produced, specific benthic chamber model (AquanossTM) was rated for deployment in water depths up to 30 m; ours were deployed in water less than a meter deep. From February to May 2013, a pilot study was undertaken to test the operational capacity of benthic chambers and our method of powering them via solar panels in Boggy Creek.
After a fortnight, the trial chamber showed water ingress through two flanges around the head unit, flooding the electronic components and stopping the stirrer. After replacement parts were received from the manufacturer, further leaks delayed the installation of the full-scale experiment and the manufacturer is currently investigating alternative designs to ensure improved chamber integrity. One plausible reason provided by the manufacturer for the issue, is that non-pressurised air transport (typical for freight) to Australia may have resulted in seal failure or weakening.
Although the chambers were working correctly at the time of installation, there was concern that water ingress could occur during the experiments. Even though the chambers were installed in relatively shallow water, the highly turbid nature of the creek meant the status of the spinning magnet within the captive water/sediment section of the chamber would be unknown until chamber removal.
After installation for six weeks in Boggy Creek, magnets were spinning when chambers were removed. At Hunters Creek, the final location, magnets in chambers 2 and 3 had stopped spinning when chambers were removed at the conclusion of the experiment. This indicates at some stage post-installation, despite a positive indication from the solar panel that power was still available to the benthic chamber unit, the stirrers had stopped. Results are still considered useful (as some fluxes will occur via diffusion regardless of stirring), but more caution should be taken in interpreting results. The lower fluxes from two of the Hunters Creek chambers (2 and 3) may also be explained by the magnetic stirrer failing at some stage during the experiment in these chambers.
4.3 Recommendations for further research • Further benthic flux measurement in previous acid hotspots (eg Boggy Lake, Point Sturt North and South, and
Currency Creek) which have different sediment properties (eg sand, organic matter content), hydrological regimes, levels of sediment acidity, and varying hydrological connections to larger water bodies. These attributes may influence the acidity flux from sediments, which could change the risk to surface water under low flow conditions.
• Further benthic flux measurements in non-acidic sediments to determine non-acid sulfate soil related background fluxes of metals and nutrients.
• Measure sediment properties, in particular metals, sulfides and organic carbon inside the chambers at the beginning and end of the experiments.
35

Measurement of sediment acid fluxes to Boggy and Hunters Creeks
• Seasonal measurements coupled with groundwater data (see Leyden et al 2013) to derive possible interactions from regional groundwater.
• Combine measurements of macro-invertebrate diversity and abundance with individual site flux measurements.
• Undertake modelling of fluxes via the method of Cook and Mosley (2012) to compare to the results in the current study.
• Use an alternate chamber design for future studies and ensure any chambers sourced from overseas are freighted under suitable conditions to maintain pressure seal integrity.
36

Measurement of sediment acid fluxes to Boggy and Hunters Creeks
5 References ANZECC 2000, Australian and New Zealand Guidelines for Fresh and Marine Water Quality, Australian and New Zealand Environment and Conservation Council and Agriculture and Resource Management Council of Australia and New Zealand, Canberra.
Cook FJ, McLachlan G, Leyden E and Mosley L 2011, Physical properties of soils/sediments of Lower Murray Lakes and modelling of acid fluxes, CSIRO: Water for a Healthy Country National Research Flagship, 60 pp.
Cook FJ & Mosley L 2012, Modelling of acidic solute fluxes from sediments to the water column in the Lower Lakes of South Australia, prepared by Freeman Cook & Associates and EPA for the Department of Environment, Water and Natural Resources, Adelaide.
Corfield J 2000, ‘The effect of acid sulphate run-off on a subtidal estuarine community in the Richmond River, NSW, Australia’, Journal of Marine Science, 57: 1517–1523.
Dent A 1986, ‘Acid sulphate soils: a baseline for research and development’, International Institute for Land Reclamation and Improvement, Publication No. 39, Wageningen, Netherlands, 250 pp.
DEWNR 2010, Acid sulfate soils research program summary report, prepared by the Lower Lakes Acid Sulfate Soils Research Committee for the Department of Environment, Water and Natural Resources, Adelaide.
Di Toro DM 2001, Sediment Flux Modelling, John Wiley and Sons Inc, 624 pp.
Fitzpatrick RW, Shand P and Merry RH 2009, ‘Acid Sulfate Soils’ in Jennings JT (ed), Natural History of the Riverland and Murraylands, Royal Society of South Australia Inc, Adelaide, pp 65–111.
Fitzpatrick RW, Grealish G, Chappell A, Marvanek and S,Shand P 2010, Spatial variability of subaqueous and terrestrial acid sulfate soils and their properties for the Lower Lakes South Australia, CSIRO Land and Water report, viewed 6 May 2014, www.environment.sa.gov.au/Conservation/Rivers_wetlands/Coorong_Lower_Lakes_Murray_Mouth/The_environment/Acid_sulfate_soils/Research_projects/Acid_Sulfate_Soils_Research_Program_reports.
Hicks WS, Creeper N, Hutson J, Fitzpatrick RW, Grocke S and Shand P 2009, The potential for contaminant mobilisation following acid sulfate soil rewetting: field experiment. Prepared by the Commonwealth Scientific and Industrial Research Organisation for the Department of Environment, Water and Natural Resources, Adelaide.
Kingsford RT, Walker KF, Lester RE, Young WJ, Fairweather PG, Sammut J and Geddes MC 2011, ‘A Ramsar wetland in crisis – the Coorong, Lower Lakes and Murray Mouth’, Australia, Marine and Freshwater Research, 62: 255–265.
Leyden E, Zammit B, Stone D, Mettam P, Hamilton B and Mosley L 2013, Lower Lakes Groundwater Acidification Risk Projec: Monitoring Report 2011–12, Environment Protection Authority, Adelaide.
Mosley LM, Zammit B, Jolley A, Barnett L and Fitzpatrick R 2013, Monitoring and assessment of surface water acidification following rewetting of oxidised acid sulphate soils, Environmental Monitoring and Assessment, DOI 10.1007/s10661-013-3350-9.
Murray–Darling Basin Authority 2010, Guide to the proposed Basin Plan: Technical background, Murray-Darling Basin Authority, Canberra.
Phillips W and Muller K 2006, Ecological Character of the Coorong, Lake Alexandrina and Albert Wetland of International Importance, Prepared for the Department for Environment and Heritage, Adelaide.
Roach AC 1997, ‘The effect of acid water inflow on estuarine benthic and fish communities in the Richmond River, NSW’, Australia, Australian Journal of Ecotoxicology, 3: 25–26.
37

Measurement of sediment acid fluxes to Boggy and Hunters Creeks
Simpson S, Fitzpatrick R, Shand P, Angel B, Spadaro D, Merry RM and Thomas M 2008, Acid, metal and nutrient mobilisation following rewetting of acid sulfate soils in the Lower Murray, prepared by the CSIRO for the Environment Protection Authority, Adelaide.
Simpson SL, Fitzpatrick RW, Shand P, Angel BM, Spadaro DA and Mosley L 2010, ‘Climate-driven mobilisation of acid and meatals from acid sulfate soils’, Marine and Freshwater Research, 61: 129–138.
38

Measurement of sediment acid fluxes to Boggy and Hunters Creeks
Appendix 1 All samples were collected in accordance with standard operating procedures of the Australian Water Quality Centre (AWQC), a National Association of Testing Authorities (NATA) accredited analytical laboratory. As with all analytical reporting, AWQC provide Limits of Reporting (LOR), or the lowest concentration of an analyte which can be reported, based on the Limit of Quantification (LOQ), or the lowest concentration of analyte for which quantitative results may be obtained.
Table 2 Analytes and their associated Limits of Reporting (LOR)
Analyte LOR
Aluminium (Soluble) (mg/L) 0.001
Aluminium (Total) (mg/L) 0.001
Arsenic (Total) (mg/L) 0.0003
Boron (Soluble) (mg/L) 0.020
Cadmium (Soluble) (mg/L) 0.0001
Cadmium (Total) (mg/L) 0.0001
Chromium (Soluble) (mg/L) 0.0001
Chromium (Total) (mg/L) 0.0001
Iron (Soluble) (mg/L) 0.0005
Iron (Total) (mg/L) 0.0005
Manganese (Soluble) (mg/L) 0.0001
Manganese (Total) (mg/L) 0.0001
Nickel (Soluble) (mg/L) 0.0001
Nickel (Total) (mg/L) 0.0001
Sulphur (Sulphate) (mg/L) 1.5
Zinc (Soluble) (mg/L) 0.0003
Zinc (Total) (mg/L) 0.0003
Ammonia (as N) (mg/L) 0.005
Chloride (mg/L) 4.0
Nitrate and Nitrite (as N) (mg/L) 0.003
Phosphorous (filterable reactive as P) (mg/L) 0.003
Alkalinity (as Calcium Carbonate) (mg/L) –
Bicarbonate (mg/L) –
Carbonate (mg/L) –
39

Measurement of sediment acid fluxes to Boggy and Hunters Creeks
Analyte LOR
Hydroxide (mg/L) –
Conductivity (µS/cm) 1
TDS (mg/L) 1.0
pH –
40