measuring agile: a disciplined approach to metrics
TRANSCRIPT

© Disciplined Agile Consortium 1
Measuring Agile A Disciplined Agile Approach to Metrics
Agenda
• Important questions • Principles • Measuring agile teams • Potential metrics • Supporting IT governance • Parting thoughts • Questions
© Disciplined Agile Consortium 2
Important Questions
• How do you measure solution delivery teams?
• What metrics should we collect? • How do you roll up team measures to
the portfolio level? • What metrics are right for you? • How do agile and traditional metrics fit
together? • What are the success factors for metrics
programs? • What are the failure factors? • How does this fit into your overall
governance strategy?
© Disciplined Agile Consortium 3

© Disciplined Agile Consortium 4

Principle: There is No Easy Answer
© Disciplined Agile Consortium 5

Principle: Every Metric Has Strengths and Weaknesses
© Disciplined Agile Consortium 6

Principle: Compete Against Yourself
© Disciplined Agile Consortium 7

Principle: Measure to Improve
© Disciplined Agile Consortium 8

Principle: You Get What You Measure
© Disciplined Agile Consortium 9

Principle: Measure Outcomes at the Team Level
© Disciplined Agile Consortium 10
Principle: Every Team Needs a Unique Set of Metrics
© Disciplined Agile Consortium 11

Principle: Teams Use Metrics to Self Organize
© Disciplined Agile Consortium 12

Principle: Trust But Verify
© Disciplined Agile Consortium 13
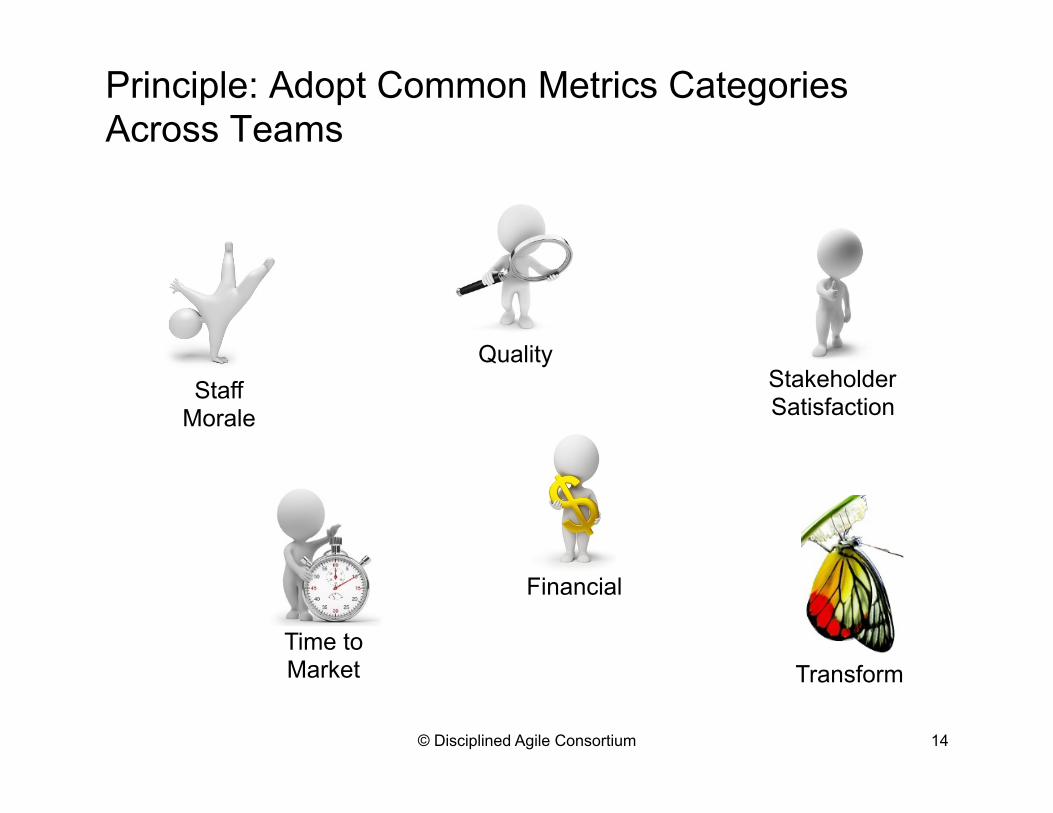
Principle: Adopt Common Metrics Categories Across Teams
© Disciplined Agile Consortium 14
Time to Market
Financial
Stakeholder Satisfaction
Quality Staff
Morale
Transform

Principle: Don’t Manage to the Metrics
© Disciplined Agile Consortium 15

Principle: Automate Wherever Possible
© Disciplined Agile Consortium 16

Principle: Prefer Trends Over Scalars
© Disciplined Agile Consortium 17

Prefer Leading Over Trailing Metrics
© Disciplined Agile Consortium 18

Principle: Prefer Pull (Dashboards) Over Push (Reports)
© Disciplined Agile Consortium 19

Measuring Agile Teams
© Disciplined Agile Consortium 20

Goal Question Metric (GQM)
A lightweight GQM process: 1. Identify improvement goals 2. Generate questions that define those goals as completely as possible in
a quantifiable way 3. Identify potential measures needed to be collected to answer those
questions 4. Introduce mechanisms for data collection 5. Collect, validate and analyze the data in real time to provide feedback to
teams for corrective action
Similar to Google’s OKR (Objectives and Key Results)
© Disciplined Agile Consortium 21

• Some goals are qualitative: – Invest in IT wisely – Improve staff morale – Improve stakeholder satisfaction with delivered solutions
• Some goals are quantitative: – Decrease cycle time by 20% this quarter – Reduce technical debt by 10% by year end – Get our net promoter score (NPS) to 60% by quarter end
• Our advice: – Short time frames (less than three months) work well – Quantitative goals are generally better than qualitative
© Disciplined Agile Consortium 22
Identify Improvement Goals

© Disciplined Agile Consortium 23

Goal: Invest in IT Wisely
Questions 1. How effective is the
investment in IT activities?
2. What future spending do we require?
3. Is productivity increasing?
Potential Metrics 1. Value delivered, net present
value (NPV), return on investment (ROI)
2. Effort/cost projection (burn ups/burn downs)
3. Acceleration, business value delivered, velocity (trend)
© Disciplined Agile Consortium 24

Goal: Decrease cycle time by 20% this quarter
Questions 1. Is the team working at a
sufficient pace?
2. Is the team working together effectively?
3. Are changing requirements putting the release date at risk?
Potential Metrics 1. Release burndown, ranged
release burndown
2. Team morale, stakeholder satisfaction, blocking work items
3. Age of items, ranged release burndown
© Disciplined Agile Consortium 25

Goal: Reduce Technical Debt by 10% by Year End
Questions 1. What is our current level of
technical debt?
2. Are we improving quality over time?
Potential Metrics 1. Code quality, defect density
2. Build health, defect density, test coverage, code quality
© Disciplined Agile Consortium 26

Potential Metrics
© Disciplined Agile Consortium 27
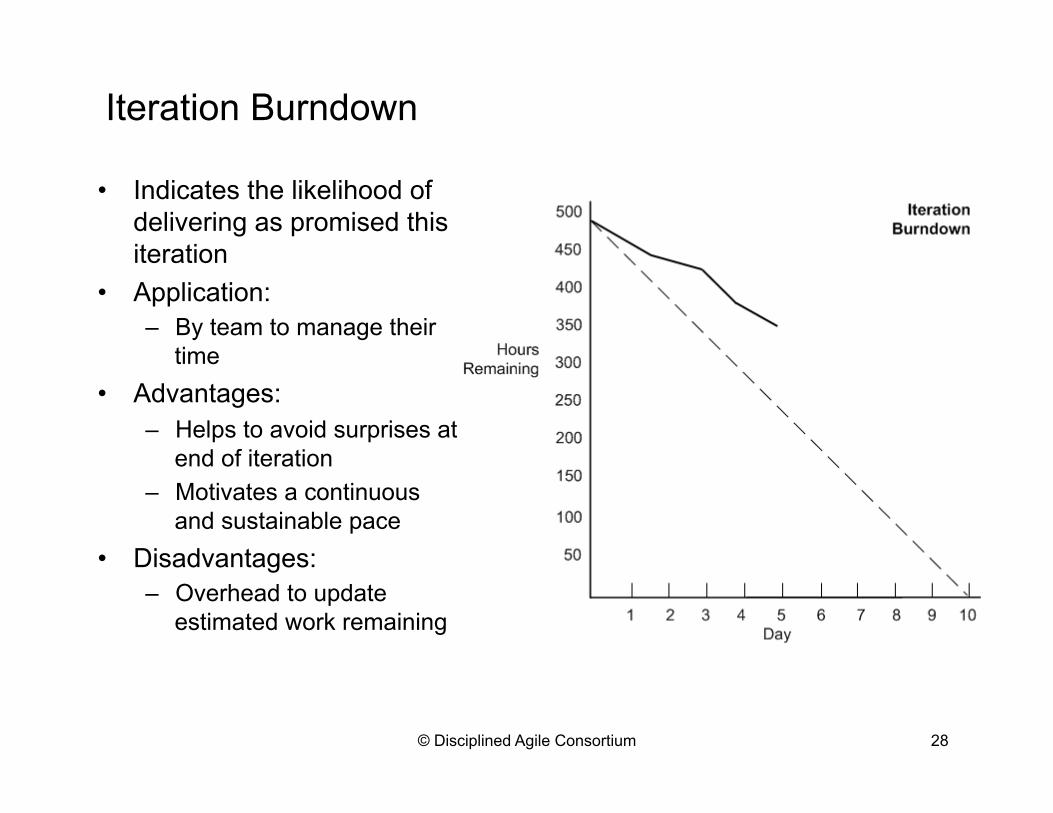
Iteration Burndown
• Indicates the likelihood of delivering as promised this iteration
• Application: – By team to manage their
time • Advantages:
– Helps to avoid surprises at end of iteration
– Motivates a continuous and sustainable pace
• Disadvantages: – Overhead to update
estimated work remaining
© Disciplined Agile Consortium 28
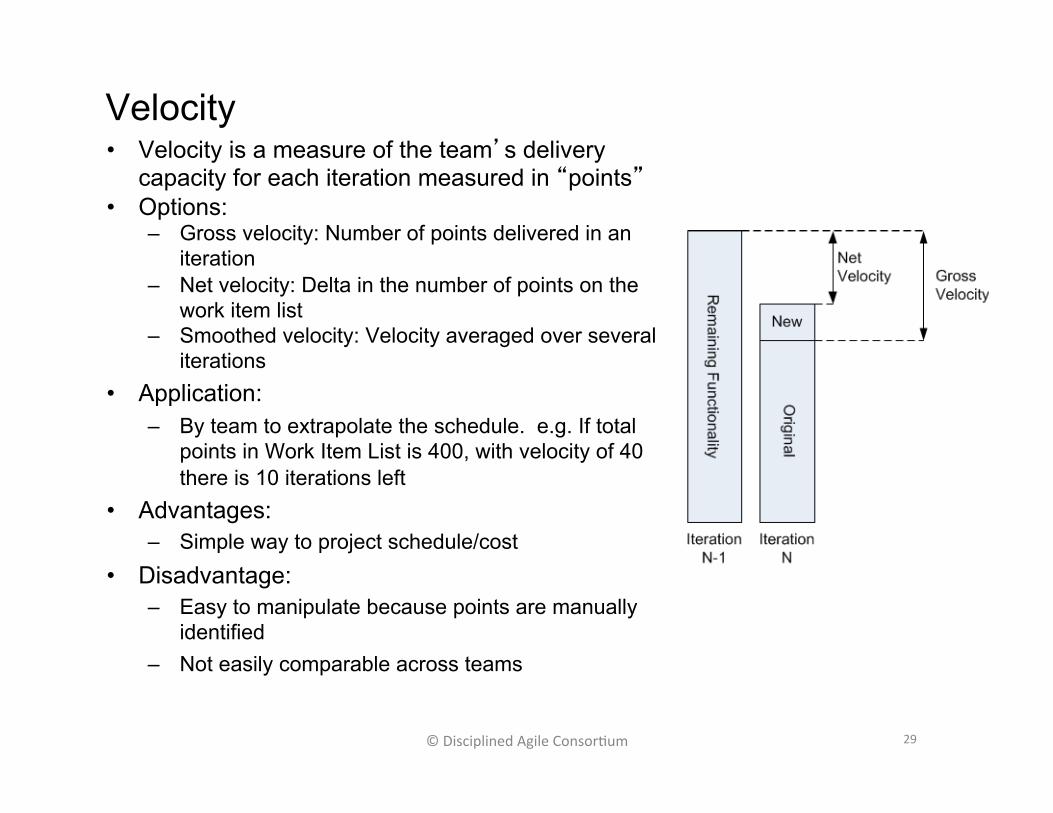
Velocity • Velocity is a measure of the team’s delivery
capacity for each iteration measured in “points” • Options:
– Gross velocity: Number of points delivered in an iteration
– Net velocity: Delta in the number of points on the work item list
– Smoothed velocity: Velocity averaged over several iterations
• Application: – By team to extrapolate the schedule. e.g. If total
points in Work Item List is 400, with velocity of 40 there is 10 iterations left
• Advantages: – Simple way to project schedule/cost
• Disadvantage: – Easy to manipulate because points are manually
identified – Not easily comparable across teams
©DisciplinedAgileConsor1um 29

Release Burndown Chart
© Disciplined Agile Consortium 30

Release Burnup Chart
© Disciplined Agile Consortium 31
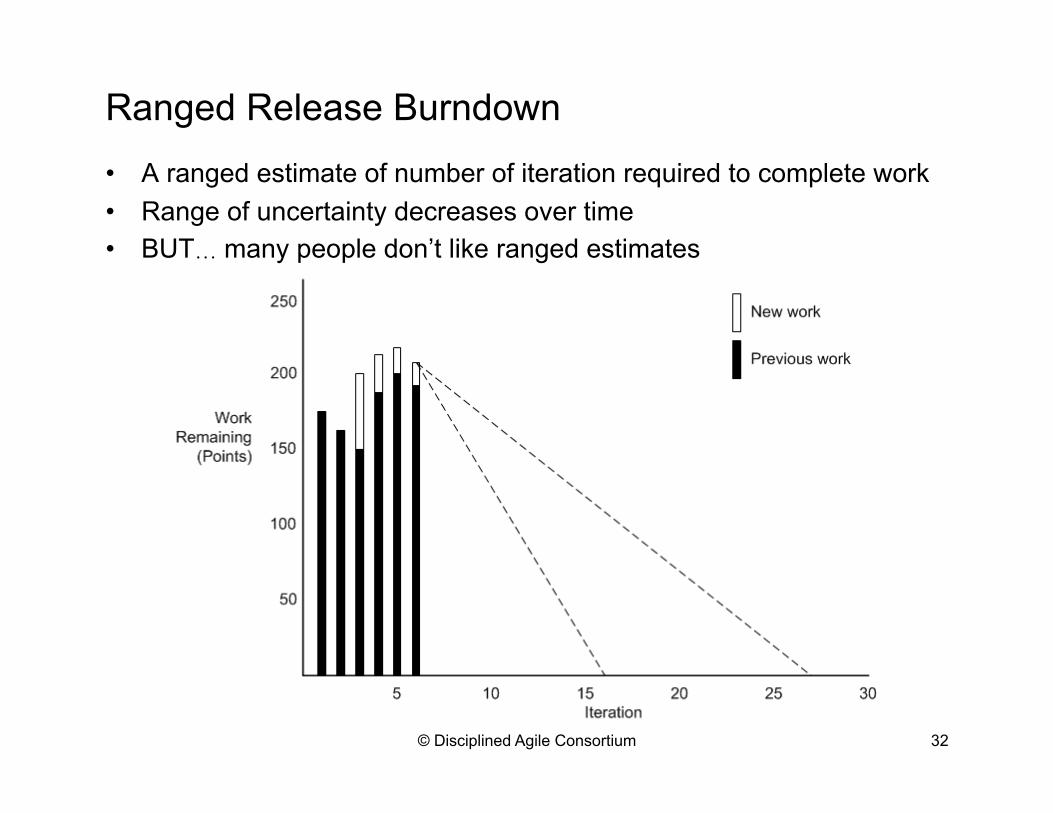
Ranged Release Burndown
• A ranged estimate of number of iteration required to complete work • Range of uncertainty decreases over time • BUT… many people don’t like ranged estimates
© Disciplined Agile Consortium 32
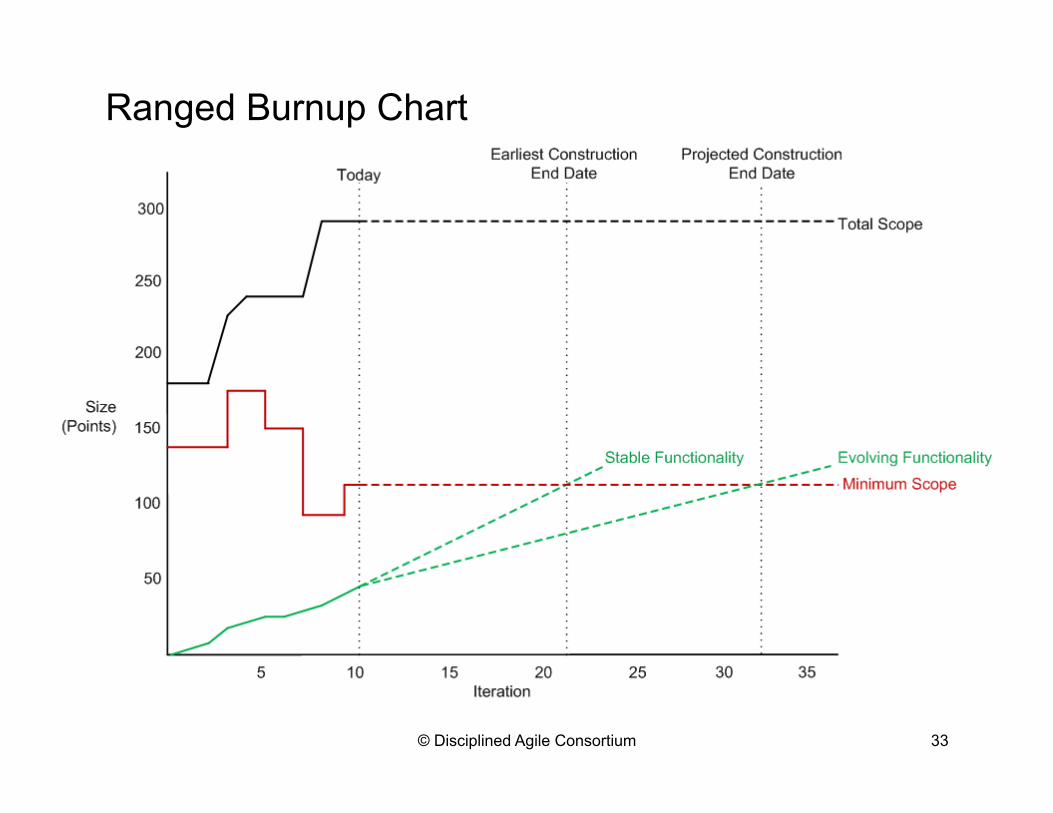
Ranged Burnup Chart
© Disciplined Agile Consortium 33

Acceleration
• The change in velocity over time • Application:
– Use to calculate productivity improvement (acceleration * number of people on team * charge rate)
• Advantages: – Comparable across teams – Easy to calculate
• Disadvantages: – Easy to manipulate because points are manually identified
© Disciplined Agile Consortium 34
0
5
10
15
20
25
30
Velo
city
Iterations

Value Delivered – Value points
• Assign “value points” to a story that captures the estimated financial value of the delivered functionality.
• Application: – Estimate the value delivered by a team
• Advantage: – Provides insight into the value being produced by a
team • Disadvantage:
– Easy to game as it’s a manual estimation – Doesn’t take cost of delay into account (without re-
estimating)
© Disciplined Agile Consortium 35

Code Quality Metrics
• A category covering a very wide range of metrics that provide insight into how well source code has been written.
• Options – Halstead, Cyclomatic complexity, Defect density, Coupling, and many
more • Applications:
– Determine the existing quality of code – Pinpoint potential code quality problems
• Advantages: – Easy to automate – Many commercial and open source tools
• Disadvantage: – Easy to get overwhelmed by the data
© Disciplined Agile Consortium 36

Defect Trends
• Track when and where defects are found against when they are addressed
• Options: – By severity – By source
• Application: – Monitor defects/bugs that escape the
delivery team • Advantage:
– Motivates teams to fix defects – Can provide insight into where you
need to improve your quality strategy • Disadvantage:
– Very easy to game because defects are often identified manually
© Disciplined Agile Consortium 37

Test/Code Coverage
• Calculated as the number of lines invoked by tests divided by the total number of lines of relevant code
• Application: – Determine how much of your code base has automated tests
• Advantages: – Easy to automate – Low test coverage tells you that you need to automate more of
your tests • Disadvantage:
– High test coverage may not tell you much because this metric is easy to game with low-quality tests
© Disciplined Agile Consortium 38

Build Status
• Monitor the status of the build • Options:
– Trend – Current status
• Advantage: – Trend report useful to teams new to
continuous integration (CI) – Very useful indicator if build broken
for long time • Disadvantage:
– Once you have implemented CI effectively the trend metric loses value
© Disciplined Agile Consortium 39

Net Promoter Score (NPS)
• Net Promoter Score (NPS) measures the loyalty that exists between a provider and a consumer
• Application: – Gauge the loyalty of your customers
• Advantage: – Indicates potential for revenue growth
• Disadvantage: – Manually generated and easy to “fix” with enticements
© Disciplined Agile Consortium 40

Resource Utilization
• Measure of the percentage of time that people spend working. Typically calculated as number of hours worked divided by number of hours they should have worked
• Application: – Matrix organizations where some (or most)
people aren’t “self starters” who need to be assigned to work
• Advantages: – Identify people available for work
• Disadvantages: – Motivates you to build teams out of whom you
have available instead of whom would be a good fit
– Increases stress and motivates people to fill in their time instead of to add value
– Often results in little or no slack time © Disciplined Agile Consortium 41

Skill Level • People are rated against desired
skills on a scale of 1 to N • Application:
– Identify skills gaps – Justify training or coaching efforts
• Options: – Individual or Team – Self or external assessment
• Advantages: – Focuses training/coaching efforts
• Disadvantages: – Easy to game, particularly with self-
assessment
© Disciplined Agile Consortium 42

Disciplined Agile Certifications
• Measure adoption rate of the DA certifications across your organization
• Application: – Indicates skill and experience level of team
members • Advantage:
– Measured from outside so difficult to game – When combined with other metrics can provide
an accurate estimate of the value of your investment in training and coaching
– Focuses training and coaching efforts • Disadvantage:
– Need to invest in the training and coaching of your staff over a long term basis
© Disciplined Agile Consortium 43
• Knowledge
• Knowledge + 2+ years experience
• Knowledge + 5+ years experience + Give back

Lead and Cycle Time
• Measure the length of time to develop a feature from concept to cash
• Application: – Identify places where you need to improve your process – Indication of time productivity: (Cycle Time-Internal Wait Time Within
Cycle)/Lead Time • Advantages:
– Measures time-to-market, a critical business success factor – Looks at overall process, not just development
• Disadvantage: – Can lead to finger pointing
© Disciplined Agile Consortium 44

Cost of Delay
• A measure of the impact of time on the business outcomes we hope to achieve
• Application: – Input into work (feature or project) prioritization
• Advantages: – Surfaces important financial considerations
• Disadvantages: – Easy to game as you need to guesstimate the value curve(s) – Requires understanding of basic financial concepts
© Disciplined Agile Consortium 45

Cumulative Flow Diagram
• Visualize the work effort of a team over time • Advantages:
– Indicates potential bottlenecks in your process (bumps on the diagram) – Simple report commonly generated by agile management tools such as
JIRA, Rally, or VersionOne • Disadvantage:
– Easy to “fix” because it shows points of work, which are manually guesstimated
© Disciplined Agile Consortium 46
0 10 20 30 40 50 60 70 80 90
May '16
June '16
July '16
Aug '16
Sept '16
Oct '16
Backlog
In Progress
Done

Supporting IT Governance
© Disciplined Agile Consortium 47
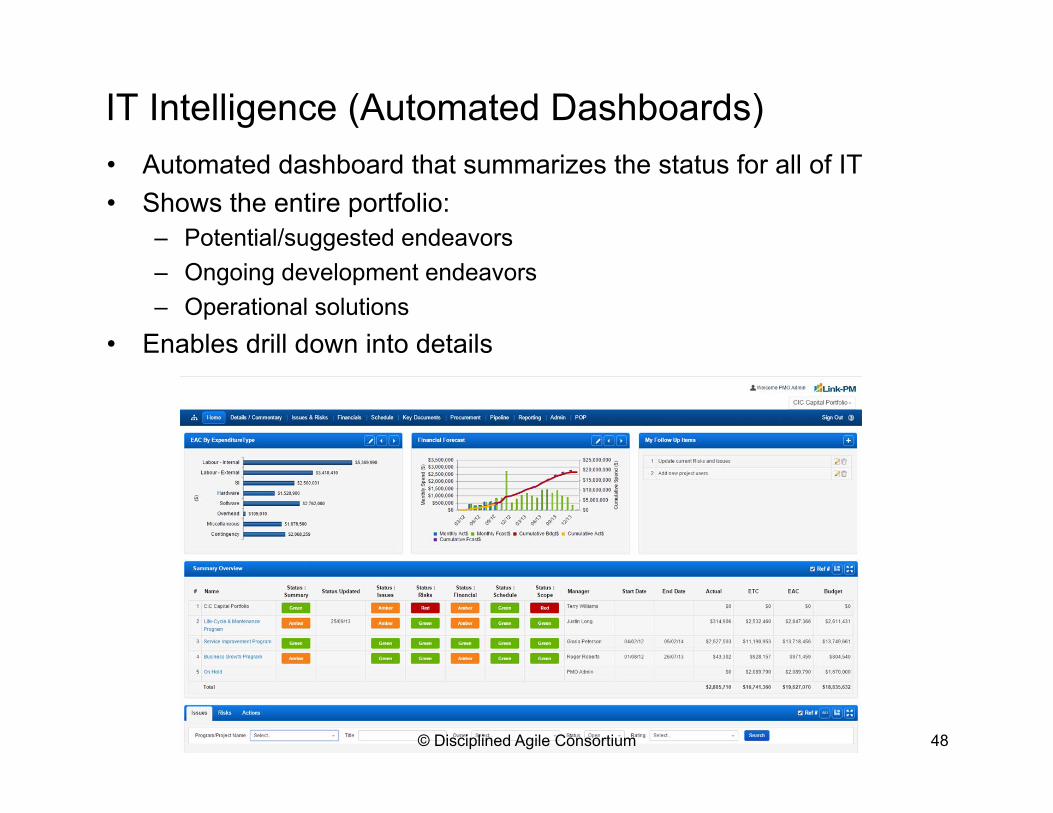
IT Intelligence (Automated Dashboards) • Automated dashboard that summarizes the status for all of IT • Shows the entire portfolio:
– Potential/suggested endeavors – Ongoing development endeavors – Operational solutions
• Enables drill down into details
© Disciplined Agile Consortium 48

Rolling Up Metrics
© Disciplined Agile Consortium 49
Portfolio
Team
• Measure against organizational goals • Overall indicator or category indicators • Organizational goals evolve slowly (~annually)
Program • Measure against program goals • Category indicators per sub-team • Program goals evolve quarterly (or thereabouts)
• Measure against team goals • Specific metrics per team • Metrics evolve regularly as the situation evolves • Unique dashboard per team
*
0..1
*
1 1
0..*

© Disciplined Agile Consortium 50

Metrics Principles • There is no easy answer • Every metric has strengths and weaknesses • Compete against yourself • Measure to improve • You get what you measure • Measure outcomes at the team level • Each team needs a unique set of metrics • Team use metrics to self organize • Trust but verify • Adopt common metrics categories across teams • Don’t manage to the metrics • Automate wherever possible • Prefer trends over scalars • Prefer leading over trailing metrics • Prefer pull over push
© Disciplined Agile Consortium 51

Goal
Question
Metric
© Disciplined Agile Consortium 52

Some Potential Metrics
• Iteration burndown • Velocity and Acceleration • Release burndown/up • Points/Value delivered • Code quality • Defect trends (by severity, by source) • Test coverage • Build status • Net promoter score (NPS) • Resource utilization • Team skill level • DA certifications • Lead and cycle time • Cost of delay • Cumulative flow diagram
© Disciplined Agile Consortium 53

Important Resources
© Disciplined Agile Consortium 54
Disciplined Agile IT Governance Webinar: February 2017 Chapter 20: Governing
Disciplined Agile Teams
DisciplinedAgileDelivery.com

© Disciplined Agile Consortium 55

Got Discipline? DisciplinedAgileConsortium.org
DisciplinedAgileDelivery.com ScottAmbler.com
© Disciplined Agile Consortium 56

Shuhari and Disciplined Agile Certification
At the shu stage you are beginning to learn the techniques and philosophies of
disciplined agile development. Your goal is to build a strong foundation from
which to build upon.
At the ha stage you reflect upon and question why disciplined agile strategies work, seeking to understand the range
of strategies available to you and when they are best applied.
At the ri stage you seek to extend and
improve upon disciplined agile techniques, sharing your learnings with
others.
© Disciplined Agile Consortium 57

Scott Ambler + Associates is the thought leader behind the Disciplined Agile Delivery (DAD) framework and its application. We are an IT
management consulting firm that advises organizations to be more effective applying disciplined agile and lean processes within the
context of your business.
Our website is ScottAmbler.com We can help
© Disciplined Agile Consortium 58