measuring the costs and benefits of community...
TRANSCRIPT

Paper No. 102 / January 2007
Measuring the Costs and Benefits of Community Driven Development: The KALAHI-CIDSS Project, Philippines Eduardo Araral Camilla Holmemo
Summary Findings
The main focus of this analysis is the economic impacts of the KALAHI-CIDSS project. It looks at the costs and benefits of seven major subproject (SP) categories that cover 1,175 completed and ongoing subprojects (e.g., domestic water supply [both pump and gravity], roads construction and improvement, elementary school buildings, barangay health centers, and day care centers). These seven major categories accounted for 82 percent of total subproject costs. The main findings from the analysis are:
1. The Project overall is economically beneficial. Based on available information and plausible assumptions, the Project overall will generate a conservatively estimated economic internal rate of return of 21 percent and a net present value of Philippine peso (PHP) 1.03 billion. It is therefore considered economically beneficial. The rates of return for the subprojects ranged from 16 percent for day care centers to 65 percent for water supply projects. These results are conservative, considering that other benefits and subprojects were not examined, including benefits from investments to strengthen community participation and local governance.
2. The Project overall is sensitive to a 20 percent increase in costs and 20 percent benefit reduction, with some subprojects more sensitive than others. For the major subproject categories, we show that rates of return for road improvement and school building subprojects are highly sensitive to a 20 percent increase in costs; they are moderately sensitive for health and day care centers, and are not as sensitive for water supply (gravity and pump) and new road construction.
3. Investments to strengthen community participation and local governance will likely have a positive impact on operations and maintenance (O&M) performance. Correlation analysis shows that ex ante levels of community participation and local governance are positively correlated with better O&M. These findings indicate that investments to strengthen community participation and local governance will likely generate economic benefits by ensuring better O&M, thus increasing the likelihood that the stream of benefits from the subprojects will be realized.
4. O&M is satisfactory in most regions. The 2006 Subproject (SP) Survey indicated that requirements for O&M are generally in place for most subprojects, but that financing sources and the assignment of roles remain unclear for some. Requirements for O&M—written plans, functioning O&M organizations, clear assignment of responsibilities, clear sources of financing—generally appear to be in place for subprojects with characteristics of a toll good (e.g., water supply [pump], day care centers, school buildings, and health centers). The O&M picture is somewhat different for public goods. For example, only 57 percent of surveyed road projects had an O&M association. This could be because of the public goods characteristics of the roads or simply because of confusion over the role of the barangay government and users on the matter of O&M. O&M financing is also less clear for gravity-driven water supply and road SPs. For gravity-driven water supply, only 72 percent have clear sources of financing. This may be because gravity water supply is more likely to be perceived as a free good (i.e., the supply of water is not a constraint), thus the incentive to contribute to O&M is lower than for pump-driven projects, which will not operate if users do not pay operating costs.
5. The subproject selection process appears to be responsive to community demands. There is a very high correlation between the preferences of households, as indicated in the 2003 baseline data, and the actual portfolio of subprojects. For instance, the 2003 baseline data showed that bad road conditions and poor water supply were the two most common problems in the eight treatment municipalities surveyed. This is highly consistent with the actual distribution of subprojects, of which roads and water supply are the two most common, accounting for 69 percent of the total number.
6. Fiscal Impact. It is unlikely that the Project will cause a crowding out of investments, given its size, financing arrangements, and the nature of the Project itself. Counterpart contributions from local governments (provincial, municipal, and barangay), communities, and private sources constituted 35 percent of total project costs in Phases 1 through 3a. Community counterpart contributions—mostly in kind—accounted for 9.5 percent of total project costs and were unlikely to have materialized without the Project. Hence, they represent a crowding in of new resources.
7. The Project appears to be cost effective compared with traditionally implemented infrastructure projects in the Philippines. The unit cost of infrastructure in the Project is generally lower than those of other government agencies, with cost differences ranging from 8 percent for school buildings to 76 percent for water supply subprojects. This is mainly because the Project is able to save on the contractor’s profit, which accounts for about 15–25 percent of cost, the 10 percent value added tax, and costs for road right of way. This finding is consistent with those of other community-driven type projects evaluated by the Bank’s Operation Evaluation Department.

Eduardo Araral, Jr. is Assistant Professor at the Lee Kuan Yew School of Public Policy, National University of Singapore (Email: [email protected])
Camilla Holmemo is currently a Social Development Specialist/Young Professional, Asian Development Bank, Manila, Philippines (Email: [email protected])
SOCIAL DEVELOPMENT PAPERS Community Driven Development
Paper No. 102/ January 2007
Measuring the Costs and Benefits of Community Driven Development: The KALAHI-CIDSS Project, Philippines
Eduardo Araral Camilla Holmemo
The Social Development Department Working Papers Series disseminates the findings of work in progress to encourage discussion and exchange of ideas on social development issues. Papers in this series are not formal publications of the World Bank. The papers carry the names of the authors and should be cited accordingly. The series is edited by the Social Development Department of the Sustainable Development Network of the World Bank.
This paper has not undergone the review accorded to official World Bank publications. The findings, interpretations and conclusions herein are those of the author(s) and do not necessarily reflect the views of the International Bank for Reconstruction and Development/ World Bank and its affiliated organizations, or its Executive Directors, or the governments they represent.
To request copies of the paper or for more information on the series, please contact the Social Development Department at the e-mail below. Papers are also available on the department’s website:
Web: http://www.worldbank.org/social development (see “Publications” in the navigation menu)
E-mail: [email protected]
Social Development Department The World Bank 1818 H Street, NW Washington, DC 20433 Fax: 202-522-3247
Printed on Recycled Paper
i
Table of Contents ACKNOWLEDGMENTS iii ACRONYMS AND EXCHANGE RATE iv EXECUTIVE SUMMARY v INTRODUCTION 1
Purpose and Scope of Analysis 1 Data and Methodology 1
PROJECT COSTS 2 Subprojects Considered in Analysis 2 Overall Project Cost 2 Subproject Cost 3 Operation and Maintenance (O&M) Costs 4 Environmental Costs 4 Economic Costs 4
PROJECT BENEFITS 6 ANALYSIS OF MODEL SUBPROJECTS 7
General Assumptions 7 Water Supply Level II (Pump and Gravity) 8 Road Construction and Improvement 10 School Buildings 13 Health Centers 16 Day Care Centers 17 Demand Responsiveness 19 Summary 21
SENSITIVITY ANALYSIS 23 OPERATION AND MAINTENANCE 24 FISCAL ANALYSIS 27 COST EFFECTIVENESS 28
Infrastructure Subprojects 28 Indirect Costs 29
CONCLUSIONS AND RECOMMENDATIONS 30 ANNEXES 33 REFERENCES 62
ii
Tables Table 1. Distribution of Major Subprojects, as of December 2005 2 Table 2. Direct and Indirect Financial Costs, Overall Project (2003–2005) 3 Table 3. Infrastructure Subproject Financial Cost Composition 3 Table 4. O&M Costs 4 Table 5. Economic Costs Conversion Factors 5 Table 6. Economic Unit Cost of Generic Subprojects 5 Table 7. Summary of Monetized Benefits from Subprojects 6 Table 8. Economic Analysis for Water Supply System II – Pump Driven 9 Table 9. Economic Analysis for Water Supply System II – Gravity Driven 9 Table 10. Economic Analysis of Road Construction 12 Table 11. Economic Analysis of Road Improvement: 13 Table 12. Economic Analysis for Elementary School Buildings 15 Table 13. Economic Analysis for Barangay Health Centers 17 Table 14. Economic Analysis of Day Care Centers 19 Table 15. Criteria to Evaluate Responsiveness by MLGUs 20 Table 16. Summary of MLGU Responsiveness Analysis 20 Table 17. Summary of Economic Analysis for Subprojects and Overall Project 21 Table 18. Number of Project Beneficiaries, Households, and Individuals, 2003–2005 22 Table 19. Sensitivity Analysis 23 Table 20. Overall O&M Performance by Region, November 2005 24 Table 21. Summary of Responses to 2006 Survey Questions on O&M (in percents) 24 Table 22. Comparison between ex ante (2003) indicators of participation and local governance with actual O&M rating (2005) 26 Table 23. Pearson Correlation between O&M rating, community participation, and local governance 26 Table 24. Average Direct Unit Cost Estimates for SPs (monetary values in PHP) 28 Table 25. Cost Comparison: KALAHI and Traditional Infrastructure Projects 28

iii
Acknowledgments
This paper and analysis were prepared with the support and supervision of Rob Chase and Andrew Parker (Task Team Leader, KALAHI-CIDSS) and financed with resources from the Trust Fund for Environmentally and Socially Sustainable Development. The authors are grateful to Dan Biller and Julien Labonne, the peer reviewers of this work. In addition, valuable comments and support were received from the KALAHI-CIDSS task team, including Malu Padua, Rodolfo Lacal, Joe Grageda, Omar Costibollo, Dodjie Aumentado, Yukiko Ito, and Cliff Burkley, as well as from Em Torrente and Ramon Falcon of the National Economic Development Authority of the Philippines. The authors are especially grateful for the support and data provided by staff from the Department of Social Welfare and Development of the Philippines, particularly Camilo Gudmalin, Sareth Tingson, Ayn Regalado, and Lalaine Encarnacion. They also thank the Regional Management Offices and Area Coordination Teams in the field for implementing the sub-project survey. The authors are responsible for any reminaing errors.

iv
Acronyms and Exchange Rate ADB Asian Development Bank AIID Amsterdam Institute for International Development ACT Area Coordination Team ARDCP Agrarian Reform Communities Development Project BABAE Team Barangay-based Advocacy and Education Team BLGF Bureau of Local Government Finance, Philippines BHS Barangay Health Station DENR Department of Environment and Natural Resources, Philippines DPWH Department of Public Works and Highways, Philippines DSWD Department of Social Welfare and Development, Philippines ECD early childhood development IRA internal revenue allotment KALAHI- CIDSS Kapitbisig Laban sa Kahirapan (Linking Arms Against Poverty) –
Comprehensive and Integrated Delivery of Social Services KDP -1 Kecamatan Development Project 1, Indonesia LCC local counterpart contribution LGU local government unit LIUCP Low-income Upland Communities Project M&E monitoring and evaluation MLGU municipal local government unit MTR Mid-Term Review PACAP Philippines-Australia Community Assistance Program PAD project appraisal document PHP Philippine peso NEDA National Economic Development Authority, Philippines NPMO National Project Management Organization, Philippines OED Operations Evaluation Department, World Bank O&M operations and maintenance SP subproject VAT value added tax
Exchange Rate (January 2006)
1 USD = 55 PHP

v
Executive Summary
PURPOSE AND SCOPE OF ANALYSIS
The purpose of this report is to update and refine the economic analysis of the KALAHI–CIDSS Project (the Project) as an input to the Project’s 2006 Midterm Review. This work builds upon previous analyses done during project preparation in 2002 and preparatory update work done in early 2005. It also takes into account lessons from project implementation to date, as well as insights from similar projects, such as the Kecamatan Development Project (KDP) in Indonesia, comparable projects in the Philippines, and similar studies by the Operations Evaluation Department (OED) of the World Bank.
The project development objective of KALAHI-CIDSS is to strengthen the participation of local communities in barangay1 governance and develop their capacity to design, implement, and manage development activities that reduce poverty. Ideally, therefore, economic analysis should focus on the valuation of benefits of these development investments. While it is too early in the project cycle to make this kind of assessment, it is possible to make preliminary inferences (using 2003 baseline survey data) of how these investments might be associated with expected benefits, such as a closer match between demand and supply and the better operation and maintenance of projects.
The main focus of this analysis is, however, the economic impacts of the Project. It looks at the costs and benefits of seven major subproject (SP) categories that cover 1,175 completed and ongoing subprojects (e.g., domestic water supply [both pump and gravity], roads construction and improvement, elementary school buildings, barangay health centers, and day care centers). These seven major categories accounted for 82 percent of total subproject costs.
DATA AND METHODOLOGY
The following data sources were used for this analysis: (1) a 2006 survey of SP benefits, implemented specifically for the Mid-Term Review (MTR); (2) the NPMO subproject database, as of December 2005, which consists of financial and physical reports; (3) the 2005 Project Economic Analyses Update (World Bank 2005c, unpublished); (4) data from various agencies of the Government of the Philippines, and (5) the 2003 Project Baseline Survey. For economic analyses of the project as a whole, and for each of the major subproject categories, the general methodology and parameters used in this report follow the World Bank’s Handbook on Economic Analysis of Investment Operations (1998a) and the Philippines National Economic Development Authority (NEDA) ICC Guidelines on Project Evaluation (2001).
MAIN FINDINGS
1. The Project overall is economically beneficial and all major subproject categories met the prescribed hurdle rate. Based on available information and plausible assumptions, the Project overall will generate a conservatively estimated economic internal rate of return of 21 percent and a net present value of PHP1.03 billion. It is therefore considered economically beneficial. Each subproject
1 A barangay is the smallest governmental administrative unit in the Philippines.

vi
category analyzed also met the 15 percent hurdle rate set by NEDA. The rates of return for these subprojects ranged from 16 percent for day care centers to 65 percent for water supply projects. These results are conservative, considering that other benefits and subprojects were not examined, including benefits from investments to strengthen community participation and local governance.
2. The Project overall is sensitive to a 20 percent cost escalation and 20 percent benefit reduction, with some subprojects more sensitive than others. The Project’s rates of return are sensitive to escalations in costs and reductions in benefits. For the major subproject categories, sensitivity analysis shows that road improvement and school building subprojects are highly sensitive to a 20 percent increase in costs, health and day care centers are moderately sensitive, while water supply (gravity and pump) and new road construction are not as sensitive.
3. Investments to strengthen community participation and local governance will likely have a positive impact on operations and maintenance (O&M) performance. Correlation analysis shows that ex ante levels of community participation and local governance are positively correlated with better O&M. For example, memberships in local organizations and bayanihan2 are strongly and positively correlated with O&M ratings, having a Pearson correlation coefficient of 0.87. Participation in barangay assemblies is also positively correlated with O&M, while greater reliance on the Barangay Captain for decision making is negatively correlated with O&M. These findings indicate that investments to strengthen community participation and local governance will likely generate economic benefits by ensuring better O&M, thus increasing the likelihood that the stream of benefits from the subprojects will be realized.
4. O&M is satisfactory in most regions, although three regions face challenges. A 2005 Philippines National Project Management Office (NPMO) study of 140 completed subprojects showed that in nine out of 12 regions, O&M performance was mostly fair to satisfactory. Performance was evaluated in terms of the viability of O&M associations and plans, as well as the scope and frequency of O&M monitoring by field offices. Three regions—particularly the mountainous region of the Cordillera—are facing some challenges. These findings were confirmed in the 2006 Subproject (SP) Survey, which indicated that requirements for O&M are generally in place for most subprojects, but that financing sources and the assignment of roles remain unclear for some. Requirements for O&M—written plans, functioning O&M organizations, clear assignment of responsibilities, clear sources of financing—generally appear to be in place for subprojects with characteristics of a toll good (e.g., water supply [pump], day care centers, school buildings, and health centers).
The O&M picture is somewhat different for public goods. For example, only 57 percent of surveyed road projects had an O&M association. This could be because of the public goods characteristics of the roads or simply because of confusion over the role of the barangay government and users on the matter of O&M. The Cordillera region had the most number of
2 Bayanihan refers to a communal effort to achieve a particular objective, Wikipedia, http://en.wikipedia.org/wiki/Bayanihan (accessed February 7, 2006).

vii
road projects with unsatisfactory O&M performance due to mountainous terrain and inaccessibility of SP sites, which rendered monitoring more difficult. O&M financing is also less clear for gravity-driven water supply and road SPs. For gravity-driven water supply, only 72 percent have clear sources of financing. This may be because gravity water supply is more likely to be perceived as a free good (i.e., the supply of water is not a constraint), thus the incentive to contribute to O&M is lower than for pump-driven projects, which will not operate if users do not pay operating costs.
5. The subproject selection process appears to be responsive to community demands. There is a very high correlation between the preferences of households, as indicated in the 2003 baseline data, and the actual portfolio of subprojects. For instance, the 2003 baseline data showed that bad road conditions and poor water supply were the two most common problems in the eight treatment municipalities surveyed. This is highly consistent with the actual distribution of subprojects, of which roads and water supply are the two most common, accounting for 69 percent of the total number. This finding supports the hypothesis that the Project’s investments to strengthen community participation through social mobilization can lead to a more efficient allocation of resources through a better fit between demand and supply. It is also an indication that elite capture is not a significant problem in most project areas.
In addition, municipal and barangay local governments are generally responding well to demands for local counterpart funding. Provincial governments are doing less well and remain a large potential source for supporting the Project. Some 84 percent of municipal governments allotted at least 50 percent of their development fund as counterpart funding for the Project during the first cycle (Phases 1–3a). This was not the case for the second cycle when contributions by municipal governments declined on average in Phases 1 and 2 by 41 percent and 8 percent, respectively. However, the funding provided by these government bodies remained substantial as a proportion of their social welfare budget and/or development funds. This reduction over time was possibly due to uncertainties over the release of the internal revenue allocation to local governments in 2004–2006 resulting from the fiscal crisis facing the national government. However, it could also reflect an incentive problem for local governments: once they have secured the Project through a high level of commitment in the first cycle, they may no longer have the same incentive in the following cycles.
6. Fiscal Impact It is unlikely that the Project will cause a crowding out of investments, given its size, financing arrangements, and the nature of the Project itself. Counterpart contributions from local governments (provincial, municipal, and barangay), communities, and private sources constituted 35 percent of total project costs in Phases 1 through 3a. Community counterpart contributions—mostly in kind—accounted for 9.5 percent of total project costs and were unlikely to have materialized without the Project. Hence, they represent a crowding in of new resources. On the other hand, counterpart contributions from local governments and NGO donors (24.5 percent of total project cost) were likely diverted from other uses and hence do not represent crowding in.
7. The Project appears to be cost effective compared with traditionally implemented infrastructure projects in the Philippines The unit cost of infrastructure in the Project is generally lower than those of other government agencies, with cost differences ranging from 8 percent for school buildings to 76 percent for water supply subprojects. This is mainly because the Project is able to save on the contractor’s profit, which accounts for about 15–25 percent of cost, the 10 percent value added tax, and
viii
costs for road right of way. This finding is consistent with those of other community-driven type projects evaluated by the Bank’s Operation Evaluation Department (World Bank 2005b).
While the unit costs for infrastructure subprojects can be reasonably compared, this is not the case when comparing the cost structure of community-driven development projects more generally. While similar in many ways, these projects vary greatly in terms of project objectives and implementation arrangements. In addition, concerns about the costs of social preparation and capacity building can be misplaced, especially since these investments, as shown in the preceding analysis, can generate quantifiable benefits (e.g., more efficient allocation of resources through a better fit between the demand for and supply of local public goods, better O&M, and more equitable access to local services).
RECOMMENDATIONS
Three major recommendations follow from the preceding analysis:
1. Monitor cost levels. The economic viability of the Project is highly sensitive to a 20 percent cost escalation. There is therefore a need to closely monitor cost levels for individual subprojects and indirect costs. The current proportion of SP grants and indirect costs—57 percent and 43 percent, respectively—is already high. Project management costs, if not closely monitored, could escalate to levels that would render the Project economically unbeneficial. It is recommended that:
• The Project closely monitor and consider issuing guidelines on the proportion of SP grants and indirect costs;
• The Project secure upfront the commitment for counterpart funds from municipal local government units (LGUs) for both Cycles 1 and 2, if possible; the current trend is for municipal LGUs to give high levels of counterpart commitments in Cycle 1, which then considerably decline in Cycle 2 (by as much as 41 percent in Phase 1 and 8 percent in Phase 2); and
• The Project consider involving provincial governments more closely in the project; this could include asking for multi-year investment resource commitments and O&M counterpart funding for projects. At present, only a handful of provincial LGUs provide counterpart funds to the Project.
2. Continue to closely monitor O&M. The overall economic viability of the Project is also highly sensitive to a 20 percent decrease in benefits. It is therefore crucial that O&M be closely monitored. The Project has already devised a monitoring and evaluation system for O&M performance that is useful for comparing performance across regions. The project may also consider assigning weights to its evaluation criteria to distinguish between actual O&M practices by communities and O&M monitoring inputs, such as compliance with reporting requirements. It is also recommended that the Project consider giving more weight to other substantive criteria, including:
financing for O&M, including developing the financial management capacity of O&M associations for simple bookkeeping;
basic training on technical issues for O&M, particularly for operation-intensive SPs, such as water supply (sharing of O&M experiences among barangay would also be useful);

ix
clear assignment of responsibilities through Memorandum of Agreements between O&M associations and barangay local governments and other concerned government agencies;
securing O&M counterpart contributions from local governments; it appears that counterpart contributions from provincial, municipal, and Barangay governments are necessary for the O&M of road projects because of their public-goods characteristic and lumpy investment requirement (the O&M challenge is particularly critical in the Cordillera Region);
packaging O&M counterpart funding from municipal and provincial local governments as a matching grant for Barangay road projects, with a maintenance-of-effort requirement (i.e., the matching grant would be released contingent on satisfactory O&M levels by the Barangay)
3. Continue to improve data quality. The project has made considerable efforts to improve data quality in terms of reconciling local counterpart contributions, updating the SP database, conducting O&M monitoring, and undertaking community-based evaluations. Considering the experience of the 2006 SP Benefit Survey, further refinements are recommended in terms of metric consistency and data completeness. It is also recommended that field staff be trained in these areas. The Project may also consider hiring a third party to independently collect and analyze data on project benefits to strengthen the validity of its evaluation. Finally, the Project may also wish to consider using the 2006 SP benefit survey questionnaires as part of its regular data collection format for use in subsequent economic analyses.
1
Introduction
PURPOSE AND SCOPE OF ANALYSIS
The purpose of this report is to update and refine the economic analysis of the KALAHI–CIDSS Project (the Project) as an input to the Project’s 2006 Midterm Review. It builds on previous economic analyses undertaken during project preparation in 2002 and a recent update in early 2005. It also takes into account lessons from project implementation to date, as well as insights from similar projects such as the Kecamatan Development Project (KDP) in Indonesia, comparable projects in the Philippines, and similar studies by the Operations Evaluation Department (OED) of the World Bank.
The KALAHI-CIDSS aims to strengthen community participation in local (barangay) governance and develop local capacity to design, implement, and manage development activities through the provision of community grants, implementation support (to strengthen formal and informal local institutions), and monitoring and evaluation (see Annex 1 for more details). Therefore, economic analysis should ideally include the valuation of benefits of the Project’s investments to improve local governance and empowerment. However, it is too early in the project cycle to make this kind of assessment. This report is therefore limited to making preliminary inferences (using the 2003 baseline survey data) of how investments in local governance and empowerment through the KALAHI-CIDSS Social Mobilization Process are associated with expected benefits, such as a closer match between needs and projects implemented, as well as improved O&M of community infrastructure.
The main focus of this economic analysis is, however, the economic impacts of the Project. The analysis looks at the costs and benefits of seven major categories of completed and ongoing subprojects (e.g., domestic water supply [pump and gravity], roads construction and improvement, elementary school building, barangay health centers, and day care centers), which account for 82 percent of total SP costs and 1,175 total subprojects.
DATA AND METHODOLOGY
The following data sources were used in this report: (1) a 2006 survey of SP benefits; (2) the NPMO subproject database, consisting of financial and physical reports as of December 2005; (3) the 2005 Project Economic Analyses Update (World Bank 2005c, unpublished); (4) data from various agencies of the Government of the Philippines, and (5) the 2003 Project Baseline Survey.3 For the economic analyses of the Project as a whole, and for each of the major subprojects, the general methodology and parameters used in this report follow the World Bank’s Handbook on Economic Analysis of Investment Operations (1998a) and the NEDA ICC Guidelines on Project Evaluation (2001). The general methodology, research parameters, and assumptions of the economic analysis are discussed in Annex 2.
3 For more details, see World Bank (2005b).
2
Project Costs
SUBPROJECTS CONSIDERED IN ANALYSIS
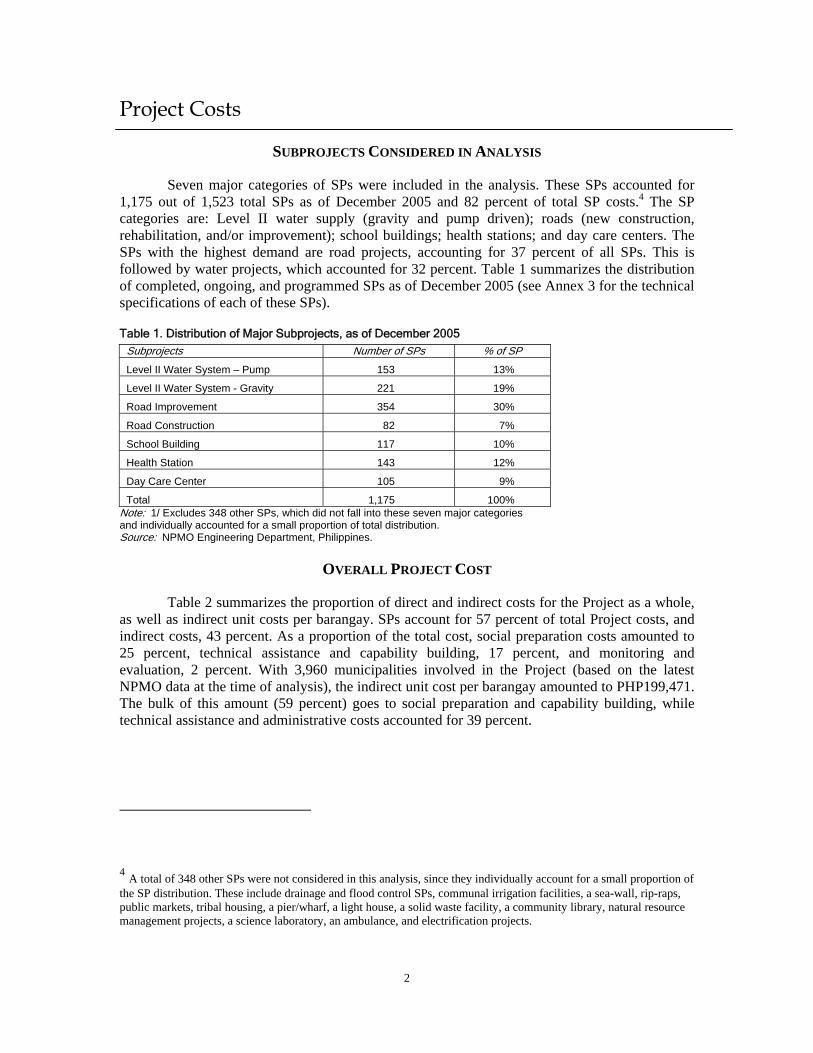
Seven major categories of SPs were included in the analysis. These SPs accounted for 1,175 out of 1,523 total SPs as of December 2005 and 82 percent of total SP costs.4 The SP categories are: Level II water supply (gravity and pump driven); roads (new construction, rehabilitation, and/or improvement); school buildings; health stations; and day care centers. The SPs with the highest demand are road projects, accounting for 37 percent of all SPs. This is followed by water projects, which accounted for 32 percent. Table 1 summarizes the distribution of completed, ongoing, and programmed SPs as of December 2005 (see Annex 3 for the technical specifications of each of these SPs).
Table 1. Distribution of Major Subprojects, as of December 2005
Subprojects Number of SPs % of SP
Level II Water System – Pump 153 13%
Level II Water System - Gravity 221 19%
Road Improvement 354 30%
Road Construction 82 7%
School Building 117 10%
Health Station 143 12%
Day Care Center 105 9%
Total 1,175 100% Note: 1/ Excludes 348 other SPs, which did not fall into these seven major categories and individually accounted for a small proportion of total distribution. Source: NPMO Engineering Department, Philippines.
OVERALL PROJECT COST
Table 2 summarizes the proportion of direct and indirect costs for the Project as a whole, as well as indirect unit costs per barangay. SPs account for 57 percent of total Project costs, and indirect costs, 43 percent. As a proportion of the total cost, social preparation costs amounted to 25 percent, technical assistance and capability building, 17 percent, and monitoring and evaluation, 2 percent. With 3,960 municipalities involved in the Project (based on the latest NPMO data at the time of analysis), the indirect unit cost per barangay amounted to PHP199,471. The bulk of this amount (59 percent) goes to social preparation and capability building, while technical assistance and administrative costs accounted for 39 percent.
4 A total of 348 other SPs were not considered in this analysis, since they individually account for a small proportion of the SP distribution. These include drainage and flood control SPs, communal irrigation facilities, a sea-wall, rip-raps, public markets, tribal housing, a pier/wharf, a light house, a solid waste facility, a community library, natural resource management projects, a science laboratory, an ambulance, and electrification projects.

3
Table 2. Direct and Indirect Financial Costs, Overall Project (2003–2005)
Percent of Total Cost Cost/ Barangay, PHP
(% of total)
No. of Municipalities 101 No. of Barangays 3,960 Total Project Cost 1,854,946,580 Total SP Grants 1,065,142,871 57% Indirect Cost - Social Preparation / Capacity Building 471,571,783
25% 119,099 (59%)
-TA / Admin Support 310,122,096 17% 78,324 (39%) -M&E 8,109,830 2% 2,048 (2%) Total Indirect Costs 789,803,709 43% 199,471 (100%)
Source: NPMO, Finance Department, Philippines, January 2006.
SUBPROJECT COST
Table 3 summarizes both the average financial unit cost for each infrastructure SP and its composition. The unit cost for buildings ranges from PHP301,540 for a day care center to PHP691, 745 for an elementary classroom with facilities. Cost of road projects vary from PHP1,505,347 for road improvement to PHP1,881,406 for new construction. Costs for water supply vary from PHP982,005 for Level II pump driven to PHP847,162 for Level II gravity driven. See Conclusions and Recommendations for a discussion of how these costs compare with projects implemented by other Philippine government agencies, such as the Department of Public Works and Highways and the Department of Education.
Table 3. Infrastructure Subproject Financial Cost Composition
Unit Cost (PHP) and Cost Items (%)
Level II Water
System - Pump
Level II Water
System - Gravity
Road Improvement
Road Construction
School Building
Barangay Health Station
Day Care Center
Financial Cost/SP (PHP) 982,005 847,162 1,505,347 1,881,406 691,745 372,477 301,540 Pre-Engineering 19,640 16,943 21,828 32,548 27,670 7,450 18,092 Materials 724,229 635,371 940,842 1,166,237 562,043 293,326 222,386 Equipment 49,100 21,179 597,623 560,424 8,647 0 0 Skilled Labor 78,560 50,830 95,891 79,583 48,422 40,973 33,169 Unskilled Labor 94,272 81,328 53,922 80,712 53,956 17,879 16,283 Land / Right of Way 39,280 33,886 0 196,043 0 26,073 21,108 Other 68,740 84,716 66,988 57,383 69,175 33,523 24,123 Economic Unit Cost (PHP) 1,073,822 924,254 1,777,093 2,172,930 769,913 419,223 335,162 Economic / Financial Cost 1.09 1.09 1.18 1.15 1.11 1.13 1.11
Notes: 1/ Includes direct costs, taxes, and local contributions. Excludes indirect costs (social preparation and project management). 2/ Contingency and supervision. Source: NPMO, Engineering Department, Philippines.

4
OPERATION AND MAINTENANCE (O&M) COSTS
O&M costs typically consist of the cost of labor, fuel, electricity, spare parts, and—in the case of school buildings, health centers, and day care centers—the costs of staff and supplies. O&M costs were estimated as a proportion of the capital cost of the SP. Based on NPMO estimates, which are also consistent with standard O&M levels for comparable projects in the Philippines, O&M costs range from 2.4 percent of the capital cost for a Level II gravity-driven water supply to a high of 44 percent for a school building (the latter figure includes costs for staff, utilities, and supplies). These costs were included in the economic analyses of model SPs and for the Project as a whole. Table 4 shows the annual O&M costs per subproject.
Table 4. O&M Costs
Type of Subproject Capital Cost per Subproject (PHP)1/
Annual O&M (PHP) Annual O&M in % of Capital Cost
Level II Water System - Pump 982,005 35,000.00 3.6%
Level II Water System - Gravity 847,162 20,000.00 2.4% Road Improvement 1,505,347 50,000.00 3.3% Road Construction 1,881,406 50,000.00 2.7% School Building 691,745 305,500.00 44.2% Barangay Health Station 372,477 101,280.00 27.2% Day Care Center 301,540 49,840.00 16.5%
Note: 1/ Includes direct costs, taxes, and local contributions. Excludes indirect costs (social preparation and project management). Source: NPMO, Engineering Department, Philippines.
ENVIRONMENTAL COSTS
There appears to be no major environmental costs under the Project that would materially affect an economic analysis. First, the SPs are small in scale and any impacts are highly localized. Second, the NPMO is not aware of cost overruns due to unanticipated environmental costs, thus it is safe to assume that the ex ante cost estimates are sufficiently accurate. Third, the annual environmental audits reported in Fock (2005, unpublished) have not detected any substantial problems with regard to the KALAHI-CIDSS environmental processes or their implementation. It can therefore be assumed that substantial additional environmental costs are unlikely.
ECONOMIC COSTS
Financial costs were converted to economic costs to account for price distortions, which tend to make the price levels of traded and non-traded goods higher or lower due to interventions in the markets. These distortions are reflected in a conversion factor that shows the ratio of economic value or price to financial price. These conversion factors are officially prescribed by the National Economic and Development Authority (NEDA) in the Philippines (see Table 5). Table 6 shows summary of the conversion from financial to economic prices.
For instance, the economic value of unskilled labor is adjusted using a shadow wage rate of 0.6, an index that reflects the degree and nature of unemployment of unskilled labor in rural areas in the Philippines; the extent to which the rural labor market is functioning; alternative informal employment for unskilled labor (e.g., working on family farms; providing seasonal labor for construction projects or industries); among other factors. The effect of this adjustment is, however, minimal, since the wage component for unskilled labor is not a significant factor in the cost-benefit analyses.

5
For skilled labor, no adjustment in prices were necessary since skilled workers are generally in short supply in the Project areas and therefore the prevailing market wage in those areas may be taken to correspond to its supply price (i.e., the financial and economic costs are the same for skilled labor). In case of furniture, facilities, and civil works, no adjustments were made since these are mostly locally produced and traded goods. In the case of land, the economic price differs from the financial price if the subproject will bring about significant changes in land use. However, this is not the case in the Project, so no such adjustments were necessary. In the case of materials and equipment, financial prices were adjusted by a factor of 1.25 to reflect the fact that domestic prices are higher than world market prices. The standard exchange rate factor of 1.2 accounts for distortions due to taxes and subsidies on the supply and demand of tradable goods, as well as the effects of current account deficits.
Table 5. Economic Costs Conversion Factors
Civil works1/ 1 Materials and equipment1/ 1.25 Skilled Labor1/ 1 Unskilled Labor1/ 0.6 Land1/ 1 Furniture and Facilities 1 O&M Cost Items2/ 1 Standard Exchange Rate Factor 1.2
Notes: 1/ Refer to NEDA. The conversion factor for civil works is 0.98 (Fock 2005). 2/ Conversion factors for various operating cost items estimated between 0.96 and 1.07 (Jenkins and El-Hifnawi 1993). Conversion factor for maintenance estimated at 0.96 (Jenkins et al. 2003). Source: Fock (2005).
Table 6. Economic Unit Cost of Generic Subprojects
Subproject Type Financial Cost/ SP (PHP)1/
Economic Cost per SP (PHP)1/
Economic / Financial Cost
Level II Water System – Pump 982,005 1,070,385 1.09 Level II Water System – Gravity 847,162 923,406 1.09 Road Improvement 1,505,347 1,776,310 1.18 Road Construction 1,881,406 2,163,617 1.15 School Building 691,745 767,837 1.11 Health Station 372,477 420,899 1.13 Day Care Center 301,540 334,710 1.11
Notes: 1/ Financial costs include direct costs of construction (materials and labor), including local counterpart contribution based on completed, ongoing, and programmed costs. Excludes indirect project costs, such as social preparation, O&M, and M&E costs. Source: NPMO-Engineering Department (2005); authors’ calculations.

6
Project Benefits
Two types of project benefits were considered in this report. The first type pertains to monetized benefits from the seven major infrastructure SP categories. These benefits—identified by beneficiaries in the community-based evaluation by NPMO in 2004 and further confirmed during the 2006 Survey of SP benefits—are summarized in Table 7. The second kind of benefit, which was not monetized, refers to the potential benefits of investments to strengthen community participation and local governance through KALAHI -CIDSS processes.
Table 7. Summary of Monetized Benefits from Subprojects
Subproject Quantified Benefits Water Supply Time savings in fetching water
Cost savings on non-incremental water consumption Value of increased water consumption in the with project situation
Roads Cost savings to transport agriculture produce to market Cost savings to transport agriculture inputs to production site Reduction in post-harvest losses due to shorter marketing periods, better access to technology, and extension services
School Buildings Higher enrollment rates and lower dropout rates increase the number of children with additional years of schooling, who will be able to realize higher future incomes as a result of higher education.
Barangay Health Facilities Better health of the local population and work force through decreased mortality and morbidity, leading to increased productivity of labor in their economic activities (quantified by willingness to pay)
Day Care Centers Benefits from longer schooling by reducing drop-out rates in elementary school because of better readiness for school Direct gains in future earnings because of enhanced child ability Women have free time that can be used for productive activities
Sources: KALAHI-CIDSS; NPMO, Engineering Department, 2006 Subproject Benefit Survey, Philippines; and Fock (2005).
To measure the benefits of infrastructure SPs, a survey was undertaken by NPMO in January 2006 covering 20 percent of SPs completed over the past 16 months (Phases 1 and 2). The survey was undertaken by the Regional PMOs in eight regions nationwide and covered 87 barangays for all major SP categories. (See Annex 4.1 for the survey questionnaires and Annex 4.2 for lists of the survey areas).

7
Analysis of Model Subprojects
GENERAL ASSUMPTIONS
The base scenario of the economic analysis makes the following general assumptions:
1. The full benefit is realized in each year and over the full lifetime of the project. Since subprojects are “demand driven,” with active community participation and willingness to contribute to construction and O&M, it can be assumed that the projects will be operated and maintained satisfactorily so that full benefits can be realized over the entire lifetime of each subproject. This assumption is supported by the results of initial analyses, which show that in 9 out of 12 regions, O&M was rated fair to very satisfactory and that there is a high and positive correlation between O&M and stronger community participation and local governance.
2. The full expected benefits of the subproject will be realized in year 1. When analyzing large-scale projects, it is commonly assumed that full benefits will not be realized until a few years after the start of project operations. The simplifying assumption for subprojects is reasonable, considering that they are small scale and planned to be implemented within 6 months.
3. Operations and Maintenance (O&M) costs are constant over time and spent annually. The rationale is that for full expected benefit realization throughout the life of the project, the physical infrastructure must be repaired and maintained on a regularly scheduled basis. While O&M costs actually vary by project by year, with more costs towards the latter part of the investment life, a constant amount can be assumed as the average annual cost over the life of the subproject.
4. Expected benefit realization immediately ceases after the subproject lifetime is complete. For example, in the case of a school building with a project life of 15 years, no benefits from that subproject are realized in year 16 onward. While this is likely not the case for subprojects that have been operated and maintained properly throughout their project life, the analysis nonetheless makes this simplifying and conservative assumption.
5. A discount rate of 15 percent is used in computing the Net Present Value (NPV) and evaluating the Expected Internal Rate of Return (EIRR). This is the discount rate applied by NEDA. The NPV of an investment compares the present value of the cost stream, including the initial capital cost and annual O&M costs, to the present value of future expected benefits. The EIRR is the rate of discount for which the present value of the net benefits stream equals zero, i.e., the rate of discount at which the present value of the cost stream is equal to the present value of the benefit stream.
8
WATER SUPPLY LEVEL II (PUMP AND GRAVITY)
Data, Assumptions, and Calculations
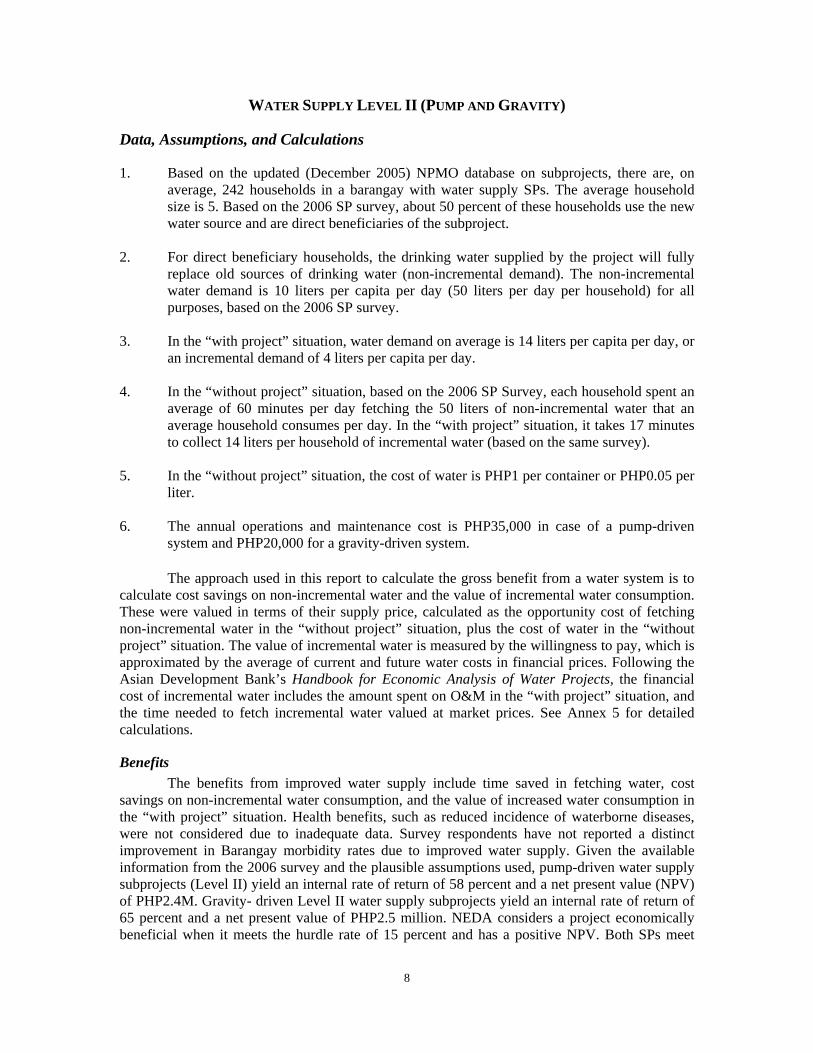
1. Based on the updated (December 2005) NPMO database on subprojects, there are, on average, 242 households in a barangay with water supply SPs. The average household size is 5. Based on the 2006 SP survey, about 50 percent of these households use the new water source and are direct beneficiaries of the subproject.
2. For direct beneficiary households, the drinking water supplied by the project will fully
replace old sources of drinking water (non-incremental demand). The non-incremental water demand is 10 liters per capita per day (50 liters per day per household) for all purposes, based on the 2006 SP survey.
3. In the “with project” situation, water demand on average is 14 liters per capita per day, or
an incremental demand of 4 liters per capita per day. 4. In the “without project” situation, based on the 2006 SP Survey, each household spent an
average of 60 minutes per day fetching the 50 liters of non-incremental water that an average household consumes per day. In the “with project” situation, it takes 17 minutes to collect 14 liters per household of incremental water (based on the same survey).
5. In the “without project” situation, the cost of water is PHP1 per container or PHP0.05 per
liter. 6. The annual operations and maintenance cost is PHP35,000 in case of a pump-driven
system and PHP20,000 for a gravity-driven system.
The approach used in this report to calculate the gross benefit from a water system is to calculate cost savings on non-incremental water and the value of incremental water consumption. These were valued in terms of their supply price, calculated as the opportunity cost of fetching non-incremental water in the “without project” situation, plus the cost of water in the “without project” situation. The value of incremental water is measured by the willingness to pay, which is approximated by the average of current and future water costs in financial prices. Following the Asian Development Bank’s Handbook for Economic Analysis of Water Projects, the financial cost of incremental water includes the amount spent on O&M in the “with project” situation, and the time needed to fetch incremental water valued at market prices. See Annex 5 for detailed calculations.
Benefits The benefits from improved water supply include time saved in fetching water, cost
savings on non-incremental water consumption, and the value of increased water consumption in the “with project” situation. Health benefits, such as reduced incidence of waterborne diseases, were not considered due to inadequate data. Survey respondents have not reported a distinct improvement in Barangay morbidity rates due to improved water supply. Given the available information from the 2006 survey and the plausible assumptions used, pump-driven water supply subprojects (Level II) yield an internal rate of return of 58 percent and a net present value (NPV) of PHP2.4M. Gravity- driven Level II water supply subprojects yield an internal rate of return of 65 percent and a net present value of PHP2.5 million. NEDA considers a project economically beneficial when it meets the hurdle rate of 15 percent and has a positive NPV. Both SPs meet

9
these criteria and are therefore deemed economically beneficial. Tables 8 and 9 show the results of the analysis.
Table 8. Economic Analysis for Water Supply System II – Pump Driven NPV = P2,451,598; IRR = 57.78% Assumptions Unit Without
Project With Project With - Without
Economic cost of construction PHP 0.00 1,070,385.27 1,070,385.27
Social preparation / Cap. Bldg PHP 0.00 119,098.82 119,098.82 Total operating cost PHP 0.00 78,323.55 78,323.55 M&E cost PHP 0.00 2,048.20 2,048.20 Total Investment Cost PHP 0.00 1,269,855.83 1,269,855.83 Gross Annual Benefit PHP 0.00 776,507.34 776,507.34 Annual O&M cost PHP/year 0.00 35,000.00 35,000.00 Annual Net Benefits PHP/year 0.00 741,507.34 741,507.34 Project Life years 0.00 10.00 10.00 Capital Cost / Annual Net Benefit 1.71 Discount Rate 15.00%
Table 9. Economic Analysis for Water Supply System II – Gravity Driven NPV: P2,567,847; IRR = 65.05% Assumptions Unit Without
Project With Project With- without
Economic cost of construction PHP 0.00 923,406.45 923,406.45
Social preparation / cap. bldg PHP 0.00 119,098.82 119,098.82 Total operating cost PHP 0.00 78,323.55 78,323.55 M&E cost PHP 0.00 2,048.20 2,048.20 Total Investment Cost PHP 0.00 1,122,877.01 1,122,877.01 Gross Annual Benefit PHP 0.00 755,384.28 755,384.28 Annual O&M cost PHP/year 0.00 20,000.00 20,000.00 Annual Net Benefits PHP/year 0.00 735,384.28 735,384.28 Project Life years 0.00 10.00 10.00 Capital Cost / Annual Net Benefit 1.53 Discount Rate 15.00%

10
ROAD CONSTRUCTION AND IMPROVEMENT
Data, Assumptions, and Calculations 1. Based on the updated (2005) NPMO database of SPs, the average actual number of
households in a barangay with a road improvement and/or construction subproject is 242. Based on the 2006 SP Benefits Survey, 60 percent of farmers in a barangay will directly benefit from road improvement. No new additional farmers are presumed to benefit from road rehabilitation, since it only entails rehabilitation of an existing road. Based on the NPMO SP Data Base, the average length of a road rehabilitation SP is 2.51 kilometers, with a minimum of 1 km and a maximum of 4.61 km.
2. For a new road project, again based on the 2006 SP Benefits Survey, it was reported that
about 40 percent of farmers use existing trails to bring their produce to the nearest road network. It was also reported in the survey that at least 55 percent of farmers will benefit from new road construction, which means at least 36 new farmer beneficiaries. This figure is reasonable, given that the average length of a new road construction SP is 2.59 kilometers, with a minimum of 1 km and a maximum of 8.56 km.
3. Paddy is the predominant crop in the Philippines and the calculations in this paper are
based on paddy estimates. Using official government data, the national average landholding of a paddy farmer in the Philippines is 1.30 hectares, with a national average cropping intensity of 1.36 hectares.
4. The average yield per hectare is 70 sacks (1 sack = 42 kg), or 2,940 kg per hectare per harvest. This yield equals a production of 5,197 kg per year per farmer, given a farm size of 1.3 ha and 1.36 ha cropping intensity. No assumption is made on increased cropping intensity and additional land cultivated due to the road project. Post-harvest losses on a national average are 13 percent for paddy, based on estimates by the International Rice Research Institute (IRRI) and the Bureau of Post-Harvest Research and Extension.5 Because of better access to markets, faster transport times, and better access to information and technology due to road improvement, it is conservatively assumed that post-harvest losses will be reduced by 2.5 percent in the “with project” situation, which is equivalent to 168 kgs per farmer per year.
5. Each year, one farmer keeps 25 sacks (1,050 kg) for his own consumption and markets
4,147 kg. In the “without project” situation, transporting paddy to the market costs PHP30 per sack (PHP0.72 per kg). In the “with project” situation, the cost is only PHP15 per sack (PHP0.61 per kg). Marketing 4,147 kg of paddy per year, one farmer realizes an annual cost savings of PHP490 per year on transport cost.
6. One farmer applies 6 sacks of fertilizer per planting season on his 1.5 hectares. This
corresponds to 4 sacks (168 kg) of fertilizer per hectare and planting season. The transport cost is PHP30 per sack (PHP0.72 per kg) in the “without project” situation and PHP15 per sack (PHP0.36 per kg) in the “with project” situation. Based on these figures,
5 See website of the Bureau of Post-harvest Research and Extension, Philippines, http://www.bpre.gov.ph/phlosses (accessed January 2006).

11
a road project allows a farmer to realize an annual savings of PHP1,600 in the transport of inputs and produce.
7. The average O&M cost for both road rehabilitation and new construction is PHP50,000
per year, based on NPMO estimates.
Benefits The benefits associated with road improvement and construction subprojects are cost
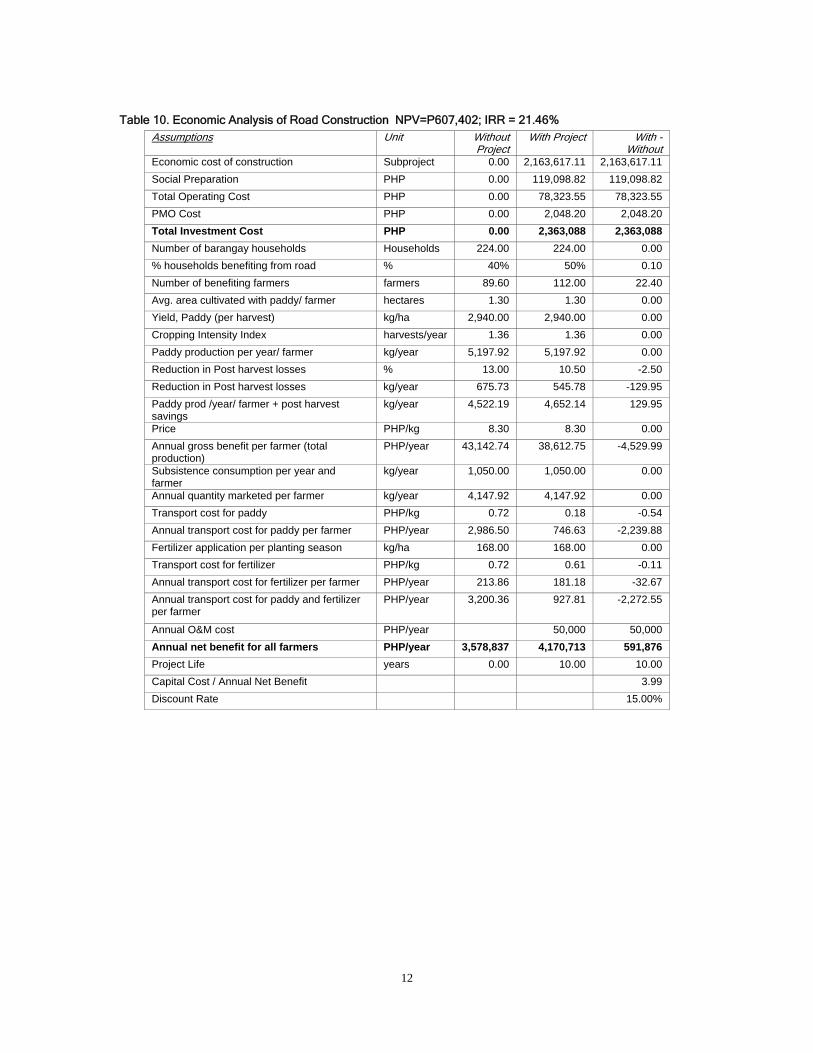
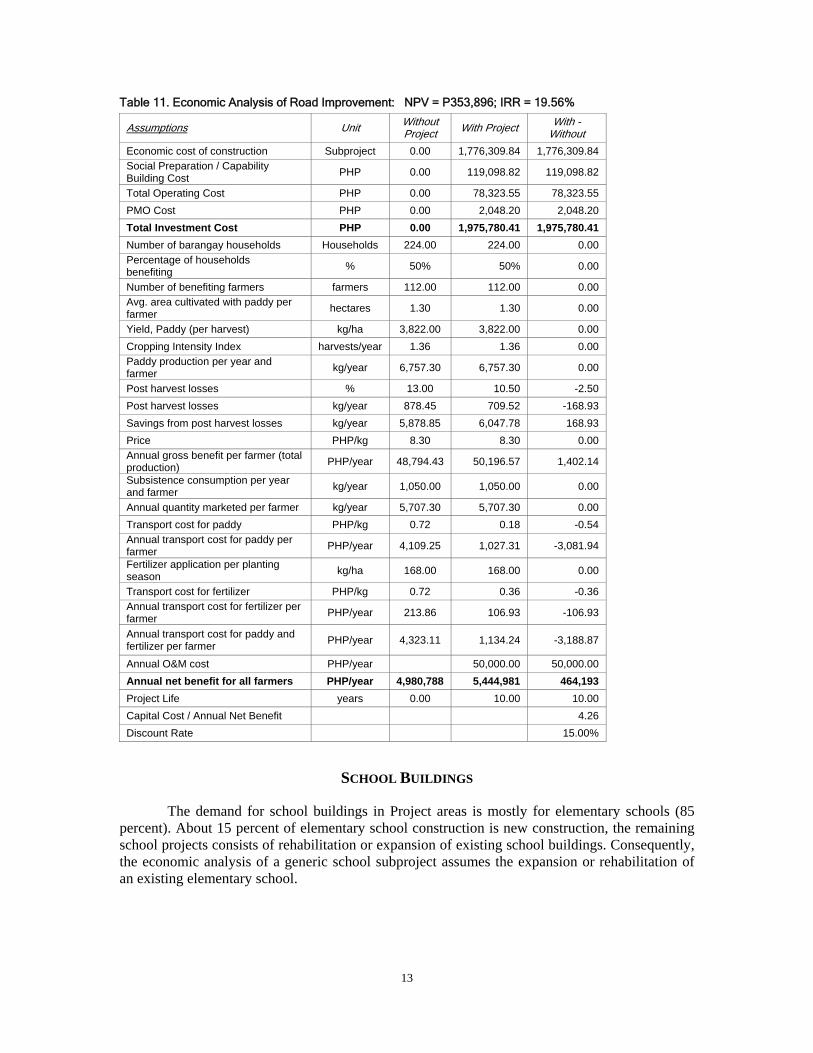
savings in transporting agriculture produce to the market, additional earnings from a reduction in post-harvest losses, and cost savings in transporting agricultural inputs to the farm site. Based on available information and plausible assumptions, investments in a new road construction project would generate an internal rate of return of 21.5 percent and an NPV of PHP0.607M. A road improvement project would yield an internal rate of return of 19 percent and an NPV of PHP0.354 million. Both of these project types are therefore deemed economically beneficial (see Tables 10 and 11).
These benefits accrue from a 10 percent cost saving in transporting inputs and produce, as well as a 2.5 percent reduction in post-harvest losses due to shorter marketing periods and better access to technology and extension services. These results are lower-bound estimates since the analysis did not include other possible benefits, such as: higher cropping intensity; increased property values; increased area of land cultivated or number of farmers engaging in agricultural production; changes in the product mix towards higher-value crops; reduction in maintenance cost; time savings of other users; better access to health stations; lower number of accidents; increase in number of children attending school; and increased traffic. These potential benefits were not included in the analysis because of data limitations.
12
Table 10. Economic Analysis of Road Construction NPV=P607,402; IRR = 21.46% Assumptions Unit Without
Project With Project With -
Without Economic cost of construction Subproject 0.00 2,163,617.11 2,163,617.11 Social Preparation PHP 0.00 119,098.82 119,098.82 Total Operating Cost PHP 0.00 78,323.55 78,323.55 PMO Cost PHP 0.00 2,048.20 2,048.20 Total Investment Cost PHP 0.00 2,363,088 2,363,088 Number of barangay households Households 224.00 224.00 0.00 % households benefiting from road % 40% 50% 0.10 Number of benefiting farmers farmers 89.60 112.00 22.40 Avg. area cultivated with paddy/ farmer hectares 1.30 1.30 0.00 Yield, Paddy (per harvest) kg/ha 2,940.00 2,940.00 0.00 Cropping Intensity Index harvests/year 1.36 1.36 0.00 Paddy production per year/ farmer kg/year 5,197.92 5,197.92 0.00 Reduction in Post harvest losses % 13.00 10.50 -2.50 Reduction in Post harvest losses kg/year 675.73 545.78 -129.95 Paddy prod /year/ farmer + post harvest savings
kg/year 4,522.19 4,652.14 129.95
Price PHP/kg 8.30 8.30 0.00 Annual gross benefit per farmer (total production)
PHP/year 43,142.74 38,612.75 -4,529.99
Subsistence consumption per year and farmer
kg/year 1,050.00 1,050.00 0.00
Annual quantity marketed per farmer kg/year 4,147.92 4,147.92 0.00 Transport cost for paddy PHP/kg 0.72 0.18 -0.54 Annual transport cost for paddy per farmer PHP/year 2,986.50 746.63 -2,239.88 Fertilizer application per planting season kg/ha 168.00 168.00 0.00 Transport cost for fertilizer PHP/kg 0.72 0.61 -0.11 Annual transport cost for fertilizer per farmer PHP/year 213.86 181.18 -32.67 Annual transport cost for paddy and fertilizer per farmer
PHP/year 3,200.36 927.81 -2,272.55
Annual O&M cost PHP/year 50,000 50,000 Annual net benefit for all farmers PHP/year 3,578,837 4,170,713 591,876 Project Life years 0.00 10.00 10.00 Capital Cost / Annual Net Benefit 3.99 Discount Rate 15.00%
13
Table 11. Economic Analysis of Road Improvement: NPV = P353,896; IRR = 19.56%
Assumptions Unit Without Project With Project With -
Without Economic cost of construction Subproject 0.00 1,776,309.84 1,776,309.84 Social Preparation / Capability Building Cost PHP 0.00 119,098.82 119,098.82
Total Operating Cost PHP 0.00 78,323.55 78,323.55 PMO Cost PHP 0.00 2,048.20 2,048.20 Total Investment Cost PHP 0.00 1,975,780.41 1,975,780.41 Number of barangay households Households 224.00 224.00 0.00 Percentage of households benefiting % 50% 50% 0.00
Number of benefiting farmers farmers 112.00 112.00 0.00 Avg. area cultivated with paddy per farmer hectares 1.30 1.30 0.00
Yield, Paddy (per harvest) kg/ha 3,822.00 3,822.00 0.00 Cropping Intensity Index harvests/year 1.36 1.36 0.00 Paddy production per year and farmer kg/year 6,757.30 6,757.30 0.00
Post harvest losses % 13.00 10.50 -2.50 Post harvest losses kg/year 878.45 709.52 -168.93 Savings from post harvest losses kg/year 5,878.85 6,047.78 168.93 Price PHP/kg 8.30 8.30 0.00 Annual gross benefit per farmer (total production) PHP/year 48,794.43 50,196.57 1,402.14
Subsistence consumption per year and farmer kg/year 1,050.00 1,050.00 0.00
Annual quantity marketed per farmer kg/year 5,707.30 5,707.30 0.00 Transport cost for paddy PHP/kg 0.72 0.18 -0.54 Annual transport cost for paddy per farmer PHP/year 4,109.25 1,027.31 -3,081.94
Fertilizer application per planting season kg/ha 168.00 168.00 0.00
Transport cost for fertilizer PHP/kg 0.72 0.36 -0.36 Annual transport cost for fertilizer per farmer PHP/year 213.86 106.93 -106.93
Annual transport cost for paddy and fertilizer per farmer PHP/year 4,323.11 1,134.24 -3,188.87
Annual O&M cost PHP/year 50,000.00 50,000.00 Annual net benefit for all farmers PHP/year 4,980,788 5,444,981 464,193 Project Life years 0.00 10.00 10.00 Capital Cost / Annual Net Benefit 4.26 Discount Rate 15.00%
SCHOOL BUILDINGS
The demand for school buildings in Project areas is mostly for elementary schools (85 percent). About 15 percent of elementary school construction is new construction, the remaining school projects consists of rehabilitation or expansion of existing school buildings. Consequently, the economic analysis of a generic school subproject assumes the expansion or rehabilitation of an existing elementary school.

14
Data, Assumptions, and Calculations 1. Based on updated records of the NPMO for Phases 1 and 2, the average number of
beneficiary households in KALAHI-CIDSS barangays that implement school projects is 271. At an average household size of 5, this equals an average population of 1,355.
2. The proportion of children 6–12-year-olds is assumed to be 17.4 percent, based on the proportion of 6–12 years old in the 2002 Philippine Statistical Yearbook. At an average Barangay population of 1,355, this equals 236 children.
3. The enrollment rate of children between 7 and 12 years in the project area is about 85 percent, based on the 2006 survey estimates. In the “with project” situation, enrollment is assumed to increase to the national average of 96.4 percent. The national dropout rate in elementary school was 7.18 percent in the 2000–2001 school year. (Enrollment and dropout rates taken from 2002 Philippines Statistical Yearbook.) In this report, dropout rates in the Project areas are assumed to be much higher because of higher-than-average poverty conditions. Baseline data indicates a dropout rate between 10.3 percent for grade 1 to 60.6 percent for grade 6. It is conservatively assumed in this report that the dropout rate in the “without project” situation is 20 percent and the “with project” situation, 10 percent.
4. In the absence of other reliable estimates for rural areas in the Philippines, this report used the estimate of Gerochi (2002) that an additional year of schooling in the country would raise annual earnings by 14 percent. Applied to per capita expenditure (as a proxy for income) of the 2003 baseline municipalities of PHP909 per month or PHP10,908 per year, this results in PHP1,527 per person per year in additional earnings. Earned over 30 years after completing elementary school, this would translate into a net present value of PHP4,335 (at a 15 percent discount rate) for the average of 6–12-year-old children who receive an additional year of schooling in the “with project” situation.
5. The following operations and maintenance cost are estimated based on 2006 survey data: • O&M cost is PHP10,000 per month for one teacher for 13 months, including
mandatory 13-month pay. The school has two teachers, yielding an annual cost of PHP260,000 in both “with” and “without project” situations;
• O&M cost for building repair and equipment replacement is PHP7,500 per year in the “with project” situation and PHP2,500 in the “without project” case when minor repairs were done; and
• O&M for material and/or supplies amount to 10 percent of teachers’ annual salary or PHP26,000 per year;
• O&M cost for water and electricity amounts to PHP1,000 per month, or PHP12,000 per year.
Benefits The main benefits associated with school building subprojects are higher enrollment rates
and lower dropout rates. These results will increase the number of children with additional years of schooling, who will be able to realize higher future incomes as a result of higher education levels (see World Bank 1998b for a cost-benefit analysis of basic education). Given available information and plausible assumptions, an elementary school building SP yields an internal rate of return of 15.91 percent and an NPV of PHP42,729. It is therefore considered economically beneficial (see Table 12).

15
These benefits accrue from an increase in the number of children with additional years of schooling due to an 11 percent increase in enrollment rates and a 10 percent decrease in dropout rates, which approximates the national average (Gerochi 2002). This result, however, is very conservative because it only accounts for private returns to basic education and does not consider social returns. Research has shown that primary education also generates social benefits in the form of more rapid technological innovation and adaptation, better protection of the natural environment, and less crime (World Bank 2003a). These benefits were not included in the analysis.
Table 12. Economic Analysis for Elementary School Buildings NPV = $42,729; IRR = 15.91% Assumptions Unit Without
Project With Project With -
Without Economic cost of construction PHP 0.00 767,837.45 767,837.45
Social preparation / Capability Building PHP 0.00 119,098.82 119,098.82 Total operating cost PHP 0.00 78,323.55 78,323.55 M&E cost PHP 0.00 2,048.20 2,048.20 Total Investment Cost PHP 0.00 967,308.02 967,308.02 Beneficiary families (1 barangay) families 271.00 271.00 0.00 Family size persons 5.00 5.00 0.00 Barangay population persons 1355.00 1355.00 0.00 Proportion of children 6-12 years % 17.4% 17.4% 0.00 Number of children 6-12 years children 236 236 0.00 Enrollment rate of children 6-12 years % 85.00% 96.00% 10.00% Drop-out rate children 6-12 years % 20.00% 10.00% -10.00% No. children 6-12 yrs complete school yr
children 161 202 41
Inc NPV of earning / 1 extra yr school PHP 4,334.97 4,334.97 0.00 Gross annual benefit PHP 697929 875663 177734 O&M Cost - teacher PHP/year 260,000.00 260,000.00 0.00 O&M Cost - repairs PHP/year 2,500.00 7,500.00 5,000.00 O&M Cost - materials & supplies PHP/year 26,000.00 26,000.00 0.00 O&M Cost - water & electricity PHP/year 12,000.00 12,000.00 0.00 Annual net benefits PHP/year 397,429 570,163 172,734 Project life years 0.00 15.00 15.00 Discount rate 15.00%

16
HEALTH CENTERS
Data, Assumptions, and Calculations 1. It was assumed that in the “without project” situation, health services were provided in
another facility. Based on the 2006 SP Benefits Survey, 7 people on average visit this old facility and an average of 11 patients request a consultation on a given day. Based on the 2006 survey, health centers constructed under the Project operate from 2 to 6 days a week (4 days average) for a total of 192 days a year.
2. In the previous analyses, the average willingness to pay for a visit to a health center was
estimated at PHP460 per visit in 1998 prices, based on NEDA estimates. This estimate was derived from the case of the Benguet Regional Hospital in the Cordillera Region. However, this estimate is not suitable for a small rural health center such as those in Project areas since the Benguet Hospital is a major regional hospital located in a highly urbanized area (La Trinidad-Baguio City Region) that offers more services. Also, respondents are more likely to have higher incomes compared to rural populations in Project areas. Based on the 2006 SP Benefit Survey, Project beneficiaries are unlikely to pay PHP460 per visit at a much smaller rural health center with lesser services. In this report, the maximum willingness to pay is therefore conservatively estimated at PHP200 per visit. In the 2006 Survey, this ranged from PHP5 to 300 per visit.
3. It is assumed that a midwife serves a basic Barangay Health Station (BHS) once per
week. The cost for a midwife is one-fifth of her annual salary of PHP130,000 (which includes 13 months’ pay), or PHP26,000 per year. Every day, one volunteer health worker would attend the facility for a few hours. It is assumed that three health workers serve the community and are remunerated at PHP300 per month per worker for an annual total of PHP10,800. The incremental staffing cost is zero if the facility existed previously.
4. The operations and maintenance cost are estimated as follows:
• The O&M cost of drugs is covered by the municipality and amount, on average, to PHP4,000 per month per BHS, or PHP48,000 per year.
• O&M cost for building repair and equipment replacement is PHP10,000 per year in the “with project” situation and PHP2,500 in the “without project” situation when only minor repairs are undertaken.
• O&M cost for water and electricity amounts to PHP6,480 per year, based on the following expenses: 30 liters of water per day at P0.5/li for 16 days per month, and PHP300 per month for electricity.
Benefits The benefits realized from Barangay Health Stations (BHS) derive from better health of
the local population and work force through decreased mortality and morbidity, leading to increased productivity of labor in economic activities. The benefits are quantified by the beneficiaries’ willingness to pay for health services.
Based on available information and plausible assumptions, Project investments in barangay health stations are economically beneficial. The results of the analysis show an internal rate of return of 19.6% and an NPV of PHP233,930 (Table 13). Table 13 summarizes the results.

17
Table 13. Economic Analysis for Barangay Health Centers NPV = P233,930; IRR = 19.63%
Assumptions Unit Without Project
With Project With - Without
Economic Cost of Construction PHP 0.00 420,899.40 420,899.40 Social Preparation / Capability Bldg PHP 0.00 119,098.82 119,098.82 Total Operating Cost PHP 0.00 78,323.55 78,323.55 M&E Cost PHP 0.00 2,048.20 2,048.20 Total Investment Cost PHP 0.00 620,370 620,370 Number of Daily Visits to Health Facility visits/day 7.00 11.00 4.00 Days Facility is Open per Year days/year 192.00 192.00 0.00 Average Willingness to Pay PHP/visit 200.00 200.00 0.00 Gross Annual Benefit PHP 268,800.00 422,400.00 153,600.00 O&M Cost – Midwife PHP/year 26,000.00 26,000.00 0.00 O&M Cost - Health Workers PHP/year 10,800.00 10,800.00 0.00 O&M Cost - Drugs and Medicine PHP/year 48,000.00 48,000.00 0.00 O&M cost – building PHP/year 2,500.00 10,000.00 7,500.00 O&M Cost – Other PHP/year 6,480.00 6,480.00 0.00 Annual Net Benefits PHP/year 175,020.00 321,120.00 146,100.00 Project Life years 0.00 15.00 15.00 Capital Cost / Annual Net Benefit 4.25 Discount Rate 15.00%
DAY CARE CENTERS
Data, Assumptions, and Calculations 1. Based on the 2006 SP Benefit Survey, on average, a day care center constructed by the
Project takes care of 35 children (3–6 years old). In 6 out of 8 cases, children previously attended day care in another facility, usually a dilapidated barangay building that had not been properly maintained for a long time and was too small to accommodate a larger number of children. The average attendance in these old facilities was reported at 16 children, so 20 additional children can be accommodated by the new day care facilities. The facility is used on average 22 days a month, 12 months a year.
2. It is assumed that one year of preschool education is associated with 4 months of additional education. If one additional year of schooling increases potential earnings by 14 percent (see Gerochi 2002), 4 additional months of education produce an indirect gain of 4.7 percent (14 percent divided by 3) per year in earning power. It is also assumed that children attending preschool have a direct gain of 2 percent in future earnings, so that the combined benefit amounts to a 6.7 percent increase in annual lifetime income. One has to subtract the discounted cost of additional schooling from the net present value of these benefits. From elementary school data, it is assumed that the annual cost for one student in elementary school amounts to PHP4,300 per year.
3. Based on the 2006 survey, day care classes last for 2.5 hours per day and parents save at
least an average of 2 hours a day. It was reported in the survey that these hours were used in a number of productive activities, consisting mainly of household chores, participation in Project activities, and livelihoods (e.g., manicure, pedicure, harvesting in harvest
18
season, marketing). This amounts to 88 working days per month in the “without project” situation (16 women x 2 hours a day x 22 days per months / 8 working hours per working day). The result is valued at the opportunity cost of labor of 150 PHP/day x 0.6 = PHP90, an economic value of time savings of PHP7,920 per month or PHP95,040 per year. In the “with project” situation, this amount is PHP218,064, with 20 additional parents benefiting from new, larger-capacity day care centers. This generates an incremental annual benefit of PHP121,147 from time saved by parents.
4. The operations and maintenance cost are estimated as follows:
• O&M cost is PHP1,800 per month for the teacher for 13 months.
• O&M cost for building repair and equipment replacement is PHP10,000 per year in the “with project” situation and PHP2,500 in the “without project” situation when only minor repairs are undertaken.
• O&M costs for material and supplies amount to PHP250 per year and child.
• O&M cost for water and electricity amounts to PHP 7,440 per year. This is the cost of 30 liters water per day at PHP1 for 20 days per months, and PHP300 per month for electricity.
Benefits The economic benefits from a day care center are calculated from three components (also
see Fock 2005): (i) benefits from longer schooling by reducing dropouts in elementary school due to better readiness for school; (ii) direct gains in future earnings due to enhanced ability; (iii) parents’ time savings (if children attend day care, [mostly] women have more time for productive use). Other benefits from early childhood development (e.g., lower mortality, increased health, and better nutrition) are not considered in this analysis due to data constraints. Social benefits such as lower rates of juvenile arrest for violent and non-violent charges and less need for school remedial services were also not considered.6 For an example of a detailed cost-benefit analysis of a national early child education project see World Bank (1998b:54–61), which also refers to some earlier studies on early childhood development (ECD) and schooling in the Philippines.7
Based on available information and plausible assumptions, Project investments in day care centers are economically beneficial. Results of the analysis show an internal rate of return of 15.6 percent and an NPV of PHP101,120 (see Table 14).
6 For a detailed presentation of benefits of early childhood development (ECD) programs, see the case study on Bolivia by Van der Gaag and Jee-Peng (1998). More resources on cost-benefit analyses of ECD are available on the World Bank’s web page on Early Childhood Development (http://web.worldbank.org/WBSITE/EXTERNAL/TOPICS/EXTEDUCATION/0,,contentMDK:20264764~menuPK:617557~pagePK:148956~piPK:216618~theSitePK:282386,00.html; accessed January 2006). This site also includes a link to a cost-benefit calculator designed by the Amsterdam Institute for International Development ( AIID). Also see Fock (2005). 7 This study is summarized on the website of the Philippine Department for Social Welfare and Development.

19
Table 14. Economic Analysis of Day Care Centers NPV = P101,120; IRR = 15.54% Assumptions Unit Without
Project With
Project With -
Without Economic Cost of Construction PHP 0 334710 334710 Social Preparation / Capability Building Cost PHP 0 119099 119099 Operating Cost PHP 0 78324 78324 M&E Cost PHP 0 2048 2048 Total Investment Cost PHP 0 534180 534180 Children in Daycare Children 16 36 20 Annual benefit from mothers' time savings PHP 95040 213840 118800 Increase in NPV earnings for 1 year of preschool PHP 117 117 0
Annual benefit from children attending preschool PHP 1878 4225 2347 Gross Annual Benefit PHP 96918 218065 121147 O&M Cost - Teacher PHP/year 23400 23400 0 O&M Cost - Repairs PHP/year 2500 10000 7500 O&M Cost - Materials & Supplies PHP/year 4000 9000 5000 O&M Cost - Water & Electricity PHP/year 7440 7440 0 Annual Net Benefits PHP/year 59578 168225 108647 Project Life Years 15 15 Capital Cost / Annual Net Benefit 4.92 Discount Rate 15.00%
DEMAND RESPONSIVENESS
A commonly cited benefit of community-driven development (CDD) approaches is that they have the potential to achieve a greater match between the services delivered and the real needs of communities. In this analysis, demand responsiveness is assessed at two levels: the responsiveness of the project to household preferences and the responsiveness of municipal governments to demands for counterpart funding.
The responsiveness of local governments, particularly municipal local governments (MLGU), to demands from barangay residents was assessed in terms of how much the municipal government actually provided as counterpart funding to the Project as a proportion of its budget for social welfare and development (20 percent of its Development Fund). Relatively few provincial governments made substantial counterpart contributions to the Project and were thus excluded from the analysis. This is one area the Project may want to investigate, as these governments are a potentially valuable and untapped resource.
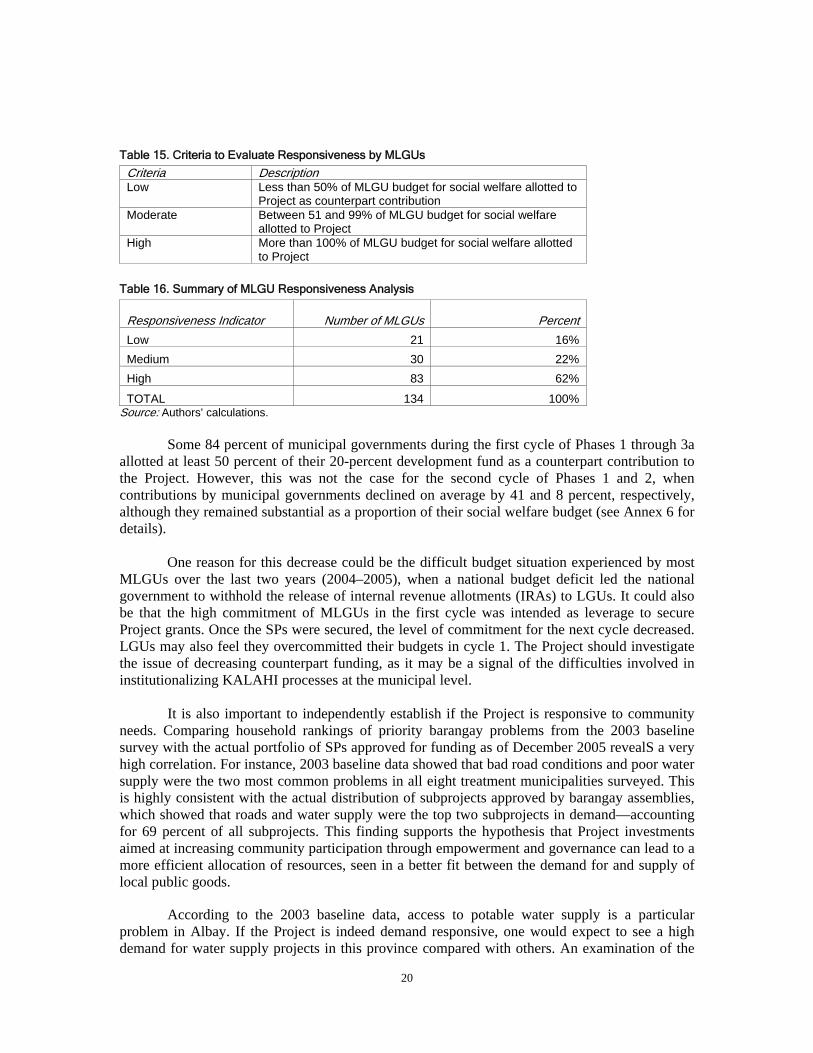
Each of the 101 MLGUs involved in Phases 1 and 2 were ranked using three indicative criteria described in Table 15. These criteria were arbitrarily set, but nonetheless reasonable. Results of the analysis are summarized in Table 16. (See Annex 6 for the data, methodology, and details.)
20
Table 15. Criteria to Evaluate Responsiveness by MLGUs
Criteria Description Low Less than 50% of MLGU budget for social welfare allotted to
Project as counterpart contribution Moderate Between 51 and 99% of MLGU budget for social welfare
allotted to Project High More than 100% of MLGU budget for social welfare allotted
to Project Table 16. Summary of MLGU Responsiveness Analysis
Responsiveness Indicator Number of MLGUs
Percent Low 21 16% Medium 30 22% High 83 62%
TOTAL 134 100% Source: Authors’ calculations.
Some 84 percent of municipal governments during the first cycle of Phases 1 through 3a
allotted at least 50 percent of their 20-percent development fund as a counterpart contribution to the Project. However, this was not the case for the second cycle of Phases 1 and 2, when contributions by municipal governments declined on average by 41 and 8 percent, respectively, although they remained substantial as a proportion of their social welfare budget (see Annex 6 for details). One reason for this decrease could be the difficult budget situation experienced by most MLGUs over the last two years (2004–2005), when a national budget deficit led the national government to withhold the release of internal revenue allotments (IRAs) to LGUs. It could also be that the high commitment of MLGUs in the first cycle was intended as leverage to secure Project grants. Once the SPs were secured, the level of commitment for the next cycle decreased. LGUs may also feel they overcommitted their budgets in cycle 1. The Project should investigate the issue of decreasing counterpart funding, as it may be a signal of the difficulties involved in institutionalizing KALAHI processes at the municipal level.
It is also important to independently establish if the Project is responsive to community needs. Comparing household rankings of priority barangay problems from the 2003 baseline survey with the actual portfolio of SPs approved for funding as of December 2005 revealS a very high correlation. For instance, 2003 baseline data showed that bad road conditions and poor water supply were the two most common problems in all eight treatment municipalities surveyed. This is highly consistent with the actual distribution of subprojects approved by barangay assemblies, which showed that roads and water supply were the top two subprojects in demand—accounting for 69 percent of all subprojects. This finding supports the hypothesis that Project investments aimed at increasing community participation through empowerment and governance can lead to a more efficient allocation of resources, seen in a better fit between the demand for and supply of local public goods.
According to the 2003 baseline data, access to potable water supply is a particular problem in Albay. If the Project is indeed demand responsive, one would expect to see a high demand for water supply projects in this province compared with others. An examination of the

21
actual subproject distribution as of December 2005 confirms that the demand for water supply subprojects in Albay ranked highest among all SPs and all provinces. This would suggest that Project mechanisms for demand revelation and aggregation (i.e., the social mobilization process) are responsive to real community demands.
SUMMARY Overall, based on available information, the Project will generate a conservatively
estimated internal rate of return of 21 percent and a net present value of PHP1,038 million. It is therefore deemed to be economically beneficial. All of the seven major subproject categories evaluated met the 15 percent hurdle rate set by NEDA (see Table 17). Road subprojects ranked highest in terms of demand, accounting for 37 percent of total SPs as of December 2005, with a 17 percent rate of return for road improvement and 25 percent for road construction. Water supply subprojects were also in high demand, accounting for 32 percent of total subprojects. Gravity-driven Level II water supply had the highest rate of return, at 65 percent, followed by pump-driven water supply, at 58 percent.
Table 17. Summary of Economic Analysis for Subprojects and Overall Project Subproject Type Expected
Project Life
Total Investment
Cost 1/
Expected Annual
Incremental Net Benefits
Expected NPV
Expected IRR
Freq in SP Dist
2/
Rank IRR
Rank Freq in
SP Dist
Level II Water System - Pumps 10 1,181,475 741,507 2,451,598 58% 153 2 3 Level II Water System - Gravity 10 1,046,632 735,384 2,567,847 65% 221 1 2
Road Improvement 10 1,704,818 464,193 353,896 20% 354 5 1
Road Construction 10 2,080,877 591,876 607,402 21% 82 3 7
School Building 15 891,216 172,734 42,729 16% 117 6 5
Barangay Health Station 15 571,948 146,100 233,931 20% 143 4 4
Day Care Center 15 501,011 108,647 101,120 16% 105 6 6
Overall Project 8,262,133,551 1,031,723,228 21% Notes: 1/ Includes direct and indirect costs including local counterpart contribution 2/ Figures derived from NPMO Engineering Department, as of December 2005. Does not include 348 other SPs, which do not fall within the seven major categories. Overall Project benefits accrue from (1) water supply SPs, including time saved in fetching water, cost savings on non-incremental water consumption, and value of increased water consumption in the “with project” situation; (2) benefits from road SPs, such as 10 percent cost savings in transporting inputs and produce, as well as a 2.5 percent reduction in post-harvest losses because of shorter marketing periods and better access to technology and extension services; (3) an increase in the number of children with additional years of schooling due to an 11 percent increase in enrollment rates and a 10 percent decrease in dropout rates; (4) better health of the local population and workforce due to decreased morbidity rates, as valued by willingness to pay; and (5) benefits from day care, such as additional time for parents that can be devoted to other productive purposes for livelihood generation. Approximately 278,767 households, or about 1.4 million individuals, are expected to directly benefit from these ongoing and completed infrastructure SPs in the period 2003–2005 (see Table 18).
The results are conservative for three reasons. First, they do not include other potential but unquantified benefits, such as reduction in morbidity due to potable water systems, better access to social services and technology, and increased property values from road projects, social returns

22
to education, and possible benefits from improvements in barangay governance and empowerment. Second, they do not include benefits from 348 other SPs, which were not included in the seven major categories. Third, the analysis uses lower-bound estimates.
Table 18. Number of Project Beneficiaries, Households, and Individuals, 2003–2005
Number of SPs
Avg. Number of Beneficiary Households
Total HH Total Individuals
Level II Water System – Pump 153 242 37,026 185,130 Level II Water System – Gravity 221 242 53,482 267,410 Road Improvement 354 247 87,438 437,190 Road Construction 82 247 20,254 101,270 School Building 117 271 31,707 158,535 Health Station 105 227 23,835 119,175 Day Care Center 143 175 25,025 125,125 Total 1175 278,767 1,393,835
Notes: 1/ Does not include 348 other subprojects, which individually accounted for a small proportion of the overall SP distribution. These other SPs included lighthouses, wharves, seawalls, piers, tribal housing, flood control projects, a solid waste facility, and electrification, communal irrigation, drainage, meat processing livelihood, and natural resources management projects, among others. Source: NPMO-Engineering Department, January 2006.
Based on available data, it also seems that the Project’s investment in community participation and local governance are likely to lead to better O&M. MLGUs in Project areas are responding well to demands for counterpart funding, but it remains to be seen if this will be sustained. The KALAHI-CIDSS subproject choices also appear to be responsive to household preferences, as indicated by the high correlation between revealed preferences in the 2003 baseline survey and actual demand during Project implementation.

23
Sensitivity Analysis
The sensitivity analysis of the Project’s rates of return uses a NEDA-prescribed scenario of a 20 percent cost escalation and a 20 percent decrease in benefits. Switching values and sensitivity indicators were determined for each SP, as well as the overall Project. The switching value indicates the percentage change in a certain parameter that would reduce the Expected Internal Rate of Return (EIRR) equal to the opportunity cost of capital, or Net Present Value (NPV) to zero. The sensitivity indicator is the ratio of percentage change in the NPV divided by the percentage change in the parameter. If the sensitivity indicator is larger than one, the relative change in the NPV is larger than the relative change in the parameter and the project results are sensitive to changes in the parameter. Table 19 shows the results of the analysis.
Table 19. Sensitivity Analysis
SCENARIO 1: 20% increase in cost SCENARIO 2: 20% decrease in benefits Subproject Type Expected
NPV Switching
Value Sensitivity Indicator
Expected NPV
Switching Value
Sensitivity Indicator
Level II Water Pump 2,197,627 193% 1 1,707,307 -66% -2 Level II Water Gravity 2,343,271 229% 0 1,829,702 -69% -17 Road Improvement -225,237 9% 12 -259,221 -8% -2 Road Construction 484,363 40% 2 292,967 -29% -7 School Building -150,732 4% 23 -159,278 -4% -1 Health Center 109,857 38% 3 63,071 -27% -7 Day Care Center -5,716 19% 5 -25,940 -16% -4 Overall Project -136,328,532 18% 6 -330212523.3 -15% -4
The results show that the investment cost in water systems could rise substantially and still make the project economically feasible. Other initially beneficial subprojects also remain beneficial, but cost increases for school buildings and road construction should be closely monitored. The results further show that the economic returns of all subprojects react more strongly to decreases in the annual benefit stream than to increases in investment cost. Except for school buildings and road construction, all other SPs are particularly sensitive to a 20 percent decrease in benefits. It is thus important to consider the incremental number of direct beneficiaries for these SPs to ensure a critical mass. Overall, the Project is sensitive to a 20 percent increase in costs, underscoring the need to carefully monitor costs, and to a 20 percent decrease in benefits, underscoring both the need to consider the number of beneficiaries in the choice of SPs and to focus on O&M to realize Project benefits.
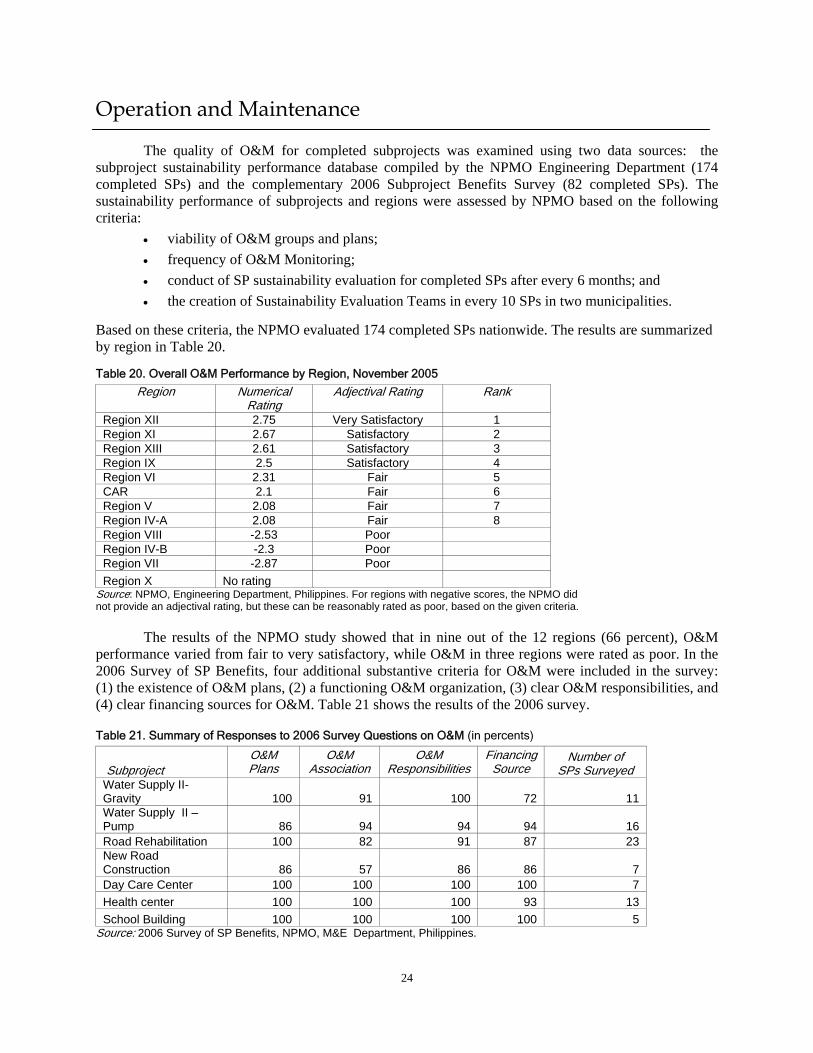
24
Operation and Maintenance
The quality of O&M for completed subprojects was examined using two data sources: the subproject sustainability performance database compiled by the NPMO Engineering Department (174 completed SPs) and the complementary 2006 Subproject Benefits Survey (82 completed SPs). The sustainability performance of subprojects and regions were assessed by NPMO based on the following criteria:
• viability of O&M groups and plans; • frequency of O&M Monitoring; • conduct of SP sustainability evaluation for completed SPs after every 6 months; and • the creation of Sustainability Evaluation Teams in every 10 SPs in two municipalities.
Based on these criteria, the NPMO evaluated 174 completed SPs nationwide. The results are summarized by region in Table 20.
Table 20. Overall O&M Performance by Region, November 2005
Region Numerical Rating
Adjectival Rating Rank
Region XII 2.75 Very Satisfactory 1 Region XI 2.67 Satisfactory 2 Region XIII 2.61 Satisfactory 3 Region IX 2.5 Satisfactory 4 Region VI 2.31 Fair 5 CAR 2.1 Fair 6 Region V 2.08 Fair 7 Region IV-A 2.08 Fair 8 Region VIII -2.53 Poor Region IV-B -2.3 Poor Region VII -2.87 Poor Region X No rating
Source: NPMO, Engineering Department, Philippines. For regions with negative scores, the NPMO did not provide an adjectival rating, but these can be reasonably rated as poor, based on the given criteria.
The results of the NPMO study showed that in nine out of the 12 regions (66 percent), O&M performance varied from fair to very satisfactory, while O&M in three regions were rated as poor. In the 2006 Survey of SP Benefits, four additional substantive criteria for O&M were included in the survey: (1) the existence of O&M plans, (2) a functioning O&M organization, (3) clear O&M responsibilities, and (4) clear financing sources for O&M. Table 21 shows the results of the 2006 survey.
Table 21. Summary of Responses to 2006 Survey Questions on O&M (in percents)
Subproject O&M Plans
O&M Association
O&M Responsibilities
Financing Source
Number of SPs Surveyed
Water Supply II-Gravity 100 91 100 72 11 Water Supply II – Pump 86 94 94 94 16 Road Rehabilitation 100 82 91 87 23 New Road Construction 86 57 86 86 7 Day Care Center 100 100 100 100 7 Health center 100 100 100 93 13 School Building 100 100 100 100 5
Source: 2006 Survey of SP Benefits, NPMO, M&E Department, Philippines.

25
Although generally positive, the mixed findings on O&M quality need closer attention, since the Project’s economic viability is sensitive to the reduction in benefits due to poor O&M. For Level II gravity-driven water supply SPs, all of the 11 SPs surveyed were reported to have O&M plans and clear responsibilities. Most have functioning O&M associations. For water-pump SPs, most of the 16 SPs surveyed were reported to have O&M plans, a functioning association, plus clear O&M responsibilities and sources of financing. The story is the same for day care centers, school buildings, and health centers.
However, the O&M picture is different for road construction and rehabilitation SPs. Only 57 percent of road construction SPs surveyed had an O&M association, while 86 percent had O&M plans, a division of responsibilities, and financing. This is possibly because of the confusion over the role of the barangay government and users in O&M for barangay roads. That is, it is unclear whether there is a need to organize an O&M association for a public good such as a barangay road, where exclusion is relatively difficult, compared to toll goods such as water supply, health centers, and school buildings.
O&M financing is also less clear for gravity-driven water supply and road SPs. For water-supply SPs, only 72 percent of those surveyed had clear sources of financing. This was also reflected in the fact that in the 2006 survey, most water-supply SPs had little data on financing sources, indicating that this criteria is not being monitored. The only instance where O&M cost sharing for gravity-driven water supply is clear is in the case of the Province of Davao del Norte. Gravity-driven water supply is more likely to be perceived as a free good (i.e., the water supply is not a constraint) and thus the incentive to contribute to its O&M is lower than the incentive for a pump-driven SP, which will not operate if users do not pay the cost of fuel and equipment maintenance. Similarly, unless converted into a toll good, the problem of free riding in the payment of O&M fees for a public good such as road maintenance will always be a problem. Furthermore, road user fees for barangay roads may not be a feasible financing scheme in terms of transaction costs.
While the Project reports that some 1,200 O&M associations have been formed and have O&M plans, the key issue is the financing and compatibility of incentives. It remains to be seen whether project-induced O&M associations will do better than similar associations for other projects (some of which folded up after project completion). The expectation is that the Project’s investments to improve local governance and empowerment will increase SP ownership and thus lead to better O&M. To test this hypothesis, O&M ratings were compared with ex ante indicators of community participation and local governance, based on the 2003 baseline data. These indicators include membership in local organizations, extent of bayanihan, and dependence on local leaders (see Table 22).
A preliminary correlation analysis (Table 23) shows that membership in local organizations and bayanihan are strongly and positively correlated with O&M ratings. Participation in barangay assemblies is also positively but moderately correlated with O&M. Not surprisingly, greater reliance on the Barangay Captain for decision making on barangay issues is negatively correlated with O&M ratings. These preliminary findings lend support to the expectation that Project investment in strengthening community participation and local governance is positively associated with better subproject O&M, implying a higher likelihood that the expected stream of benefits will be realized.
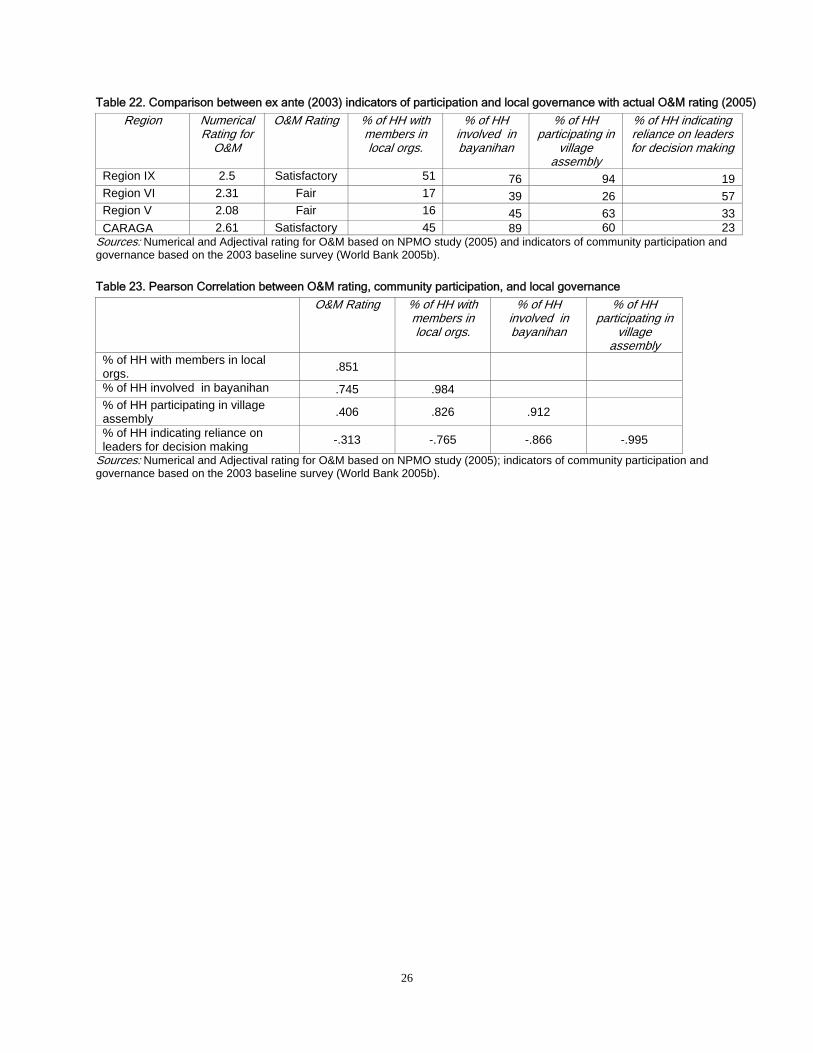
26
Table 22. Comparison between ex ante (2003) indicators of participation and local governance with actual O&M rating (2005)
Region Numerical Rating for
O&M
O&M Rating % of HH with members in local orgs.
% of HH involved in bayanihan
% of HH participating in
village assembly
% of HH indicating reliance on leaders for decision making
Region IX 2.5 Satisfactory 51 76 94 19 Region VI 2.31 Fair 17 39 26 57 Region V 2.08 Fair 16 45 63 33 CARAGA 2.61 Satisfactory 45 89 60 23
Sources: Numerical and Adjectival rating for O&M based on NPMO study (2005) and indicators of community participation and governance based on the 2003 baseline survey (World Bank 2005b). Table 23. Pearson Correlation between O&M rating, community participation, and local governance
O&M Rating % of HH with members in local orgs.
% of HH involved in bayanihan
% of HH participating in
village assembly
% of HH with members in local orgs. .851
% of HH involved in bayanihan .745 .984 % of HH participating in village assembly .406 .826 .912
% of HH indicating reliance on leaders for decision making -.313 -.765 -.866 -.995
Sources: Numerical and Adjectival rating for O&M based on NPMO study (2005); indicators of community participation and governance based on the 2003 baseline survey (World Bank 2005b).

27
Fiscal Analysis
Crowding out of government funding for the Project is possible in the future, given the country’s external debt of close to 80 percent of annual GDP. However, this is likely to be mitigated by recent fiscal policy reforms adopted by the national government, notably the expanded value added tax and other expenditure reforms.
Local counterpart contributions from local governments (at the province, municipality, and barangay level), communities, and private sources constituted 35 percent of total project cost in Phases 1 through 3a. Community counterpart contributions, mostly in kind, accounted for 9.5 percent of total project costs. These contributions are unlikely to have materialized without the Project and hence represent a crowding in of resources. On the other hand, counterpart contributions from local governments and NGO donors (24.5 percent of total project cost) are likely to be diverted from other uses and does not present new resources. For instance, for local government units (LGUs) that contributed more than their budgets for social welfare, it is likely that resources from other sectors were diverted to the Project. However, the success of the Project in mobilizing at least 35 percent of total project costs from counterpart sources would suggest that these resources have been used more efficiently and have higher rates of return than had they been spent for popular projects, such as a basketball court or the concreting of roads in downtown centers.

28
Cost Effectiveness
INFRASTRUCTURE SUBPROJECTS
To determine the cost effectiveness of KALAHI-CIDSS infrastructure, comparisons were made with similar infrastructure projects implemented by other government agencies of the Philippines. To estimate the average direct unit cost per SP for KALAHI-CIDSS, the total direct cost per SP (Total Grant + Total Local Counterpart Contribution) was divided by the average number of units per SP, as reported in the NPMO database. For rural roads, for example, on average there were 2.21 km per SP, and an average floor area of 123 m2 per school building. Table 24 reports on these estimates, while Table 25 shows the comparison with other government-implemented infrastructure.
Table 24. Average Direct Unit Cost Estimates for SPs (monetary values in PHP)
SP No. of SPs
No. of Units Unit
Ave. unit/ SP SP Grant
Local Counterpart
Total Direct Cost
Ave. Direct Unit Cost
Rural Road 436 965.01 kms 2.21 493,548,780 302,142,073 795,690,853 824,539 Water Supply 374 374.00 System 1.00 276,710,391 137,423,662 400,134,053 1,069,877 School Building 117 14503.32 Sq.m 123.96 75,343,299 32,594,037 107,937,336 7,442 Health Center 143 7425.55 Sq.m 51.93 59,407,054 23,419,546 82,826,600 11,154 Day Care Center 104 5160.00 Sq.m 49.62 38,704,588 16,033,991 54,738,579 10,608
Source: NPMO SP Database, December 2005; authors’ calculations.
Table 25. Cost Comparison: KALAHI and Traditional Infrastructure Projects
Infrastructure Type Unit KALAHI Benchmark 1/
Benchmarks from “traditionally” implemented comparable govt. projects
Difference (PHP/unit)
Level II Water System PHP/househld 4,331 7/
15,000-18,000 2/ 10,669-13,669
Road Rehabilitation PHP/km 824,539 900,000-2,000,000 3/ 7,5461-1,175,461 School Building 6/ PHP/m2 7,442 8,036 4/ 594 Health Center 6/ PHP/m2 11,154 20,000 5/ 8,846 Day Care Center 6/ PHP/m2 10,608 8,500 -2,108
Notes: 1/ Total Direct Cost (SP Grant + LCC) / No. of Units/ SP based on updated SP Database (see Annex 5 ). 2/ Based on Department of Interior and Local Government, research by NPMO. 3/ Based on Department of Public Works and Highways, research by NPMO. 4/ Based on Department of Education, research by NPMO Engineering Department. 5/ Based on Department of Health, research by NPMO Engineering Department. 6/ Includes amenities. 7/ Cost per household computed as follows: average direct cost per system / no. of beneficiary households. Source: NPMO, various.
In general, except for day care centers, unit costs for the Project were lower compared to those of other government agencies. Road and water supply SPs implemented by the Project have considerably lower unit costs compared with roughly similar infrastructure SPs implemented by other government agencies. This is also the case for the KDP-1 Project in Indonesia, where costs are about 20 to 30 percent lower than government-implemented infrastructure (World Bank 2005b). The unit costs for the Project are lower because it does not have to pay the costs for road rights of way, a contractor's profit (estimated at 15–20 percent of project cost), or the 10 percent value added tax for contractors.
29
INDIRECT COSTS
While the unit costs for infrastructure subprojects can be reasonably compared, this is not the case when comparing the cost structure of community-driven development projects more generally. Projects differ in objectives and implementation arrangements. There is, moreover, an inherent difficulty in determining the value of investments to strengthen community participation and local governance. Concerns about the costs of social preparation and capacity building can, moreover, be misplaced. These investments—as shown in the preceding analysis—can generate both quantifiable benefits, such as more efficient allocation of resources through closer matching of the demand for and supply of local public goods, better O&M, higher levels of bayanihan, more equitable access to local goods, and better access to information.

30
Conclusions and Recommendations The following conclusions can be drawn from the preceding analysis.
1. The Project overall is economically beneficial and all major subproject categories met the prescribed hurdle rate of 15 percent.
2. The Project overall is sensitive to a 20 percent cost escalation and a 20 percent benefit reduction, with some subprojects more sensitive than others.
3. Investments by the Project to strengthen community participation and local governance are likely to be beneficial.
4. The Project appears to be responsive to community demand. Municipal governments are also responding well to demands for counterpart funding, but the level of commitment appeared to decline in the second cycle.
5. In terms of Operation and Maintenance (O&M), 9 out of 12 regions received ratings from fair to very satisfactory, while three others face some challenges, particularly those in the mountainous Cordillera Region. Financing sources and assignment of roles remain unclear for subprojects with public goods characteristics (e.g., roads), but this is not a problem for subprojects with toll good characteristics (i.e., schools, health centers, and day care centers). It also remains to be seen whether the 1,200 O&M associations organized under the Project will continue to function after Project completion. Investments to strengthen community participation and local governance are likely to be positively associated with better O&M.
6. The possible crowding out effect from the Project is small and likely to be mitigated by the fiscal reforms of the national government. Community counterpart funding represents a “crowding in” of resources, since such resources are unlikely to have been mobilized without the Project. Local government counterpart contributions do not represent new resources, since they are likely to have been diverted from other sources.
7. Finally, the Project appears to be cost effective in terms of infrastructure unit cost when compared with other, traditionally implemented, comparable infrastructure projects. Cost comparison with other community-driven projects is generally difficult because of differences in objectives and implementation arrangements.
RECOMMENDATIONS
Based on the preceding findings and analysis, three major recommendations are suggested.
1. Monitor Cost Levels. The economic viability of the Project is highly sensitive to a 20 percent cost escalation. The Project therefore needs to closely monitor cost levels for individual subprojects, as well as indirect costs. The current proportion of SP grants and indirect costs, 57 percent and 43 percent, respectively, should be capped and maintained, if not improved. Project management costs, if not closely monitored, can easily escalate to levels that would render the Project economically unbeneficial. It is recommended that guidelines be issued for this purpose.
One way to control costs is to ensure that local governments continue to meet current levels of local counterpart contributions (e.g., at least 25 percent of total project costs). In dealing with local

31
governments in the future, it is recommended that the Project secure upfront the commitment for counterpart funds for both Cycles 1 and 2. The current trend is that municipal LGUs tend to give high levels of counterpart commitments in Cycle 1, a commitment that declines in Cycle 2 by as much as 41 percent in Phase 1 and 8 percent in Phase 2.
Another way to control costs is to broaden the number of provincial governments contributing to local counterpart funds. At present, only a handful have contributed counterpart funds, an anomaly considering that provincial governments have considerable resources compared to municipal governments. It is recommended that the Project consider asking provincial governments for multiyear resource commitments for investment and O&M counterpart funding.
2. Closely Monitor O&M. The overall economic viability of the Project is also highly sensitive to a 20 percent decrease in benefits. It is therefore crucial to invest resources in closely monitoring O&M. The Project has already taken initial steps for this purpose. In the future, it is recommended that the Project consider giving more weight to other substantive criteria, including:
• Financing for O&M, including developing the financial management capacity of O&M associations for simple bookkeeping and basic training on technical issues for O&M. This is particularly important for operation-intensive SPs, such as water supply projects. Sharing of O&M experiences among barangays would also be beneficial.
Clear assignment of responsibilities through Memorandum of Agreements between O&M associations and Barangay local governments and other concerned government agencies. For instance, to ensure that school buildings, health centers, and day care centers are properly operated, O&M associations in a barangay would enter into a MOA with concerned agencies to ensure that operating budgets for these facilities were made available. It is also crucial that the members of the O&M associations have a clear understanding of the mission and objectives of their work.
O&M counterpart contributions from local governments. It appears that counterpart contributions from provincial, municipal, and barangay governments are necessary for the O&M of road projects because of their public goods characteristic and lumpy investment requirement. It is recommended that the Project consider this possibility when dealing with local governments in the next phases and cycles of the Project. The O&M challenge is particularly acute in the Cordillera Region.
Multiyear O&M counterpart funding from municipal and provincial local governments for Barangay road projects. Such funding should be packaged as a matching grant with a maintenance-of-effort requirement (i.e., the matching grant will be released contingent on satisfactory O&M levels by the barangay).
It is also recommended that the Project raise the awareness of Area Coordination Teams (ACTs) about the importance of good O&M plans at an early stage in project design. This is not simply a project compliance requirement, but a necessity for getting the full commitment of beneficiaries regarding their in-kind and cash contributions during the O&M phase. In the particular case of water systems, there is a need to set tariffs that respond to the actual cost of water from the very early stages of operation. Field observations, together with the Sustainability Evaluation, show that water system associations that do not charge an initial tariff that corresponds to the actual cost of water have problems convincing users to increase payments after a few months of operation.
3. Continue to Improve Data Quality. The Project has made considerable efforts to improve data quality in terms of reconciling local counterpart contributions, updating the SP database, conducting O&M monitoring, and undertaking community-based evaluations. These efforts should be sustained.

32
Considering the experience of the 2006 SP Benefit Survey, further refinements are recommended in terms of metric consistency and data completeness. It is also recommended that field staff be trained in this areas. The Project might also consider hiring a third party to independently collect and analyze data on project benefits to strengthen the validity of its evaluation. Finally, the Project might wish to consider using the 2006 SP Benefit Survey Questionnaires as part of its regular data collection format for use in subsequent economic analysis.
33
Annexes
ANNEX 1: PROJECT DESCRIPTION 8
1) Objectives KALAHI seeks to empower communities by enhancing their participation in village-level governance. Community members are involved in designing, implementing, and managing development activities that reduce poverty. The objective is to use improved local governance to reduce poverty by:
• Empowering communities through participatory planning, implementation, and management of local development activities
• Improving local governance by strengthening formal and informal institutions to become more inclusive, accountable, and effective
• Providing seed funds for community investment programs.
2) Principles The KALAHI is based on the following principles:
Localized Decision-Making. All decisions about community projects are taken in public forums and meetings.
Empowerment. Communities take ownership of all aspects of projects, from planning and decision-making to implementation.
Transparency. The community knows every aspect of project decision-making. Financial management of project funds is open and shared with the entire community.
Consensus-building. Villages in a municipality submit proposals to inter-village forums for funding. Representatives of the local people prioritize the proposals in the forums based on collectively agreed criteria. Proposals will need to be prioritized because the forums receive more proposals than they can fund.
Institutional Capacity-Building. Formal and informal institutions working in the villages and municipalities will be encouraged to participate in project planning, implementation, and maintenance.
Demand-Driven. Options for community projects are based on open menus. Communities can ask for funding for any development activity they want, except environmentally and socially
8 Source: World Bank 2005. Economic Analysis Update for Kalahi-CIDSS

34
harmful activities. The latter are specified in a negative list (e.g. “weapons, chainsaws, explosives”) prepared by the national management team.
Socially Inclusive. Whole communities—not just a few families—have the opportunity to be involved in decision-making. Special efforts are taken to ensure the active participation of women and the poor.
Simplicity. All decision-making, financial procedures, and rules of the project, are simple so that local people can easily understand them and become fully involved.
Sustainability. Operation and maintenance plans are prepared prior to project implementation. At the municipal level, local governments are encouraged to adopt community-driven approaches.
3) Organization The Department of Social Welfare and Development (DSWD) serves as KALAHI’s executing agency, and the department’s National Programs and Operations Bureau has overall management responsibility. The national project manager, who handles KALAHI operations on a day-to-day basis, reports to the KALAHI national project director. The regional offices of the DSWD are responsible for implementing KALAHI at the local level. A full-time regional project manager in each regional office is responsible for implementation. The regional manager, with assistance from other regional staff, supervises municipal-level area coordination teams. A National Steering Committee chaired by the Secretary of the DSWD provides overall policy direction.
4) Main Components The Project has three main components: 1) Social preparation, capacity building, and implementation support, 2) Provision of community grants, and 3) Monitoring and evaluation.
Social Preparation, Capacity-Building, and Implementation Support. The KALAHI uses technical assistance to mobilize local communities to participate. It also utilizes training sessions and workshops to strengthen the capacity of local communities and local government units to initiate, plan, implement, manage, and supervise projects. Community mobilization is the responsibility of area coordination teams, at least one of which is fielded in every KALAHI target municipality.
Community Grants. The KALAHI provides grants to villages for community development projects and audits records, accounts, and financial statements of expenditure relating to implementation. The villages within a KALAHI municipality present proposals at an inter-village forum whose voting members are democratically selected village representatives. The forum determines which projects receive KALAHI funding by using a voting process that the members themselves formulate.
Monitoring and evaluation (M&E). M&E are designed to provide for continuous learning and adjustment of the project approach. This component of KALAHI involves:
• Participatory monitoring by communities;

35
• Internal monitoring of inputs, process, and outputs by the project management; • External monitoring and evaluation by consultants, civil society, and academia.
5) Flow of Funds Funds for community projects are released in tranches (usually in percentages of 50-40-10). Funds are transferred to a village account at the nearest branch of the Land Bank of the Philippines. Three signatures are needed to access the village account.
6) 16 Implementation Steps KALAHI projects are implemented in target communities in 3 phases, each consisting of four phases covering a total of 16 steps: Social preparation, project development, project selection, and project implementation. Each cycle consists of six to eight months of preparation (steps 1-13) and four to six months of implementation (steps 14-16). Figure 1 summarizes the implementation steps, Figure 1.1 provides more details on each of them.9
Figure 1.1 – KALAHI-CIDSS Implementation Steps
Project Developm ent
Project Developm ent
Social Preparation
Project Im plem entation
Project Im plem entation
Project Selection
Project Selection
M unicipal orientationon KALAHI-CIDSS
pro ject
M unicipal orientationon KALAHI-CIDSS
pro ject
Village orientation on KALAHI-CIDSS pro jectVillage orientation on KALAHI-CIDSS pro ject
Participatory situation Analysis (PCA)
Participatory situation Analysis (PCA)
Village assem bly validates PSA results
Village assem bly validates PSA results
Criteria setting for ranking SPs
Criteria setting for ranking SPs
Preparation of SP concepts
Preparation of SP concepts
Validation of SP conceptsValidation of SP concepts
Finalization of subproject (SP) concepts
Finalization of subproject (SP) concepts
Ranking of SPconcepts by m unicipal
inter-village forum (M IBF)
Ranking of SPconcepts by m unicipal
inter-village forum (M IBF)
Feedback to village assem bly on MIBF
SP ranking
Feedback to village assem bly on MIBF
SP ranking
Form ulation of detailed SP proposals
Form ulation of detailed SP proposals
Validation of detailedSP proposals
Validation of detailedSP proposals
Approval of detailedSP proposals by
MIBF
Approval of detailedSP proposals by
MIBF
Pre-im plem entationw orkshop
Pre-im plem entationw orkshop
SP im plem entationSP im plem entation
SP operations &m aintenance
SP operations &m aintenance10
11
12
13
14
15
16
1
2
3
4 5
6
7
8 9
Social Preparation Step 1. Municipal Orientation. KALAHI is launched in the municipality. A memorandum of understanding is signed between the DSWD and the municipality. A municipal interagency committee (MIAC) is created that serves as a mechanism for inter-department collaboration. The area coordination team, which serves as the KALAHI field team in each municipality, is deployed two months prior to the municipal launch.
9 At the time of writing, the DSWD were in the process of putting together a more flexible version of the 16 steps through a
“Community Empowerment Activity Cycle”.
36
Step 2. Village Orientation. The first village assembly is held in every village within the municipality. Villagers are briefed on KALAHI. Volunteers for conducting a participatory situation analysis (PSA) are selected by their peers.
Step 3. Participatory Situation Analysis. Volunteers discuss development issues affecting the community and prioritize them. The final output is the village action plan, including the top priority problem to be submitted for KALAHI funding.
Step 4. Validation of PSA Results. A second village assembly is held. The entire village validates the PSA results. The villagers elect the project preparation team (PPT) and village representative team (VRT).
Project Development Step 5. Criteria-Setting for Ranking of Subprojects. VRTs attend a workshop where they decide the rules and subproject ranking criteria for the municipal inter-village forum (MIVF). Criteria include poverty focus, sustainability, and local contributions.
Step 6. Preparation of Subproject Concepts. PPTs, VRTs, MIAC members, municipal technical staff, and local non-government organizations attend a workshop on subproject concept preparation. As a result, the subproject concept forms are prepared for each village through stakeholder consultations. A local resource mobilization strategy is formulated to generate contributions from villagers, local government, and line agencies.
Step 7. Validation of Subproject Concepts. A third village assembly is held. Each PPT publicly presents the subproject concept form for validation by the entire village.
Step 8. Finalization of Subproject Concepts. A workshop for all PPTs is held for refining the subproject concept based on inputs from the third village assembly. Presentation materials to be used in the first MIVF are prepared.
Project Selection Step 9. Ranking of Subproject Concepts by the Municipal Inter-village Forum. The first MIVF is held. PPTs present the subproject concepts and VRTs rank them. All the VRTs sign a resolution from the MIVF indicating the ranking as well as indicative funds allocated to prioritized subprojects. The mayor chairs the MIVF but does not vote.
Step 10. Feedback on the Results of Municipal Inter-village Forum Ranking. A fourth village assembly is held. The results from the first MIVF are presented to the village. The prioritized villages elect the members of the village subproject management committee.
Step 11. Formulation of Detailed Subproject Proposals. Village teams, assisted by the ACT and local government staff, prepare the draft detailed subproject proposal, which includes technical specifications and detailed cost estimates. Non-prioritized villages are also encouraged to undertake technical preparation.
Step 12. Validation of Detailed Subproject Proposals. A fifth village assembly is held. The draft detailed subproject proposal is presented to the entire village for validation.

37
Step 13. Approval of Detailed Subproject Proposals by the Municipal Inter-village Forum. A second MIVF is held. The detailed proposals are presented and assessed by the MIVF. After verification of the required supporting documents, the subprojects are approved for funding. Verification requires a commitment letter from the MIAC, signed by the mayor, for supply of software aspects such as staff.
Project Implementation
Step 14. Pre-implementation Workshop. Village teams, which are attached to the village development council, are trained in construction techniques, reporting, procurement, financial management, and operation and maintenance (O&M). Concerned local government staff members also receive training.
Step 15. Subproject Implementation. Village volunteer teams implement the subproject. During implementation, a detailed O&M plan is required for the release of the second installment of funds.
Step 16. Subproject Operation and Maintenance. The village implements the O&M plan. An O&M monitoring team comprising municipal officers and the ACT tracks progress.
ANNEX 2: GENERAL METHODOLOGY, PARAMETERS AND ASSUMPTIONS OF ECONOMIC ANALYSIS
38
1. Identification of economic costs and benefits. Project costs and benefits were evaluated in terms of their addition to or reduction of the national income. Economic costs are those costs that involve the use of real resources while economic benefits constitute an increase in output or savings in real resource use. In addition to direct project benefits, project externalities involving a significant economic cost or that confer a significant economic benefit were also taken into account in estimating the overall economic impact of the project.
2. Valuation of economic costs. The entire set of project inputs were differentiated between those which reduce the supply to other users, and those inputs that would be supplied from increased production. In a relatively open economy, such as the case of the Philippines, it is assumed that the supply of inputs were obtained from expanded production and thus the relevant cost estimate employed was the actual cost of production. For some inputs that are imported, or are substitutes for exports, the foreign exchange cost involved, corrected by the shadow price of foreign exchange, was estimated and transport costs and trade service margins added.
3. Valuation of Economic Benefits. Estimation of direct benefits involved the following steps: For outputs leading to additional supply or reducing the output of other local producers, the shadow price is the market price. For goods that substitute for imports or add to exports, foreign exchange earnings or savings involved are estimated and corrected by shadow price of foreign exchange.
4. Price Adjustments. Financial prices were adjusted accordingly to reflect their economic values and account for distortions. The following parameters were used for price adjustments.
4.1 Shadow foreign exchange rate (SER). The SER, currently pegged by NEDA at 1.20, was used to correct for distortions and was applied to all direct and indirect foreign exchange costs of a project. It was also used for those benefits which may be expressed in foreign exchange, particularly in the case of exports and/or import substitutes such as paddy.
4.2 Shadow Wage Rate. The shadow wage rate (SWR), currently pegged by NEDA at 0.6 of legislated wage for labor, was used to reflect the true economic value of unskilled labor employed in the project. In the watershed management and development component, the labor component accounts for 60% of total investment cost for agroforestry projects based on DENR guidelines (2001).
4.3 Shadow Discount Rate. The social discount rate (SDR), currently pegged by NEDA at 15%, was used to discount the stream of economic costs and benefits to their net present values. The SDR was also used, as required by NEDA, as the hurdle rate for the Project’s EIRR.
4.4 Project Costs. Project costs were distinguished in terms of foreign costs, local costs and taxes. Foreign cost components were valued in constant 2004 prices.
5. Economic desirability. The indicators used to estimate the economic desirability of the Project were the economic internal rate of return (EIRR) and the NPV. The decision rule

39
prescribed by NEDA is to accept a project where the EIRR is greater than the hurdle rate of 15% and the NPV is greater than zero.
6. Sensitivity analysis Sensitivity analysis was undertaken following the scenarios prescribed by NEDA-ICC
20% Cost Escalation 20% Reduced Project Benefits
7. Fiscal Impact and Sustainability The fiscal impact and sustainability of the project including incentives for operation and maintenance was ascertained with attention to the following: a) the incremental taxes and fees that would result from the Project; b) the operation, maintenance and financing plan for various project components; c) the government’s current fiscal situation; and d) the availability and reliability of counterpart funds for the project.
8. Cost Comparison The cost of the Project’s infrastructure SPs were compared with benchmark costs from similar
projects traditionally implemented by other government agencies such as the Department of Public Works and Highways and the Department of Education.

40
ANNEX 3 DESIGN SPECIFICATIONS OF GENERIC SUBPROJECTS IN KALAHI-CIDSS
Subprojects Specifications Unit Cost (PHP) Type Project LifeLevel II Water System –(Pump Driven)
To serve an average of 15 households per unit of Tapstand (P3000/tapstand)
914,767/unit Level II 5-10 years
Designed to deliver at least 60 liters per capita per day (lpcd)Farthest user is not more than 250 m. from tapstand. Tapstand must be installed with water meter.Reinforced Concrete Elevated Reservoir Tank for storage purposes with minimum capacity of 10.00 – 20.00 cu.m.A minimum 4.00 sq.m. pump house with fencing to secure the 1.5. HP centrifugal pump and other electrical fixtures.
Distribution pipes used such as Polythelene Pipes or uPVC pipes must be embedded at least 30 cm from natural ground.Adopt 100 mm O of steel casing with 50 mm O of G.I. intake pipe with suction rod, 100 mm O of low carbon steel screen and 10 mm O gravel packing materials; all G.I. pipes shall have a minimum strength equivalent to schedule 40
Level II Water System –(Gravity Fed)
Good for 250 HHs (P8000/HH). Communal faucet to serve an average of 4 to 6 households
829,357/unit Level II 5-10 years
Communal faucets shall be of heavy duty brass type supported by a reinforced concrete pedestal provided with 1.0m x 1.20m concrete apron as base. Water meter is also required to be installed within the tapstand area.Spring box shall be made of 3000 psi reinforced concrete mixed with water proofing compound adopting any of the five (5) types (A to E) recommended by LWUA for specific spring locationAll uPVC pipes and Polythelene pipes used must be embedded at a minimum of 30 cms. Below natural ground. Concrete pedestal support must be provided for sections were pipes are exposed and hanging particularly for G.I. pipes.
Road Improvement -Barangay and / or Farm toMarket Road
4.00 m. wide carriageway with 1.00 m. shoulder and trapezoidal drainage ditch on both sides. Laying of 15 cms thick compacted Base course materials (Item 201) on top of Sub-grade preparation (Item 105) and/or Embankment item (Item 104). Provision of lateral cross drains (Pipe culverts or box culverts) on identified waterways and headwalls is required. Concreting of critical slopes more than 12% gradient is also recommended by the project.
860,396/km All weather Road
3-10 years
Road Construction Clearing and grubbing of roadway for a minimum of 6.00-7.00 meters width is required to define the traverse of road. Excavation of earth materials above the design grade is necessary and filling and compaction for below the design grade line. Depending on the type of existing top soil, provision of aggregate sub-base course materials (Item 200) and aggregate sub-base course (Item 201) at 4.00 meters width will be considered. Installation of lateral cross drains (Pipe culverts or box culverts) on identified waterways and headwalls is required. Concreting of critical slopes more than 12% gradient is also recommended by the project. Construction of lined or earth canals on critical slopes must done to avoid water run-off damaging the roadway.
955,498/km All weather Road
3-10 years
5,071/m2 or851,847/subproject
7,118/m2394,319/subproject
7,141/m2 or 385,625/subproject
Source: KALHI-CIDSS NPMO, Engineering Department.
Designed to deliver at least 60 liters per capita per day
A 1.5 HP submersible pump is used for underground water source.
Construction of ground reinforced concrete water reservoir with a minimum capacity of 10-20 cu.m as storage tank if necessary.
Farthest house shall not be more than 250 m. from the tapstand (communal faucet)
School Building Standard floor area of 56.00 sq.m (7.0mx8.0m) for each classroom is constructed by the project. Reinforced concrete foundations, columns, beams with a minimum concrete strength of 3000 psi with concrete masonry for walls are required for each classroom. Depending on the availability of materials, steel trusses or wooden trusses with G.I. roofing and ceiling is provided. Flush type doors and glass jalousies for windows are also installed. Provisions of tables and chairs can also be funded by the project depending on the Operation and Maintenance arrangement of the community.
Concrete Structures
5-15 years
Barangay Health Station Standard floor area of 48.00 sq.m (6.0mx8.0m) for each unit is constructed by the project. Reinforced concrete foundations, columns, beams with a minimum concrete strength of 3000 psi with concrete masonry for walls are required for each classroom. Concrete romp Depending on the availability of materials, steel trusses or wooden trusses with G.I. roofing and ceiling is provided. Flush type doors and glass jalousies for windows are also installed. Provisions of tables and chairs can also be funded by the project but depending on the Operation and Maintenance arrangement of the community. Provision of romp area for wheel chair at the entrance of the center.
Concrete Structures
5-15 years
Day Care Centre Standard floor area of 48.00 sq.m (6.0mx8.0m) for each unit is constructed by the project. Reinforced concrete foundations, columns, beams with a minimum concrete strength of 3000 psi with concrete masonry for walls and partitions. Depending on the availability of materials at the area, steel trusses or wooden trusses with G.I. roofing and ceiling is provided. Flush type doors and glass jalousies for windows are also installed. Provisions of tables and chairs can also be funded by the project but depending on the Operation and Maintenance arrangement of the community
Concrete Structures
5-15 years

41
ANNEX 4.1 SUB-PROJECT BENEFIT SURVEY QUESTIONNAIRE
Kalahi Midterm Project Review
Survey of SP Benefits: Water System (Gravity) Province / Municipality / Barangay: ____________________/ _____________________/______________________ Surveyed By/ date: __________________________ Benefits Benefit as Described in Project Completion Reports
Indicators Unit Before After
Per day and household, average time in minutes that adults spend on fetching drinking water
Minutes/day Time savings in fetching water that can be used for productive activity
Per day and household, average time in minutes that children spend on fetching drinking water
Minutes/day
Per month and household, average number of sick adult persons because of waterborne diseases
Days/months Reduced incidence of waterborne diseases
Per incidence, average number of days sick and unable to work
Days/incidence
Increase in water consumption per capita
Per day and household, liters of drinking water consumed per day
Liter / household and day
Cost savings on water Cost of drinking water in PHP/ liter PHP/liter Savings in Operations and Maintenance Cost
Operations and Maintenance Cost per year (PHP) PHP/year
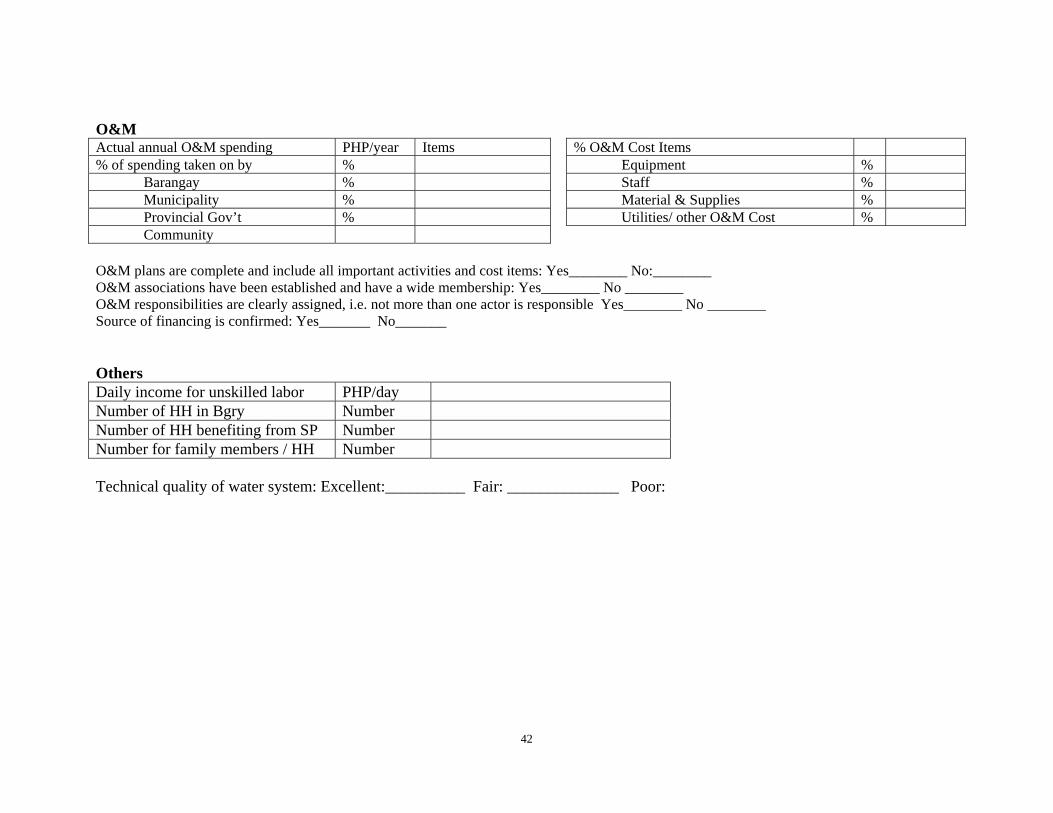
42
O&M Actual annual O&M spending PHP/year Items % O&M Cost Items % of spending taken on by % Equipment % Barangay % Staff % Municipality % Material & Supplies % Provincial Gov’t % Utilities/ other O&M Cost % Community
O&M plans are complete and include all important activities and cost items: Yes________ No:________ O&M associations have been established and have a wide membership: Yes________ No ________ O&M responsibilities are clearly assigned, i.e. not more than one actor is responsible Yes________ No ________ Source of financing is confirmed: Yes_______ No_______
Others Daily income for unskilled labor PHP/day Number of HH in Bgry Number Number of HH benefiting from SP Number Number for family members / HH Number Technical quality of water system: Excellent:__________ Fair: ______________ Poor:

43
Kalahi Midterm Project Review
Survey of SP Benefits: Water System (Pump Driven) Province / Municipality / Barangay: ____________________/ _____________________/______________________ Surveyed By/ date: __________________________ Benefits Benefit as Described in Project Completion Reports
Indicators Unit Before After
Per day and household, average time in minutes that adults spend on fetching drinking water
Minutes/day Time savings in fetching water that can be used for productive activity
Per day and household, average time in minutes that children spend on fetching drinking water
Minutes/day
Per month and household, average number of sick adult persons because of waterborne diseases
Days/months Reduced incidence of waterborne diseases
Per incidence, average number of days sick and unable to work
Days/incidence
Increase in water consumption per capita
Per day and household, liters of drinking water consumed per day
Liter / household and day
Cost savings on water Cost of drinking water in PHP/ liter PHP/liter Savings in Operations and Maintenance Cost
Operations and Maintenance Cost per year (PHP) PHP/year

44
Kalahi Midterm Project Review
Survey of SP Benefits: Improvement Of Farm To Market Roads
Province / Municipality / Barangay: ____________________/ _____________________/______________________ Surveyed By/ date: __________________________
Benefits Benefit as Described in Project Completion Reports
Indicators Unit Before After
Per day, average number of people using road People/day Time savings Per trip, average time in minutes to destination and back Minutes/roundtrip Major crop for marketing (same before and after)
Number of farmers in barangay that use the road to transport agricultural products to market
Farmers
Per year and farmer, average quantity in kg of major crop transported to the market
kg / year
Cost savings to transport agriculture produce to market
Transport cost PHP/kg of major crop PHP/kg Major input hauled (same before and after) Number of farmers in barangay that use the road to haule agricultural inputs
Farmers
Per year and farmer, average quantity in kg of major input hauled
kg/year
Cost savings to transport agriculture inputs to production site
Transport cost per kg of input in PHP/kg PHP/kg Reduction in maintenance cost Per kilometer and year, maintenance cost in PHP/year PHP/year Increase in area of land cultivated Major crop Number of farmers cultivating major crop Farmers Per farmer, average area in hectares cultivated with major crop Ha Per harvest, average yield per hectare of major crop Kg/ha Per year and across all farmers, average number of harvests of cropping intensity
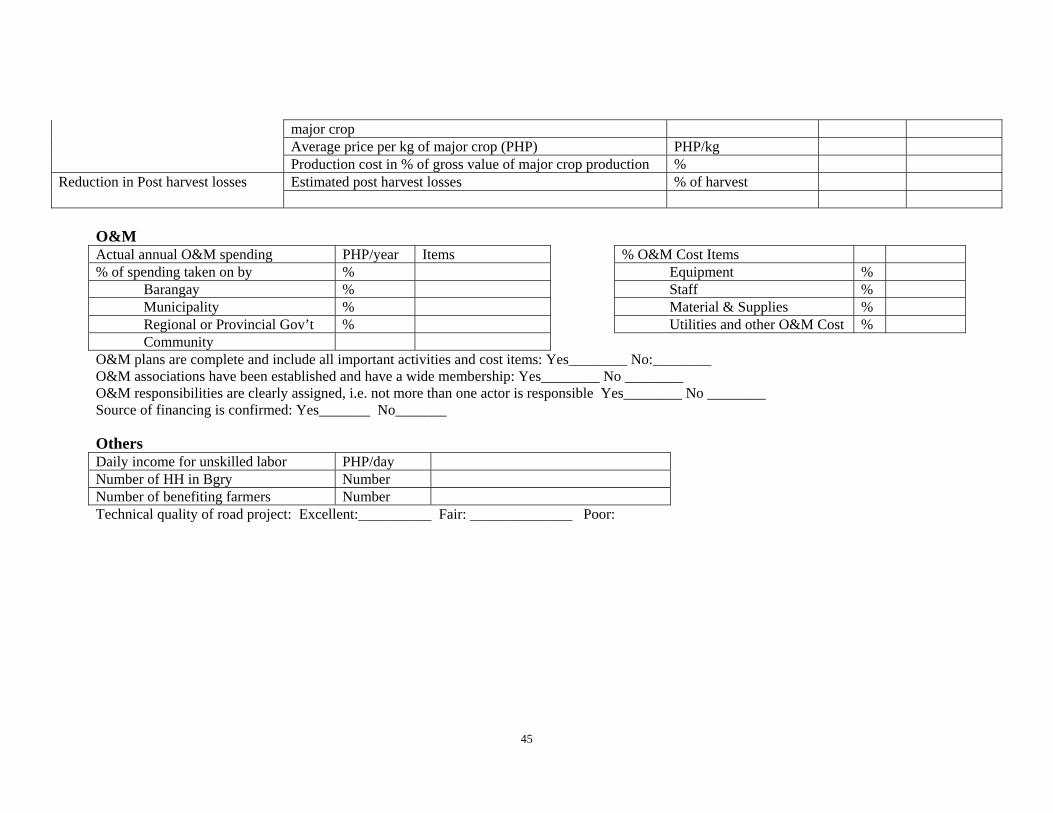
45
major crop Average price per kg of major crop (PHP) PHP/kg Production cost in % of gross value of major crop production % Reduction in Post harvest losses Estimated post harvest losses % of harvest
O&M Actual annual O&M spending PHP/year Items % O&M Cost Items % of spending taken on by % Equipment % Barangay % Staff % Municipality % Material & Supplies % Regional or Provincial Gov’t % Utilities and other O&M Cost % Community O&M plans are complete and include all important activities and cost items: Yes________ No:________ O&M associations have been established and have a wide membership: Yes________ No ________ O&M responsibilities are clearly assigned, i.e. not more than one actor is responsible Yes________ No ________ Source of financing is confirmed: Yes_______ No_______
Others Daily income for unskilled labor PHP/day Number of HH in Bgry Number Number of benefiting farmers Number Technical quality of road project: Excellent:__________ Fair: ______________ Poor:
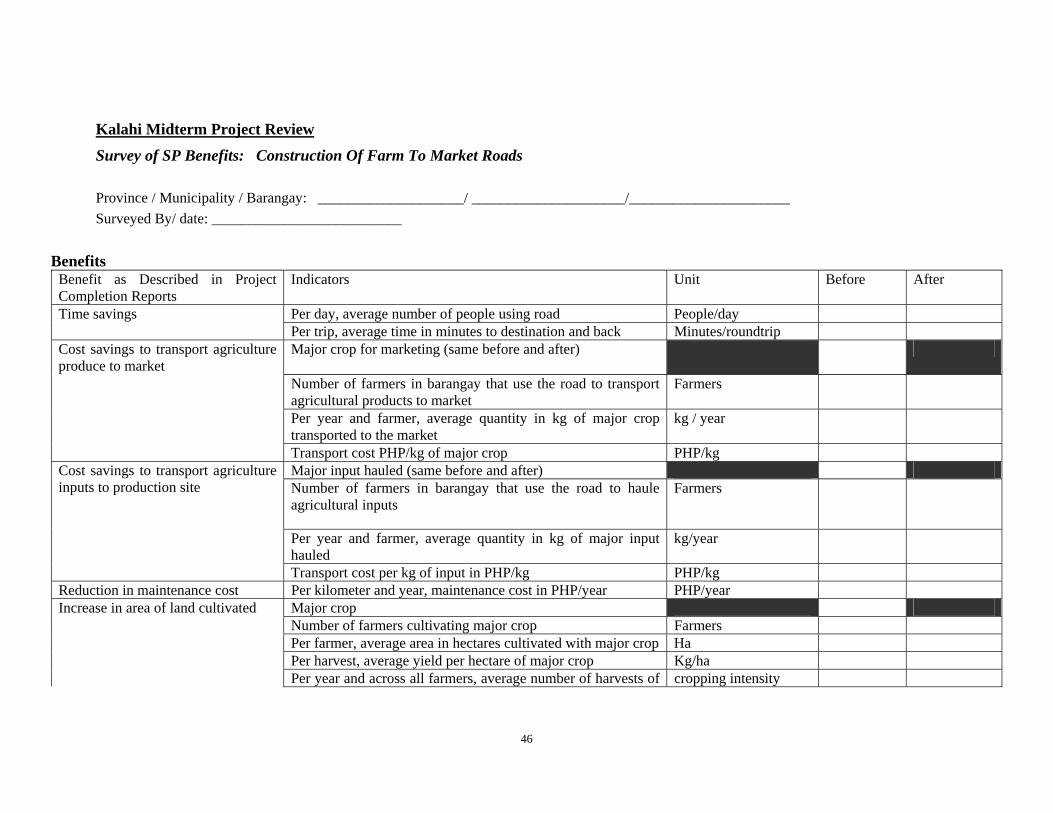
46
Kalahi Midterm Project Review
Survey of SP Benefits: Construction Of Farm To Market Roads Province / Municipality / Barangay: ____________________/ _____________________/______________________ Surveyed By/ date: __________________________
Benefits Benefit as Described in Project Completion Reports
Indicators Unit Before After
Per day, average number of people using road People/day Time savings Per trip, average time in minutes to destination and back Minutes/roundtrip Major crop for marketing (same before and after)
Number of farmers in barangay that use the road to transport agricultural products to market
Farmers
Per year and farmer, average quantity in kg of major crop transported to the market
kg / year
Cost savings to transport agriculture produce to market
Transport cost PHP/kg of major crop PHP/kg Major input hauled (same before and after) Number of farmers in barangay that use the road to haule agricultural inputs
Farmers
Per year and farmer, average quantity in kg of major input hauled
kg/year
Cost savings to transport agriculture inputs to production site
Transport cost per kg of input in PHP/kg PHP/kg Reduction in maintenance cost Per kilometer and year, maintenance cost in PHP/year PHP/year Increase in area of land cultivated Major crop Number of farmers cultivating major crop Farmers Per farmer, average area in hectares cultivated with major crop Ha Per harvest, average yield per hectare of major crop Kg/ha Per year and across all farmers, average number of harvests of cropping intensity

47
major crop Average price per kg of major crop (PHP) PHP/kg Production cost in % of gross value of major crop production % Reduction in Post harvest losses Estimated post harvest losses % of harvest
O&M Actual annual O&M spending PHP/year Items % O&M Cost Items % of spending taken on by % Equipment % Barangay % Staff % Municipality % Material & Supplies % Regional or Provincial Gov’t % Utilities and other O&M Cost % Community
O&M plans are complete and include all important activities and cost items: Yes________ No:________ O&M associations have been established and have a wide membership: Yes________ No ________ O&M responsibilities are clearly assigned, i.e. not more than one actor is responsible Yes________ No ________ Source of financing is confirmed: Yes_______ No_______
Others Daily income for unskilled labor PHP/day Number of HH in Bgry Number Number of benefiting farmers Number Technical quality of road project: Excellent:__________ Fair: ______________ Poor:

48
Kalahi Midterm Project Review
Survey of SP Benefits: School Building (Elementary / High School) Province / Municipality / Barangay: ____________________/ _____________________/______________________ Surveyed By/ date: __________________________
Benefits Benefit as Described in Project Completion Reports
Indicators Unit Before After
Higher enrollment rate / less drop outs
Enrollment rate (6-12 years children) in barangay school supported by K-C
Children
Drop-out rates in barangay (6-12 years children) school supported by K-C
O&M Actual annual O&M spending PHP/year Items % O&M Cost Items % of spending taken on by % Equipment % Barangay % Staff % Municipality % Material & Supplies % Regional or Provincial Gov’t % Utilities and other O&M Cost % Community O&M plans are complete and include all important activities and cost items: Yes________ No:________ O&M associations have been established and have a wide membership: Yes________ No ________ O&M responsibilities are clearly assigned, i.e. not more than one actor is responsible Yes________ No ________ Source of financing is confirmed: Yes_______ No_______
Technical quality of school building: Excellent:__________ Fair: ______________ Poor:

49
Kalahi Midterm Project Review
Survey of SP Benefits: Health Center Province / Municipality / Barangay: ____________________/ _____________________/______________________ Surveyed By/ date: __________________________
Benefits Benefit as Described in Project Completion Reports
Indicators Unit Before After
Per month, number of people in barangay using other health facility
Persons
Per month, number of people in barangay using new health facility
Persons
Per visit, average pay (PHP/visit) PHP/visit What would be the cost recovering price of a visit if the service was not subsidized?
PHP/visit
Number of individuals with access to health facility increased
Number of days per week that facility is open Days/week Per trip, ave. time (mins) to other health facility and back Minutes/roundtrip Time savings because facility is
closer Per trip, ave. time (mins) to new health facility and back Minutes/roundtrip O&M Actual annual O&M spending PHP/year Items % O&M Cost Items % of spending taken on by % Equipment % Barangay LGU % Staff % Municipality % Material & Supplies % Provincial Gov’t % Utilities/ O&M Cost % User Fees % O&M plans are complete and include all important activities and cost items: Yes________ No:________ O&M associations have been established and have a wide membership: Yes________ No ________ O&M responsibilities are clearly assigned, i.e. not more than one actor is responsible Yes________ No ________ Source of financing is confirmed: Yes_______ No_______ Technical quality of Health Center: Excellent:__________ Fair: ______________ Poor:
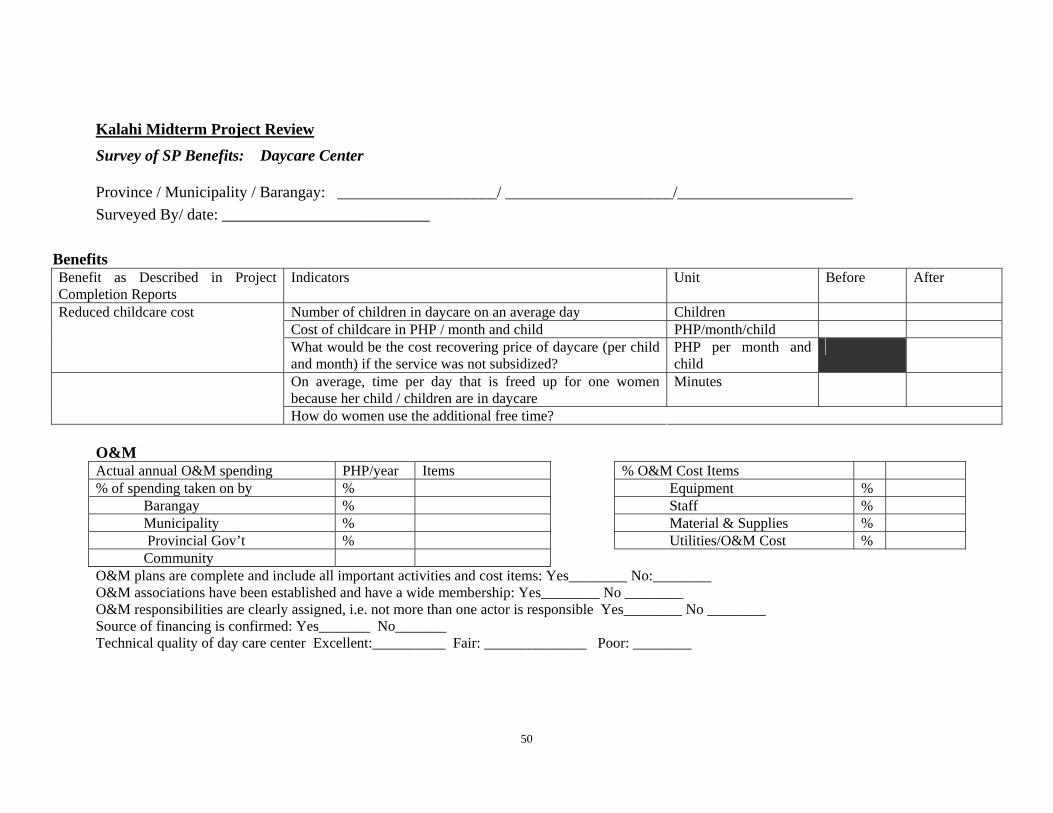
50
Kalahi Midterm Project Review
Survey of SP Benefits: Daycare Center Province / Municipality / Barangay: ____________________/ _____________________/______________________ Surveyed By/ date: __________________________
Benefits Benefit as Described in Project Completion Reports
Indicators Unit Before After
Number of children in daycare on an average day Children Cost of childcare in PHP / month and child PHP/month/child
Reduced childcare cost
What would be the cost recovering price of daycare (per child and month) if the service was not subsidized?
PHP per month and child
On average, time per day that is freed up for one women because her child / children are in daycare
Minutes
How do women use the additional free time? O&M Actual annual O&M spending PHP/year Items % O&M Cost Items % of spending taken on by % Equipment % Barangay % Staff % Municipality % Material & Supplies % Provincial Gov’t % Utilities/O&M Cost % Community O&M plans are complete and include all important activities and cost items: Yes________ No:________ O&M associations have been established and have a wide membership: Yes________ No ________ O&M responsibilities are clearly assigned, i.e. not more than one actor is responsible Yes________ No ________ Source of financing is confirmed: Yes_______ No_______ Technical quality of day care center Excellent:__________ Fair: ______________ Poor: ________

51
Kalahi Midterm Project Review
Survey of SP Benefits: Investment In Social Mobilization
CODE: 1 - Strongly agree; 2-agree; 3- no comment; 4- disagree; 5- strongly disagree In this Brgy, the benefits from KALAHI are strongly felt: _______
Bayanihan in our Barangay has been strengthened as a result of KALAHI _______
It is very likely that bayanihan in the Barangay due to KALAHI will be sustained many years from now _______
Households in this Brgy are now better informed about Brgy matters because of KALAHI ______
Trust among residents in this Brgy has improved because of KALAHI ________
People in this Brgy have become more confident to participate in Bgry affairs because of KALAHI ________.

52
ANNEX 4.2 SUBPROJECTS AND LOCATIONS COVERED BY 2006 SURVEY OF PROJECT BENEFITS
Water Supply Gravity Driven Location Survey Information Phase & Cycle
Region Province Municipality Barangay Surveyed by Survey Date Phase Cycle CAR Mt. Province Sadanga Sacasacan Esteban D. Dacsig 20-Jan-06 Phase 2 Cycle 1
CAR Ifugao Asipulo Haliap Christopher Bakakew 15-Jan-06 Phase 2 Cycle 2
CAR Ifugao Hingyon Poblacion No data 18-Jan-06 Phase 1 Cycle 1
VIII Western Samar Pinabacdao Mambog Charo Boco 17-Jan-06 Phase 2 Cycle 1
VIII Western Samar Jipapad Cagmanaba Rommel Villaruel 16-Jan-06 Phase 2 Cycle 1
VIII Eastern Samar Sulat Aet Jonathan Acelo 17-Jan-06 Phase 1 Cycle 2
IX Zambonga Del Norte Siayan Sayaw Flordeliza Alar - AC 20-Jan-06 Phase 2 Cycle 2
XII Sarangani Malapatan Sapu Masla M.E 19-Jan-06 Phase 1 Cycle 2
XII Sarangani Malungon Upper Biangan 19 Jan-06 Phase 2 Cycle 1
XII Sarangani Malungon Talus Susan Eyo 18-Jan-06 Phase 2 Cycle 1 XII Sarangani Malungon Pananim Junie Pardo 17-Jan-06 Phase 2 Cycle 1
Caraga Agusan Del Sur La Paz Valentina
Flora Minda R. Lintao 19-Jan-06 Phase 2 Cycle 1
Water Supply - Pump
Location Survey Information Phase & Cycle Region Province Municipality Barangay Suveyed by Survey Date Phase Cycle VI Iloilo Janiuay Tuburan No data No data Phase 2 Cycle 1 VI Iloilo Calinog Guiso No data 18-Jan-06 Phase 2 Cycle 1 VI Iloilo Janiuay Aguingay No data No data Phase 2 Cycle 1 VI Iloilo Calinog Tabucan No data No data Phase 2 Cycle 1 VI Iloilo Lambunao Simsiman No data No data Phase 2 Cycle 1
VIII Eastern Samar
San Policarpo Ronaldo L.Alfanta 19-Jan-06 Phase 2 Cycle 1
VIII Eastern Samar
San Policarpo Alugan Ronaldo L.Alfanta 19-Jan-06 Phase 2 Cycle 1
VIII Eastern Samar Sulat San Isidro No data No data Phase 1 Cycle 1
VIII Eastern Samar Sulat Del Remedio
IX Zamboanga Del Norte
Katipunan
Sanao Joewel Serador - CF 19-Jan-06 Phase 1 Cycle 1
XI Davao Del Norte Sto. Tomas San Vicente
XI Davao Del Norte Sto. Tomas Kinamayan Berlita Ayson 16-Jan-06 Phase 1 Cycle 2
XI Davao Del Norte Sto. Tomas Bobongon Berlita Ayson 16-Jan-06 Phase 1 Cycle 2
XI Davao Del Norte Sto. Tomas Esperanza Berlita Ayson 17-Jan-06 Phase 1 Cycle 2
XI Davao Del Norte Sto. Tomas Tulalian Loradelle Solarte 17-Jan-06 Phase 1 Cycle 2

53
Road Improvement Location Survey Information Phase & Cycle
Region Province Municipality Barangay Surveyed by Survey Date Phase Cycle CAR Ifugao Asipulo Liwon Florencio Tuguinay 14-Jan-06 Phase 2 Cycle 2 CAR Mt. Province Sadanga Anabel Esteban D. Dacsig 18-Jan-06 Phase 2 Cycle 2 CAR Ifugao Tinoc Binablayan Murphy C. Dalang No data Phase 2 Cycle 1 IV-B Romblon San Jose Pinamihagan VI Iloilo Lambunao Pandan Ma. Liezel T. Gilo 18-Jan-06 Phase 2 Cycle 1 VI Capiz Jamindan Caridad Genalyn Ureso 16-Jan-06 Phase 2 Cycle 1 VI Capiz Jamindan Maantol Nestor Tanedo 16-Jan-06 Phase 2 Cycle 1 VI Capiz Jamindan Molit Nestor Tanedo 16-Jan-06 Phase 2 Cycle 1 VI Iloilo San Rafael No data 17-Jan-06 Phase 2 Cycle 1 VI Iloilo Calinog No data 18-Jan-06 Phase 2 Cycle 1
VI Iloilo Ajuy Silagon Sheila Mae F. Remegio 18-Jan-06 Phase 2 Cycle 1
VI Iloilo Lambunao Patag Edison Germo 18-Jan-06 Phase 2 Cycle 1
VIII Western Samar Pinabacdao Loctob Renna Agudera 17-Jan-06 Phase 2 Cycle 1
IX Zamboanga Del Norte Kalawit Palalian Jose Cruz AC 23-Jan-06 Phase 2 Cycle 1
IX Zamboanga Del Norte Katipunan Loyuran
Charito P, Bayawa - CF 23-Jan-06 Phase 1 Cycle 2
IX Zamboanga Del Norte Siayan Datagan Flordeliza Alar - AC 19-Jan-06 Phase 2 Cycle 1
X Lanao Del Norte Bacolod Babalaya Rodelia A. Pagobo 21-Jan-06 Phase 2 Cycle 1
X Lanao Del Norte Salvador Pagayawan
Rodelia A. Pagobo/Judelyn Salon 18-Jan-06 Phase 2 Cycle 1
X Lanao Del Norte Salvador Buntong
Rodelia A. Pagobo/Judelyn Salon 17-Jan-06 Phase 2 Cycle 1
X Lanao Del Norte Sapad Dansalan Rodelia A. Pagobo 18-Jan-06 Phase 2 Cycle 1
XII Sarangani Malungon Banahaw Mohammad M. Maongco 18-Jan-06 Phase 2 Cycle 1
XII North Cotabato Arakan Gambudes ACT 18-Jan-06 Phase 2 Cycle 1
Caraga Agusan Del Sur La Paz San Patricio Rhodora P. Birador 19-Jan-06 Phase 2 Cycle 1
Caraga Agusan Del Norte Jabonga Bangonay Brian Martecion 18-Jan-06 Phase 1 Cycle 1
Road Construction
Location Survey Information Phase & Cycle Region Province Municipality Barangay Suveyed by Survey Date Phase Cycle
CAR Ifugao Tinoc Tukucan Murphy C. Dalang No data Phase 2 Cycle 1 CAR Ifugao Tinoc Impugong Mercury Binwihan No data Phase 2 Cycle 1
VII Siquijor Enrique Villanueva Balolong Pastora Paculba 16-Jan-06 Phase 1 Cycle 2
X Lanao Del Norte
SN Dimaporo Capucao Rodelia A. Pagobo 19-Jan-06 Phase 2 Cycle 1
X Misamis Occidental
DV Chiongbian Napangan Rodelia A. Pagobo 20-Jan-06 Phase 2 Cycle 1
XII Sarangani Malungon Lutay Mohammad M. Maongco 18-Jan-06 Phase 2 Cycle 1
Caraga Agusan Del Norte Las Nieves Balungagan Aldie Mae Andoy 18-Jan-06 Phase 2 Cycle 1

54
Day Care Location Survey Information Phase & Cycle
Region Province Municipality Barangay Suveyed by Survey Date Phase Cycle
VI Iloilo San Rafael No data 17-Jan-06 Phase 2 Cycle 1 VI Iloilo Lambunao Pungsod No data No data Phase 2 Cycle 1
VIII Western Samar Pinabacdao Dolores Genevieve Alterrado 17-Jan-06 Phase 2 Cycle 1
VIII Eastern Samar Sulat Mara-mara Anavieve Zacate 18-Jan-06 Phase 1 Cycle 1
VIII Eastern Samar Balangiga San Miguel Carissa E. Osias 17-Jan-06 Phase 2 Cycle 1
IX Zamboanga Del Norte Godod Lomogom Edward Galon - CF 17-Jan-06 Phase 2 Cycle 2
IX Zamboanga Del Norte
Jose Dalman Labakid Glenda Tobias - AC 17-Jan-06 Phase 2 Cycle 1
IX Zamboanga Del Norte Kalawit Jose Cruz - AC 17-Jan-06 Phase 2 Cycle 2
Health Center Location Survey Information Phase & Cycle
Region Province Municipality Barangay Suveyed by Survey Date Phase Cycle
CAR Ifugao Asipulo Nampaling Florencio Tuguinay 16-Jan-06 Phase 2 Cycle 1 VI Capiz Jamindan Pangabuan Melly G. Garcia 16-Jan-06 Phase 2 Cycle 1 VI Iloilo San Rafael Bagacay No data 17-Jan-06 Phase 2 Cycle 1 VI Iloilo Carles Punta Janet Pulos 17-Jan-06 Phase 2 Cycle 1 VI Iloilo Calinog Lampaya No data 18-Jan-06 Phase 2 Cycle 1 VI Iloilo Calinog Cabagiao No data 18-Jan-06 Phase 2 Cycle 1
VI Iloilo Barotac Viejo Madonna A. Villazana 16-Jan-06 Phase 2 Cycle 1
IX Zamaboanga Del Norte Kalawit Fatima Jose Cruz AC
16-Jan-06 Phase 2 Cycle 1
IX Zamaboanga Del Norte Kalawit Gatas Jose Cruz AC
16-Jan-06 Phase 2 Cycle 1
X Lanao Del Norte Bacolod Binuni
Judelyn Salon/Rodelia Pagobo 17-Jan-06 Phase 2 Cycle 1
X Misamis Occidental D. Victoriano Carmel Lagas 19-Jan-06 Phase 2 Cycle 1
XII North Cotabato Arakan Katipunan ACT 18-Jan-06 Phase 2 Cycle 1
XII North Cotabato Arakan Allab ACT 18-Jan-06 Phase 2 Cycle 1
Caraga Agusan Del Sur La Paz Lydia Letecia F. Gilos 18-Jan-06 Phase 2 Cycle 1
School Building Location Survey Information Phase & Cycle
Region Province Municipality Barangay Suveyed by Survey Date Phase Cycle
VI Iloilo Calinog Tibiao No Data 18-Jan-06 Phase 2 Cycle 1 VII Bohol Danao Concepcion Cristina Palomares 18-Jan-06 Phase 2 Cycle 1
VIII Eastern Samar Balangiga Bacjao Steve D. Abrugar 16-Jan-06 Phase 2 Cycle 1
XII North Catabato Arakan Tumanding ACT 18-Jan-06 Phase 2 Cycle 1
Caraga Agusan Norte Carmen Vinapor Emelyn L. Mintal 19-Jan-06 Phase 2 Cycle 1

55
ANNEX 5 CALCULATION OF GROSS ANNUAL BENEFIT WATER LEVEL SYSTEM II - GRAVITY
Step 1 - Cost savings on non-incremental water
10 liter daily water consumption per capita in without project situation based on 2006 SP Benefit Survey (earlier estimated at 40li per capita in the 2005 Economic Analysis update)
5 people average household size (based on the 2006 survey, the average HH size is 6 but 5 was used in this analysis as a conservative figure since this is also the average in the 2003 Baseline Survey
50 liter Non-incremental water demand per day and household 242 households average number of households in barangay with gravity driven level II
water systems based on the 2006 SP Benefit Survey. In the 2005 Economic Analysis update, the average number of Barangay HH was estimated at 250.
50 % Based on the 2006 SP Benefit Survey, about 50% of the Barangay population, on average, benefit from the new water system. The previous estimate was 60% in the 2005 Economic Analysis update
121 households average number of direct beneficiary households in barangay with gravity driven level II water systems
2,208.25 m3 total non incremental water demand per year in the barangay 60 minutes/day average minutes that adults in the household spends per day on fetching
non-incr. water in without project situation based on the 2006 SP Benefit Survey. In the previous analyses, this was assumed at 90 minutes a day.
150.00 PHP/day market rate of unskilled labor 90.00 PHP/day opportunity cost of unskilled labor (conversion factor 0.6) 11.25 PHP/day/family opportunity cost per family and day of fetching non-incr. water in without
project situation 0.23 PHP/liter opportunity cost of time for fetching 1 liter of non-incremental water in
without project situation 17 minutes/day minutes that average households spends per day on fetching non-incr.
water in with project situation based on 2006 SP Benefit Survey
3.19 PHP/day/family opportunity cost per family and day of fetching non-incr. water in with project situation
0.06 PHP/liter opportunity cost of time for fetching 1 liter of non-incremental water in with project situation
0.05 PHP/liter cost per liter of water in without project situation 0.21 PHP/liter total cost savings per liter on non-incremental water (time savings in
fetching non-incremental water valued at the opportunity cost of time and amount spent on drinking water in the without project situation)
466,493 PHP/year annual cost savings in barangay on non-incremental water

56
Step 2.1 - Cost of water in financial prices in without project situation (= financial value of the time of fetching water plus the actual cost of the water)
18.75 PHP/day/family per family and day, financial cost of fetching non-incr. water in without project situation
0.38 PHP/liter financial cost of time for fetching 1 liter of non-incremental water in without project situation
0.05 PHP/liter cost per liter of water in without project situation 0.43 PHP/liter financial cost (value of time of fetching + price) for 1liter of non-
incremental water in without project situation Step 2.2- Financial cost of incremental water (= cost recovering amount spent on O&M in the with project situation + time needed to fetch incremental water valued at market prices)
Step 2.2.1 - Amount spent on Operations and Maintenance in the with project situation 35,000 PHP/year annual O&M cost in with project situation 14 liter daily water consumption per capita in with project situation based on the 2006
SP Benefit Survey. In previous analyses, this was assumed as 60li per capita
5 people average household size 70 liter daily water consumption per day and household in with project situation 121 households average number of households in barangay with pump driven level II water
systems 3,091.55 m3 total water consumption per year in the barangay 883.30 m3 annual incremental water consumption in barangay in with project situation 11.32 PHP/m3 O&M cost recovery price per m3 of water in with project situation
Step 2.2.2 - Time needed to fetch incremental water valued at market prices 17 minutes/day minutes that average households spends per day on fetching incr. water in
with project situation 5.31 PHP/day/family per family and day, financial cost of fetching incr. water in with project situation 0.27 PHP/liter financial cost of time for fetching 1 liter of incremental water in with project
situation 0.28 PHP/liter total financial cost of incremental water per liter 0.35 PHP/liter value of incremental water per liter 310,015 PHP/year annual benefit of incremental water consumption in barangay, valued at
its average demand price
Step 3 - Gross annual benefit (= cost savings on non-incremental water plus the value of incremental water valued at its average demand price)
776,507 PHP/year gross annual benefit

57
ANNEX 6 INDEX OF RESPONSIVENESS OF MLGUS TOWARDS KC PROJECTS
Criteria Description Low Less than 50% of the MLGU's budget for social welfare allotted for Project
counterpart (in last column, LGU scored a rating of < 0.5) Moderate Between 51% to 99% of the MLGU budget for social welfare were allotted for
Project counterpart(in last column, LGU scored a rating of 0.51 to 0.99) High More than 100% of the MLGU budget for social welfare allotted for KC
counterpart (in last column, LGU scored a rating of 1.0 or higher)
Region / Municipality Total SP Grant a/
MLGU Counterpart
a/
MLGU Counterpart as % of Total SP Grant b/
MLGU Budget for
Social Welfare
(2004) c/
MLGU Responsiveness
Index (Counterpart /
Budget) b/
PHASE 1 CYCLE 1 CAR Hingyon 3,600,000 1,894,739 53% 675,000 2.81 H IV-A Dolores 3,861,463 605,162 16% 976,463 0.62 L
V Batuan 4,200,000 200,000 5% 250,000 0.80 M VI Concepcion 7,499,186 642,009 9% 1,944,370 0.33 L
VII Enrique Villanueva 4,128,493 804,437 19% 420,653 1.91
VIII Sulat 5,400,000 577,705 11% 621,314 0.93 IX Katipunan 9,000,000 8,455,011 94% 1,049,900 8.05 X Munai 7,756,025 1,322,048 17% 429,300 3.08 XI Sto. Tomas 5,700,001 439,609 8% 857,547 0.51 XII Malapatan 3,600,000 523,711 15% 1,010,550 0.52
Caraga Jabongga 4,498,387 443,393 10% 1,450,044 0.31 TOTAL 59,243,554 15,907,823 23% 9,685,141 1.64
PHASE 1 CYCLE 2 CAR Hingyon 3,600,000 1,025,350 28% 675,000 1.52 IV-A Dolores* 4,800,000 0 0% - -
V Batuan 4,200,000 442,000 11% 250,000 1.77 VI Concepcion 7,500,000 892,500 12% 1,944,370 0.46
VII Enrique Villanueva 4,191,852 78,735 2% 420,653 0.19
VIII Sulat 5,400,000 1,474,199 27% 621,314 2.37 IX Katipunan 8,773,847 3,274,681 37% 1,049,900 3.12 X Munai** 0 0 429,300 - XI Sto. Tomas 5,700,000 964,668 17% 857,547 1.12 XII Malapatan 3,594,500 1,206,423 34% 1,010,550 1.19
Caraga Jabongga* 4,500,000 0 0% 1,450,044 - TOTAL 52,260,199 9,358,556 18% 8,708,678 1.07

58
PHASE 2 CYCLE 1
CAR Asipulo 3,600,000 493,169 14% 435,959 1.13 Tinoc 2,700,000 1,149,284 43% 947,021 1.21 Sadanga 2,400,000 399,240 17% 496,839 0.80
IV-A Buenavista* 11,100,000 0 0% 0 Burdeos* 4,200,000 0 0% 0 Mulanay* 8,400,000 0 0% 0 Jomalig* 1,500,000 0 0% 0 Panukulan* 3,486,423 0 0% 0 Patnanungan* 1,800,000 0 0% 0 San Andres* 1,680,236 0 0% 0 San Narcisco* 7,200,000 0 0% 0 San Francisco* 4,640,392 0 0% 0
IV-B San Jose* 1,500,000 0 0% 0 V Aroroy 12,300,000 2,268,603 18% 1,159,000 1.96 Claveria 6,600,000 1,669,000 25% 439,810 3.79 Monreal 3,300,000 943,000 29% 729,000 1.29 San Pascual 6,600,000 2,210,008 33% 491,326 4.50 Jovellar 6,900,000 1,383,209 20%
VI Ajuy 10,200,000 1,200,093 12% 1,485,388 0.81 Barotac Viejo 7,800,000 854,600 11% 889,530 0.96 Calinog 17,700,000 7,059,761 40% 1,628,130 4.34 Carles 9,900,000 700,264 7% 1,705,500 0.41 Jamindan 9,000,000 1,750,148 19% 884,780 1.98 Janiuay 18,000,000 11,458,241 64% 1,272,670 9.00 Lambunao 21,900,000 3,310,200 15% 266,360 12.43 Lemery 9,300,000 490,000 5% 869,510 0.56 Maasin 14,836,382 1,495,468 10% 1,559,130 0.96 San Dionisio 8,700,000 292,322 3% 908,930 0.32 San Rafael 2,536,633 181,500 7% 192,470 0.94
VII Siquijor 12,599,971 771,405 6% 711,306 1.08 Danao 5,100,000 563,952 11% 614,348 0.92
VIII Can-avid 8,400,000 3,684,205 44% 1,033,385 3.57 Pinabacdao 7,200,000 1,710,000 24% 675,751 2.53 San Policarpo 5,100,000 1,168,945 23% 360,669 3.24 Maslog 3,600,000 1,181,355 33% 422,984 2.79 Jipapad 3,900,000 2,146,881 55% 956,329 2.24 Balangiga 3,900,000 1,102,891 28% 283,081 3.90
IX Godod 5,100,000 2,155,443 42% 418,597 5.15 Gutalac* 9,900,000 0 0% Jose Dalman 5,400,000 2,227,121 41% 676,298 3.29 Kalawit 4,199,999 811,100 19% 685,320 1.18 Siayan 6,600,000 2,991,138 45% 1,411,000 2.12 Lapuyan* 7,798,104 0 0%
X Bacolod 4,800,000 699,606 15% 742,824 0.94
Poona-Piagapo 7,799,883 1,113,500 14% 508,089 2.19
Salvador 7,492,594 1,061,017 14% 557,340 1.90 Sapad 5,100,000 365,887 7% 0 SN Dimaporo 11,099,720 956,411 9% 799,775 1.20

59
DV Chiongbian 3,268,046 616,841 19% 700,223 0.88
XI Talaingod 4,500,000 759,860 17% 1,450,945 0.52 Tarragona 3,000,000 2,141,498 71% 1,111,550 1.93
XII Arakan 9,299,932 282,700 3% 1,026,991 0.28 Malungon 8,400,000 2,031,120 24% 2,593,504 0.78
Caraga Las Nieves* 5,999,318 0 0% La Paz 4,500,000 900,000 20% 2,842,760 0.32 Carmen* 2,400,000 0 0%
TOTAL 386,237,632 70,750,986 18% 36,944,420 1.92
PHASE 2 CYCLE 2 CAR Asipulo 3,600,000 921,839 26% 435,959 2.11
Tinoc 2,700,000 596,368 22% 947,021 0.63 Sadanga 2,399,232 400,000 17% 496,839 0.81
IV-A Buenavista 11,100,000 3,339,602 30% 1,665,000 2.01 Burdeos 4,200,000 1,260,405 30% 1,016,067 1.24 Mulanay 8,400,000 2,625,999 31% 1,985,868 1.32 Jomalig 1,500,000 450,000 30% 368,148 1.22 Panukulan 3,486,423 1,048,752 30% 615,560 1.70 Patnanungan 1,800,000 951,120 53% 297,000 3.20 San Andres 1,680,236 501,221 30% 1,499,000 0.33 San Narcisco 7,200,000 2,160,000 30% 1,683,000 1.28 San Francisco 4,640,392 495,969 11% 1,546,554 0.32
IV-B San Jose 1,500,000 450,000 30% 2,700,464 0.17 V Aroroy 12,206,200 1,999,069 16% 1,159,000 1.72 Claveria 6,600,000 1,391,900 21% 439,810 3.16 Monreal 3,300,000 942,857 29% 729,000 1.29 San Pascual 6,600,000 1,890,000 29% 491,326 3.85 Jovellar 6,900,000 1,380,000 20%
VI Ajuy 10,200,000 692,598 7% 1,485,388 0.47 Barotac Viejo 7,800,000 1,240,286 16% 889,530 1.39 Calinog 17,700,000 2,022,157 11% 1,628,130 1.24 Carles 9,900,000 621,420 6% 1,705,500 0.36 Jamindan 9,000,000 2,273,204 25% 884,780 2.57 Janiuay 17,973,846 1,570,232 9% 1,272,670 1.23 Lambunao 21,900,000 4,563,250 21% 266,360 17.13 Lemery 9,300,000 2,536,085 27% 869,510 2.92 Maasin 15,000,100 436,762 3% 1,559,130 0.28 San Dionisio 8,700,000 346,000 4% 908,930 0.38 San Rafael 2,700,000 138,000 5% 192,470 0.72
VII Siquijor 12,600,000 284,850 2% 711,306 0.40 Danao 5,100,000 970,448 19% 614,348 1.58
VIII Can-avid 8,400,000 2,123,416 25% 1,033,385 2.05 Pinabacdao 7,200,000 1,348,083 19% 675,751 1.99
San Policarpo** 0 0 360,669 -
Maslog 3,600,000 1,351,996 38% 422,984 3.20 Jipapad 3,900,000 570,025 15% 956,329 0.60 Balangiga 3,900,000 945,380 24% 283,081 3.34

60
IX Godod 5,100,000 1,718,546 34% 418,597 4.11 Gutalac 9,790,541 3,372,109 34% Jose Dalman 5,399,999 2,315,703 43% 676,298 3.42 Kalawit 4,200,000 687,640 16% 685,320 1.00 Siayan 6,600,000 2,474,259 37% 1,411,000 1.75 Lapuyan 7,800,000 1,400,000 18%
X Bacolod* 4,800,000 0 0% 742,824 -
Poona-Piagapo** 0 0 508,089 -
Salvador* 7,499,934 0 0% 557,340 - Sapad* 5,097,510 0 0% 0 SN Dimaporo* 11,100,000 0 0% 799,775 -
DV Chiongbian** 0 0 700,223 -
XI Talaingod 4,500,000 676,808 15% 1,450,945 0.47 Tarragona 3,000,000 577,664 19% 1,111,550 0.52
XII Arakan 9,300,001 912,202 10% 1,026,991 0.89 Malungon 8,333,115 1,019,920 12% 2,593,504 0.39
Caraga Las Nieves 6,000,000 1,417,541 24% La Paz 4,500,000 965,000 21% 2,842,760 0.34 Carmen 2,135,041 455,305 21%
TOTAL 369,842,570 64,831,991 18% 50,321,081 1.29
PHASE 3 CYCLE 1 CAR Tanudan 3,000,000 1,069,302 36% 681,736 1.57
Tineg 4,800,000 2,000,000 42% 1,447,731 1.38 IV-B Bulalacao 4,498,676 1,941,794 43% 1,425,638 1.36
Buenavista 4,405,574 1,315,011 30% 718,000 1.83 Sta. Cruz 2,793,967 838,190 30% 1,085,000 0.77
V Pioduran 9,884,983 2,823,917 29% 966,170 2.92 Rapu-rapu 10,168,345 2,911,769 29% 2,047,588 1.42 Libon 14,100,000 3,976,854 28% 918,431 4.33 Capalonga 6,600,000 2,711,027 41% 1,627,900 1.67 Garchitorena 6,472,480 1,840,100 28% 720,748 2.55 Caramoran 8,100,000 3,399,989 42% 981,000 3.47 Donsol 15,300,000 4,344,101 28% 1,631,486 2.66
VI Maayon 9,600,000 234,207 2% 1,415,420 0.17 Dumarao 9,900,000 518,747 5% 695,750 0.75 Cauayan 7,500,000 2,476,251 33% 2,734,480 0.91
VII Bien Unido 4,417,900 147,889 3% 641,713 0.23 Buenavista** 0 0 Getafe** 0 0 Talibon 7,500,000 621,930 8% 1,424,070 0.44 CPG 6,900,000 558,232 8% 549,632 1.02
VIII Silvino Lobos** 0 0 Caibiran 5,100,000 300,000 6% 830,000 0.36 Leyte 9,000,000 2,304,191 26% 1,832,563 1.26
IX Dinas 8,984,945 5,104,667 57% 790,898 6.45 Dumingag 13,196,831 8,421,462 64% 583,708 14.43 Mabuhay 5,400,000 751,394 14% 451,538 1.66

61
X Guinsiliban 2,100,000 228,275 11% 407,469 0.56 XI Laak 14,399,223 3,237,078 22% 1,783,111 1.82 XII T'boli 7,311,403 6,289,956 86% 6,575,187 0.96 Lutayan 3,272,476 1,053,963 32% 799,528 1.32
Caraga Esperanza 14,100,000 2,820,000 20% 2,731,518 1.03 San Luis 7,500,000 1,717,835 23% 1,962,656 0.88 San Isidro 3,592,902 844,717 24% 689,354 1.23 San Miguel 5,400,000 1,090,406 20% 987,122 1.10
TOTAL 235,299,705 67,893,256 29% 42,137,145 1.61 GRAND TOTAL 1,102,883,661 228,742,611 21% 147,796,466 1.55 a/ Data from the NPMO Finance Department, December 2005 b/ Author's calculations c/ Data from the Statement of Income and Expenditure for Municipal LGUs, Bureau of Local Government
Finance, Department of Finance, as of December 2004. http://www.blgf.gov.ph Note: * The municipality did not submit a breakdown of the LCC

62
References
ADB (Asian Development Bank). 1999. Handbook for Economic Analysis of Water Projects. Manila: Economics and Development Resource Center, Asian Development Bank.
Australian Agency for International Development. 2005. Philippines-Australia Community Assistance Program. http://www.pacap.org.ph/index.php?option=com_frontpage&Itemid=1. Accessed January 2006.
Bureau of Local Government Finance. Department of Finance. Government of the Philippines. N.d. Website. http://www.blgf.gov.ph. Accessed January 2006.
Bureau of Post-harvest Research and Extension. Department of Agriculture. Government of the Philippines. N.d. Website. http://www.bpre.gov.ph/phlosses. Accessed January 2006.
Department of Environment and Natural Resources. Government of the Philippines. 2000. Project Completion Report on the Low-Income Upland Communities Project (ADB Loan No. 999-PH). Government of the Philippines, Manila.
Diokno, Benjamin. 2003. Decentralization in the Philippines after Ten Years: What Have We Learned? What Have I Learned? Paper presented at the Asian Development Conference, “Development and Decentralization in Asia,” International Conference Hall, Kitakyushu City, Fukuoka Prefecture, Japan, November 10 and 11, 2003.
Economic Intelligence Unit. 2005. Country Report: Philippines. London: The Economic Intelligence Unit.
Fock , K. 2005. Philippines—Does Social Capital Increase Per Capita Income? Unpublished background paper. Philippines KALAHI-CIDSS Project (P077012). World Bank, Washington, DC.
Gerochi, Hope A. 2002. Returns to Education in the Philippines. Paper submitted to the School of Economics, University of the Philippines, in partial fulfillment of the requirements for the Graduate Research Seminar. October 2002. Mimeo.
der Gaag, Jacques van, and Tan Jee-Peng. 1998. The Benefits of Early Child Development Programs: An Economic Analysis. World Bank, Washington, DC.
Jenkins, Glenn P., and Mostafa Baher El-Hifnawi. 1993. Economic Parameters for the Appraisal of Investment Projects: Bangladesh, Indonesia, and the Philippines. Report for the Economics and Development Resource Center, Asian Development Bank, Manila, Philippines. Mimeo.
63
Jenkins, Glenn P., Korman, V. and Ghimire, P. 2003. The Manila South Water Distribution Project. Queens University, Australia.
Jocano, F. Landa. 1998. Filipino Social Organization: Traditional Kinship and Family Organization. Manila, Philippines: Punlad Research House.
Lagman Martin, Anneli. 2004. Shadow Exchange Rates for Project Economic Analysis: Towards Improving Practice at the Asian Development Bank. ERD Technical Note, no.11. ADB, Manila, Philipppines.
Narayan, D., and L. Pritchett. 1997. Cents and Sociability: Household Income and Social Capital in Rural Tanzania. World Bank Policy Research Working Paper, no.1796. World Bank, Washington, DC.
National Irrigation Administration. Government of the Philippines. 2001. Website. http://www.nia.gov.ph. Accessed January 2006.
National Statistics Office. Government of the Philippines. 2002. 2002 Philippines Statistical Yearbook. Manila: National Statistics Office.
NEDA (National Economic Development Authority). Government of the Philippines. 2001. ICC Guidelines and Procedures for Project Evaluation. Manila: NEDA.
NPMO (National Project Management Office) of the KALAHI-CIDSS Project. Department of Social Welfare and Development. Government of the Philippines. 2005. Subproject database (updated December 2005). NPMO, Manila, Philippines.
_________. 2006. Survey of Subproject Benefits. NPMO, Manila, Philippines.
Ostrom, E. 2000. Social Capital: Fad or a Fundamental Concept?, in P. Dasguptaand I. Serageldin, eds., Social Capital: A Multifaceted Perspective. Washington, DC: World Bank, 172–214.
Ostrom, E. 2006. Collective Action Theory. In Oxford Handbook of Comparative Politics, Boix and Stokes, eds. Oxford: Oxford University Press.
Portes, A. 1998. Social Capital: Its Origins and Applications in Modern Sociology. Annual Review of Sociology 24:1–24.
Wassenich, P., and K. Whiteside. 2004. CDD Impact Assessment Study: Optimizing Evaluation Design under Constraints. World Bank Social Development Papers, Community Driven Development, no. 51 (February). Washington, DC: World Bank.
Woolcock, M. 1998. Social Capital and Economic Development: Toward a Theoretical Synthesis and Policy Framework. Theory and Society 27:151–208.
64
World Bank. 1998a. Handbook on Economic Analysis of Investment Operations. Washington, DC: World Bank.
———. 1998b. Project Appraisal Document—Brazil School Improvement Project Fundescola 1. Human and Social Development Group, Brazil Country Department, Latin American and the Caribbean Region, Report no. 17402-BR. World Bank, Washington, DC.
———.1998c. Project Appraisal Document—Early Childhood Development Project. Health, Nutrition, and Population Sector Unit, East Asia and Pacific Regional Office, Report no. 17176-PH. World Bank, Washington, DC.
———. 2001. Brazil—Early Child Development: A Focus on the Impact of Pre-schools. Human Development Department, Brazil Country Management Unit, Latin America and the Caribbean Region, Sector Report, no. 22841-BR. World Bank, Washington, DC.
———. 2002. Project Appraisal Document, Philippines KALAHII-CIDSS Project. Environment and Social Development Unit, East Asia and Pacific Region, Report no. 24642-PH. World Bank, Washington, DC.
———. 2003a. Implementation Completion Report on KDP-1. World Bank, Washington, DC.
———. 2005a. CDD and Social Capital Impact: Designing a Baseline Survey in the Philippines. World Bank, Washington, DC.
———. 2005b. The Effectiveness of World Bank Support for Community Based and Driven Development. Operations Evaluation Department, Washington, DC.
———. 2005c. KALAHI-CIDSS Project, Philippines: Project Economic Analysis Update. World Bank, Washington, DC. Unpublished.