meda,2009_alcohol dose effects on brain during simulated driving
TRANSCRIPT

Alcohol Dose Effects on Brain Circuits During Simulated DrivingAn fMRI Study
Shashwath A Meda1 Vince D Calhoun12345 Robert S Astur12 Beth M Turner1Kathryn Ruopp and Godfrey D Pearlson123
1 Olin Neuropsychiatry Research Center Institute of Living at Hartford Hospital HartfordConnecticut 2 Department of Psychiatry Yale University School of Medicine New HavenConnecticut 3 Department of Psychiatry Johns Hopkins University Baltimore Maryland 4 The MINDresearch network Albuquerque New Mexico 5 Department of Electrical and Computer EngineeringUniversity of New Mexico Albuquerque New Mexico
AbstractDriving while intoxicated remains a major public health hazard Driving is a complex task involvingsimultaneous recruitment of multiple cognitive functions The investigators studied the neuralsubstrates of driving and their response to different blood alcohol concentrations (BACs) usingfunctional magnetic resonance imaging (fMRI) and a virtual reality driving simulator We usedindependent component analysis (ICA) to isolate spatially independent and temporally correlateddriving-related brain circuits in 40 healthy adult moderate social drinkers Each subject receivedthree individualized separate single-blind doses of beverage alcohol to produce BACs of 005(moderate) 010 (high) or 0 (placebo) 3 T fMRI scanning and continuous behavioralmeasurement occurred during simulated driving Brain function was assessed and compared usingboth ICA and a conventional general linear model (GLM) analysis ICA results replicated andsignificantly extended our previous 15T study (Calhoun et al [2004a] Neuropsychopharmacology292097ndash2017) GLM analysis revealed significant dose-related functional differencescomplementing ICA data Driving behaviors including opposite white line crossings and mean speedindependently demonstrated significant dose-dependent changes Behavior-based factors alsopredicted a frontal-basal-temporal circuit to be functionally impaired with alcohol dosage acrossbaseline scaled good versus poorly performing drivers We report neural correlates of drivingbehavior and found dose-related spatio-temporal disruptions in critical driving-associated regionsincluding the superior middle and orbito frontal gyri anterior cingulate primarysupplementarymotor areas basal ganglia and cerebellum Overall results suggest that alcohol (especially at highdoses) causes significant impairment of both driving behavior and brain functionality related to motorplanning and control goal directedness error monitoring and memory
KeywordsICA virtual reality DWI driving behavior functional imaging
Correspondence to Shashwath A Meda Olin Neuropsychiatry Research CenterIOL 200 Retreat Avenue Hartford CT 06106 USAE-mail smeda01harthosporgPublished online in Wiley InterScience (wwwintersciencewileycom)
NIH Public AccessAuthor ManuscriptHum Brain Mapp Author manuscript available in PMC 2009 September 24
Published in final edited form asHum Brain Mapp 2009 April 30(4) 1257ndash1270 doi101002hbm20591
NIH
-PA Author Manuscript
NIH
-PA Author Manuscript
NIH
-PA Author Manuscript
INTRODUCTIONImpaired driving under the influence of alcohol is a major public hazard in the United StatesAlcohol-related crashes are the primary source of traffic fatalities as evidenced by almost17000 deaths (nearly 40) and 250000 injuries in the year 2004 alone (NHTSA safety facts2004) Recently several studies have illustrated the potential usefulness of simulated drivingenvironments to evaluate brain function in combination with various pharmacologic challenges[Arnedt et al 2001 Calhoun et al 2004b Deery and Fildes 1999 Linnoila et al 1973 Rimmet al 1982 Verster et al 2002] However to our knowledge we are the first to have usedfunctional magnetic resonance imaging (fMRI) to probe temporal brain dynamics while drivingunder the influence of alcohol [Calhoun et al 2002 2004a 2005] Studying the effects ofalcohol on a multifaceted functional paradigm such as driving a motor vehicle is potentiallycomplex However virtual reality (VR) or simulated environments in conjunction with fMRIas used in our study can provide better insights on the effect of drugs on complex brainfunctions and behavior
Alcohol has significant dose-dependent effects on neuropsychological processes includingshort term memory [Rosen and Lee 1976 Tarter et al 1991] sustained and divided attention[Lamb and Robertson 1987 Moskowitz and Sharma 1974] and motor coordination [Groeger2001 (Willinghamrsquos COBALT model) Tarter and Jones 1971] all of which are componentsof driving [Groeger 2001] Event related potential (ERP) and other psychophysiologicalmeasures suggests slower information processing due to alcohol intoxication [Colrain et al1993 Krull et al 1993] Several studies have examined the neural substrates of sober drivingusing fMRI or Positron emission tomography (PET) [Calhoun et al 2002 Graydon et al2004 Jeong et al 2006 Spiers and Maguire 2007 Uchiyama et al 2003 Walter et al2001] In accord with our previous studies [Calhoun et al 2002 2004a] this current studyexamined neural networks associated with driving and effects of alcohol intoxicationHowever in the present study rather than a commercially available software program we useda custom built virtual reality (VR) environment to increase realism and ecological validity Aspart of the VR setup we used a scanner-compatible steering wheel and foot-operated brakeand gas pedals rather than a modified hand-held videogame controller to closely mimic a realtime driving scenario Further in the current study we scanned more participants at a higherfield strength (3 T) to increase our power and to extend our results across systems The newenvironment also automatically records behavioral measures (whereas in previous studies weused double rated measures derived from digital recordings of the sessions)
In analyzing data independent component analysis (ICA) utilizes a data driven approach toeffectively disassociate multiple activation networks involved in complex tasks with little orno assumptions about the temporal dynamics of the data On the other hand a GLM(conventional SPM analysis) based analysis uses a mass univariate multiregression approachto explore signal correlations between a prespecified paradigm design and acquired data timecourses across the whole brain In the present study we used both ICA and a conventional GLManalysis as discussed by Calhoun et al 2004a
We had several aims for the present study (1) To replicate and extend our previous results[Calhoun et al 2002 2004a] in delineating the underlying networks involved while driving(2) To identify dose-related disruptions in component-specific time courses in additionaldriving related circuits and (3) To identify individual behavioral and associated neural networkchanges while driving intoxicated
More specifically because of the higher field strength and increased number of subjects in thecurrent study we expected to improve power and therefore delineate additional task relatednetworks involved while driving an automobile We also sought to demonstrate alcohol
Meda et al Page 2
Hum Brain Mapp Author manuscript available in PMC 2009 September 24
NIH
-PA Author Manuscript
NIH
-PA Author Manuscript
NIH
-PA Author Manuscript
intoxication effects in additional circuits such as the cerebellum which was associated with abehavioral measure (speed) but did not show a main effect of alcohol in our previous studyAlso since we now employed an extended driving epoch in our design (details presented later)we expected to detect significant alcohol-related changes with the conventional regressionanalysis as well
EXPERIMENTS AND METHODSSubjects
The study included 40 healthy right-handed men (N = 20) and women (N = 20) with a meanage of 2475 plusmn 47 years Potential participants were screened to eliminate those with anyneurological disorder or DSM IV-TR Axis I psychiatric disorder including a history ofsubstance abuse [Janca et al 1994] At each visit participants underwent a urine drug screento test for drugs and pregnancy in women All participants were nonsmokers had good visualacuity without correction valid driverrsquos licenses good driving records assessed by self reportand were light or moderate users of alcohol (1ndash4 alcohol consumption sessionsweek and 1ndash8drinkssession average consumptionmonth nine times with an average of four drinks peroccasion) Participants were trained for 10 min on the simulated driving paradigm To avoidinterfering with the alcohol absorption they were requested to eat only a light meal (avoidingfatty foods) on the morning of each study and to avoid consuming alcohol for 24 h prior toeach study day
Each participant received an individualized dose of beverage alcohol calculated based on bodyweight and sex following a published algorithm [Kapur 1989] in a blinded randomized trialDoses were designed to achieve a moderate (blood alcohol concentration (BAC) 005) or ahigh (BAC 010) effect All drinks including placebo were in identical beverage containerswrapped with an alcohol soaked cloth and with an additional small amount of alcohol on thesurface of the drink to help disguise the contents [Hammersley et al 1992] All drinks weremade with orange or cranberry juice to constant volume of 350 ml BACrsquos were measuredbefore drinking to assure participants were not already under the influence and at regularintervals after each scan session using a hand-held breathalyzer (Intoximeters) calibratedregularly using an ethanol breath standard sample dispensing device All subjects gave writteninformed consent prior to participation in the study which was approved by the HartfordHospital Institutional Review Board
ProceduresParticipants were asked to pace their consumption over 10 min BACrsquos were tested after 5 and10 min of alcohol consumption On average participants were brought into the MRI 15 minafter consumption was completed The average BACrsquos for the moderate dose when enteringthe scanner was 0039 plusmn 0014 and when exiting was 0032 plusmn 0011 Similarly for the high doseaverage BACrsquos when entering the scanner was 0071 plusmn 0017 and when exiting was 0087 plusmn0013 After their MRI participants were brought to a room where they were able to watchmovies search the internet or sleep Participants were also provided food of their choice andplenty of water Study doctors determined when it was OK for participants to leave (BAC of005 via cab or friend BAC of 000 on own) and signed participants out All subjects were ableto successfully complete the consumption of both moderate and high doses of alcohol withoutfeeling nauseous
Equipment Design and SetupThe driving simulator used custom built in-house software The hardware setup (Fig 1) wasdesigned to mimic a realistic driving experience and capture real time aspects of drivingbehavior with a steering wheel accelerator and brake pedals All ferromagnetic components
Meda et al Page 3
Hum Brain Mapp Author manuscript available in PMC 2009 September 24
NIH
-PA Author Manuscript
NIH
-PA Author Manuscript
NIH
-PA Author Manuscript
in this hardware were replaced with nonferromagnetic (plastic or copper-beryllium) parts Thecontroller itself was connected to a computer outside the scanner room through a waveguidein the wall An LCD projector (SHARP XG-P25X) outside the scanner room and behind thescanner projected through a second waveguide to a translucent screen which the subjects sawvia a mirror attached to the head coil of the 3 T MRI scanner (Allegra Siemens ErlangenGermany) The screen subtended approximately a 25deg field of view (FOV) that provided thesubject with a straight line of sight
The functional paradigm was blocked (Shown in Fig 2) and each run consisted of three epochsfixation (30 s) drive (90 s) and observe (60 s) each repeated three times and ending with afixation epoch During the fixation phase the subject was instructed to focus on a + sign Duringthe driving block the participant was asked to drive the car normally and safely abide by allconventional traffic rules (posted speed limit [40 mph] stop signs yielding for pedestriansstaying in the right lane except to pass) During the observe phase the subject passively vieweda simulated driving scene Each run was repeated three times (separately) to increase the signalto noise ratio (SNR)
Data AcquisitionDriving behaviormdashContinuous behavioral variables including passenger side white linecrossings medianyellow line crossings opposite side white line crossings crashes speed andsteering weave were recorded during the driving phase of the experiment At the end of eachrun an overall summary score for each behavior was created for every subject Performancewas averaged across the three driving epochs and the three scan runs
ImagingmdashFunctional data were acquired on a Siemens Allegra 3 T scanner at the OlinNeuropsychiatry Research Center at the Institute of Living using an echoplanar sequence usingthe following imaging parameters repeat time (TR) = 1500 ms echo time (TE) = 27 ms fieldof view (FOV) = 22 cm flip angle = 70deg acquisition matrix = 64 times 64 voxel size = 344 times344 slice thickness = 5 mm number of slices = 29 ascending acquisition (sequential) Thescanner was equipped with 40 mTm gradients and a standard quadrature head coil To achievelongitudinal equilibrium six dummy scans were performed at the beginning and discardedprior to analysis Scanning was automatically triggered by the paradigm
Data ProcessingDriving behaviormdashBehavioral variables were investigated for dosage related responses Allmeasures were also screened for any major outliers before conducting any statistical analysisA one-way repeated measures ANOVA design was created to look at the effect of alcohol oneach behavioral variable separately
Image preprocessingmdashAll images were preprocessed using the SPM2 Software(httpwwwfilionuclacukspmsoftwarespm2) Motion correction was achieved usingINRIAlign [Freire and Mangin 2001 Freire et al 2002] to compensate for movement in thefMRI time series images Each subjectsrsquo movement parameters were screened to ensureabsence of excessive head motion Motion corrected images were then spatially normalized toMontreal Neurological Institute (MNI) space by matching them to the standardized EPItemplate image in SPM After spatial normalization images were spatially smoothed with an8 mm isotropic Gaussian kernel Both GLM and ICA operated on the same set of preprocessedimages
fMRI and ETOH (Ethyl Alcohol or Ethanol)Conventional GLM (SPM) analysismdashAs part of the first level (subject level) design foreach subject and dose regressors were created for the drive and observe conditions Regressors
Meda et al Page 4
Hum Brain Mapp Author manuscript available in PMC 2009 September 24
NIH
-PA Author Manuscript
NIH
-PA Author Manuscript
NIH
-PA Author Manuscript
were then convolved with the standard hemodynamic response function (hrf) available inSPM2 and a multiple regression was performed Contrasts were then generated for thefollowing conditions (1) Drive alone (Drive vs Fixation) (2) Observe alone (Observe vsFixation) and (3) Drive gt Observe A second level (group level) random-effect (RFX) analysiswas then carried out to measure the effect of dose response on all three contrasts separatelyusing a repeated measure ANOVA incorporated through the GLM framework At the grouplevel bi-directional one tailed contrasts were created to look for activation differences betweenthe following (1) placebo and moderate dose (2) placebo and high dose (3) moderate doseand high dose The resulting set of voxels from each contrast represents a statistical parametricmap of the t-statistic (SPM-t) SPM-t maps comprised of results of statistical tests on eachvoxel thresholded at P lt 005 and corrected for multiple comparisons using the false discoveryrate [FDR Genovese et al 2002]
To visualize dosage-related differences the SPM coordinates and significant voxels weresuperimposed onto SPM2rsquos spatially normalized template brain Voxel coordinates arereported in Montreal Neurological Institute (MNI) space Corresponding Talairach labels(Brodmann areas) are reported after converting MNI coordinates to the standard space ofTalairach and Tournoux [Talairach and Tournoux 1988] using a MATLAB program writtenby Matthew Brett (MRC Cognition and Brain Sciences Unit Cambridge England) Onceconverted the Talairach coordinates were entered into the Talairach Daemon [Lancaster et al2000] for result localization
ICA analysismdashTo reveal spatiotemporal associations we conducted an analysis using a groupICA algorithm [Calhoun et al 2001] The ICA methods are available as a toolbox (GIFT v13c)implemented in Matlab (httpicatbsourceforgecom) ICA operated on the preprocessedimages mentioned above To briefly review the specifics of this approach data from all subjectswere pooled into a single ICA analysis followed by a back reconstruction of single subjecttime courses and spatial maps from the raw data Data were reduced through two principalcomponent analysis (PCA) stages [Calhoun et al 2001] Following this 24 mutuallyindependent component were estimated by ICA using the infomax approach [Bell andSejnowski 1995] the number of components was determined using the minimum lengthdescription (MDL) criteria adjusted to account for correlated samples [Li et al 2007] Timecourses and spatial maps were then reconstructed for each subject The resulting single subjecttime course amplitudes were scaled to z-scores using the raw data to reflect normalized valuesFurther the time courses were parameterized using multiple regression to provide associationestimates (beta weights) between component time courses and the same experimental designused in the GLM that modeled the drive and observe conditions
Before conducting statistical analysis on the ICA time course data the regression fit values forall three runs were averaged together (an apriori analysis revealed no significant ldquowithin-runrdquoeffect across components) Finally we arrived with 14 components of interest and 40 subjectswith 3 dosages each thus yielding a total of 120 time courses per component We tested fordose-related changes in each component regardless of behavior
Dose-related changes were statistically assessed using a two-way repeated measures ANOVAdesign in SPSS v150 on all 14 components The analysis investigated two main effects(condition [drive and observe] and dosage [high moderate placebo]) and an interaction effect(condition times dosage) on the association estimates obtained from ICA across all 14 componentsWe were primarily interested in significant interaction effects to determine the effect of alcoholon driving component time courses
Meda et al Page 5
Hum Brain Mapp Author manuscript available in PMC 2009 September 24
NIH
-PA Author Manuscript
NIH
-PA Author Manuscript
NIH
-PA Author Manuscript
Driving Behavior fMRI and EtohFurther to identify neural correlates of behavior we divided subjects into good and poorperforming drivers using their behavior from the placebo and high doses only To do this allindividual behavioral variables were corrected for subjectrsquos baseline performance (raw drivingscores from the placebo condition subtracted from the high dose condition) Corrected scoresfrom all variables were then pooled into a principal component analysis (PCA using varimaxrotation) in SPSS v150 (httpwwwspsscomspss) to generate factors that predicted overallbehavioral performance Only factors yielding a principle Eigenvalue score gt1 were retainedfor further analysis Factor coefficients scores were estimated using the Anderson-Rubinmethod thus ensuring orthogonality and normality of the estimated factors Further a mean-split of each factor variable was used separately to divide the original sample into two groups(good and poor performing drivers) A 2 by 3 repeated measures ANOVA was designed tolook at any significant interaction between driver-group fMRI responses and alcohol dosageInteractions were investigated only in components that demonstrated a significant ICA relatedfMRI change with alcohol (details in later section)
RESULTSDriving Behavior
Behavioral analysis used only a subset of the original sample (3740) three subjects wereclassified as outliers on behavior and were not included in the analysis A main effect analysisof behavioral data across alcohol dosage (Placebo moderate and high) revealed that oppositewhite line crossings (P = 0009 df = 35) and mean speed (P = 003 df = 35) were significantlydifferent and demonstrated a dose-related linear response (Fig 3) Other behavioral variablesalthough not significantly affected by alcohol dose demonstrated a similar linear trendassociating higher alcohol dose with increased crashes steering weave and more frequentcrossing of passenger side white lines (Fig 3)
fMRI and EtohGLM resultsmdashAll 40 subjects were within the acceptable motion criteria set apriori (lessthan 3 mm of translational and 2deg of rotational motion) and were thus included in the analysisRandom effect analysis did not reveal any significant dose-related changes in brainfunctionality for the drive alone (active driving) or observe alone (passive driving) contrastsHowever when we examined dose-related changes in activation patterns using the driverelative to observe contrast (active driving versus passive driving) multiple cortical regionsdisplayed significantly less activation in the high dose relative to the placebo condition (Fig4ab) The functional differences between the placebo and moderate dose conditions (albeitnot significant) demonstrated a trend in the same direction Regions along with their MNIcoordinates and Brodmann areas are listed in Table I As seen from the table multiple regionsfrom the GLM analysis overlapped with the ICA components In addition the GLM analysisrevealed significant changes in regions including the amygdala and hippocampusparahippocampus that did not emerge significant in the ICA analysis GLM failed to captureregional activation in cerebellum and motor In addition GLM was able to capture only a partof the default mode network which has been defined as a baseline condition of brain function[Raichle et al 2001]
GLM results revealed five major regions (Fig 4a) R parahippocampus-hippocampus-amygdala (yellow circle) R inferior frontal (pink circle) bilateral medial-superior frontal gyridorsolateral prefrontal cortex (Green and Blue circles) and precuneus (orange circle) thatdemonstrated a significant dose-related response during the drive versus observe conditionWe plotted effect sizes in each of these regions to investigate signal change as a function of
Meda et al Page 6
Hum Brain Mapp Author manuscript available in PMC 2009 September 24
NIH
-PA Author Manuscript
NIH
-PA Author Manuscript
NIH
-PA Author Manuscript
dosage As seen from Figure 5 GLM results revealed a linear fMRI signal pattern ordered inall five regions as sober gt moderate gt high
ICA ResultsOverall using ICA we identified 14 total driving related components of interest In additionto finding all 7 component specific regions from our previous paper we found severaladditional regionscomponents (frontal inferior temporal middle temporal) which showedtask-related changes We also observed that some components identified our previous study(eg cerebellar and visual) were now extracted as separate components The two-way ANOVAcomparison on the 14 driving related components revealed 5 of the 14 networks [Fig 6 colorcoding scheme used here is not similar to the one described by Calhoun et al 2004a] to havea significant alcohol related change in functional synchrony including cerebellar (pinkcomponent) orbito-frontalanterior cingulate (red component) medial frontal-parietal-posterior cingulate (resting state network orange component) fronto-basal-temporal (greencomponent) and primary-supplementary motor (blue component) The regions shown inFigure 3 were thresholded at P = 005 (FDR corrected) The corresponding MNI coordinatesof the regions along with their hypothesized functionality are listed in Table II Other driving-related circuits that were identified by ICA but did not show a significant alcohol-related changeincluded the bilateral medial-inferior frontal gyrus the inferior frontal-anterior and posteriorcingulate cortex inferior temporalhippocampus bilateral superior occipital right inferioroccipitalcerebellum and posterior cerebellum (split into three components)
Driving Behavior fMRI and EtohTo investigate the neural correlates of behavior we used PCA along with varimax rotation togenerate surrogate behavioral factors for each subject The top two PCA factors (Eigenvaluesof 191 and 185) cumulatively accounted for 63 of the total behavioral variance (Table III)Behavioral measures of driver speed steering weave and passenger side white line crossingswere primarily loaded (positively) on factor 1 (32 of total variance) Factor 2 (31 of totalvariance) was largely influenced (positively) by yellowmedian line crossings opposite whiteline crossings and collisions Factor 1 and factor 2 were highly uncorrelated As revealed bya one-sample KS statistic the two factors did not significantly differ from a normal distributionThis allowed us to separate the initial sample into two groups based on each factor separatelyusing a mean split On investigation of significant interaction between driver groups andalcohol dosage poorer performing subjects based on behavior factor 1 demonstrated asignificant dose-dependent change (P = 004 df = 35) in fMRI signal in the fronto-basal (green)component Similarly factor 2 demonstrated dose-related fMRI response change (albeitinsignificant) for the resting state (P = 015 df = 35 orange) and motor (P = 012 df = 35blue) networks
DISCUSSIONIn this study we explored the neural substrates of driving and addressed the overarchingquestion of how alcohol impacts these driving networks using both imaging and behavioralmeasures Driving is a dynamic task that requires a complex interplay between multiplecognitive domains We therefore approached this analysis in a pluralistic manner using twocomplementary techniques ICA and GLM to effectively address our hypotheses
We employed a novel custom built naturalistic driving setup to capture the internal and externalaspects of driving psychology External considerations include activities such as vehiclemanipulation road conditions etc The internal aspect of driving refers to the driversrsquosensation perception verbalizations thoughts decisions and emotions(httpwwwsochawaiiedu|leonj|leonj|leonpsy|traffic|tpintrohtml) In contrast to a
Meda et al Page 7
Hum Brain Mapp Author manuscript available in PMC 2009 September 24
NIH
-PA Author Manuscript
NIH
-PA Author Manuscript
NIH
-PA Author Manuscript
behavioral study which would mostly capture the variance due to the external aspects ofdriving an fMRI experiment combined with VR or simulation can obtain information on boththe internal and external aspects of driving Compared to earlier studies conducted by our groupthe present study used the following (1) a larger sample size (2) a higher field strength MRscanner (3) custom built VR software that was automated to capture continuous driving relatedbehavioral measures (4) a modified design paradigm with an extended driving epoch and (5)a different ICA and behavioral approach to analyze group data Also differently than ourprevious analysis [Calhoun et al 2004a] which used a fixed average spatial ICA the currentstudy used data from the entire pool of subjects under all dosage conditions to estimatemaximally independent components thereby not biasing the results to the placebo conditionalone Using this approach we were able to replicate our previous results [Calhoun et al2004a] and extend the findings to identify twice as many driving related components
Since alcohol is known to have vasoactive properties that may potentially confound BOLDfMRI signal [Levin et al 1998 Seifritz et al 2000] we performed an additional analysis usingdata from only the placebo condition to validate our methodology and determine if any newnetworks emerged as a result of alcohol ingestion In this analysis of sober data we were ableto replicate all driving circuits as obtained for the pooled analysis indicating that all networksthat emerged in our study were evident during the sober state also Although previous literatureindicates that alcohol might affect the configuration (intra-connectivity) of networks in theabsence of any dose-related magnitude difference [Paulus et al 2006] data from our studysuggest that the spatial preconfiguration of sober driving related networks was affected onlyslightly despite significant dose-dependent magnitude changes due to alcohol
In our previous study only two circuits (orbito-frontal and primary-supplementary motor)demonstrated significant dose-related responses [least activation occurring during the highestdose Calhoun et al 2004a] which correlated behaviorally with error detection and motorfunctionality Overall comparing the seven components identified by Calhoun et al 2004a tosimilar regions found in the present study we found them to be in good agreement both spatiallyand temporally In line with our last study we found a significant alcohol related effect in theanterior cingulateorbito-frontal circuit which can be associated with error monitoring andspan of attention [Calhoun et al 2004a Groeger 2001 Spiers and Maguire 2007] Howeverfunctionally the greatest effect of alcohol dosage was found in the cerebellum the primary-supplementary motor area and in the default mode network (Table II) The significantemergence of the cerebellum network in this study was consistent with our hypothesis buthowever unlike our results in Calhoun et al 2004a this network was not associated with anybehavioral measure Losses of gross and fine motor control are behavioral features of alcoholimpairment [Tarter and Jones 1971] and the motor and cerebellar regions identified areconsistent with this and with prior studies [see review of Oscar-Berman and Marinković2007) However it may be important to note that the GLM analysis was not sensitive enoughto be able to capture any dose-related fMRI changes in the above motor related componentsThis could perhaps be due to a passive recruitment of these regions [involved in nonconsciousmotor processing Groeger 2001 (Willinghamrsquos COBALT model)] during the observe phaseof the experiment
The default mode network has repeatedly exhibited significant functional connectivity acrossa wide variety of tasks and during a conscious inactive state This circuit is associated with abaseline or ldquoidlingrdquo brain condition and often demonstrates a decreased fMRI signal duringperformance of a variety of task stimuli [Fox and Raichle 2007 Raichle et al 2001] Ourfindings are consistent with these prior reports (see time course data in Fig 6) and alsodemonstrate that alcohol might have an impact on this network Although the exact role of thedefault mode network is unknown it has been implicated in attending to external and internalstimuli [Gusnard and Raichle 2001 Gusnard et al 2001 Raichle et al 2001] as well as self-
Meda et al Page 8
Hum Brain Mapp Author manuscript available in PMC 2009 September 24
NIH
-PA Author Manuscript
NIH
-PA Author Manuscript
NIH
-PA Author Manuscript
referential and reflective activity [Greicius and Menon 2004 Gusnard et al 2001 Raichle etal 2001] that includes episodic memory retrieval inner speech mental images emotions andplanning future events [Fransson 2005 Greicius and Menon 2004] Contrary to our last studythis network now demonstrated a significant main effect of alcohol thus suggesting that thefronto-parietal attentional control framework is modulated by alcohol during driving
Although we did not detect the fronto-basal ganglia-temporal network in our previous ICAanalyses this component showed a significant alcohol related effect in the present study Thisnetwork is of interest as it overlaps most consistently with our GLM findings and is associatedwith complex cognitive tasks relevant to driving The fronto-basal ganglia loop is oftenassociated with executive attentional control and goal directed responses [Benke et al2003 Dunnett et al 2005 Hollerman et al 2000 Levy and Czernecki 2006] The fronto-temporal network is likely to be involved in regulation of both working memory and attention[Aalto et al 2005] and is especially sensitive to alcohol (Oscar-Berman and Marinković2007) Results from studies that have investigated driving abilities in subjects with fronto-temporal deficits often report inappropriate driving behavior [De Simone et al 2007Kamimura et al 2005]
In contrast to our previous study [Calhoun et al 2004a] but consistent with our presenthypothesis GLM with additional subjects in the current investigation was sensitive enough toreveal multiple regions that demonstrated a dose-dependent alcohol response Further GLMresults overlapped in part with those of the ICA analysis and in addition captured dose-relatedresponses in hippocampus and amygdala (Figs 4 and 5) This illustrates the complementarynature of GLM and ICA analyses where each contributes toward analyzing a complexfunctional task such as driving As predicted at the whole brain level SPM analysis revealeda linear functional-dose response with alcohol causing decreased functional activity at both themoderate and high doses
A decrease in the fMRI amplitude of the fronto-basal component with increased alcoholintoxication was related to higher speed steering weave and passenger white line errors Alsoa similar association (although not significant) was found in the medial frontal-parietal-cingulate (default mode) and motor networks that correlated with vehicle manipulation errors(crashes median and opposite white line errors) The latter association might not have beensignificant perhaps due to the naturalistic nature (mimicking real time on-road scenarios) ofthe driving paradigm employed in our study which allowed for a low number of such infrequenterrors (crashes and opposite white line crossings) This suggests that marked impairment ofbehavior and functionality occur under the influence of alcohol relating to actionmotorplanning and higher cognitive judgments
Our functional results correspond well with Willinghamrsquos COBALT model of motor control[illustrated in Groeger 2001] in driving In the COBALT model the dorsolateral prefrontalcortex (part of the fronto-basal-temporal component in our study) is implicated in the strategicpart of motor control that which responds to novel unfamiliar or difficult tasks requiringconscious and controlled monitoring In a later stage of processing perceptual motorintegration occurs through the posterior parietal lobe and premotor cortex (RSN and primarysupplementary motor networks orange and blue circuits in Fig 6) which leads to motorsequencing [performed by the supplementary motor areas and basal ganglia (parts of theprimarysupplementary motor and fronto-basal-temporal networks)] With reference to theabove prediction model our imaging results suggest that alcohol might have significantfunctional effects on both the conscious and non-conscious domains of motor control whileautomobile driving
Meda et al Page 9
Hum Brain Mapp Author manuscript available in PMC 2009 September 24
NIH
-PA Author Manuscript
NIH
-PA Author Manuscript
NIH
-PA Author Manuscript
Even though we were able to derive and assess effects of alcohol on the temporal dynamics ofseveral neural networks involved in driving and their associated behavior our present paradigmdesign (blocked) prevents us from conducting and analyzing the data on a much finer temporalscale [Spiers and Maguire 2007] Also it might be interesting for future studies to investigatethe effect of gender on driving functionbehavior with alcohol dosage
Overall results demonstrated the motor planninggoal direction (fronto-basal ganglia) systemthat correlated with driving speed passenger white line errors and steering-related weaving tobe significantly impaired with alcohol Also the default mode and primary motor systems wereassociated (although not significant) with crashes and line crossing errors in a dose-dependentmanner Further in comparison to our findings from Calhoun et al 2004a our current datasuggest that in addition to the anterior cingulateOF and cerebellar regions attention deficitsfor motor functioning observed in alcohol intoxication may also be modulated by regions inthe resting state and the fronto-basal-temporal networks
CONCLUSIONIn summary we replicated and significantly extended our earlier fMRI results revealingdifferent activation dynamics for multiple regions during a simulated driving task We usedtwo complementary image analysis techniques to investigate alcohol-related changes intemporal dynamics of the driving circuitry at two dosage levels compared to placebo We reportfive crucial networks including orbito-frontalanterior cingulate fronto-temporal primarysecondary motor cerebellar and the resting state networks as being modulated by alcohol ina dose-related manner Additionally a conventional GLM analysis captured a significant dose-dependent response in areas including the amygdala and parahippocampus Further we foundconsistent behavioral changes while driving intoxicated supporting our imaging results Ourresults demonstrated that speed and white line crossing errors mediated the fronto-basalganglia-temporal (green) component involvement across alcohol dosages Overall ourfindings might imply a significant impairment in attention cognitive goal direction motorplanning and emotionalworking memory related functional capabilities while driving underthe influence of alcohol
AcknowledgmentsContract grant sponsor National Institutes of Health Contract grant numbers 1 R01 EB 000840-015 R01AA015615-02
ReferencesAalto S Bruck A Laine M Nagren K Rinne JO Frontal and temporal dopamine release during working
memory and attention tasks in healthy humans A positron emission tomography study using the high-affinity dopamine D2 receptor ligand [11C]FLB 457 J Neurosci 2005252471ndash2477 [PubMed15758155]
Arnedt JT Wilde GJ Munt PW MacLean AW How do prolonged wakefulness and alcohol compare inthe decrements they produce on a simulated driving task Accid Anal Prev 200133337ndash344[PubMed 11235795]
Bell AJ Sejnowski TJ An information-maximization approach to blind separation and blinddeconvolution Neural Comput 199571129ndash1159 [PubMed 7584893]
Benke T Delazer M Bartha L Auer A Basal ganglia lesions and the theory of fronto-subcortical loopsNeuropsychological findings in two patients with left caudate lesions Neurocase 2003970ndash85[PubMed 16210227]
Calhoun VD Adali T Pearlson GD Pekar JJ A method for making group inferences from functionalMRI data using independent component analysis Hum Brain Mapp 200114140ndash151 [PubMed11559959]
Meda et al Page 10
Hum Brain Mapp Author manuscript available in PMC 2009 September 24
NIH
-PA Author Manuscript
NIH
-PA Author Manuscript
NIH
-PA Author Manuscript
Calhoun VD Pekar JJ McGinty VB Adali T Watson TD Pearlson GD Different activation dynamicsin multiple neural systems during simulated driving Hum Brain Mapp 200216158ndash167 [PubMed12112769]
Calhoun VD Pekar JJ Pearlson GD Alcohol intoxication effects on simulated driving Exploringalcohol-dose effects on brain activation using functional MRI Neuropsychopharmacology 2004a292097ndash3017 [PubMed 15316570]
Calhoun VD Altschul D McGinty V Shih R Scott D Sears E Pearlson GD Alcohol intoxication effectson visual perception An fMRI study Hum Brain Mapp 2004b2115ndash26 [PubMed 14689506]
Calhoun VD Carvalho K Astur R Pearlson GD Using virtual reality to study alcohol intoxication effectson the neural correlates of simulated driving Appl Psychophysiol Biofeedback 200530285ndash306[PubMed 16167192]
Colrain IM Taylor J McLean S Buttery R Wise G Montgomery I Dose dependent effects of alcoholon visual evoked potentials Psychopharmacology (Berl) 1993112383ndash388 [PubMed 7871046]
De Simone V Kaplan L Patronas N Wassermann EM Grafman J Driving abilities in frontotemporaldementia patients Dement Geriatr Cogn Disord 2007231ndash7 [PubMed 17047327]
Deery HA Fildes BN Young novice driver subtypes Relationship to high-risk behavior traffic accidentrecord and simulator driving performance Hum Factors 199941628ndash643 [PubMed 10774133]
Dunnett SB Meldrum A Muir JL Frontal-striatal disconnection disrupts cognitive performance of thefrontal-type in the rat Neuroscience 20051351055ndash1065 [PubMed 16165288]
Fox MD Raichle ME Spontaneous fluctuations in brain activity observed with functional magneticresonance imaging Nat Rev Neurosci 20078700ndash711 [PubMed 17704812]
Fransson P Spontaneous low-frequency BOLD signal fluctuations An fMRI investigation of the resting-state default mode of brain function hypothesis Hum Brain Mapp 20052615ndash29 [PubMed15852468]
Freire L Mangin JF Motion correction algorithms may create spurious brain activations in the absenceof subject motion Neuroimage 200114709ndash722 [PubMed 11506543]
Freire L Roche A Mangin JF What is the best similarity measure for motion correction in fMRI timeseries IEEE Trans Med Imaging 200221470ndash484 [PubMed 12071618]
Genovese CR Lazar NA Nichols T Thresholding of statistical maps in functional neuroimaging usingthe false discovery rate Neuroimage 200215870ndash878 [PubMed 11906227]
Greicius MD Menon V Default-mode activity during a passive sensory task Uncoupled fromdeactivation but impacting activation J Cogn Neurosci 2004161484ndash1492 [PubMed 15601513]
Graydon FX Young RA Tdss MD Tdss B Genik RJ II Posse S Hsieh L Green CC Visual eventdetection during simulated driving Identifying the neural correlates with functional neuroimagingTransp Res Part F Traffic Psychol Behav 20047271
Groeger JA Understanding Driving Applying Cognitive Psychology to a Complex Everyday Task NewYork Psychology Press 2001
Gusnard DA Raichle ME Searching for a baseline Functional imaging and the resting human brainNat Rev Neurosci 20012685ndash694 [PubMed 11584306]
Gusnard DA Akbudak E Shulman GL Raichle ME Medial prefrontal cortex and self-referential mentalactivity Relation to a default mode of brain function Proc Natl Acad Sci USA 2001984259ndash4264[PubMed 11259662]
Hammersley R Finnigan F Millar K Alcohol placebos You can only fool some of the people all of thetime Br J Addict 1992871477ndash1480 [PubMed 1422109]
Hollerman JR Tremblay L Schultz W Involvement of basal ganglia and orbitofrontal cortex in goal-directed behavior Prog Brain Res 2000126193ndash215 [PubMed 11105648]
Jeong M Tashiro M Singh LN Yamaguchi K Horikawa E Miyake M Watanuki S Iwata R FukudaH Takahashi Y et al Functional brain mapping of actual car-driving using [18F]FDG-PET AnnNucl Med 200620623ndash628 [PubMed 17294673]
Kamimura N Kakeda K Kitamura Y Sanada J Ikeda M Inoue S Dementia and driving present statusof drivers with dementia and response of their familyrsquos care in Japan No To Shinkei 200557409ndash414 [PubMed 15981640]
Meda et al Page 11
Hum Brain Mapp Author manuscript available in PMC 2009 September 24
NIH
-PA Author Manuscript
NIH
-PA Author Manuscript
NIH
-PA Author Manuscript
Kapur BM Computer Blood Alcohol Calculator v120 ARF Software Toronto Canada AddictionResearch Foundation 1989
Krull KR Smith LT Sinha R Parsons OA Simple reaction time event-related potentials Effects ofalcohol and sleep deprivation Alcohol Clin Exp Res 199317771ndash777 [PubMed 8214412]
Lamb MR Robertson LC Effect of acute alcohol on attention and the processing of hierarchical patternsAlcohol Clin Exp Res 198711243ndash248 [PubMed 3307487]
Lancaster JL Woldorff MG Parsons LM Liotti M Freitas CS Rainey L Kochunov PV Nickerson DMikiten SA Fox PT Automated Talairach atlas labels for functional brain mapping Hum BrainMapp 200010120ndash131 [PubMed 10912591]
Levin JM Ross MH Mendelson JH Kaufman MJ Lange N Maas LC Mello NK Cohen BM RenshawPF Reduction in BOLD fMRI response to primary visual stimulation following alcohol ingestionPsychiatry Res 199882135ndash146 [PubMed 9754438]
Levy R Czernecki V Apathy and the basal ganglia J Neurol 2006253(Suppl 7)VII54ndashVII61 [PubMed17131230]
Li Yo Adali T Calhoun VD Estimating the number of independent components for functionalmagnetic resonance imaging data Hum Brain Mapp 2007
Linnoila M Mattila MJ Interaction of alcohol and drugs on psychomotor skills as demonstrated by adriving simulator Br J Pharmacol 197347671Pndash672P
Moskowitz H Sharma S Effects of alcohol on peripheral vision as a function of attention Hum Factors197416174ndash180 [PubMed 4844761]
Oscar-Berman M Marinković K Alcohol Effects on neuro-behavioral functions and the brainNeuropsychol Rev 200717239ndash257 [PubMed 17874302]
Paulus MP Tapert SF Pulido C Schuckit MA Alcohol attenuates load-related activation during aworking memory task Relation to level of response to alcohol Alcohol Clin Exp Res 2006301363ndash1371 [PubMed 16899039]
Raichle ME MacLeod AM Snyder AZ Powers WJ Gusnard DA Shulman GL A default mode of brainfunction Proc Natl Acad Sci USA 200198676ndash682 [PubMed 11209064]
Rimm DC Sininger RA Faherty JD Whitley MD Perl MB A balanced placebo investigation of theeffects of alcohol vs alcohol expectancy on simulated driving behavior Addict Behav 1982727ndash32 [PubMed 7080881]
Rosen LJ Lee CL Acute and chronic effects of alcohol use on organizational processes in memory JAbnorm Psychol 197685309ndash317 [PubMed 945308]
Seifritz E Bilecen D Haumlnggi D Haselhorst R Raduuml EW Wetzel S Seelig J Scheffler K Effect ofethanol on BOLD response to acoustic stimulation Implications for neuropharmacological fMRIPsychiatry Res 2000991ndash13 [PubMed 10891645]
Spiers HJ Maguire EA Neural substrates of driving behaviour Neuroimage 200736245ndash255[PubMed 17412611]
Talairach J Tournoux P Co-planar Stereotactic Atlas of the Human Brain 3-Dimensional Proportionalsystem mdash an Approach to Cerebral Imaging New York NY Thieme Medical Publishers 1988
Tarter RE Arria AM Van Thiel DH Hepatic encephalopathy coexistent with alcoholism Recent DevAlcohol 19919205ndash224 [PubMed 1758984]
Uchiyama Y Ebe K Kozato A Okada T Sadato N The neural substrates of driving at a safe distancea functional MRI study Neurosci Lett 2003352199ndash202 [PubMed 14625019]
Verster JC Volkerts ER Verbaten MN Effects of alprazolam on driving ability memory functioningand psychomotor performance A randomized placebo-controlled studyNeuropsychopharmacology 200227260ndash269 [PubMed 12093599]
Walter H Vetter SC Grothe J Wunderlich AP Hahn S Spitzer M The neural correlates of drivingNeuroreport 2001121763ndash1767 [PubMed 11409755]
Meda et al Page 12
Hum Brain Mapp Author manuscript available in PMC 2009 September 24
NIH
-PA Author Manuscript
NIH
-PA Author Manuscript
NIH
-PA Author Manuscript
Figure 1In scanner driving setup and snapshot of a virtual driving scenario A screen shot from thedriving simulator and scanner driving setup
Meda et al Page 13
Hum Brain Mapp Author manuscript available in PMC 2009 September 24
NIH
-PA Author Manuscript
NIH
-PA Author Manuscript
NIH
-PA Author Manuscript
Figure 2Driving paradigm design Functional driving paradigm with a block design having thefollowing phases Fixate 30 s Drive 90 s and Observe 60 s
Meda et al Page 14
Hum Brain Mapp Author manuscript available in PMC 2009 September 24
NIH
-PA Author Manuscript
NIH
-PA Author Manuscript
NIH
-PA Author Manuscript
Figure 3Dose-related driving behavior scores Behavior results from the driving data Drivingperformance at moderate- and high-dose EtOH (green and red bars respectively) compared to(mean) placebo performance (solid yellow line) rated on six different measures Measuredyellow line crossing (YLC) passenger white line crossing (PWLC) opposite white linecrossing (OWLC) crashes mean speed and mean steering weave (Significant at P lt 005Significant at P lt 001)
Meda et al Page 15
Hum Brain Mapp Author manuscript available in PMC 2009 September 24
NIH
-PA Author Manuscript
NIH
-PA Author Manuscript
NIH
-PA Author Manuscript
Figure 4GLM analysis Functional changes due to alcohol intoxication a (top) Regions thatdemonstrated a significantly lower functional activation (drive vs observe) during the highdose relative to placebo condition (thresholded at P = 005 FDR corrected) Maps were derivedfrom a random effects (RFX) repeated measures analysis comparing the two dosages conductedthrough a standard GLM analysis in SPM2 b (below) Areas of activation (high vs sober Plt 005 FDR corrected) during the drive-observe condition shown on a rendered brain alongwith an orthogonal display of slices depicting a significant dose-related functional change inthe amygdalaparahippocampus region (Note Color bar shown corresponds to both the overalland amygdalaparahippocampus activation patterns)
Meda et al Page 16
Hum Brain Mapp Author manuscript available in PMC 2009 September 24
NIH
-PA Author Manuscript
NIH
-PA Author Manuscript
NIH
-PA Author Manuscript
Figure 5Dose-related responses plotted across five major regions revealed by GLM Effect sizes offunctional responses at peak voxel within each major cluster identified by RFX analysis Notethe linear pattern of signal change observed across dosage X-axis refers to dosage conditionand Y-axis refers to mean signal difference
Meda et al Page 17
Hum Brain Mapp Author manuscript available in PMC 2009 September 24
NIH
-PA Author Manuscript
NIH
-PA Author Manuscript
NIH
-PA Author Manuscript
Figure 6ICA networks and associated time courses that differed significantly across alcohol doses RFXgroup maps thresholded at P = 005 FDR corrected and associated time courses of brain circuitsthat demonstrated a significant alcohol-related fMRI difference Spatial maps correspond tomean response over all three doses Normalized time course signal is depicted in relation to aldquozerordquo baseline (dotted line) A total of five components are presented The OF and anteriorcingulate areas are depicted in red Cerebellar and Motor areas are depicted in pink and bluerespectively The frontal-basal-temporal component is shown in green An ldquoorangerdquocomponent extending across the medial frontal bilateral parietal and cingulate regionsrepresents the ldquoidling conditionrdquo or resting state network (RSN) of the brain
Meda et al Page 18
Hum Brain Mapp Author manuscript available in PMC 2009 September 24
NIH
-PA Author Manuscript
NIH
-PA Author Manuscript
NIH
-PA Author Manuscript
NIH
-PA Author Manuscript
NIH
-PA Author Manuscript
NIH
-PA Author Manuscript
Meda et al Page 19TA
BLE
ISi
gnifi
cant
regi
ons
(driv
e vs
obs
erve
con
ditio
n) s
how
ing
decr
ease
d ac
tivat
ion
durin
g th
e hi
gh d
ose
rela
tive
to th
e pl
aceb
o do
se (0
05
FDR
cor
rect
ed)
as id
entif
ied
usin
g a
GLM
ana
lysi
s al
ong
with
thei
r MN
I coo
rdin
ates
and
max
imum
T v
alue
s
Reg
ions
Bro
dman
n ar
eaL
eft (
Vol
CC
)L
eft M
ax T
(MN
I co-
ordi
nate
s)R
ight
(Vol
CC
)R
ight
Max
T (M
NI c
o-or
dina
tes)
Supe
rior f
ront
al g
yrus
10 9
83
53
6 (minus
21 5
2 1
5)4
43
6 (1
5 5
4 3
0)
Mid
dle
fron
tal g
yrus
10 6
46
13
7 (minus
24 5
2 1
5)2
54
(36
52
3)
Prec
uneu
s7
31
02
34
(minus3
minus57
33)
14
36
(0 minus
57 3
3)
Para
hipp
ocam
pal g
yrus
34 A
myg
dala
H
ippo
cam
pus
280
NS
09
38
(18
minus10
minus14
)
Infe
rior f
ront
al g
yrus
10 4
6 4
70
33
4 (minus
48 3
3 9
)0
43
8 (3
9 4
8 minus
2)
Med
ial f
ront
al g
yrus
90
63
5 (minus
24 4
3 3
)0
13
5 (1
2 5
7 2
)
Supe
rior t
empo
ral g
yrus
38lt0
13
4 (minus
30 1
0 minus
18)
04
37
(36
9 minus
22)
Unc
usA
myg
dala
28
lt01
34
(minus30
7 minus
18)
03
36
(24
minus2
minus17
)
Cin
gula
te g
yrus
310
NS
02
34
(3 minus
57 2
9)
Cun
eus
70
NS
01
34
(0 minus
62 3
2)
Prec
entra
l gyr
us6
40
NS
01
33
(61
2 1
3)
Ant
erio
r cin
gula
te9
32
01
33
(minus21
38
12)
0N
S
Hum Brain Mapp Author manuscript available in PMC 2009 September 24
NIH
-PA Author Manuscript
NIH
-PA Author Manuscript
NIH
-PA Author Manuscript
Meda et al Page 20TA
BLE
IIIC
A c
ompo
nent
regi
ons t
hat s
how
ed a
sign
ifica
nt d
ose-
rela
ted
chan
ge a
long
with
thei
r MN
I coo
rdin
ates
and
cor
resp
ondi
ng T
alai
rach
labe
ls
Reg
ions
Hyp
othe
size
dfu
nctio
nalit
yB
rod-
man
nA
rea
Lef
t(V
ol C
C)
Rig
ht(V
ol C
C)
Tot
al(V
ol C
C)
Lef
t Max
T(M
NI
coor
ds)
Rig
htM
ax T
(MN
Ico
ords
)
Ove
rall
dosa
gere
late
dsi
gnifi
canc
e(P
val
ue)
Sim
ilar
com
pone
ntfr
omC
alho
un e
t al
2004
a
RED
CO
MPO
NEN
TEr
ror M
onito
ring
and
inhi
bitio
n0
04Pi
nk C
ompo
nent
Ant
erio
r Cin
gula
te10
32
24
25
32
32
64
119
(minus6
35 minus
9)14
4 (1
233
minus6)
Med
ial F
ront
alO
rbita
l Gyr
us10
11
25
39
36
75
126
(minus3
30 minus
15)
152
(12
36 minus
6)
Supe
rior F
ront
al G
yrus
11 1
0 9
60
51
82
36
7 (minus
12
54 minus
18)
76
(12
48 minus
15)
Infe
rior F
ront
al G
yrus
47 1
1 4
60
32
23
83
(minus12
39
minus24
)8
5 (1
523
minus18
)
Mid
dle
Fron
tal G
yrus
10 4
6 1
1 9
01
26
27
73
(minus15
42
minus24
)8
5 (3
939
24)
Rec
tal G
yrus
111
07
17
117
(minus6
30 minus
21)
88 (
3 27
minus2
1)
Subc
allo
sal G
yrus
25 1
1 4
71
31
42
710
9 (minus
915
minus12
)12
6 (6
18
minus14
)
BLU
E C
OM
PON
ENT
Gro
ssF
ine
Mot
or C
ontro
l0
02R
ed C
ompo
nent
Post
cent
ral G
yrus
7 5
3 2
40
111
614
256
156
(minus12
minus5
1 6
6)
147
(27
minus36
63)
Prec
entra
l Gyr
us4
611
143
253
144
(minus21
minus2
4 7
2)
144
(27
minus33
62)
Med
ial F
ront
al G
yrus
6 3
2 1
09
99
119
137
(minus9
minus27
63)
132
(0
minus9 5
4)
Cin
gula
te G
yrus
24 3
1 3
27
73
143
142
(minus3
minus6 5
1)13
8 (0
minus9
51)
Prec
uneu
s7
68
49
117
155
(minus9
minus51
63)
131
(9
minus48
59)
Para
cent
ral L
obul
e5
6 3
4 3
1 7
55
58
113
144
(minus12
minus3
3 6
0)
153
(6
minus42
60)
Supe
rior F
ront
al G
yrus
6 8
56
57
113
131
(minus9
minus21
69)
148
(21
minus12
69)
Hum Brain Mapp Author manuscript available in PMC 2009 September 24
NIH
-PA Author Manuscript
NIH
-PA Author Manuscript
NIH
-PA Author Manuscript
Meda et al Page 21
Reg
ions
Hyp
othe
size
dfu
nctio
nalit
yB
rod-
man
nA
rea
Lef
t(V
ol C
C)
Rig
ht(V
ol C
C)
Tot
al(V
ol C
C)
Lef
t Max
T(M
NI
coor
ds)
Rig
htM
ax T
(MN
Ico
ords
)
Ove
rall
dosa
gere
late
dsi
gnifi
canc
e(P
val
ue)
Sim
ilar
com
pone
ntfr
omC
alho
un e
t al
2004
a
Mid
dle
Fron
tal G
yrus
6 1
0 8
55
710
714
6(minus
18
minus12
62)
148
(18
minus14
66)
Infe
rior P
arie
tal L
obul
e40
22
52
95
411
1(minus
30
minus42
60)
124
(33
minus42
60)
Supe
rior P
arie
tal L
obul
e7
52
32
95
211
6(minus
18
minus54
64)
119
(18
minus51
60)
S GR
EEN
CO
MPO
NEN
TM
otor
pla
nnin
g G
oal
dire
cted
ness
005
Not
Obs
erve
d
Cin
gula
te G
yrus
24 3
2 3
14
66
811
412
1 (minus
66
40)
113
(0
18 3
6)
Sub
Nuc
lei
Puta
men
Lat
eral
Glo
bus
Palli
dus
473
17
810
99
1 (minus
9minus3
12)
115
(9 0
7)
Mid
dle
Fron
tal G
yrus
9 8
6 4
60
73
94
66
5 (minus
42
0 4
2)9
7 (5
112
33)
Med
ial F
ront
al G
yrus
6 8
32
92
64
87
411
7 (minus
312
51)
125
(0 9
51
)
Supe
rior F
ront
al G
yrus
6 8
9 1
01
32
94
29
8 (minus
312
54)
115
(0
12 5
4)
Infe
rior F
ront
al G
yrus
9 4
4 4
7 4
5 4
60
63
44
65
(minus42
6
30)
106
(54
12 3
0)
Supe
rior T
empo
ral G
yrus
22 4
2 4
1 3
8 2
10
82
23
66
(minus51
15
minus12
)7
6 (6
0minus1
6 0
)
Insu
la13
47
13
84
87
(minus36
9
6)12
1 (3
312
6)
Ant
erio
r Cin
gula
te32
24
33
42
16
28
44
77
(minus3
36 2
7)9
4 (0
39
24)
Thal
amus
Ven
tral
Ant
erio
r N
ucle
usV
entra
l1
23
84
(minus9
minus6 1
0)10
9 (9
minus3
6)
Cau
date
Cau
date
Hea
dCau
date
Bod
y1
21
42
68
4 (minus
12
12 9
)11
1 (1
515
6)
Para
cent
ral L
obul
e31
5 6
06
17
23
75
(minus3
minus39
51)
95
(0
minus39
51)
Infe
rior P
arie
tal L
obul
e40
08
13
21
69
(minus48
minus3
3 2
7)7
6 (6
0minus3
0 2
7)
Hum Brain Mapp Author manuscript available in PMC 2009 September 24
NIH
-PA Author Manuscript
NIH
-PA Author Manuscript
NIH
-PA Author Manuscript
Meda et al Page 22
Reg
ions
Hyp
othe
size
dfu
nctio
nalit
yB
rod-
man
nA
rea
Lef
t(V
ol C
C)
Rig
ht(V
ol C
C)
Tot
al(V
ol C
C)
Lef
t Max
T(M
NI
coor
ds)
Rig
htM
ax T
(MN
Ico
ords
)
Ove
rall
dosa
gere
late
dsi
gnifi
canc
e(P
val
ue)
Sim
ilar
com
pone
ntfr
omC
alho
un e
t al
2004
a
Prec
entra
l Gyr
us44
9 6
02
15
17
58
(minus57
9
9)
10 (5
4 9
12
)
Cun
eus
17 1
80
16
16
NS
76
(6
minus96
9)
Ling
ual G
yrus
17 1
80
11
11
57
(minus3
minus90
minus12
)7
2 (1
2minus8
7 minus
12)
PIN
K C
OM
PON
ENT
Fine
Mot
or C
ontro
l0
03O
rang
e-Tu
rquo
ise
Cer
ebel
lum
Dec
live
Cer
ebel
lar T
onsi
l In
ferio
rSe
mi-L
unar
Lob
ule
Cul
men
Py
ram
is
3318
5114
3(minus
21
minus72
minus30
)
114
(12
minus69
minus24
)
Mid
dle
Fron
tal G
yrus
9 4
6 1
0 8
60
21
21
NS
91
(54
27 4
0)
Prec
entra
l Gyr
us6
40
13
13
NS
72
(30
minus24
51)
OR
AN
GE
CO
MPO
NEN
TB
asel
ine
cond
ition
003
Blu
e C
ompo
nent
Post
erio
r Cin
gula
te23
30
31
29
57
38
95
148
(minus6
minus60
18)
136
(0
minus57
18)
Prec
uneu
s31
23
19
7 3
9 1
811
59
420
914
2 (minus
6minus6
3 1
8)14
1 (3
minus6
6 2
0)
Cin
gula
te G
yrus
31 2
3 2
4 3
26
25
411
614
(minus3
minus54
27)
141
(0
minus54
27)
Cun
eus
7 3
0 1
8 1
91
60
62
214
(minus3
minus72
30)
125
(0
minus72
30)
Ang
ular
Gyr
us39
27
12
39
139
(minus48
minus6
3 3
6)
87
(51
minus63
30)
Infe
rior P
arie
tal L
obul
e39
40
76
32
89
113
8(minus
42
minus72
39)
102
(48
minus69
39)
Supe
rior T
empo
ral G
yrus
39 3
8 2
23
81
75
513
3(minus
51
minus57
24)
122
(57
minus60
24)
Supr
amar
gina
l Gyr
us40
39
44
39
83
133
(minus51
minus6
0 3
3)
121
(51
minus57
27)
Med
ial F
ront
al G
yrus
10 8
9 6
32
11
102
54
156
126
(minus6
63 9
)11
8 (3
48
45)
Hum Brain Mapp Author manuscript available in PMC 2009 September 24
NIH
-PA Author Manuscript
NIH
-PA Author Manuscript
NIH
-PA Author Manuscript
Meda et al Page 23
Reg
ions
Hyp
othe
size
dfu
nctio
nalit
yB
rod-
man
nA
rea
Lef
t(V
ol C
C)
Rig
ht(V
ol C
C)
Tot
al(V
ol C
C)
Lef
t Max
T(M
NI
coor
ds)
Rig
htM
ax T
(MN
Ico
ords
)
Ove
rall
dosa
gere
late
dsi
gnifi
canc
e(P
val
ue)
Sim
ilar
com
pone
ntfr
omC
alho
un e
t al
2004
a
Mid
dle
Tem
pora
l Gyr
us39
21
19
20
22
38
37
91
24
115
123
(minus48
minus6
0 2
4)
92
(51
minus63
27)
Supe
rior P
arie
tal L
obul
e7
11
01
112
1(minus
36
minus75
45)
NS
Supe
rior F
ront
al G
yrus
9 8
10
613
33
416
711
2(minus
12 5
724
)
98 (
3 51
39
)
Infe
rior T
empo
ral G
yrus
20 2
11
21
83
87
(minus54
minus6
minus27
)11
1 (5
7minus1
2 minus
27)
Mid
dle
Fron
tal G
yrus
8 9
6 1
1 1
0 4
68
20
58
711
(minus45
12
49)
87
(39
36 minus
15)
Ant
erio
r Cin
gula
te42
32
10
24
05
29
107
(minus6
45 1
5)9
5 (3
48
12)
Prec
entra
l Gyr
us9
4 6
44
21
65
99
(minus42
21
39)
8 (5
4 minus
630
)
Infe
rior F
ront
al G
yrus
47 4
5 1
1 9
21
02
23
77
(minus30
21
minus21
)8
3 (3
636
minus18
)
Post
cent
ral G
yrus
3 2
70
90
51
47
4 (minus
42
minus27
60)
63
(45
minus18
57)
Hum Brain Mapp Author manuscript available in PMC 2009 September 24
NIH
-PA Author Manuscript
NIH
-PA Author Manuscript
NIH
-PA Author Manuscript
Meda et al Page 24
TABLE IIIPrincipal-component analysis for six driving behavioral measures
Rotated Components
1 2
Eigenvalues 1911 1852
Variance 31848 30872
Component Loading
emspYellow Line Crossings 0055 0779
emspPassenger White Line Crossings 0755 minus0186
emspOpposite White Line Crossings minus0014 0710
emspCrashes 0024 0819
emspMean Speed 0772 0178
emspMean Steering Weave 0861 0071
Component loadings of 06 or higher were considered significant and are in bold
Hum Brain Mapp Author manuscript available in PMC 2009 September 24
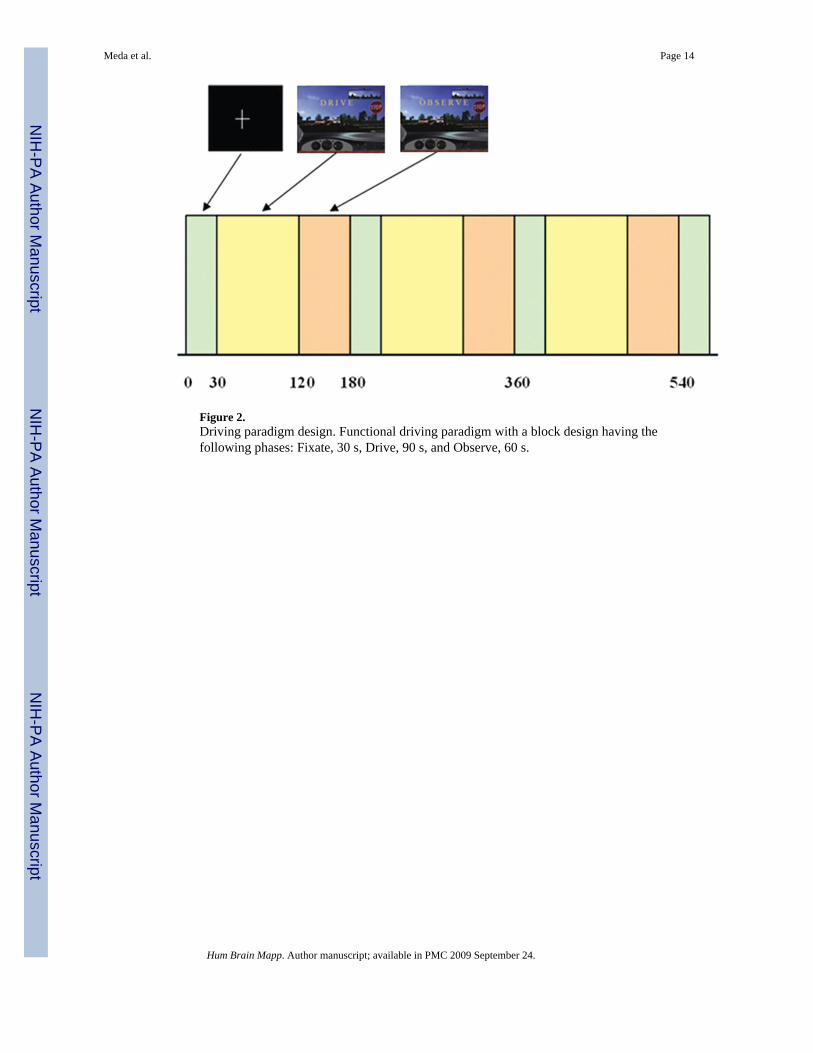
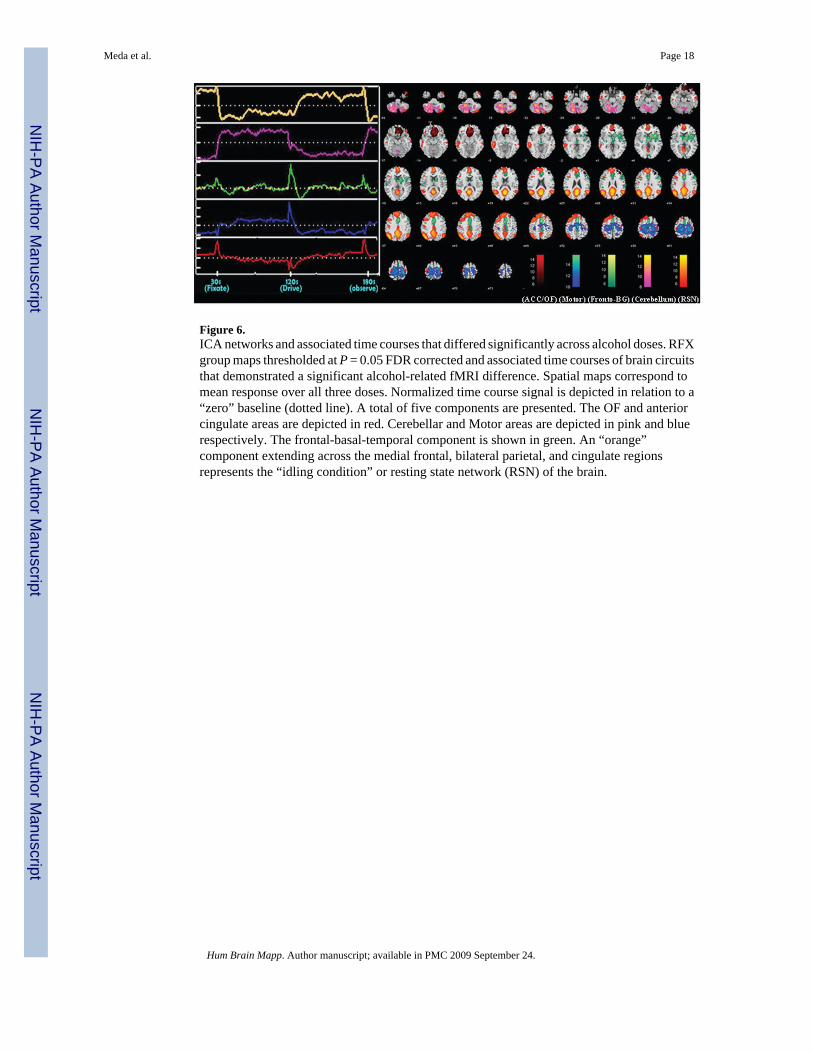
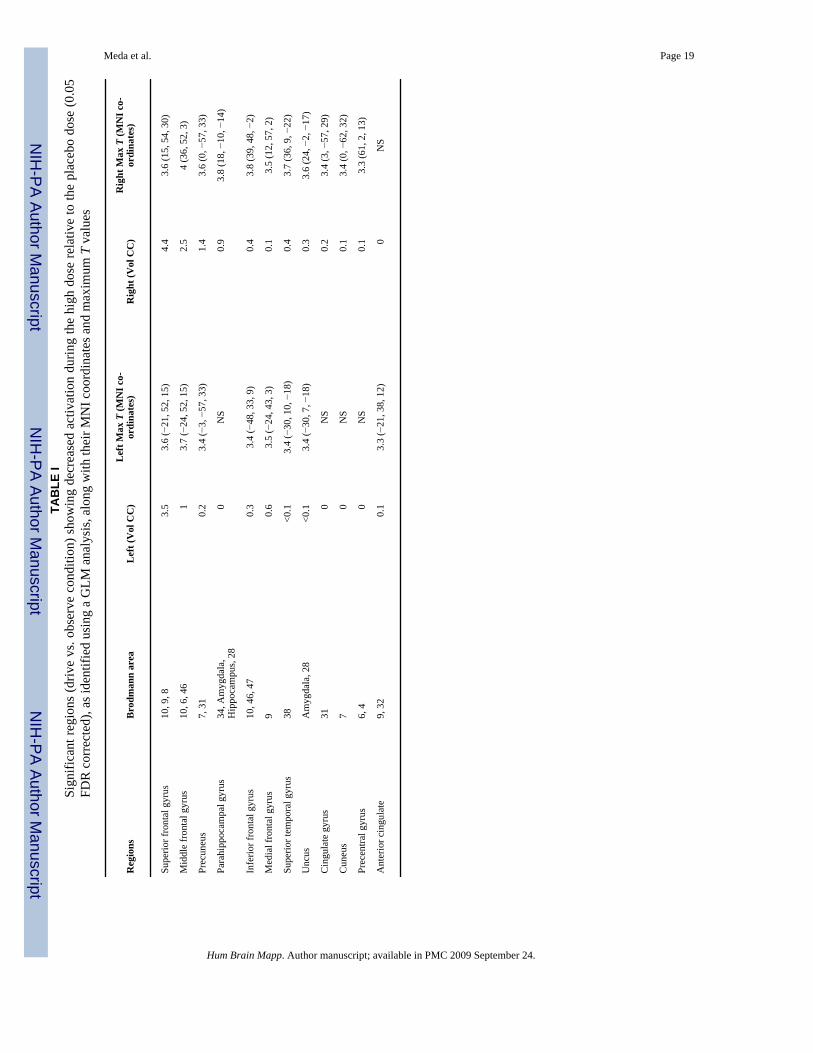
NIH
-PA Author Manuscript
NIH
-PA Author Manuscript
NIH
-PA Author Manuscript
Meda et al Page 24
TABLE IIIPrincipal-component analysis for six driving behavioral measures
Rotated Components
1 2
Eigenvalues 1911 1852
Variance 31848 30872
Component Loading
emspYellow Line Crossings 0055 0779
emspPassenger White Line Crossings 0755 minus0186
emspOpposite White Line Crossings minus0014 0710
emspCrashes 0024 0819
emspMean Speed 0772 0178
emspMean Steering Weave 0861 0071
Component loadings of 06 or higher were considered significant and are in bold
Hum Brain Mapp Author manuscript available in PMC 2009 September 24