media times limited
TRANSCRIPT

Media Times LimitedStatement of Financial PositionAs at 30 June 2018
2018 2017Note Rupees Rupees
ASSETS
Non-current assets
Property, plant and equipment 6 333,180,026 415,484,200 Intangibles 7 1,309,746 1,576,554 Long term deposits 6,539,043 6,751,283 Deferred taxation 8 - -
341,028,815 423,812,037 Current assets
Stores and spare parts 836,213 1,676,030 Trade debts 9 99,366,051 132,019,073 Advances, prepayments and other receivable 10 16,435,316 4,934,057 Advance income tax 6,666,068 12,661,037 Cash and bank balances 11 710,626 2,686,663
124,014,274 153,976,860 465,043,089 577,788,897
EQUITY AND LIABILITIES
Share capital and reserves
Authorised share capital210,000,000 (2017: 180,000,000) ordinary shares
of Rs. 10 each 12 2,100,000,000 1,800,000,000
Share capital 12 1,788,510,100 1,788,510,100 Share premium reserve 13 76,223,440 76,223,440 Accumulated loss (2,343,330,661) (2,112,215,026)
(478,597,121) (247,481,486)
Non-current liabilities
Long term finance 14 248,587,697 194,187,697 Deferred liability 15 31,956,709 33,218,002
280,544,406 227,405,699 Current liabilities
Trade and other payables 16 474,866,665 473,713,616 Accrued mark-up 17 119,313,584 55,419,959 Short term borrowings 18 48,000,000 50,295,520 Liabilities against assets subject to finance lease 19 20,915,555 18,435,589 Current maturity of long term finance - secured - -
663,095,804 597,864,684
465,043,089 577,788,897
Contingencies and commitments 20
The annexed notes from 1 to 37 form an integral part of these financial statements.
________________ __________ ____________________Director Chief Financial OfficerChief Executive

Media Times LimitedStatement of Profit or LossFor the year ended 30 June 2018
2018 2017Note Rupees Rupees
Revenue - net 21 354,887,897 385,849,282 Cost of production 22 (315,650,917) (337,955,925) Gross profit 39,236,980 47,893,357
Administrative and selling expenses 23 (209,822,482) (148,608,275) Other income 24 37,156,935 47,536,472 Finance costs 25 (67,623,390) (20,542,271) Other expenses 26 (18,331,229) (158,315) Loss before taxation (219,383,186) (73,879,032)
Taxation 27 (9,888,393) (6,193,541)
Loss after taxation (229,271,579) (80,072,573)
Loss per share - basic and diluted 28 (1.28) (0.45)
The annexed notes from 1 to 37 form an integral part of these financial statements.

Media Times LimitedStatement of Other Comprehensive IncomeFor the year ended 30 June 2018
2018 2017
Rupees Rupees
Loss after taxation (229,271,579) (80,072,573)
Other comprehensive income
Items that will never be reclassified to profit or loss:
- Actuarial (loss) / gain on defined benefit obligation (1,844,056) 2,096,237
Total comprehensive income for the year (231,115,635) (77,976,336)
The annexed notes from 1 to 37 form an integral part of these financial statements.
________________ __________ ____________________Director Chief Financial OfficerChief Executive
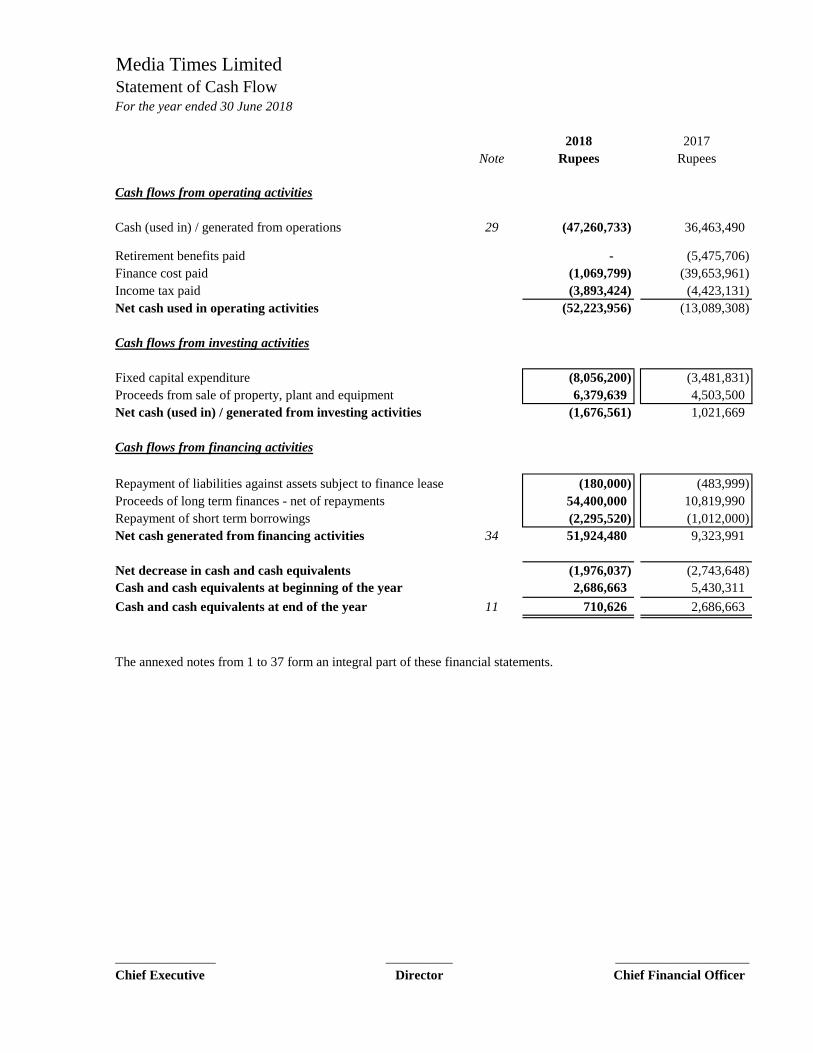
Media Times LimitedStatement of Cash Flow For the year ended 30 June 2018
2018 2017Note Rupees Rupees
Cash flows from operating activities
Cash (used in) / generated from operations 29 (47,260,733) 36,463,490
Retirement benefits paid - (5,475,706) Finance cost paid (1,069,799) (39,653,961) Income tax paid (3,893,424) (4,423,131) Net cash used in operating activities (52,223,956) (13,089,308)
Cash flows from investing activities
Fixed capital expenditure (8,056,200) (3,481,831) Proceeds from sale of property, plant and equipment 6,379,639 4,503,500 Net cash (used in) / generated from investing activities (1,676,561) 1,021,669
Cash flows from financing activities
Repayment of liabilities against assets subject to finance lease (180,000) (483,999) Proceeds of long term finances - net of repayments 54,400,000 10,819,990 Repayment of short term borrowings (2,295,520) (1,012,000) Net cash generated from financing activities 34 51,924,480 9,323,991
Net decrease in cash and cash equivalents (1,976,037) (2,743,648) Cash and cash equivalents at beginning of the year 2,686,663 5,430,311 Cash and cash equivalents at end of the year 11 710,626 2,686,663
The annexed notes from 1 to 37 form an integral part of these financial statements.
_______________ __________ ____________________Chief Executive Director Chief Financial Officer

Media Times LimitedStatement of Changes in EquityFor the year ended 30 June 2018
Capital reserve Revenue reserveShare Sharecapital premium Total
Balance at 30 June 2016 1,788,510,100 76,223,440 (2,034,238,690) (169,505,150)
Total comprehensive income for the year
Loss for the year - - (80,072,573) (80,072,573) Other comprehensive income for the
year ended 30 June 2017 - - 2,096,237 2,096,237
Total comprehensive loss - - (77,976,336) (77,976,336)
Balance at 30 June 2017 1,788,510,100 76,223,440 (2,112,215,026) (247,481,486)
Total comprehensive income for year
Loss for the year - - (229,271,579) (229,271,579) Other comprehensive income for the
year ended 30 June 2018 - - (1,844,056) (1,844,056)
Total comprehensive loss - - (231,115,635) (231,115,635)
Balance at 30 June 2018 1,788,510,100 76,223,440 (2,343,330,661) (478,597,121)
The annexed notes from 1 to 37 form an integral part of these financial statements.
_______________ __________ ____________________Director Chief Financial OfficerChief Executive
------------------------------------- Rupees ----------------------------------------
Accumulatedloss

Media Times LimitedNotes to the Financial StatementsFor the year ended 30 June 2018
1 Corporate and general information
1.1 Legal status and nature of business
---
--
1.2 Summary of significant events and transactions in the current reporting period
-
-
Media Times Limited ("the Company") was incorporated in Pakistan on 26 June 2001 as a private limitedcompany and was converted into public limited company on 06 March 2007. The Company is listed onthe Pakistan Stock Exchange. The registered office of the Company is located at 41-N, Industrial Area,Gulberg II, Lahore. The Company is primarily involved in printing and publishing daily English and Urdunews papers by the name of "Daily Times" and "AajKal" respectively. Printing facilities of the Companyare located at the following geographical locations:
The Company's financial position and performance was particularly affected by the following events andtransactions during the reporting period:
During the year the Company has outsourced marketing rights / airtime of "Business Plus" Channelagainst monthly fee of Rs. 5 million effective 15 July 2018, vide contact dated 6 April 2018 and"Zaiqa" Channel against monthly fee of Rs. 3.5 million for February 2018 and Rs. 4 million fromMarch 2018 onwards, vide contract dated 23 January 2018.
The Company is also operating satellite channels by the name of "Business Plus" and "Zaiqa"respectively. The facilities for these locations are located at the following geographical locations:
41-N, Industrial Area, Gulberg II, Lahore.Plot # 348, Industrial Area Street I, 9/3, Islamabad.D - 198, Site Area, Nazimabad, Karachi.
41-N, Industrial Area, Gulberg II, Lahore.Office # 5-B Lakson Sq Building # 1 Sarwar Shaheed Road, Karachi.
During the year, the Company has re-negotiated and then again defaulted from rescheduled termsand conditions of borrowing of Rs 50 million from Faysal Bank Limited which is explained in note18.1 to these financial statements.

−
−
2 Events and conditions related to going concern
3 Basis of preparation
3.1 Statement of compliance
−
−
3.2 Basis of measurement
3.3 Functional and presentation currency
International Financial Reporting Standards (IFRS) issued by the International AccountingStandards Board (IASB) as notified under the Companies Act 2017;
Provision of and directives issued under the Companies Act, 2017.
Where provisions of and directives issued under the Companies Act, 2017 differ from the IFRS, theprovisions of and directives issued under the Companies Act, 2017 have been followed.
For a detailed discussion about the Company's performance, please refer to the Director's reportaccompanied in the annual report of the company for the year ended 30 June 2018.
As explained in note 5.1 due to the first time application of financial reporting requirements underthe Companies Act, 2017, including disclosure and presentation requirements of the fourth scheduleof the Companies Act, 2017, some additional disclosures have been presented in these financialstatements.
The Company has incurred a net loss of Rs. 229.27 million during the year ended 30 June 2018 and, as of date,the Company’s current liabilities exceeded its total assets by Rs. 198.05 million. The Company’s equity haseroded and the accumulated losses exceed the share capital and share premium by Rs. 478.59 million at 30 June2018. There is a material uncertainty related to these events which may cast significant doubt on the Company'sability to continue as a going concern and, therefore, the Company may be unable to realize its assets anddischarge its liabilities in the normal course of business. As explained in note 1.2 to these financial statements,the Company has outsourced airtime / marketing rights of "Business Plus" and "Zaiqa" channels against fixedmonthly fee of Rs. 5 million and Rs. 4 million respectively. In addition, the Company has relaunched its UrduNewspaper "Daily Aaj Kal" and is planning to launch further products in print and social media sectors that willmainly include weekly magazines and Web TVs covering news, sports and fashion categories. The managementof the Company is confident that the above actions and steps shall enable the Company to attract revenue streamsthat will result in improved liquidity. Further the Company’s promoters have offered full support to the Companyto meet any working capital needs.
These financial statements have been prepared in accordance with the accounting and reporting standardsas applicable in Pakistan. The accounting and reporting standards applicable in Pakistan comprise of:
These financial statements have been prepared under the historical cost convention, except therecognition of certain employee benefits at present value.
These financial statements are presented in Pakistani Rupee ("Rs.") which is the Company’s functionalcurrency. All financial information presented in Rupees has been rounded off to the nearest rupee, unlessotherwise stated.
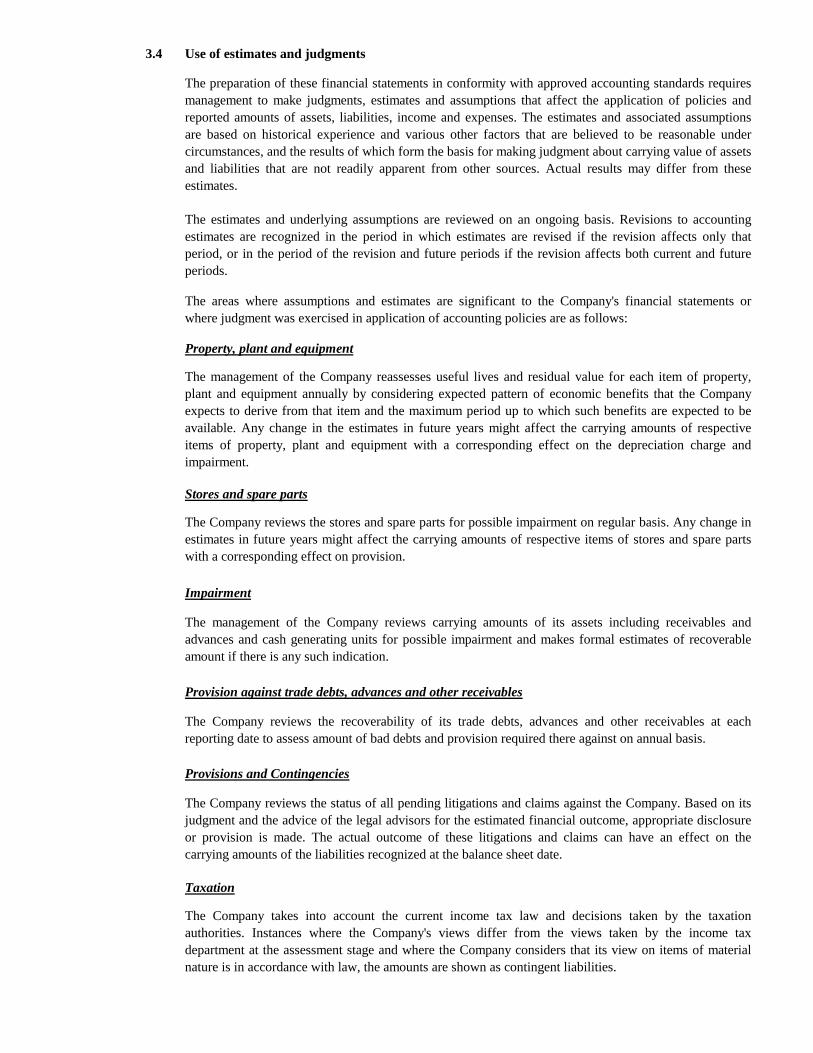
3.4 Use of estimates and judgments
Stores and spare parts
Impairment
Provision against trade debts, advances and other receivables
Provisions and Contingencies
Taxation
The estimates and underlying assumptions are reviewed on an ongoing basis. Revisions to accountingestimates are recognized in the period in which estimates are revised if the revision affects only thatperiod, or in the period of the revision and future periods if the revision affects both current and futureperiods.
The areas where assumptions and estimates are significant to the Company's financial statements orwhere judgment was exercised in application of accounting policies are as follows:
The management of the Company reviews carrying amounts of its assets including receivables andadvances and cash generating units for possible impairment and makes formal estimates of recoverableamount if there is any such indication.
The Company reviews the recoverability of its trade debts, advances and other receivables at eachreporting date to assess amount of bad debts and provision required there against on annual basis.
The Company reviews the status of all pending litigations and claims against the Company. Based on itsjudgment and the advice of the legal advisors for the estimated financial outcome, appropriate disclosureor provision is made. The actual outcome of these litigations and claims can have an effect on thecarrying amounts of the liabilities recognized at the balance sheet date.
The management of the Company reassesses useful lives and residual value for each item of property,plant and equipment annually by considering expected pattern of economic benefits that the Companyexpects to derive from that item and the maximum period up to which such benefits are expected to beavailable. Any change in the estimates in future years might affect the carrying amounts of respectiveitems of property, plant and equipment with a corresponding effect on the depreciation charge andimpairment.
The preparation of these financial statements in conformity with approved accounting standards requiresmanagement to make judgments, estimates and assumptions that affect the application of policies andreported amounts of assets, liabilities, income and expenses. The estimates and associated assumptionsare based on historical experience and various other factors that are believed to be reasonable undercircumstances, and the results of which form the basis for making judgment about carrying value of assetsand liabilities that are not readily apparent from other sources. Actual results may differ from theseestimates.
Property, plant and equipment
The Company reviews the stores and spare parts for possible impairment on regular basis. Any change inestimates in future years might affect the carrying amounts of respective items of stores and spare partswith a corresponding effect on provision.
The Company takes into account the current income tax law and decisions taken by the taxationauthorities. Instances where the Company's views differ from the views taken by the income taxdepartment at the assessment stage and where the Company considers that its view on items of materialnature is in accordance with law, the amounts are shown as contingent liabilities.

Staff retirement benefits
4 Summary of Significant Accounting Polices
4.1
4.2 Property, plant and equipment
Owned
Leased
The Company operates approved unfunded gratuity scheme covering all its full time permanent workerswho have completed the minimum qualifying period of service as defined under the respective scheme.The gratuity scheme is managed by trustees. The calculation of the benefit requires assumptions to bemade of future outcomes, the principal ones being in respect of increase in remuneration and the discountrate used to convert future cash flows to current values. The assumptions used for the plan are determinedby independent actuary on annual basis.
Gratuity cost primarily represents the increase in actuarial present value of the obligation for benefitsearned on employee service during the year and the interest on the obligation in respect of employeeservice in previous years. Calculations are sensitive to changes in the underlying assumptions.
Assets held under finance lease arrangements are initially recorded at the lower of present value ofminimum lease payments under the lease agreements and the fair value of leased assets. Depreciation onleased assets is charged by applying straight line method at the rates used for similar owned assets, so asto depreciate the assets over their estimated useful life in view of certainty of ownership of assets at theend of the lease term.
The accounting policies set out below have been applied consistently to all periods presented in these financialstatements, except as disclosed in note 4.1.
Depreciation is provided on straight line method and charged to profit and loss account to write off thedepreciable amount of each asset over its estimated useful life at the rates specified in note to thesefinancial statements after taking into account their residual values. Depreciation on additions is chargedfrom the date asset is available for use up to the date when asset is retired.
An item of property, plant and equipment is derecognized upon disposal or when no future economicbenefits are expected from its use or disposal. Gains and losses on sale of an item of property, plant andequipment are determined by comparing the proceeds from sale with the carrying amount of property,plant and equipment, and are recognised in profit or loss account.
Changes in accounting policy
Pursuant to the requirements of IAS 7 "Statement of cash flows" a disclosure of reconciliation ofmovements of liabilities to cash flows arising from financing activities has been given in note 34 to thesefinancial statements. This change does not have any impact on the figures reported in these financialstatements.
Items of property, plant and equipment are stated at cost less accumulated depreciation and impairmentlosses, if any. Cost in relation to property, plant and equipment comprises acquisition and other directlyattributable costs. The cost of replacing part of an item of property, plant and equipment is recognized inthe carrying amount of the item if it is possible that the future economic benefits embodied in the part willflow to the entity and its cost can be measured reliably. The carrying amount of the replaced part isderecognized. The costs of the day to day servicing of property, plant and equipment are recognized inprofit and loss as incurred.

4.3 Intangibles
4.4 Stores and spare parts
4.5 Trade debts
4.6 Cash and cash equivalents
4.7
4.7.1 Non-derivative financial assets
Finite intangibles are amortized using straight-line method over their estimated useful lives. Amortizationon additions to intangible assets is charged from the month in which an asset is put to use and on disposalup to the month of disposal.
Trade debts are carried at original invoice amount less an estimate made for doubtful debts based onreview of outstanding amounts at the year end. Bad debts are written off when identified.
Intangibles are stated at cost less accumulated amortization for finite intangibles and any identifiedimpairment loss. The estimated useful life and amortization method is reviewed at the end of each annualreporting period, with effect of any changes in estimate being accounted for on a prospective basis.
For the purpose of cash flow statement, cash and cash equivalents comprise cash in hand and bankbalances which are carried in the balance sheet at cost.
These are stated at lower of cost and net realizable value. Cost is determined using the weighted averagemethod. Items in transit are valued at cost comprising invoice value plus other charges paid thereon.
Financial instruments
The Company initially recognises loans and receivables on the date that they are originated. All otherfinancial assets (including assets designated as at fair value through profit or loss) are recognised initiallyon the trade date, which is the date that the Company becomes a party to the contractual provisions of theinstrument.
Financial assets and liabilities are recognized when the Company becomes a party to contractualprovisions of the instrument and de-recognized when the Company looses control of contractual rightsthat comprise the financial asset and in case of financial liability when the obligation specified in thecontract is discharged, cancelled or expired. Any gain or loss on derecognition of financial assets andliabilities are included in profit and loss account for the year.
The Company derecognises a financial asset when the contractual rights to the cash flows from the assetexpire, or it transfers the rights to receive the contractual cash flows in a transaction in whichsubstantially all the risks and rewards of ownership of the financial asset are transferred. Any interest insuch transferred financial assets that is created or retained by the Company is recognised as a separateasset or liability.
The Company classifies non-derivative financial assets into the following categories: financial assets atfair value through profit or loss, held-to-maturity financial assets, loans and receivables and available-for-sale financial assets.

4.7.2
�Subsequent to initial recognition, they are measured at fair value and changes therein, other thanimpairment losses and foreign currency differences on available-for-sale debt instruments, are recognisedin other comprehensive income and presented in the fair value reserve in equity. When an investment isderecognized, the gain or loss accumulated in equity is reclassified to profit or loss. However theCompany has no such financial assets at the year end.
The Company classifies financial liabilities recognised initially at fair value less any directly attributabletransaction costs. Subsequent to initial recognition, these financial liabilities are measured at amortizedcost using the effective interest method.
Financial liabilities comprise long term finances, liabilities against assets subject to finance lease, tradeand other payables, accrued mark-up and short term borrowings.
Financial assets at fair value through profit or loss
Held-to-maturity financial assets
Non-derivative financial liabilities
The Company initially recognises debt securities issued and subordinated liabilities on the date that theyare originated. All other financial liabilities are recognised initially on the trade date, which is the datethat the Company becomes a party to the contractual provisions of the instrument.
The Company derecognises a financial liability when its contractual obligations are discharged, cancelledor expire.
Loans and receivables
Loans and receivables are financial assets with fixed or determinable payments that are not quoted in anactive market. Such assets are recognised initially at fair value plus any directly attributable transactioncosts. Subsequent to initial recognition, loans and receivables are measured at amortized cost using theeffective interest method, less any impairment losses.
Loans and receivables comprise of long term deposits, trade debts, other receivables and cash and bankbalances.
Available-for-sale financial assets
Available-for-sale financial assets are non-derivative financial assets that are designated as available-for-sale or are not classified in any of the above categories of financial assets. Available-for-sale financialassets are recognised initially at fair value plus any directly attributable transaction costs.
If the Company has the positive intent and ability to hold debt securities to maturity, then such financialassets are classified as held-to-maturity. Held-to-maturity financial assets are recognised initially at fairvalue plus any directly attributable transaction costs. Subsequent to initial recognition, held-to-maturityfinancial assets are measured at amortized cost using the effective interest method, less any impairmentlosses. However the Company has no such financial assets at the year end.
A financial asset is classified as at fair value through profit or loss if it is classified as held-for trading oris designated as such on initial recognition. Financial assets are designated as at fair value through profitor loss if the Company manages such investments and makes purchase and sale decisions based on theirfair value in accordance with the Company’s documented risk management or investment strategy.Attributable transaction costs are recognised in profit or loss as incurred. Financial assets at fair valuethrough profit or loss are measured at fair value and changes therein, which takes into account anydividend income, are recognised in profit or loss. However the Company has no such financial assets atthe year end.

4.8 Impairment
Financial assets
Non-financial assets
4.9 Offsetting of financial assets and financial liabilities
4.10
Impairment losses on available for sale financial assets are recognised by reclassifying the lossesaccumulated in the fair value reserve to profit or loss. The amount reclassified is the difference betweenthe acquisition cost (net of any principal repayment and amortization) and the current fair value, less anyimpairment loss previously recognised in profit or loss. If the fair value of an impaired available for saledebt security subsequently increases and the increase can be related objectively to an event occurringafter the impairment loss was recognised, then the impairment loss is reversed though profit and loss;otherwise it is reversed through other comprehensive income.
A financial asset is assessed at each reporting date to determine whether there is any objective evidencethat it is impaired. Individually significant financial assets are tested for impairment on an individualbasis. The remaining financial assets are assessed collectively in groups that share similar credit riskcharacteristics. A financial asset is considered to be impaired if objective evidence indicates that one ormore events have had a negative effect on the estimated future cash flows of the asset.
An impairment loss in respect of a financial asset measured at amortized cost is calculated as thedifference between its carrying amount, and the present value of the estimated future cash flowsdiscounted at the original effective interest rate. Impairment loss in respect of a financial asset measuredat fair value is determined by reference to that fair value. All impairment losses are recognized in profitand loss account. An impairment loss is reversed if the reversal can be related objectively to an eventoccurring after the impairment loss was recognized. An impairment loss is reversed only to the extent thatthe financial asset’s carrying amount after the reversal does not exceed the carrying amount that wouldhave been determined, net of amortization, if no impairment loss had been recognized.
A financial asset and a financial liability is offset and the net amount is reported in the balance sheet ifthe Company has a legally enforceable right to offset the recognized amounts and intends either to settleon a net basis or to realize the asset and settle the liability simultaneously.
Share capital
Ordinary shares are classified as equity. Incremental costs directly attributable to the issue of ordinaryshares are recognised as a deduction from equity, net of any tax effects.
An impairment loss is recognized if the carrying amount of the assets or its cash generating unit exceedsits estimated recoverable amount. Impairment losses are recognized in profit and loss account.Impairment losses recognized in respect of cash generating units are allocated to reduce the carryingamounts of the assets in a unit on a pro rata basis. Impairment losses recognized in prior periods areassessed at each reporting date for any indications that the loss has decreased or no longer exists. Animpairment loss is reversed if there has been a change in the estimates used to determine the recoverableamount. An impairment loss is reversed only to that extent that the asset’s carrying amount after thereversal does not exceed the carrying amount that would have been determined, net of depreciation andamortization, if no impairment loss had been recognized.
The carrying amount of the Company’s non-financial assets, other than inventories and deferred taxassets are reviewed at each reporting date to determine whether there is any indication of impairment. Ifany such indication exists, then the asset’s recoverable amount is estimated. The recoverable amount ofan asset or cash generating unit is the greater of its value in use and its fair value less cost to sell. Inassessing value in use, the estimated future cash flows are discounted to their present values using a pre-tax discount rate that reflects current market assessments of the time value of money and the risks specificto the asset or cash generating unit.

4.11 Retirement and other benefits
Post employment benefits - Defined benefit plan
4.12 Trade and other payables
4.13 Provisions
4.14 Revenue recognition
Revenue from sale of newspaper is recorded at the time of dispatch of newspapers;
Salaries, wages and benefits are accrued in the period in which the associated services are rendered byemployees of the Company and measured on an undiscounted basis. The accounting policy for employeeretirement benefits is described below:
The Company's net obligation in respect of defined benefit plans is calculated by estimating the amountof future benefit that employees have earned in the current and prior periods and discounting that amount.The calculation of defined benefit obligations is performed annually by a qualified actuary using theprojected unit credit method.
Remeasurements of the net defined benefit liability, which comprise actuarial gains and losses, arerecognised immediately in other comprehensive income. The Company determines the net interestexpense on the net defined benefit liability for the period by applying the discount rate used to measurethe defined benefit obligation at the beginning of the annual period to the then net defined benefitliability, taking into account any changes in the net defined benefit liability during the period as a resultof contributions and benefit payments. Net interest expense and other expenses related to defined benefitplans are recognised in profit and loss account.
A provision is recognized in the balance sheet when the Company has a legal or constructive obligationas a result of a past event, and it is probable that an outflow of economic benefits will be required to settlethe obligation and a reliable estimate can be made of the amount of obligation. The amount recognized asa provision reflects the best estimate of the expenditure required to settle the present obligation at the endof the reporting period. However, provisions are reviewed at each balance sheet date and adjusted toreflect current best estimates.
Revenue from advertisement in print media is recognized at the time of publication ofadvertisement;
The Company operates unfunded defined benefit gratuity plan for all permanent employees, having aservice period of more than one year. The Company recognizes expense in accordance with IAS 19"Employee Benefits".
Liabilities for trade and other amounts payable are carried at cost which is the fair value of theconsideration to be paid in future for goods or services received.
Revenue represents the fair value of the consideration received or receivable for goods sold and servicesrendered, net of discounts, commission and sales tax. Revenue is recognized when the significant risksand rewards of ownership have been transferred to the customer, recovery of the consideration isprobable, the associated costs and possible return of goods can be estimated reliably, there is nocontinuing involvement of management with the goods and the amount of revenue can be measuredreliably. Revenue from different sources are recognized as follows:
Sale of outdated newspaper (i.e. scrap) is recognized on actual realization basis;
Outsourcing and other services are recorded as revenue when the related services are provided;
Rental income is recognized on accrual basis;
Dividend income is recognized when the Company's right to receive payment is established; and
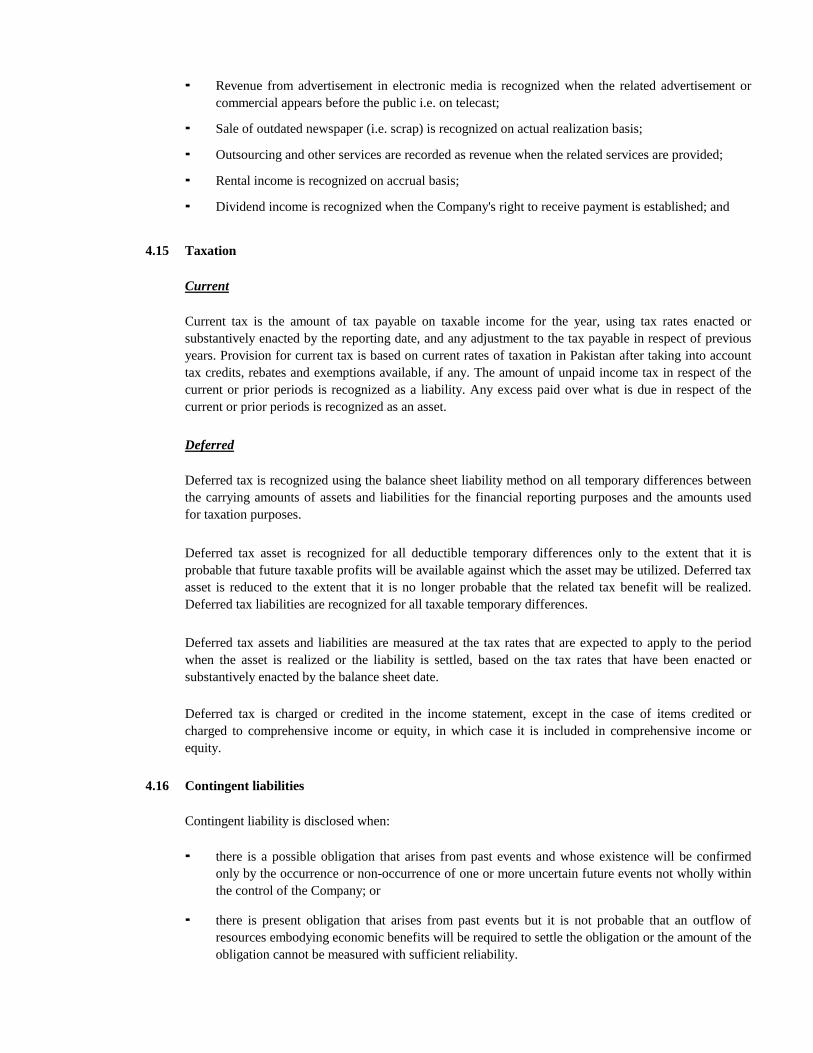
4.15 Taxation
Current
Deferred
4.16 Contingent liabilities
there is present obligation that arises from past events but it is not probable that an outflow ofresources embodying economic benefits will be required to settle the obligation or the amount of theobligation cannot be measured with sufficient reliability.
Current tax is the amount of tax payable on taxable income for the year, using tax rates enacted orsubstantively enacted by the reporting date, and any adjustment to the tax payable in respect of previousyears. Provision for current tax is based on current rates of taxation in Pakistan after taking into accounttax credits, rebates and exemptions available, if any. The amount of unpaid income tax in respect of thecurrent or prior periods is recognized as a liability. Any excess paid over what is due in respect of thecurrent or prior periods is recognized as an asset.
Deferred tax is recognized using the balance sheet liability method on all temporary differences betweenthe carrying amounts of assets and liabilities for the financial reporting purposes and the amounts usedfor taxation purposes.
Deferred tax asset is recognized for all deductible temporary differences only to the extent that it isprobable that future taxable profits will be available against which the asset may be utilized. Deferred taxasset is reduced to the extent that it is no longer probable that the related tax benefit will be realized.Deferred tax liabilities are recognized for all taxable temporary differences.
Deferred tax assets and liabilities are measured at the tax rates that are expected to apply to the periodwhen the asset is realized or the liability is settled, based on the tax rates that have been enacted orsubstantively enacted by the balance sheet date.
Deferred tax is charged or credited in the income statement, except in the case of items credited orcharged to comprehensive income or equity, in which case it is included in comprehensive income orequity.
Contingent liability is disclosed when:
Revenue from advertisement in electronic media is recognized when the related advertisement orcommercial appears before the public i.e. on telecast;
there is a possible obligation that arises from past events and whose existence will be confirmedonly by the occurrence or non-occurrence of one or more uncertain future events not wholly withinthe control of the Company; or

4.17 Foreign currency transactions and balances
4.18 Earnings per share
4.19 Segment reporting
5
5.1
5.2
Basic earnings per share (EPS) is calculated by dividing the profit or loss attributable to ordinaryshareholders of the Company by the weighted average number of ordinary shares outstanding during theyear.
Non-monetary assets and liabilities that are measured at fair value in a foreign currency are retranslated tothe functional currency at the exchange rate at the date that the fair value was determined. Non-monetaryitems that are measured based on historical cost in a foreign currency are not translated.
Foreign currency differences arising on retranslation are generally recognized in profit and loss account.
The following International Financial Reporting Standards (IFRS Standards) as notified under theCompanies Act, 2017 and the amendments and interpretations thereto will be effective for accountingperiods beginning on or after 01 July 2018:
New Companies Act, 2017 and new and revised approved accounting standards, interpretations andamendments thereto
A segment is a distinguishable component of the Company that is engaged either in providing products orservices (business segment), or in providing products or services within a particular economicenvironment (geographical segment), which is subject to risk and rewards that are different from othersegments. Operating segment are reported in a manner consistent with the internal reporting provided tothe chief operating decision maker. The chief operating decision maker who is responsible for allocatingresources and assessing performance of the operating segments, has been identified as the Board ofDirector of the Company that makes strategic decisions.
Companies Act, 2017 has become applicable on financial statements of the Companies whose financialyear / interim period closes on or after 01 January 2018. The new Act specified certain additionaldisclosures to be included in the financial statements. Accordingly, the Company has presented therequired disclosures in these financial statements and represented certain comparatives. However therewas no change in the reported amounts of statement of profit or loss and other comprehensive income orthe amounts presented in the statement of financial position due to these re-presentations.
Classification and Measurement of Share-based Payment Transactions - amendments to IFRS 2clarify the accounting for certain types of arrangements and are effective for annual periodsbeginning on or after 1 January 2018. The amendments cover three accounting areas (a)measurement of cash-settled share-based payments; (b) classification of share-based paymentssettled net of tax withholdings; and (c) accounting for a modification of a share-based paymentfrom cash-settled to equity-settled. The new requirements could affect the classification and/or
Transactions in foreign currencies are translated to the respective functional currencies of the Company atexchange rates at the dates of the transactions. Monetary assets and liabilities denominated in foreigncurrencies at the reporting date are retranslated to the functional currency at the exchange rate at that date.The foreign currency gain or loss on monetary items is the difference between amortized cost in thefunctional currency at the beginning of the year, adjusted for effective interest and payments during theyear, and the amortized cost in foreign currency translated at the exchange rate at the end of the year.

IFRS 15 ‘Revenue from contracts with customers’ (effective for annual periods beginning on orafter 1 July 2018). IFRS 15 establishes a comprehensive framework for determining whether, howmuch and when revenue is recognized. It replaces existing revenue recognition guidance, includingIAS 18 ‘Revenue’, IAS 11 ‘Construction Contracts’ and IFRIC 13 ‘Customer LoyaltyProgrammes’. The Company is currently in the process of analyzing the potential impact of changesrequired in revenue recognition policies on adoption of the standard.
IFRIC 23 ‘Uncertainty over Income Tax Treatments’ (effective for annual periods beginning on orafter 1 January 2019) clarifies the accounting for income tax when there is uncertainty over incometax treatments under IAS 12. The interpretation requires the uncertainty over tax treatment bereflected in the measurement of current and deferred tax. The application of interpretation is notlikely to have an impact on the Company’s financial statements.
Transfers of Investment Property (Amendments to IAS 40 ‘Investment Property’, effective forannual periods beginning on or after 1 January 2018) clarifies that an entity shall transfer a propertyto, or from, investment property when, and only when there is a change in use. A change in useoccurs when the property meets, or ceases to meet, the definition of investment property and there isevidence of the change in use. In isolation, a change in management's intentions for the use of aproperty does not provide evidence of a change in use. The amendments are not likely to have animpact on the Company’s financial statements.
Annual Improvements to IFRSs 2014-2016 Cycle [Amendments to IAS 28 ‘Investments inAssociates and Joint Ventures’] (effective for annual periods beginning on or after 1 January 2018)clarifies that a venture capital organization and other similar entities may elect to measureinvestments in associates and joint ventures at fair value through profit or loss, for each associate orjoint venture separately at the time of initial recognition of investment. Furthermore, similar electionis available to non-investment entity that has an interest in an associate or joint venture that is aninvestment entity, when applying the equity method, to retain the fair value measurement applied bythat investment entity associate or joint venture to the investment entity associate's or joint venture'sinterests in subsidiaries. This election is made separately for each investment entity associate orjoint venture. The amendments are not likely to have an impact on the Company’s financialstatements.
IFRIC 22 ‘Foreign Currency Transactions and Advance Consideration’ (effective for annualperiods beginning on or after 1 January 2018) clarifies which date should be used for translationwhen a foreign currency transaction involves payment or receipt in advance of the item it relates to.The related item is translated using the exchange rate on the date the advance foreign currency isreceived or paid and the prepayment or deferred income is recognized. The date of the transactionfor the purpose of determining the exchange rate to use on initial recognition of the related asset,expense or income (or part of it) would remain the date on which receipt of payment from advanceconsideration was recognized. If there are multiple payments or receipts in advance, the entity shalldetermine a date of the transaction for each payment or receipt of advance consideration. Theapplication of interpretation is not likely to have an impact on the Company’s financial statements.
IFRS 9 ‘Financial Instruments’ and amendment – Prepayment Features with NegativeCompensation (effective for annual periods beginning on or after 1 July 2018 and 1 January 2019respectively). IFRS 9 replaces the existing guidance in IAS 39 Financial Instruments: Recognitionand Measurement. IFRS 9 includes revised guidance on the classification and measurement offinancial instruments, a new expected credit loss model for calculating impairment on financialassets, and new general hedge accounting requirements. It also carries forward the guidance on
measurement of these arrangements and potentially the timing and amount of expense recognizedfor new and outstanding awards. The amendments are not likely to have an impact on theCompany’s financial statements.
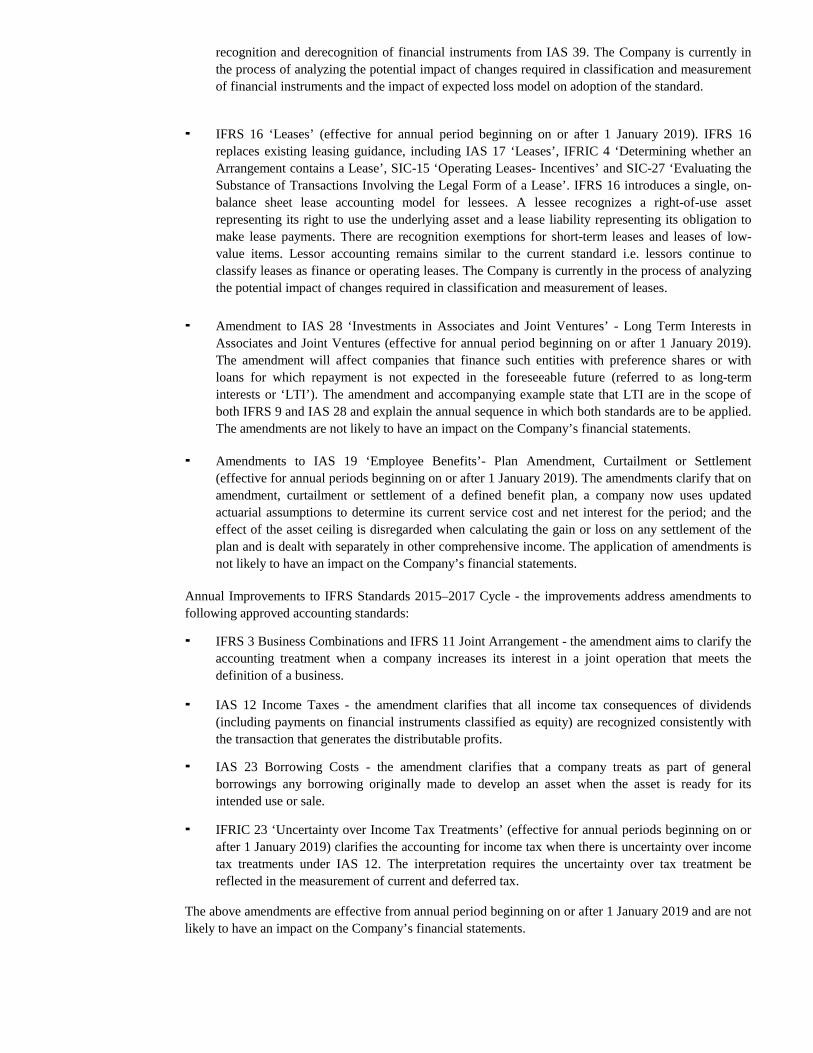
IFRIC 23 ‘Uncertainty over Income Tax Treatments’ (effective for annual periods beginning on orafter 1 January 2019) clarifies the accounting for income tax when there is uncertainty over incometax treatments under IAS 12. The interpretation requires the uncertainty over tax treatment bereflected in the measurement of current and deferred tax.
The above amendments are effective from annual period beginning on or after 1 January 2019 and are notlikely to have an impact on the Company’s financial statements.
IAS 12 Income Taxes - the amendment clarifies that all income tax consequences of dividends(including payments on financial instruments classified as equity) are recognized consistently withthe transaction that generates the distributable profits.
Annual Improvements to IFRS Standards 2015–2017 Cycle - the improvements address amendments tofollowing approved accounting standards:
IAS 23 Borrowing Costs - the amendment clarifies that a company treats as part of generalborrowings any borrowing originally made to develop an asset when the asset is ready for itsintended use or sale.
Amendment to IAS 28 ‘Investments in Associates and Joint Ventures’ - Long Term Interests inAssociates and Joint Ventures (effective for annual period beginning on or after 1 January 2019).The amendment will affect companies that finance such entities with preference shares or withloans for which repayment is not expected in the foreseeable future (referred to as long-terminterests or ‘LTI’). The amendment and accompanying example state that LTI are in the scope ofboth IFRS 9 and IAS 28 and explain the annual sequence in which both standards are to be applied.The amendments are not likely to have an impact on the Company’s financial statements.
IFRS 16 ‘Leases’ (effective for annual period beginning on or after 1 January 2019). IFRS 16replaces existing leasing guidance, including IAS 17 ‘Leases’, IFRIC 4 ‘Determining whether anArrangement contains a Lease’, SIC-15 ‘Operating Leases- Incentives’ and SIC-27 ‘Evaluating theSubstance of Transactions Involving the Legal Form of a Lease’. IFRS 16 introduces a single, on-balance sheet lease accounting model for lessees. A lessee recognizes a right-of-use assetrepresenting its right to use the underlying asset and a lease liability representing its obligation tomake lease payments. There are recognition exemptions for short-term leases and leases of low-value items. Lessor accounting remains similar to the current standard i.e. lessors continue toclassify leases as finance or operating leases. The Company is currently in the process of analyzingthe potential impact of changes required in classification and measurement of leases.
Amendments to IAS 19 ‘Employee Benefits’- Plan Amendment, Curtailment or Settlement(effective for annual periods beginning on or after 1 January 2019). The amendments clarify that onamendment, curtailment or settlement of a defined benefit plan, a company now uses updatedactuarial assumptions to determine its current service cost and net interest for the period; and theeffect of the asset ceiling is disregarded when calculating the gain or loss on any settlement of theplan and is dealt with separately in other comprehensive income. The application of amendments isnot likely to have an impact on the Company’s financial statements.
recognition and derecognition of financial instruments from IAS 39. The Company is currently inthe process of analyzing the potential impact of changes required in classification and measurementof financial instruments and the impact of expected loss model on adoption of the standard.
IFRS 3 Business Combinations and IFRS 11 Joint Arrangement - the amendment aims to clarify theaccounting treatment when a company increases its interest in a joint operation that meets thedefinition of a business.
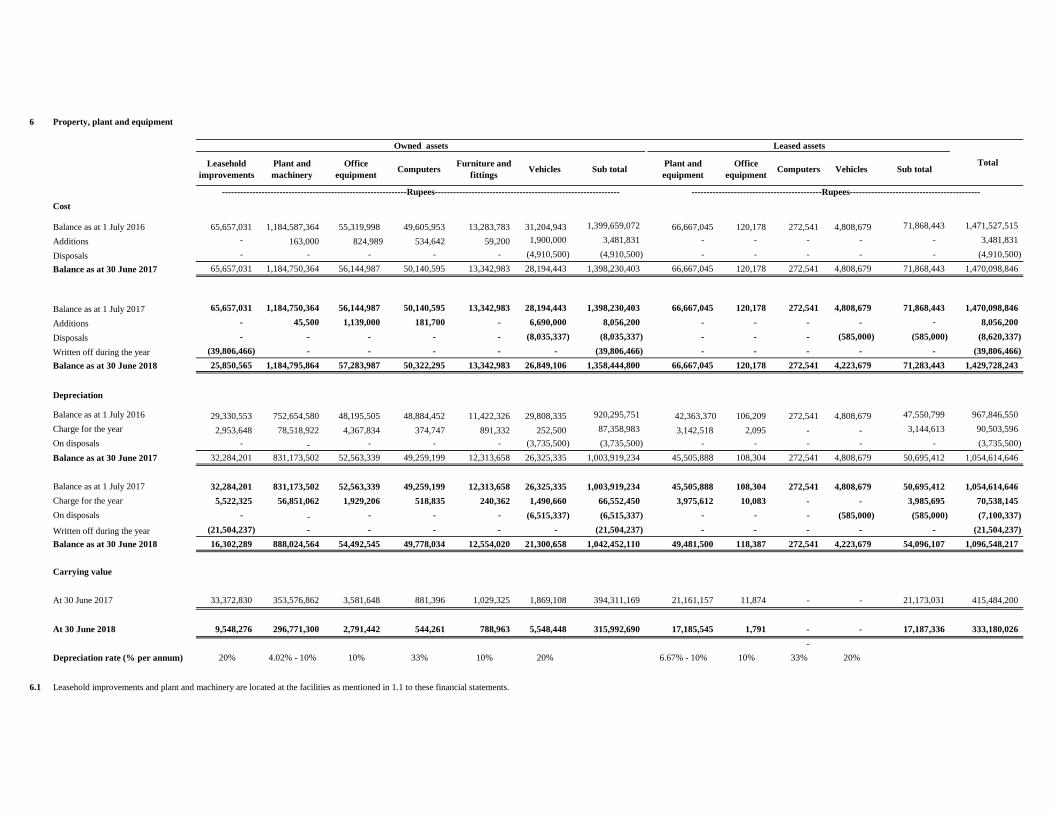
6 Property, plant and equipment
Leasehold improvements
Plant and machinery
Office equipment Computers Furniture and
fittings Vehicles Sub total Plant and equipment
Office equipment Computers Vehicles Sub total
Cost
Balance as at 1 July 2016 65,657,031 1,184,587,364 55,319,998 49,605,953 13,283,783 31,204,943 1,399,659,072 66,667,045 120,178 272,541 4,808,679 71,868,443 1,471,527,515
Additions - 163,000 824,989 534,642 59,200 1,900,000 3,481,831 - - - - - 3,481,831
Disposals - - - - - (4,910,500) (4,910,500) - - - - - (4,910,500)
Balance as at 30 June 2017 65,657,031 1,184,750,364 56,144,987 50,140,595 13,342,983 28,194,443 1,398,230,403 66,667,045 120,178 272,541 4,808,679 71,868,443 1,470,098,846
Balance as at 1 July 2017 65,657,031 1,184,750,364 56,144,987 50,140,595 13,342,983 28,194,443 1,398,230,403 66,667,045 120,178 272,541 4,808,679 71,868,443 1,470,098,846
Additions - 45,500 1,139,000 181,700 - 6,690,000 8,056,200 - - - - - 8,056,200
Disposals - - - - - (8,035,337) (8,035,337) - - - (585,000) (585,000) (8,620,337)
Written off during the year (39,806,466) - - - - - (39,806,466) - - - - - (39,806,466) Balance as at 30 June 2018 25,850,565 1,184,795,864 57,283,987 50,322,295 13,342,983 26,849,106 1,358,444,800 66,667,045 120,178 272,541 4,223,679 71,283,443 1,429,728,243
Depreciation
Balance as at 1 July 2016 29,330,553 752,654,580 48,195,505 48,884,452 11,422,326 29,808,335 920,295,751 42,363,370 106,209 272,541 4,808,679 47,550,799 967,846,550 Charge for the year 2,953,648 78,518,922 4,367,834 374,747 891,332 252,500 87,358,983 3,142,518 2,095 - - 3,144,613 90,503,596 On disposals - - - - - (3,735,500) (3,735,500) - - - - - (3,735,500) Balance as at 30 June 2017 32,284,201 831,173,502 52,563,339 49,259,199 12,313,658 26,325,335 1,003,919,234 45,505,888 108,304 272,541 4,808,679 50,695,412 1,054,614,646
Balance as at 1 July 2017 32,284,201 831,173,502 52,563,339 49,259,199 12,313,658 26,325,335 1,003,919,234 45,505,888 108,304 272,541 4,808,679 50,695,412 1,054,614,646 Charge for the year 5,522,325 56,851,062 1,929,206 518,835 240,362 1,490,660 66,552,450 3,975,612 10,083 - - 3,985,695 70,538,145 On disposals - - - - - (6,515,337) (6,515,337) - - - (585,000) (585,000) (7,100,337)
Written off during the year (21,504,237) - - - - - (21,504,237) - - - - - (21,504,237) Balance as at 30 June 2018 16,302,289 888,024,564 54,492,545 49,778,034 12,554,020 21,300,658 1,042,452,110 49,481,500 118,387 272,541 4,223,679 54,096,107 1,096,548,217
Carrying value
At 30 June 2017 33,372,830 353,576,862 3,581,648 881,396 1,029,325 1,869,108 394,311,169 21,161,157 11,874 - - 21,173,031 415,484,200
At 30 June 2018 9,548,276 296,771,300 2,791,442 544,261 788,963 5,548,448 315,992,690 17,185,545 1,791 - - 17,187,336 333,180,026 -
Depreciation rate (% per annum) 20% 4.02% - 10% 10% 33% 10% 20% 6.67% - 10% 10% 33% 20%
6.1 Leasehold improvements and plant and machinery are located at the facilities as mentioned in 1.1 to these financial statements.
Owned assets Leased assets
Total
-------------------------------------------------------------Rupees------------------------------------------------------------- -------------------------------------------Rupees-------------------------------------------

2018 2017Note Rupees Rupees
6.2 The depreciation charge for the year has been allocated as follows:
Cost of production 22 60,826,674 81,661,440 Administrative and selling expenses 23 9,711,471 8,842,156
70,538,145 90,503,596
6.3 Cost of assets as at 30 June 2018 include fully depreciated assets amounting to Rs. 447.10 million (2017: Rs. 182.28 million).
6.4 Disposal of property, plant and equipment
Particulars of assets Cost Accumulated depreciation Net book value Sale proceeds Gain Mode of disposal
Relationship with the
CompanyParticulars of buyers
VehiclesHonda Civic 1,187,767 1,187,767 - 950,000 950,000 Negotiation Employee Yusuf RafiqSuzuki Bolan 415,934 415,934 - 560,000 560,000 Negotiation Outsider Umar TanoliSuzuki Cultus 585,000 585,000 - 360,000 360,000 Negotiation Outsider Umar TanoliSuzuki Liana 794,000 794,000 - 250,000 250,000 Negotiation Employee Muhammad Khurram ShahbazHonda City 795,746 795,746 - 500,000 500,000 Negotiation Employee Syed TausifHonda City 1,900,000 380,000 1,520,000 1,900,000 380,000 Negotiation Employee Ali Kazim WaheedSuzuki-Mehran 360,000 360,000 - 250,000 250,000 Negotiation Outsider Umer ZamanSuzuki Cultus 614,790 614,790 - 334,254 334,254 Negotiation Employee Yousaf AnsariSuzuki Cultus 603,500 603,500 - 320,385 320,385 Negotiation Employee Mahwish JafarHonda Civic 991,500 991,500 - 730,000 730,000 Negotiation Outsider Khadim HussainSuzuki Mehran 372,100 372,100 - 225,000 225,000 Negotiation Employee Syed Najaf
8,620,337 7,100,337 1,520,000 6,379,639 4,859,639
2017 4,910,500 3,735,500 1,175,000 4,503,500 3,328,500
-------------------------------------------------------------Rupees-------------------------------------------------------
2018

7 Intangible assets
Accumulated Accumulatedamortization Amortization Amortization Book value
Cost as at Cost as at as at charge as at as at01 July 2017 30 June 2018 01 July 2017 for the year 30 June 2018 30 June 2018
%
Computer software 422,000 - 422,000 20% - 50% 422,000 - 422,000 - Licenses 4,000,000 - 4,000,000 6.67% 2,423,446 266,808 2,690,254 1,309,746
4,422,000 - 4,422,000 2,845,446 266,808 3,112,254 1,309,746
Accumulated Accumulatedamortization Amortization Amortization Book value
Cost as at Cost as at as at charge as at as at01 July 2016 30 June 2017 01 July 2016 for the year 30 June 2017 30 June 2017
%
Computer software 422,000 - 422,000 20% - 50% 422,000 - 422,000 - Licenses 4,000,000 - 4,000,000 6.67% 2,156,638 266,808 2,423,446 1,576,554
4,422,000 - 4,422,000 2,578,638 266,808 2,845,446 1,576,554
7.1 The amortization charge for the year has been allocated to cost of production.
----------------------- R u p e e s ----------------------- --------------------------------- R u p e e s ----------------------------------
2017
2018
----------------------- R u p e e s ----------------------- --------------------------------- R u p e e s ----------------------------------
Additions/(deletions)
Additions/(deletions)
Rate
Rate

8 Deferred taxation
Deferred tax (liability) / asset comprises temporary differences relating to:
2018 2017Rupees Rupees
Accelerated tax depreciation allowances (11,810,406) (67,592,278) Unused tax losses and others 11,810,406 67,592,278
- -
2018 20179 Trade debts Note Rupees Rupees
Considered good
Unsecured:Related parties 9.1 637,124 783,424 Others 98,728,927 131,235,649
99,366,051 132,019,073
Considered doubtful 165,494,871 136,406,165 264,860,922 268,425,238
Provision for doubtful debts 9.2 (165,494,871) (136,406,165) 99,366,051 132,019,073
9.1 The balances due from related parties are as follows:
First Capital Securities Corporation Limited 341,100 168,600 First Capital Equities Limited 295,524 614,324 Pace Super Mall 500 500
637,124 783,424
9.2 Provision for doubtful debts
Balance at 01 July 136,406,165 135,987,397 Charged during the year 23 29,088,706 418,768 Balance at 30 June 165,494,871 136,406,165
10 Advances, prepayments and other receivable
Advances to suppliers - unsecured, considered good 10,000 1,354,250 Advances to staff - unsecured, considered good 10.1 2,765,137 2,880,942 Prepayments 564,902 571,055 Other receivables- unsecured, considered good 13,095,277 127,810
16,435,316 4,934,057
10.1 This includes advance amounting to Rs. 0.084 million (2017: Rs. 0.325 million) given to executiveemployees of the Company.
The Company has unused tax losses (including both business and depreciation losses) amounting to Rs. 1,339million against which deferred tax asset has not been recorded due to uncertain future taxable profits. Under theIncome Tax Ordinance 2001, the Company can carry forward business losses up to 6 years.

2018 2017Note Rupees Rupees
11 Cash and bank balances
Cash in hand 67,222 75,087
Cash at bank
Local currency- Current accounts 214,629 26,958
Markup based deposits with conventional banks- Deposit and saving accounts 11.1 388,758 2,550,834
603,387 2,577,792 Foreign currency - current account 40,017 33,784
710,626 2,686,663
11.1
12 Share capital
12.1 Authorized share capital
2018 2017 2018 2017Rupees Rupees
Ordinary shares of Rs. 10 each 210,000,000 180,000,000 2,100,000,000 1,800,000,000
12.2 Issued, subscribed and paid up capital
Ordinary shares of Rs. 10 eachfully paid in cash 135,871,350 135,871,350 1,358,713,500 1,358,713,500
Ordinary shares of Rs. 10 each issued other than cash, in accordance with the scheme of merger with TML 42,979,660 42,979,660 429,796,600 429,796,600
178,851,010 178,851,010 1,788,510,100 1,788,510,100
12.3
Percentage of holding
Number of shares
Percentage of holding
Number of shares
First Capital Securities CorporationLimited 25.31% 45,264,770 25.31% 45,264,770
First Capital Equities Limited 7.77% 13,893,000 7.77% 13,893,000
12.4
12.5
13 Share premium reserve
The share premium reserve can be utilized by the Company only for the purposes specified in section 81(3) of theCompanies Act, 2017.
Ordinary shares of the Company held by associated companies as at year end are as follows:
2018 2017
These carry return at the rate of 3.50% to 4.50% (2017: 2.49% to 3.75%) per annum.
(Number of shares)
The shareholders in an extra ordinary meeting held on 15 March 2017 approved the increase in authorized sharecapital of the Company. Accordingly, during the year, the authorized share capital of the Company has increased toRs. 2,100,000,000.
Directors hold 4,200 (2017: 4,200) ordinary shares comprising 0.002% of total paid up share capital of theCompany.

2018 201714 Long term finance Note Rupees Rupees
Long term finance - unsecured 14.1 248,587,697 194,187,697
14.1
15 Deferred liability
15.1 Gratuity
2018 2017The amount recognised in the balance Note Rupees Rupees
sheet is as follows:
Present value of defined benefit obligation 15.2 31,956,709 33,218,002
15.2 Movement in the present value of defined benefit obligation:
Balance at beginning of the year 33,218,002 28,712,974 Current service cost 15.3 4,797,713 4,745,671 Interest cost 15.3 2,587,478 2,552,794 Benefits due but not paid (10,490,540) (697,200) Actuarial loss / (gain) for the year 1,844,056 (2,096,237) Balance at end of the year 31,956,709 33,218,002
15.3
2018 2017Rupees Rupees
Current service cost 4,797,713 4,745,671 Interest cost 2,587,478 2,552,794 Net charge to profit and loss 7,385,191 7,298,465
15.4
Current service cost 4,413,727 4,797,713 Interest cost 3,003,397 2,951,136 Net charge to profit and loss 7,417,124 7,748,849
15.5 The principal actuarial assumptions at the 2018 2017reporting date were as follows:
Discount rate 9.25% 9.00%Discount rate used for year end obligation 10.00% 9.25%Expected per annum growth rate in salaries 8.00% 7.25%Expected mortality rate SLIC (2001-2005) SLIC (2001-2005)
Setback 1 year Setback 1 year
Estimated expense to be charged to profit and loss next year
This represents unsecured loan obtained from WTL Services (Private) Limited. This loan is repayable inJanuary 2022. This carries mark-up at the rate of three months KIBOR plus 3% per annum (30 June2017: three months KIBOR plus 3% per annum), payable on demand. During the year WTL Services(Private) Limited has provided Rs. 54 million to the Company to meet its cash flow needs.
The latest actuarial valuation of the Company's defined benefit plan was conducted on 30 June 2018using projected unit credit method. Details of obligation for defined benefit plan is as follows;
The amounts recognized in the profit and loss account against defined benefit schemes are asfollows:

15.6 Sensitivity analysis
Increase in assumptions
Decrease in assumptions
Assumptions Rupees Rupees
Discount rate (100 bps change) 28,928,202 35,537,607 Salary increase (100 bps change) 35,640,414 28,790,259
2018 2017Note Rupees Rupees
16 Trade and other payables
Creditors 16.1 125,596,973 123,525,812 Accrued liabilities 180,360,026 211,497,733 Security deposits 16.2 8,122,500 122,500 Advances from customers 16.3 9,403,852 13,982,672 Sales tax payable - net 17,244,755 14,368,415 Gratuity due but not paid 60,566,746 50,076,206 Withholding tax payable 73,571,813 60,140,278
474,866,665 473,713,616
16.1
16.2
16.3
2018 2017Note Rupees Rupees
17 Accrued mark-up
Mark-up based borrowings:Long term finance - unsecured 14.1 54,047,206 34,925,588 Running finance 17.1 64,416,834 19,215,663 Finance lease 17.2 849,544 849,544
Islamic mode of financing:Modarba finance 17.3 - 429,164
119,313,584 55,419,959
17.1
17.2
17.3
Creditors include Rs. 5.15 million (2017: Rs. 6.5 million) unsecured payable to World Press (Private)Limited a related party.
The Company has not kept these deposits in separate bank account which is a non-compliance ofsection 217 of the Companies Act, 2017.
As at 30 June 2018, the weighted average duration of the defined benefit obligation was 10 years (2017: 10years).
If the significant actuarial assumptions used to estimate the defined benefit obligation at the reportingdate, had fluctuated by 100 bps with all other variables held constant, the present value of the definedbenefit obligation as at 30 June 2018 would have been as follows:
Present value of defined benefit obligation due to
Advances from customers include unsecured advance, amounting to Rs. 0.870 million (2017: Rs.0.870 million) received from First Capital Investment Limited, a related party.
This represented overdue markup on modarba finance facility from First National Bank Modarbawhich has fully been repaid during the year.
This represents overdue markup on finance lease facility from Orix Leasing Pakistan Limited (refernote 19 for details).
This represens overdue markup and other charges on running finance facility from Faysal BankLimited (refer note 18.1 for details).

2018 201718 Short term borrowings Note Rupees Rupees
Secured
Mark-up based borrowings from conventional banks:Running finance 18.1 48,000,000 50,000,000
Islamic mode of financing:Modarba finance 18.2 - 295,520
48,000,000 50,295,520
18.1 The Company obtained running finance facility, of Rs. 50 million, from Faysal Bank Limited under mark-up arrangements for working capital requirement. The said facility was expired on 28 January 2012 andthe Company had not paid the principal and markup on due date. Accordingly Faysal Bank Limited filed asuit against the Company for recovery of Rs. 69.30 million at Lahore High Court which was fully recordedin annual audited financial statements for the year ended 30 June 2017. During the year 2015, the case wasdecided against the Company as the Lahore High Court through its order dated 20 November 2015directed that an amount of Rs. 54.16 million along with the cost of fund as contemplated by section 3 ofthe Financial Institutions (Recovery of Finances) Ordinance 2001 is to be paid by the Company throughsale of the hypothecated goods and assets of the Company, the attachment and auction of the other assetsof the Company and any other mode which the court deems appropriate. The Company being aggrievedfiled the regular first appeal dated 09 March 2016 in Honorable Lahore High Court.
However, during the year the Company re-negotiated with Faysal Bank Limited and the loan wasrescheduled into a long term loan. As per restructuring terms and conditions, the outstanding principal ofRs. 50 million and related markup of Rs. 8 million were repayable in 24 unequal quarterly installmentsstarted from 31 December 2017 and the remaining overdue markup of Rs. 11 million already recorded bythe Company was waived off by Faysal Bank Limited. The principal amount of outstanding loan of Rs. 50million carried mark up at three month KIBOR or cost of fund of Faysal Bank Limited, whichever islower, which was payable quarterly in arrears and the overdue markup of Rs. 8 million was interest free.
This rescheduled loan is secured by way of exclusive charge over all present and future, current assets ofRs. 80 million and future fixed assets of Rs. 50 million, respectively.
As per the settlement agreement with Faysal Bank Limited, the Company was required to pay installmentsof principal of Rs. 50 million and accrued markup of Rs. 8 million as per the repayment schedule andprovide fresh security in the form of registered exclusive mortgage over 9 shops located at Pace Pakistan,96-B/I, Gulberg II, Lahore. However subsequent to the restructuring, the Company could not payinstallments relating to principal and accrued markup on due dates and even within the grace period of 90days as allowed by Faysal Bank Limited and remained unable to provide fresh security as describedearlier. As per the settlement agreement, this non-compliance was considered as event of default and as aconsequence of default the Company is bound to make immediate payment of the entire outstandingamount with up to date markup along with additional amount of Rs. 53 million, against which theCompany has already recorded Rs. 11 million as liability towards accrued markup. Accordingly the entireamount of principal and accrued markup has been classified as current liability along with the additionalamount of Rs. 42 million recorded on event of default.
18.2
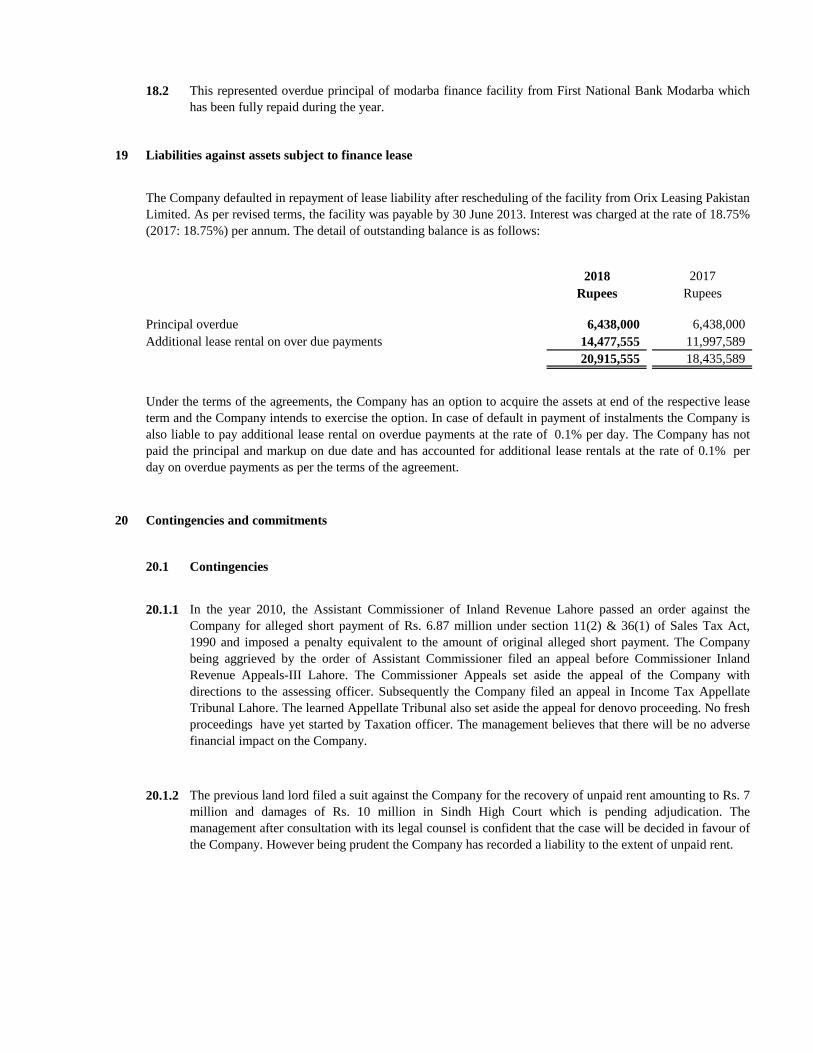
19 Liabilities against assets subject to finance lease
2018 2017Rupees Rupees
Principal overdue 6,438,000 6,438,000 Additional lease rental on over due payments 14,477,555 11,997,589
20,915,555 18,435,589
20 Contingencies and commitments
20.1 Contingencies
20.1.1
20.1.2
This represented overdue principal of modarba finance facility from First National Bank Modarba whichhas been fully repaid during the year.
In the year 2010, the Assistant Commissioner of Inland Revenue Lahore passed an order against theCompany for alleged short payment of Rs. 6.87 million under section 11(2) & 36(1) of Sales Tax Act,1990 and imposed a penalty equivalent to the amount of original alleged short payment. The Companybeing aggrieved by the order of Assistant Commissioner filed an appeal before Commissioner InlandRevenue Appeals-III Lahore. The Commissioner Appeals set aside the appeal of the Company withdirections to the assessing officer. Subsequently the Company filed an appeal in Income Tax AppellateTribunal Lahore. The learned Appellate Tribunal also set aside the appeal for denovo proceeding. No freshproceedings have yet started by Taxation officer. The management believes that there will be no adversefinancial impact on the Company.
The Company defaulted in repayment of lease liability after rescheduling of the facility from Orix Leasing Pakistan Limited. As per revised terms, the facility was payable by 30 June 2013. Interest was charged at the rate of 18.75%(2017: 18.75%) per annum. The detail of outstanding balance is as follows:
The previous land lord filed a suit against the Company for the recovery of unpaid rent amounting to Rs. 7million and damages of Rs. 10 million in Sindh High Court which is pending adjudication. Themanagement after consultation with its legal counsel is confident that the case will be decided in favour ofthe Company. However being prudent the Company has recorded a liability to the extent of unpaid rent.
Under the terms of the agreements, the Company has an option to acquire the assets at end of the respective leaseterm and the Company intends to exercise the option. In case of default in payment of instalments the Company isalso liable to pay additional lease rental on overdue payments at the rate of 0.1% per day. The Company has notpaid the principal and markup on due date and has accounted for additional lease rentals at the rate of 0.1% perday on overdue payments as per the terms of the agreement.

20.1.3
20.1.4
20.2 Commitments
There was no commitments as at 30 June 2018 (2017: Nil ).
2018 2017Note Rupees Rupees
21 Revenue - net
Advertisement 300,270,588 372,740,571 Newspaper 39,995,503 43,236,011 Outsourcing fee and other services 88,834,176 63,658,632
429,100,267 479,635,214 Less:
Sales tax 15,032,031 17,925,168 Commission and discounts 59,180,339 75,860,764
74,212,370 93,785,932 354,887,897 385,849,282
22 Cost of production
Salaries, wages and other benefits 22.1 114,094,194 108,912,929 Paper consumed 44,070,192 35,557,984 Stores and spare parts consumed 27,552,019 26,581,364 Printing charges 9,395,835 10,011,318 Programming and content cost 13,927,864 16,528,154 Transmission and up-linking cost 26,086,119 31,601,813 Insurance 305,838 465,094 News agencies' charges 503,333 1,961,000 Repairs and maintenance 1,132,917 1,258,371 Utilities 12,890,825 18,995,089 Freight and carriage 1,624,589 1,360,497 Depreciation 6.2 60,826,674 81,661,440 Amortization of intangibles 7.1 266,808 266,808 Others 2,973,710 2,794,064
315,650,917 337,955,925
22.1
Two petitions are pending in the Sindh High Court filed by Axact (Private) Limited against theCompany and Sheharyar Taseer wherein they have claimed recovery for damages of Rs. 14.5 millionand Criminal Revision Application U/s 439 section 561-A Criminal Procedure Code, 1898. Themanagement is confident that the case will be decided in favour of the Company, accordingly noprovision is recorded in these financial statements.
A petition is pending before Sindh High Court filed by JS Bank Limited against the Company whereinJS Bank Limited have claimed recovery of damages of Rs. 5 billion under the Defamation Ordinance,2002. The case is pending adjudication and the management is confident that the case will be decided infavour of the Company, accordingly no provision is recorded in these financial statements.
These include Rs. 3.37 million (2017: Rs. 4.06 million) in respect of gratuity expense for the year.

2018 201723 Administrative and selling expenses Note Rupees Rupees
Salaries, wages and other benefits 23.1 72,947,736 69,112,441 Rent, rates and taxes 14,113,456 11,917,496 Communications 5,581,890 6,774,600 Vehicle running and maintenance 8,141,392 8,103,108 Marketing, promotion and distribution 28,631,698 8,198,172 Legal and professional 2,822,939 910,967 Insurance 489,006 759,847 Utilities 5,253,381 3,621,470 Printing and stationary 2,385,179 1,472,767 Entertainment 6,865,727 7,627,075 Travel and conveyance 6,287,538 2,696,052 Repairs and maintenance 3,822,167 6,991,036 Provision for doubtful debts 9.2 29,088,706 418,768 Fee and subscriptions 1,018,348 2,471,119 Postage and courier 508,127 424,274 Newspapers and periodicals 466,190 413,234 Auditors' remuneration 23.2 1,525,000 1,465,000 Depreciation 6.2 9,711,471 8,842,156 Others 10,162,531 6,388,693
209,822,482 148,608,275
23.1
2018 201723.2 Auditors' remuneration Note Rupees Rupees
Statutory audit fee 990,000 950,000 Half yearly review fee 350,000 300,000 Other assurances and certifications - 75,000 Out of pocket expenses 185,000 140,000
1,525,000 1,465,000
24 Other income
Income from financial assets
- Markup from deposits with conventional banks Interest income on bank deposits 15,715 14,985
Income from non-financial assets
Gain on disposal of property, plant and equipment 6.4 4,859,639 3,328,500 Liabilities no longer payable written back 20,025,769 33,360,333 Scrap sales 6,741,352 7,000,815 Rental income from property on sub-lease - net 5,507,574 3,753,500 Miscellaneous income 6,886 78,339
37,156,935 47,536,472
Salaries, wages and other benefits include Rs. 4.01 million (2017: Rs. 3.23 million) in respect of gratuityexpense for the year.

2018 201725 Finance costs Note Rupees Rupees
Long term finances 14.1 19,121,605 17,275,540 Short term borrowing 18.1 45,201,172 - Additional lease rental on overdue lease liability 2,659,966 2,659,954 Bank charges and commission 640,647 606,777
67,623,390 20,542,271
26 Other expenses
Other written off 29,000 151,912 Fixed assets written off 18,302,229 - Exchange loss - 6,403
18,331,229 158,315
27 Taxation
Current tax 6,711,425 6,193,541 Prior year tax 3,176,968 -
9,888,393 6,193,541
27.1 Relationship between tax expense and accounting loss
Loss before taxation (219,383,186) (73,879,032)
Tax calculated at the rate of 30% / 31% (65,814,956) (22,902,500)
Tax effect of: - minimum tax 690,820 6,193,541 - effect of final tax regime 62,560,573 - - prior year tax 3,176,968 - - deferred tax asset not recognized 9,274,988 22,902,500
9,888,393 6,193,541
27.2
Tax Years Tax provision as per financial
statements
Tax as per assessment /
return
2015 - 3,256,190 2016 4,318,968 4,318,968 2017 6,193,541 6,114,319
As per management's assessment, the provision for tax made in the financial statements is sufficient. Acomparison of last three years' of income tax provisions with tax assessment is presented below:

2018 201728 Loss per share - basic and diluted
Loss after taxation Rupees (229,271,579) (80,072,573)
Weighted average number of ordinary shares Number 178,851,010 178,851,010
Loss per share - basic and diluted Rupees (1.28) (0.45)
28.1 There is no dilutive effect on the basic earnings per share of the Company.
2018 2017Note Rupees Rupees
29 Cash used in operations
Loss before taxation (219,383,186) (73,879,032)
Adjustments for:Depreciation 6.2 70,538,145 90,503,596 Amortization of intangibles 7 266,808 266,808 Provision for doubtful debts 9.2 29,088,706 418,768 Assets written off 26 18,331,229 151,912 Liabilities no longer payable written back 24 (20,025,769) (33,360,333) Gain on disposal of property, plant and equipment 24 (4,859,639) (3,328,500) Provision for retirement benefits 15.3 7,385,191 7,298,465 Finance cost 25 67,623,390 20,542,271
Operating (loss) / profit before working capital changes (51,035,125) 8,613,955
Changes in :Stores and spare parts 839,817 (205,991) Trade debts 3,564,316 (12,044,083) Advances, prepayments and other receivables (11,530,259) 23,669,300 Long term deposit 212,240 (315,000) Trade and other payables 10,688,278 16,745,309
3,774,392 27,849,535
Cash (used in) / generated from operations (47,260,733) 36,463,490

30 Transactions with related parties
Note Transactions during the year Closing balance Transactions
during the year Closing balance
First Capital Securities Corporation Limited 27.67% Common directorship Sale of services 52,000 - 97,500 - Receivable against advertisement - 341,100 - 168,600
Pace Pakistan Limited 0% Common directorship Sale of services 5,272,445 - 16,766,387 - Rent expense 12,861,528 - 11,692,296 - Markup paid by related party on behalf of company - - 39,047,185 -
Pace Barka Properties Limited 0% Common directorship Building rent 5,580,438 - 5,073,114 - Sale of services 4,184,299 - 3,506,114 -
First Capital Investments Limited 0% Common directorship Sale of services - - - Advance against advertisement - 870,180 - 870,180
World Press (Private) Limited 0% Common directorship Sale of services 1,646,730 - - - Payable against purchase of services - 5,159,614 - 6,556,344
First Capital Equities Limited 7.77% Common directorship Sale of services 31,200 - 126,100 - Receivable against advertisement - 295,524 - 614,324
Pace Super Mall 0% Common directorship Receivable against advertisement - 500 - 500
Shehryar Ali Taseer 0.0003% Key management personnel Repayment of borrowing - - 500,000 - (Chief Executive director) Remuneration 30.1 16,532,020 - 13,000,000 -
Remuneration payable 19,964,726 18,520,096
Shehrbano Taseer 0.0003% Key management personnel Remuneration 30.1 6,500,000 - 6,500,000 - (Executive director) Remuneration payable 18,634,951 14,156,960
Reema Taseer 0.0003% Non Executive Director Repayment of borrowing - - 512,000 -
Raja Sohail Qurban 0% Key Management Personnel Purchase of vehicle - - 1,900,000 1,900,000 Remuneration 30.1 4,669,715 - 2,901,500 -
Key Management Personnel 0% Key Management Personnel Remuneration 30.1 22,449,544 - 16,079,744 - Remuneration payable 2,172,100 - 7,833,375 -
30.1 Key management personnel are those persons having authority and responsibility for planning, directing and controlling the activities of the entity. The Company considers all members of their management team, including theChief Financial Officer, Chief Executive Officer, Directors and Head of Departments to be its key management personnel.
Related parties comprises of associated companies, directors, key management personnel and other companies where directors have significant influence. Balances and transactions with related parties other than those disclosedelsewhere in the financial statements are as follows:
------------------------------------------Rupees------------------------------------------
2018 2017
Name of parties Nature of relationship Nature of transactionsPercentage of holding

31 Remuneration of Chief Executive, Directors and Executives
2018 2017 2018 2017 2018 2017 2018 2017
Managerial remuneration 8,000,400 8,000,400 4,000,200 4,000,200 - - 18,170,305 14,792,143
Housing allowance 3,200,400 3,200,400 1,600,200 1,600,200 - - 6,114,252 3,864,216
Utilities 799,200 799,200 399,600 399,600 - - 1,526,844 964,967
Bonus 3,532,020 - - - - - 3,532,020 -
Provision for gratuity 1,000,000 1,000,000 500,000 500,000 - - 1,910,465 1,207,417
Reimbursable expenses - - - - - - 803,031 1,124,300
16,532,020 13,000,000 6,500,000 6,500,000 - - 32,056,917 21,953,043
Number of persons 1 1 1 1 - - 8 8
31.1 The Company has also provided executives with company maintained cars. No fees were paid to any director for attending board and audit committee meetings. Noremuneration is being paid to any non-executive directors.
The aggregate amounts charged in the financial statements for the year for remuneration, including all benefits to the chief executive officer, directors and executives of theCompany are as follows:
Chief Executive Officer Executive Director Executives
- - - - - - - - - - - - - - - - - - - - - - - - - - - - - - - - - - - - - - - - - - - - - R u p e e s - - - - - - - - - - - - - - - - - - - - - - - - - - - - - - - - - - - - - - - -
Non Executive Director
Directors

32 Segment reporting
32.1 Reportable segments
The following summary describes the operations of each reportable segment.
Reportable segments
Print media
Electronic media
The management reviews internal management reports of each division.
32.2 Information about reportable segments
Print media Electronic media Total
For the year ended 30 June 2018
Turnover - net 239,964,154 114,923,743 354,887,897 Cost of production (227,579,998) (88,070,919) (315,650,917) Gross loss 12,384,156 26,852,824 39,236,980
Administrative expenses (133,172,756) (76,649,726) (209,822,482) Other Expenses - (18,331,229) (18,331,229)
(120,788,600) (68,128,131) (188,916,731)
Finance cost (67,623,390) Other income 37,156,935 Loss before taxation (219,383,186) Taxation (9,888,393) Loss after taxation (229,271,579)
The Company has the following two strategic divisions, which are its reportable segments. These divisionsoffer different products and services and are managed separately because they require different technologyand marketing strategies.
Operation
It comprises of "Daily Times" and "AajKal" being the Daily Englishand Urdu newspapers respectively printed from Lahore, Karachi andIslamabad.
It comprises of "Business Plus" business news channel with cablepenetration over metro cities and "Zaiqa" 24 hours dedicated food andculture channel of Pakistan.
- - - - - - - - - - - - - - - - - Rupees - - - - - - - - - - - - - - - - - -
Information related to each reportable segment is set out below. Segment operating profit or loss asincluded in internal management reports reviewed by the Company's top management is used to measureperformance because management believes that such information is the most relevant in evaluating theresult of the respective segments relative to other entities that operate in the same industries.

Print media Electronic media Total
For the year ended 30 June 2017
Turnover - net 237,458,325 148,390,957 385,849,282 Cost of production (213,997,240) (123,958,685) (337,955,925) Gross loss 23,461,085 24,432,272 47,893,357
Administrative expenses (99,913,360) (48,694,915) (148,608,275) Other expenses (47,295) (111,020) (158,315)
(76,499,570) (24,373,663) (100,873,233)
Finance cost (20,542,271) Other income 47,536,472 Loss before taxation (73,879,032)
Taxation (6,193,541) Loss after taxation (80,072,573)
32.2.1
32.2.2 Revenue from major products and services
32.2.3 Revenue from major customers
32.3
32.4
- - - - - - - - - - - - - - - - - - Rupees - - - - - - - - - - - - - - - - - -
The accounting policies of the reportable segments are the same as the Company's accounting policiesdescribed in note 4 to these financial statements.
Revenue from major customers of Electronic media segment represents an aggregate amount of Rs. 61.23million out of total Electronic media segment revenue.
Revenue from major customers of Print media segment amounts to Rs. 84.61 million out of total printmedia segment revenue.
The analysis of the Company's revenue from external customers for major products and services is given innote 21 to these financial statements.
The revenue reported above represents revenue generated from external customers. All the segmentoperating activities, revenue, customers and segment assets are located in Pakistan.
All non-current assets of the Company at 30 June 2018 are located and operating in Pakistan.

32.5 Segment assets and liabilities
Print media Electronic
media Total
As at 30 June 2018
Segment assets for reportable segments 367,313,297 91,063,724 458,377,021 Unallocated corporate assets 6,666,068 Total assets as per balance sheet 465,043,089
Segment liabilities 289,406,102 124,893,817 414,299,919 Unallocated segment liabilities 529,340,291 Total liabilities as per balance sheet 943,640,210
As at 30 June 2017
Segment assets for reportable segments 403,941,684 161,186,176 565,127,860 Unallocated corporate assets 12,661,037 Total assets as per balance sheet 577,788,897
Segment liabilities 289,791,241 133,846,169 423,637,410 Unallocated corporate liabilities 401,632,973 Total liabilities as per balance sheet 825,270,383
32.6 For the purposes of monitoring segment performance and allocating resources between segments:
- all assets are allocated to reportable segments other than advance income tax; and
-
32.7 Other segment information
Print media Electronic
media Total
For the year ended 30 June 2018
Capital expenditure 7,466,500 589,700 8,056,200
Depreciation, amortization 34,732,711 36,072,242 70,804,953
Non-cash items other than depreciation, amortization and finance cost 6,686,037 15,848,490 22,534,527
For the year ended 30 June 2017
Capital expenditure 2,270,642 1,211,189 3,481,831
Depreciation and amortization 33,881,355 56,889,041 90,770,396
Non-cash items other than depreciation amortization and finance cost 12,147,811 (40,967,499) (28,819,688)
- - - - - - - - - - - - - - - - - Rupees - - - - - - - - - - - - - - - - - -
all liabilities are allocated to reportable segments other than deferred liability, gratuity due but notpaid, lease liability, borrowings and related mark-up payable thereon are not allocated to reportingsegments as these are managed by the Company.
- - - - - - - - - - - - - - - - - Rupees - - - - - - - - - - - - - - - - - -
Reportable segment's assets and liabilities are reconciled to total assets and liabilities as follows:

33 Financial instruments
The Company's activities expose it to a variety of financial risks:
- Credit risk- Liquidity risk- Market risk
33.1 Risk management framework
33.2 Credit risk
33.2.1 Exposure to credit risk
2018 2017Note Rupees Rupees
Long term deposits 6,539,043 6,751,283 Trade debts 9 99,366,051 132,019,073 Other receivables 10 13,095,277 127,810 Bank balances 11 643,404 2,611,576
119,643,775 141,509,742
The carrying amount of financial assets represents the maximum credit exposure. The maximum exposure tocredit risk at the balance sheet date was:
The Company's overall risk management policy focuses on the unpredictability of financial markets and seeks tominimize potential adverse effects on the Company's financial performance.
The Board of Directors has overall responsibility for establishment and over-sight of the Company's riskmanagement framework. The audit committee is responsible for developing and monitoring the Company’srisk management policies. The committee regularly meets and any changes and compliance issues are reportedto the Board of Directors.
Risk management systems are reviewed regularly by the audit committee to reflect changes in marketconditions and the Company’s activities. The Company, through its training and management standards andprocedures, aims to develop a disciplined and constructive control environment in which all employeesunderstand their roles and responsibilities.
The audit committee oversees compliance by management with the Company’s risk management policies andprocedures, and reviews the adequacy of the risk management framework in relation to the risks faced by theCompany.
Credit risk represents the financial loss that would be recognized at the reporting date if counter-parties failedcompletely to perform as contracted. The Company does not have significant exposure to any individualcounterparty. To manage credit risk the financial viability of all counterparties is regularly monitored andassessed. Outstanding customer receivables are regularly monitored.

33.2.2 Credit quality of financial assets
33.2.2 a) Long term deposits
33.2.2 b) Trade debts
2018 2017Rupees Rupees
Neither past due nor impaired ( 1-90 days ) 66,246,123 83,492,553
Past due (91 - 120 days) 11,191,741 21,412,948 Past due (120 - 360 days) 33,064,158 27,113,572 Past due more than 360 days 154,358,900 136,406,165
198,614,799 184,932,685
Provision for doubtful debts (165,494,871) (136,406,165) 99,366,051 132,019,073
Ageing of trade receivables from related parties is as follows:
0 - 90 days 91 - 120 days 121 -365 days More than 365 days Total
First Capital Securities Corporation Limited 108,000 - 64,500 168,600 341,100
First Capital Equities Limited - - 31,200 264,324 295,524 Pace Super Mall - - - 500 500
108,000 - 95,700 433,424 637,124
33.2.2 c) Other receivables
The credit quality of financial assets that are neither past due nor impaired can be assessed by reference to external credit ratings orto historical information about counterparty.
Long term deposits represent mainly deposit with Pak Sat International (Private) Limited. The management believes that noimpairment allowance is necessary in respect of these long term deposits.
------------------------------------------Rupees--------------------------------------------
2018
The trade debts as at the balance sheet date are classified in Pak Rupees. The aging of trade receivables at the balance sheetdate is:
The recommended approach for provision is to assess the trade receivables on an individual basis and apply dynamic approachto the remainder of receivables. The procedure introduces a company-standard for dynamic provisioning to provide impairmentloss for the outstanding receivable. The Company does not create provision against debtors which are secured against liquidassets as the management believes that no impairment loss is required in such cases.
This mainly represents building rent receivable from World Call Limited. Based on the past experience, management of theCompany is confident that these balances are recoverable.

33.2.2 d) Bank balances
2018 2017Cash at bank Rupees Rupees
Local currency - Current accounts 214,629 26,958
Markup based deposits with conventional banks - Deposit and saving accounts 388,758 2,550,834
603,387 2,577,792 Foreign currency - current account 40,017 33,784
643,404 2,611,576
Rating 2018 2017Short term Long term Rupees Rupees
Faysal Bank Limited A 1 + AA PACRA 56,205 37,763 Habib Metropolitan Bank Ltd. A 1 + AA+ PACRA 983 21,709 Bank Alfalah Limited A 1 + AA+ PACRA 132,834 1,556,012 Allied Bank Limited A AA AA+ PACRA 453,382 996,092
643,404 2,611,576
33.3 Liquidity risk
Carrying Contracted Up to one year More thanamount cash flow or less two years
Financial liabilities
Long term finance 14 248,587,697 333,853,277 24,361,594 24,361,594 285,130,089 Trade and other payables 16 374,646,245 374,646,245 374,646,245 - - Accrued mark-up 17 119,313,584 119,313,584 119,313,584 - - Short term borrowing 18 48,000,000 48,000,000 48,000,000 - - Liabilities against assets subject
to finance lease 19 20,915,555 20,915,555 20,915,555 - - 811,463,081 896,728,661 587,236,978 24,361,594 285,130,089
Carrying Contracted Up to one year More thanamount cash flow or less two years
Financial liabilities Note
Long term finance 14 194,187,697 274,057,097 17,748,756 17,748,756 238,559,585 Trade and other payables 16 385,222,251 385,222,251 385,222,251 - - Accrued mark-up 17 55,419,959 55,419,959 55,419,959 - - Short term borrowings 18 50,295,520 50,295,520 50,295,520 - - Liabilities against assets subject - - - -
to finance lease 19 18,435,589 18,435,589 18,435,589 - - 703,561,016 783,430,416 527,122,075 17,748,756 238,559,585
One to two years
The Company's exposure to credit risk against balances with various commercial banks is as follows:
Rating agency
The credit quality of Company's bank balances can be assessed with reference to external credit rating agencies as follows::
- - - - - - - - - - - - - - - - - - - - - - - - - Rupees - - - - - - - - - - - - - - - - - - - - - - - - -
The following are the contractual maturities of financial liabilities as on 30 June 2018:
- - - - - - - - - - - - - - - - - - - - - - - - - Rupees - - - - - - - - - - - - - - - - - - - - - - - - -
The following are the contractual maturities of financial liabilities as on 30 June 2017:
Banks
Due to the Company’s long standing business relationships with these counterparties and after giving due consideration to theirstrong financial standing, management does not expect non performance by these counter parties on their obligations to theCompany. Accordingly, the credit risk is minimal.
Liquidity risk is the risk that the Company will encounter difficulty in meeting the obligations associated with its financial liabilitiesthat are settled by delivering cash or another financial asset. The Company’s approach to managing liquidity is to ensure, as far aspossible, that it will always have sufficient liquidity to meet its liabilities when due, under both normal and stressed conditions,without incurring unacceptable losses or risking damage to the Company’s reputation. The Company's approach to managingliquidity is to ensure as far as possible to always have sufficient liquidity to meet its liabilities when due. The Company is materiallyexposed to liquidity risk, as due to insufficient liquidity, the Company was unable to repay the loans and lease obligations to itslenders. As explained in note 2, the Company's ability to continue as going concern is substantially dependent on its ability tosuccessfully manage the liquidity risk.
One to two years
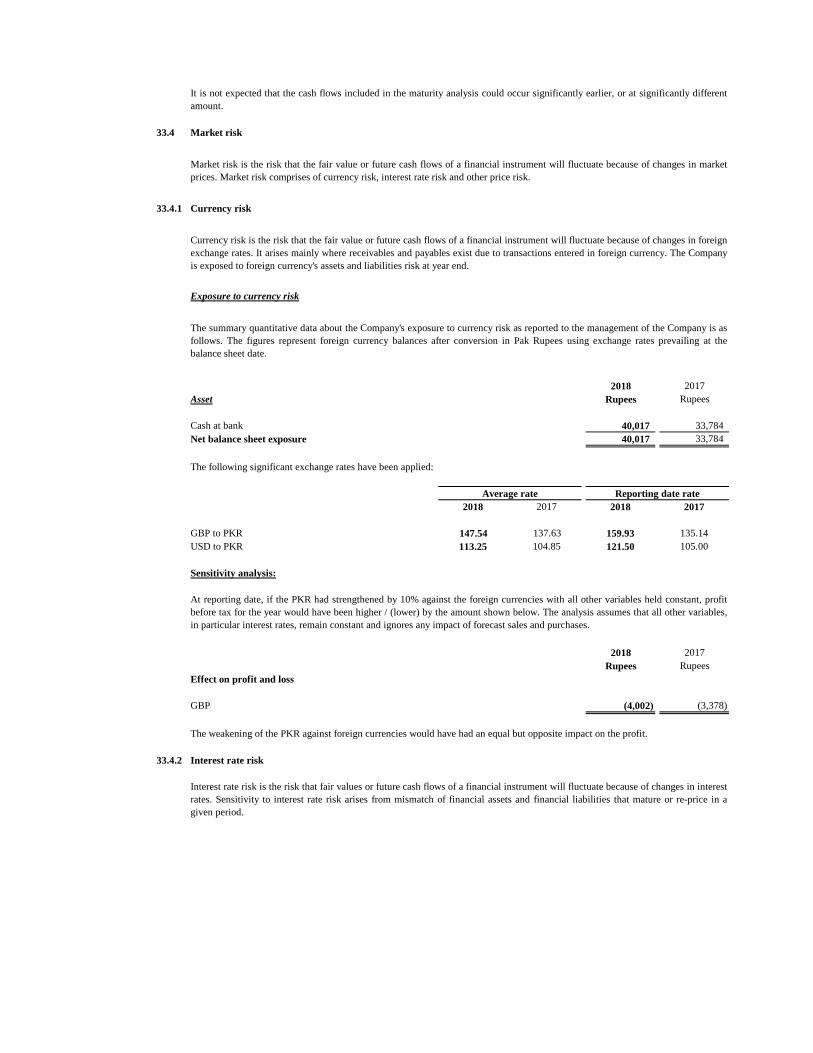
33.4 Market risk
33.4.1 Currency risk
Exposure to currency risk
2018 2017Asset Rupees Rupees
Cash at bank 40,017 33,784 40,017 33,784
The following significant exchange rates have been applied:
2018 2017 2018 2017
147.54 137.63 159.93 135.14113.25 104.85 121.50 105.00
2018 2017Rupees Rupees
Effect on profit and loss
GBP (4,002) (3,378)
33.4.2 Interest rate risk
Interest rate risk is the risk that fair values or future cash flows of a financial instrument will fluctuate because of changes in interestrates. Sensitivity to interest rate risk arises from mismatch of financial assets and financial liabilities that mature or re-price in agiven period.
Net balance sheet exposure
Sensitivity analysis:
The weakening of the PKR against foreign currencies would have had an equal but opposite impact on the profit.
It is not expected that the cash flows included in the maturity analysis could occur significantly earlier, or at significantly differentamount.
The summary quantitative data about the Company's exposure to currency risk as reported to the management of the Company is asfollows. The figures represent foreign currency balances after conversion in Pak Rupees using exchange rates prevailing at thebalance sheet date.
At reporting date, if the PKR had strengthened by 10% against the foreign currencies with all other variables held constant, profitbefore tax for the year would have been higher / (lower) by the amount shown below. The analysis assumes that all other variables,in particular interest rates, remain constant and ignores any impact of forecast sales and purchases.
GBP to PKR
Average rate
Market risk is the risk that the fair value or future cash flows of a financial instrument will fluctuate because of changes in marketprices. Market risk comprises of currency risk, interest rate risk and other price risk.
Currency risk is the risk that the fair value or future cash flows of a financial instrument will fluctuate because of changes in foreignexchange rates. It arises mainly where receivables and payables exist due to transactions entered in foreign currency. The Companyis exposed to foreign currency's assets and liabilities risk at year end.
USD to PKR
Reporting date rate

Financial assets
Financial liabilities
Financial assets
Financial liabilities
Variable rate instruments
Balance with bank - deposit account 388,758 - 2,550,834 - Long term finance - 248,587,697 - 194,187,697 Short term borrowing - 48,000,000
388,758 296,587,697 2,550,834 194,187,697
Sensitivity analysis for fixed rate instruments
Sensitivity analysis for variable rate instruments
100 bps 100 bpsIncrease Decrease
As at 30 June 2018Cash flow sensitivity - Variable rate financial liabilities (2,961,989) 2,961,989
As at 30 June 2017Cash flow sensitivity - Variable rate financial liabilities (1,916,369) 1,916,369
33.4.3 Other price risk
33.5 Fair values of financial instruments
-
-
- Unobservable inputs for the asset or liability (level 3).
Inputs other than quoted prices included within Level 1 that are observable for the asset or liability, either directly or indirectly(level 2).
The effective interest / mark-up rates for interest / mark-up bearing financial instruments are mentioned in relevant notes to thefinancial statements. The Company's interest / mark-up bearing financial instruments as at the reporting date are as follows:
2018
The Company does not account for any fixed rate financial assets and liabilities at fair value through profit and loss account.Therefore a change in interest rates at the reporting date would not affect profit and loss account.
A change of 100 basis points in interest rates at the reporting date would have increased / decreased loss before tax for the year bythe amounts shown below. This analysis assumes that all other variables, in particular foreign currency rates, remain constant.
- - - - - - Rupees - - - - - -- - - - - - Rupees - - - - - -
- - - - - - - - - Rupees - - - - - - - - -
Profit or loss before tax
2017
Price risk represents the risk that the fair value of a financial instrument will fluctuate because of changes in the market prices (otherthan those arising from interest / mark-up rate risk or currency risk), whether those changes are caused by factors specific to theindividual financial instrument or its issuer, or factors affecting all or similar financial instruments. The Company is not exposed to
The fair value of financial assets and liabilities traded in active markets i.e. listed equity shares are based on the quoted marketprices at the close of trading on the period end date. The quoted market prices used for financial assets held by the Company is
A financial instrument is regarded as quoted in an active market if quoted prices are readily and regularly available from anexchange, dealer, broker, industry group, pricing service or regulatory agency and those prices represent actual and regularlyoccurring market transactions on an arm's length basis.
IFRS 13, 'Fair Value Measurements' requires the Company to classify fair value measurements using a fair value hierarchy thatreflects the significance of the inputs used in making the measurements. The fair value hierarchy has the following levels:
Quoted prices (unadjusted) in active markets for identical assets or liabilities that the entity can access at the measurement date(level 1).
Fair value is the price that would be received to sell an asset or paid to transfer a liability in an orderly transaction between marketparticipants at the measurement date.
Underlying the definition of fair value is the presumption that the Company is a going concern without any intention or requirementto curtail materially the scale of its operations or to undertake a transaction on adverse terms.

33.5.1 Fair value measurement of financial instruments
Loans and receivables at amortized cost
Financial liabilities at
amortized costTotal Level 1 Level 2 Level 3
On-Balance sheet financial instruments Note
30 June 2018
Financial assets not measured at fair value
Long term deposits 6,539,043 - 6,539,043 - - - Trade debts 33.5.2 99,366,051 - 99,366,051 - - - Other receivables 33.5.2 13,095,277 - 13,095,277 - - - Cash and bank balances 33.5.2 710,626 - 710,626 - - -
119,710,997 - 119,710,997 - - -
Financial liabilities not measured at fair value
Long term finances 33.5.2 - 248,587,697 248,587,697 - - - Liabilities against assets subject
to finance lease 33.5.2 20,915,555 20,915,555 - - - Trade and other payables 33.5.2 - 374,646,245 374,646,245 - - - Accrued mark-up 33.5.2 - 119,313,584 119,313,584 - - - Short term borrowing 33.5.2 - 48,000,000 48,000,000
- 811,463,081 811,463,081 - - -
The following table shows the carrying amounts and fair values of financial instruments and non-financial instruments including their levels in the fair value hierarchy:
2018Carrying amount Fair value
- - - - - - - - - - - - - - - - - - - - - - - - - - - - - - - - Rupees - - - - - - - - - - - - - - - -- - - - - - - - - - - - - - - -

Loans and receivables at amortized cost
Financial liabilities at
amortized costTotal Level 1 Level 2 Level 3
On-Balance sheet financial instruments Note
30 June 2017
Financial assets not measured at fair value
Long term deposits 6,751,283 - 6,751,283 - - - Trade debts 33.5.2 132,019,073 - 132,019,073 - - - Other receivables 33.5.2 127,810 127,810 Cash and bank balances 33.5.2 2,686,663 - 2,686,663 - - -
141,584,829 - 141,584,829 - - -
Financial liabilities not measured at fair value
Long term finances 33.5.2 - 194,187,697 194,187,697 - - - Liabilities against assets
subject to finance lease 33.5.2 18,435,589 18,435,589 - - - Trade and other payables 33.5.2 - 385,222,251 385,222,251 - - - Short term borrowing 33.5.2 - 50,295,520 50,295,520 - - - Accrued mark-up 33.5.2 - 55,419,959 55,419,959 - - -
- 703,561,016 703,561,016 - - -
33.5.2 Fair value versus carrying amounts
The Company has not disclosed the fair values of these financial assets and liabilities as these are for short term or repriced over short term. Therefore, their carrying amounts arereasonable approximation of fair value.
Carrying amount Fair value
- - - - - - - - - - - - - - - - - - - - - - - - - - - - - - - - Rupees - - - - - - - - - - - - - - - -- - - - - - - - - - - - - - - -
2017

34
EaLong term finances Short term
borrowings
Liabilities against assets subject to
finance lease
Balance as at 01 July 2017 194,187,697 50,295,520 18,435,589 262,918,806
Changes from financing activities
Receipts of long term finances - net of repayments 54,400,000 - - 54,400,000 Repayment of short term borrowings - (2,295,520) - (2,295,520) Repayment of finance lease liabilities - - (180,000) (180,000) Total changes from financing cash flows 54,400,000 (2,295,520) (180,000) 51,924,480
Other changesAdditional lease rental on overdue lease liability - - 2,659,966 2,659,966 Total liability related other changes - - 2,659,966 2,659,966
Closing as at 30 June 2018 248,587,697 48,000,000 20,915,555 317,503,252
Reconciliation of movements of liabilities to cash flows arising from financing activities.
30 June 2018 Liabilities
Total
- - - - - - - - - - - - - - - - - - - - - - - - - - -- - - Rupees - - - - - - - - - - - - - - - - - - - - - - - - - - - -

35 Capital risk management
The Company's objectives when managing capital are:
(i)
(ii)
36 Number of employees
2018 2017
Average number of employees during the year 381 428 Number of employees as at June 30 263 436
37 Date of authorization for issue
______________ __________ _____________________Chief Executive Director Chief Financial Officer
The Board’s policy is to maintain an efficient capital base so as to maintain investor, creditor and marketconfidence and to sustain the future development of its business. The Board of Directors monitors the returnon capital employed, which the Company defines as operating income divided by total capital employed. TheBoard of Directors also monitors the level of dividends to ordinary shareholders.
to safeguard the entity's ability to continue as a going concern, so that it can continue to providereturns for shareholders and benefits for other stakeholders, and
The Company manages the capital structure in the context of economic conditions and the risk characteristicsof the underlying assets. In order to maintain or adjust the capital structure, the Company may adjust theamount of dividends paid to shareholders, issue new shares, or sell assets to reduce debt.
Neither there were any changes in the Company’s approach to capital management during the year nor the Company is subject to externally imposed capital requirements.
The total average number of employees during the year and as at June 30, 2018 and 2017 respectively are asfollows:
No. of employees
to provide an adequate return to shareholders.
These financial statements were authorized for issue on _______________________ by the Board ofDirectors of the Company in their meeting held on _____________________.