medical image analysis - centralesupelecvision.mas.ecp.fr/papers/langs-media-10.pdf · deformation...
TRANSCRIPT

Medical Image Analysis 15 (2011) 12–21
Contents lists available at ScienceDirect
Medical Image Analysis
journal homepage: www.elsevier .com/locate /media
Learning deformation and structure simultaneously: In situ endograftdeformation analysis
Georg Langs c,d,*, Nikos Paragios a,b, Pascal Desgranges e, Alain Rahmouni e, Hicham Kobeiter e,f
a Laboratoire de Mathématiques Appliquées aux Systèmes, Ecole Centrale de Paris, Franceb Equipe GALEN, INRIA Saclay, Île-de-France, Francec Computer Science and Artificial Intelligence Lab, Massachusetts Institute of Technology, Cambridge, MA, USAd Computational Image Analysis and Radiology Lab, Department of Radiology, Medical University of Vienna, Vienna, Austriae University of Paris XII, Henri Mondor Hospital, Paris, Francef UMR 7054 CNRS Thérapeutiques Substitutives du Coeur & des Vaisseaux, Centre de Recherches Chirurgicales, Henri Mondor – Faculté de Médecine Paris XII; 8,Rue du Général Sarrail, 94010 Créteil Cedex, France
a r t i c l e i n f o
Article history:Received 16 November 2009Received in revised form 19 March 2010Accepted 7 June 2010Available online 1 July 2010
Keywords:Model learningMinimum description lengthGroup-wise registrationEndograft
1361-8415/$ - see front matter � 2010 Elsevier B.V. Adoi:10.1016/j.media.2010.06.005
* Corresponding author at: Computer Science anMassachusetts Institute of Technology, Cambridge, MAfax: +1 617 25 86 287.
E-mail addresses: [email protected] (G. LangsParagios), [email protected] (P. Dehmn.ap-hop-paris.fr (A. Rahmouni), hicham.kobeiter@
a b s t r a c t
The learning of the shape and appearance behavior of complex anatomical structures is of growingimportance in the successful use of medical imaging data. We propose a method to simultaneously learna model of shape variation and the behavioral structure of objects in volumetric data sets. The algorithmperforms a group-wise registration of a set of examples, and accounts for the heterogeneous deformationor variability properties of the data. We use the method for the in situ analysis of endograft deformationin the thoracic aorta during the cardiac cycle. The method is based on an emerging model of the shapevariation, which is learned autonomously from a gated computed tomography sequence. It automaticallyadapts to the highly non-uniform elasticity properties of the structure during learning. The resultingdeformation model is used for the measurement of global and local characteristics of the endograft move-ment. The method allows for the in situ localization of the stent during the cardiac cycle, and the mea-surement of its deformation. Furthermore, it makes the comparison of different endograft designspossible, and can serve as a basis for fitting a physical model of the endograft- and vessel surface to indi-vidual patients. The latter is essential for long-term risk assessment of the impact of endografts in highlymobile areas. We evaluate the approach on 10 data sets from patients that underwent endograft place-ment after traumatic ruptures of the thoracic aorta.
� 2010 Elsevier B.V. All rights reserved.
1. Introduction Thus the autonomous learning of models from a data population
Model based approaches are widely used in medical imageanalysis. They capture variations of shape, texture or temporalbehavior of a specific structure or object – its systematic variability,in which we can find regularity. They are used as a priori knowledgefor segmentation while allowing for repeatable identification ofspecific landmarks in the data (Beichel et al., 2002; Mitchell et al.,2002; Roberts et al., 2005; Stegmann et al., 2005). In most casesmodels are built by manually annotating large numbers of trainingexamples. This is tedious, and may result in sub-optimal modelsdue to noise in the manual annotation. Furthermore it is prone toinclude a bias due to a priori choices in reference manifolds andbecomes unfeasible for complex and large data sets.
ll rights reserved.
d Artificial Intelligence Lab,, USA. Tel.: +1 617 866 7199;
), [email protected] (N.sgranges), [email protected] (H. Kobeiter).
is a crucial task for the employment of such methods in complexdata. An interesting aspect of learning a model is that for increasinglycomplex medical imaging data the learning itself becomes a tool ofexploration, since it has to capture essential and characteristic fea-tures and properties of observations and sets thereof.
In this paper we propose a method for the simultaneous learn-ing of structure and shape variation behavior from a set of trainingexamples. For the examples no prior annotation is available. Wewill investigate the capability of a model learning approach to cap-ture the deformation characteristics of a heterogeneous movingstructure such as an endograft during the cardiac cycle, whilesimultaneously learning the topological structure of the observedtraining examples.
1.1. Medical background
Blunt thoracic aortic ruptures can occur at the level of the aorticisthmus, and are due to a deceleration or thoracic crushing mech-anisms, which can occur during accidents. Although they result in a

G. Langs et al. / Medical Image Analysis 15 (2011) 12–21 13
high pre-hospital death rate of patients (Wellons et al., 2004), pro-gress in both surgical and intensive care has been made. Still, theoutcome of conventional surgical management of the acute rup-ture of the descending thoracic aorta is not satisfactory (Amabileet al., 2006). Because of the significantly higher morbidity and mor-tality associated with open surgery as opposed to endovascular re-pair (Garzon et al., 2005), recently the endovascular stent-graftrepair has been investigated as an alternative treatment. A shiftin the primary management of traumatic thoracic aortic ruptureis taking place as reported in Lebl et al. (2006): in this retrospectivestudy prior to 2002, 75% of 12 patients included in the study weretreated by surgical repair, 17% by medical management, and 8% byendovascular stent-grafts. Since 2002, 8% of 13 patients were trea-ted by surgical repair, 46% by medical management, and 46% byendovascular stent-grafts.
In Fig. 1 an illustration of one frame of a gated CT sequence con-taining an endograft is depicted. The visible stent wires (metalparts) seemingly enclose the aorta. Inbetween the wires is a cov-ered surgical tissue, not visible in the CT, that reinforces the rup-tured vessel wall (see Fig. 2).
Postoperative surveillance is crucial after endograft placement,because endografts were initially not specifically constructed forthe indication of blunt thoracic aortic ruptures. A study (Marcheixet al., 2006) concerning the mid-term results (average of 32 monthfollow up) of endovascular repair demonstrated that the endovas-cular treatment of blunt traumatisms of the descending thoracicaorta is a safe and effective therapeutic method. In spite of verygood results in the short- and mid-term, in particular the long-term durability of this method of repair is unknown, but highly rel-evant, since the patients are young on average (Wellons et al.,2004).
The deformation of the arc of the thoracic aorta, and its changedue to the endograft placement, and the deformation of the endo-graft itself is largely unknown. However their understanding ishighly relevant, in order to assess the risks for individual patients,to understand the effect of different placement methods, and ofvarying endograft designs. This is even more pressing since nolong-term studies regarding the outcome are available due to therecency of the method, and large randomized studies are difficultdue to the low number of patients. For this reason the functionalin situ analysis of the movement and deformation of the endograftin the thoracic aorta is crucial to understand stress caused to thestructure, risks of rupture, and migration, and potential ways of de-sign improvement. The in situ measurement of the deformation ofthe endograft during the cardiac cycle is an open problem. This is
Endograft
Aorta
Wires
Heart
Fig. 1. An endograft in the thoracic aorta.
due to the complex dynamic three-dimensional structure andmovement behavior of endografts in the thoracic aorta.
1.2. State of the art and contribution
The learning of models can also be viewed as establishing cor-respondences for a set of landmarks across training examples. Inthis context a body of work is focussed on tackling the problemof autonomous model building from different directions. In all ap-proaches is viewed as the task finding correspondences across atraining set in an un- or weakly supervised manner. In Walkeret al. (2002) the temporal continuity of image sequences is usedto determine correspondences. In a line of work correspondencesare established by one-to-many (Rueckert et al., 2003) or bygroup-wise registration of entire images or volumes (Cooteset al., 2005; Twining et al., 2005). Given a set of manual continuouscontour or surface annotations in Davies et al. (2002), Davies et al.(2002), Thodberg and Olafsdottir (2003) landmarks are placedautomatically along contours or surfaces that are mapped to a cir-cle or a sphere using MDL. The reference manifold limits the ap-proach to a topological class, that has to be chosen prior tomodel building (i.e., a circle or a sphere).
In Langs et al. (2007) a method for the unsupervised learning ofmodels from sets of interest points was proposed. This work isclosest related to the approach presented in this paper, since itdoes not use an a priori manifold, while relying on a single multi-variate Gaussian model of shape variation. Initial results of a meth-od related to the one described in this paper were presented inLangs et al. (2007).
We propose a method to perform the in situ tracking of endo-graft wires, and the sub-sequent analysis of their deformationbased on an autonomously learned statistical shape model. A min-imum description length (MDL) based optimization criterion derivesa shape variation model, that describes the data. It also establishescorrespondences on the endograft structure that define trajectoriesof points during the cardiac cycle 2. The statistical deformationmodel exploits the systematic deformation – the wires structurethe shape variation considerably – without making any a prioriconstraint necessary, which would make the method susceptilbleto bias. During the building process the model adapts automati-cally to the potentially heterogeneous structure of the data, andthereby accounts for the elasticity differences between soft vesseltissue, and stent wires. The adaption is based on a representationof the mutual modeling properties of the model landmarks, that re-flects coherence of the joint behavior with regard to the modelfamily (in our case: multiple multivariate Gaussians). During thelearning process, that MDL criterion is adapted according to thisemerging structure.
Thus the contribution of the paper is twofold:
� We propose a method for the in situ capturing and analysis ofthe three-dimensional endograft motion during the cardiaccycle based on gated CT sequences. The motion of the endograftis extracted from the sequence of volumes and the global andlocal deformation during the cycle is captured by means of astatistical deformation model that is built during theregistration.� The core of the registration process is an emerging statistical
shape variation model that is learned autonomously from un-annotated gated CT sequences. We investigate the capabilityof this approach to accurately register the three-dimensionalstructure, and to capture its motion behavior.
The algorithm establishes correspondences across the sequenceby autonomously building a statistical shape model of a sparse fi-nite set of points. During the learning process the model adapts to
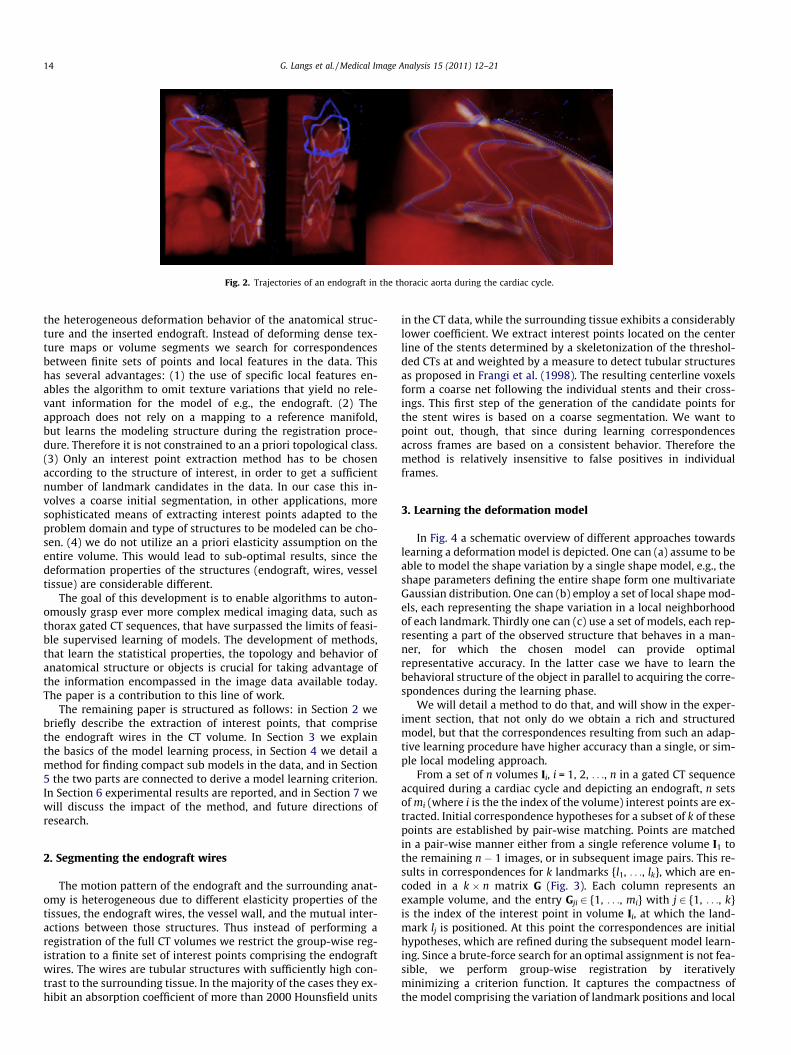
Fig. 2. Trajectories of an endograft in the thoracic aorta during the cardiac cycle.
14 G. Langs et al. / Medical Image Analysis 15 (2011) 12–21
the heterogeneous deformation behavior of the anatomical struc-ture and the inserted endograft. Instead of deforming dense tex-ture maps or volume segments we search for correspondencesbetween finite sets of points and local features in the data. Thishas several advantages: (1) the use of specific local features en-ables the algorithm to omit texture variations that yield no rele-vant information for the model of e.g., the endograft. (2) Theapproach does not rely on a mapping to a reference manifold,but learns the modeling structure during the registration proce-dure. Therefore it is not constrained to an a priori topological class.(3) Only an interest point extraction method has to be chosenaccording to the structure of interest, in order to get a sufficientnumber of landmark candidates in the data. In our case this in-volves a coarse initial segmentation, in other applications, moresophisticated means of extracting interest points adapted to theproblem domain and type of structures to be modeled can be cho-sen. (4) we do not utilize an a priori elasticity assumption on theentire volume. This would lead to sub-optimal results, since thedeformation properties of the structures (endograft, wires, vesseltissue) are considerable different.
The goal of this development is to enable algorithms to auton-omously grasp ever more complex medical imaging data, such asthorax gated CT sequences, that have surpassed the limits of feasi-ble supervised learning of models. The development of methods,that learn the statistical properties, the topology and behavior ofanatomical structure or objects is crucial for taking advantage ofthe information encompassed in the image data available today.The paper is a contribution to this line of work.
The remaining paper is structured as follows: in Section 2 webriefly describe the extraction of interest points, that comprisethe endograft wires in the CT volume. In Section 3 we explainthe basics of the model learning process, in Section 4 we detail amethod for finding compact sub models in the data, and in Section5 the two parts are connected to derive a model learning criterion.In Section 6 experimental results are reported, and in Section 7 wewill discuss the impact of the method, and future directions ofresearch.
2. Segmenting the endograft wires
The motion pattern of the endograft and the surrounding anat-omy is heterogeneous due to different elasticity properties of thetissues, the endograft wires, the vessel wall, and the mutual inter-actions between those structures. Thus instead of performing aregistration of the full CT volumes we restrict the group-wise reg-istration to a finite set of interest points comprising the endograftwires. The wires are tubular structures with sufficiently high con-trast to the surrounding tissue. In the majority of the cases they ex-hibit an absorption coefficient of more than 2000 Hounsfield units
in the CT data, while the surrounding tissue exhibits a considerablylower coefficient. We extract interest points located on the centerline of the stents determined by a skeletonization of the threshol-ded CTs at and weighted by a measure to detect tubular structuresas proposed in Frangi et al. (1998). The resulting centerline voxelsform a coarse net following the individual stents and their cross-ings. This first step of the generation of the candidate points forthe stent wires is based on a coarse segmentation. We want topoint out, though, that since during learning correspondencesacross frames are based on a consistent behavior. Therefore themethod is relatively insensitive to false positives in individualframes.
3. Learning the deformation model
In Fig. 4 a schematic overview of different approaches towardslearning a deformation model is depicted. One can (a) assume to beable to model the shape variation by a single shape model, e.g., theshape parameters defining the entire shape form one multivariateGaussian distribution. One can (b) employ a set of local shape mod-els, each representing the shape variation in a local neighborhoodof each landmark. Thirdly one can (c) use a set of models, each rep-resenting a part of the observed structure that behaves in a man-ner, for which the chosen model can provide optimalrepresentative accuracy. In the latter case we have to learn thebehavioral structure of the object in parallel to acquiring the corre-spondences during the learning phase.
We will detail a method to do that, and will show in the exper-iment section, that not only do we obtain a rich and structuredmodel, but that the correspondences resulting from such an adap-tive learning procedure have higher accuracy than a single, or sim-ple local modeling approach.
From a set of n volumes Ii, i = 1, 2, . . ., n in a gated CT sequenceacquired during a cardiac cycle and depicting an endograft, n setsof mi (where i is the the index of the volume) interest points are ex-tracted. Initial correspondence hypotheses for a subset of k of thesepoints are established by pair-wise matching. Points are matchedin a pair-wise manner either from a single reference volume I1 tothe remaining n � 1 images, or in subsequent image pairs. This re-sults in correspondences for k landmarks {l1, . . ., lk}, which are en-coded in a k � n matrix G (Fig. 3). Each column represents anexample volume, and the entry Gji 2 {1, . . ., mi} with j 2 {1, . . ., k}is the index of the interest point in volume Ii, at which the land-mark lj is positioned. At this point the correspondences are initialhypotheses, which are refined during the subsequent model learn-ing. Since a brute-force search for an optimal assignment is not fea-sible, we perform group-wise registration by iterativelyminimizing a criterion function. It captures the compactness ofthe model comprising the variation of landmark positions and local

Frame 1 Frame 2 Frame 3 Frame 4
Landmark i
Fig. 3. Representing correspondences for the point sets: the matrix G holds thecorrespondence information by assigning each landmark an interest point index ineach volume.
G. Langs et al. / Medical Image Analysis 15 (2011) 12–21 15
feauture variation at the landmark positions in the n volumes. Theinterest points in the images or volumes are treated as landmarkcandidates. Each point (i,q) with q 2 {1, . . ., mi} is assigned its coor-dinate information p(i,q) and local features f(i,q) (e.g., absorptioncoefficient, local curvature). The matrix Gj,i defines the location ofthe landmark in the individual frames during the learning processby identifying the interest point index. Gji = q indicates that thelandmark lj has position pij = p(i,q) and feature vector fij = f(i,q) inimage Ii. During model building the matrix G is modified iterativelyto minimize the criterion function, resulting in optimal positionsfor each landmark in each image. Each update of G is an updateof the landmark correspondences in the CT sequence frames.
3.1. Criterion based on minimum description length
The objective function that is minimized comprises the varia-tion of the shape, and a temporal continuity term that accountsfor the sequence of the cardiac cycle. During the iterative optimiza-tion the algorithm estimates the structure of the deformation mod-el, by considering the set of all landmarks as a Markov chain(Section 4). Thereby sets of landmarks that behave in a coherentway are treated accordingly, thus accounting for the multi-partstructure of the deforming endograft and the surrounding aorta.By minimizing the criterion correspondences in the set of volumesare determined. This results in a compact shape deformation mod-el, that explains the structured and potentially heterogeneous var-iation across the examples.
3.2. The shape model
The basic shape model used to evaluate the deformation com-plexity is a standard linear multivariate Gaussian model (Cooteset al., 2001). Each of n shapes is represented by the set of k land-marks in the corresponding volume – i.e., the positions of the land-marks indicated by the column of Gji with j = 1, . . ., k. Each of the nshapes in the training set can then be represented by a 3k dimen-sional vector xi generated by concatenation of the 3-dimensionalcoordinates of the points.
Before modeling the non-rigid deformation of a particular land-mark correspondence hypothesis during the model learning shapesare aligned to exclude global effects of translation, rotation, andscale from the modeling. Given n sets of landmarks, x1, . . ., xn, first,each example xi is translated so that the centroid is 0, and scaled,so that kxik = 1. Rotational differences of the sets x2, . . ., xn arealigned to x1 (the choice of x1 is arbitrary, and does not influencethe shape model) using a singular value decomposition of the ma-trix x>i x1 (Bookstein, 1991), i.e.: UDV> ¼ x>i x1. VU> is the rotationmatrix, that by x0i ¼ VU>xi minimizes the Procrustes distance of x0i
to x1. By modeling the aligned shapes x01; . . . ;x0n (where x01 ¼ x1)only non-rigid shape variation remains, and global translation,scale and rotation do not affect the model complexity. The non-ri-gid deformation of the aligned set of shapes is modeled by a mul-tivariate Gaussian with model mean �x, and covariance matrix Rwith modes ej, and eigenvalues kj.
3.3. Compactness of a shape model
The shape model compactness criterion is based on the descrip-tion length. We assume that an optimal shape model should min-imize the cost L of communicating the modelM itself and the dataD (i.e. the landmark positions) encoded with the model:LðD;MÞ ¼ LðMÞ þ LðDjMÞ. For the multivariate Gaussian modelmodeling and encoding costs can be calculated per dimension inthe eigenspace. For each dimension j of the eigenspace used to en-code the data we can apply Shannons theorem (Shannon, 1948) tothe corresponding one-dimensional distribution. The correspond-ing coefficients ai
j are quantized by the step size DIm which is re-lated to the voxel-size, and are strictly bounded by Rj. For eachtraining sample xi the new discrete coordinates ai
j ¼ kDIm; k 2 Z
with �Rj=2 6 aj 6 Rj=2 are modeled by a Gaussian distributionwith coefficient mean value lj = 0 and standard deviationrj ¼
ffiffiffiffikj
p. For each dimension j of the eigenspace used to encode
the data the transmission costs of the model LðMejÞ are the quan-
tized eigenvector, rj and the quantization parameter dj for thedirection ej. LðDjMej
Þ is the cost of transmitting the data i.e. thequantized coefficients ai
j of the training set with respect to thedirection ej. The description length for the data encoded with annp dimensional eigenspace is the sum of the transmission costsfor the data encoded using the eigenvectors ðejÞj¼1;...;np
togetherwith the cost of the residual error
Xnp
j¼1
ðLðMejÞ þ LðDjMej
ÞÞ þ R; ð1Þ
where
LðMejÞ þ LðDjMej
Þ ¼ ð2Þ
1þ log2rmax � rmin
dj
� �þ jlog2djj� ð3Þ
� nlog2DIm þn2
log2 2pr2j
� �þ n
2þ
nd2j
12r2j
; ð4Þ
with rmax = R/2 and rmin = 2DIm.R is the residual error that remainsafter fitting the training set with the model. An extensive derivationof the description length calculation for Gaussian models is given inDavies et al. (2002). The final shape model criterion is
CSðMS;DSÞ ¼ LðMSÞ þ LðDSjMSÞ þ RS ð5Þ
where LðMSÞ is the cost of communicating the shape model,LðDSjMSÞ is the cost of the shape data encoded with help if the mod-el, and RS is a penalty for the residual error not captured by themodel.
4. Finding structure in the data
The description length criterion is used to answer two comple-mentary questions: (i) how to model the landmark movement, and(ii) how to locate the landmarks on the stent wires, given themodel.
To answer the first question we employ a learning schemebased on shape maps, an approach first introduced in Langs andParagios (2008): based on the mutual coherence of landmarkbehavior and a subsequent embedding we find clusters of land-marks, each being modeled by a single joint model, as opposed

16 G. Langs et al. / Medical Image Analysis 15 (2011) 12–21
to modeling the entire set of landmarks by one model (see Fig. 4c).In the following we first describe how to derive a meaningful pair-wise measure between landmarks. It informs the algorithm aboutthe modeling properties of pairs of landmarks. After this, anembedding based on the diffusion distance in the resulting graphestablishes the global structure of the model. It captures the jointmodeling properties of sub-sets of landmarks and translates themto proximity in the resulting map. The embedding is then used forclustering and the determination of the optimal sub shape models.
4.1. Encoding the structure of the deformation in a Markov chain
To estimate the appropriate modeling structure of the endograftwe project the landmarks into a map (Coifman and Lafon, 2006),that represents their mutual deformation complexity. For this weview each landmark as a node in a Markov chain. Each node inthe Markov chain represents a landmark in the model, and theedges between pairs of nodes carry information about pair-wiseproperties of the landmarks.
We define the pair-wise relations dk(i, j) for two landmarks anda kernel size k based on the minimum description length of modelsencompassing the two landmarks i and j and k � 2 others:
dk : f1;2; . . . ;ng2 ! R : ð6Þdkði; jÞ ¼min
MðLðMÞji; j #M and #M¼ kÞ; ð7Þ
where the modelM with cardinality #M :¼ #fh1; . . . ;hkg ¼ k rep-resents k landmarks and their respective positions in all frames ofthe sequence. LðMÞ denotes the description length Lðxfh1 ;...;hkgÞ asdefined in Section 3.3, and by i; j #M we denote that landmark iand j are among those modeled by M, i.e., i; j #M : ()i; j 2 fh1; . . . ;hkg. That is, d(i, j) is the minimum of the descriptionlengths of all models representing i and j, and arbitrary k � 2 otherentries of the observations.
The reasoning behind this definition is that we want to capturethe complexity of the best model that represents the joint defor-mation behavior of two landmarks, which are part of a larger struc-ture. A priori we do not know which other landmarks are part ofthis larger structure, and therefore we have to sample the potentialpartners of the pair. The relevant complexity is then characterizedby the smallest description length of all models that entail i, and j.
By means of the graph Laplacian construction (Chung, 1997) wecan transform this graph into a shape map (Langs and Paragios,2008). The symmetric kernels d(i, j) are now normalized by the de-gree of each node ri ¼
Pj2N i
dði; jÞ resulting in p(i, j) = d(i, j)/r(i).p(i, j) is no longer symmetric, but can be interpreted as the transi-tion probability from a single node to its neighbors in the Markovchain. This Markov chain defines a diffusion process on the set of
Fig. 4. Three ways to learn a model: assuming (a) a global model, (b) local models, (c)neighborhood for which a model is built is indicated.
landmarks. The corresponding diffusion distance integrates thepair-wise relations along paths in the Markov chain and capturesthe behavioral coherence of groups of landmarks. This allows usto determine clusters of landmarks for which a single model isappropriate by a simple clustering.
The matrix P, where Pi,j = p(i, j) is a diffusion operator on the setof nodes, defines a metric on the set of landmarks. The diffusionoperator can be applied multiple times, i.e. Pt on the set of nodes,resulting in gradually coarser metrics. In doing so, the parameter tcan be interpreted is the diffusion time parameter, which steersthe granularity of the resulting clustering (Coifman and Lafon,2006). It determines the radius within which nodes influence themutual diffusion distance between two nodes.
4.2. A map that reflects the joint modeling behavior
An eigenvalue decomposition of P results in an embedding ofthe nodes, and thereby of the landmarks into a shape mapWt : X ! Rw. Each landmark i = 1, . . ., m in the Markov chain ismapped into a w dimensional Euclidean space where the Euclideandistance corresponds to the diffusion distance in the graph.
i#WtðiÞ, kt1W1ðiÞ; kt
2W2ðiÞ; . . . ; ktwWwðiÞ
� �T: ð8Þ
The diffusion distance Dt(i, j) is the residual of the two uniquestationary distributions on nodes i, and j in the Markov chain afterdiffusion for t time steps, with transition probabilities p(i, j). It cor-responds to the costs of traveling between nodes i, and j in at mostt time steps. We are not interested in the actual values of thenodes, but in the metric that is defined by such a process. Itemerges when we assign p(i, j) as described above (Coifman and La-fon, 2006), and corresponds to the euclidean distance in theembedding or shape map
kWtðiÞ �WtðjÞk ¼ Dtði; jÞ; ð9Þ
and can thus be calculated efficiently.It has the following property for the task of finding landmarks
with coherent behavior: their mutual diffusion distance capturedby the pair-wise relations between the corresponding nodes islow. If more than two landmarks behave in such a coherent way,their mutual distances are further reduced, since there are manypossible and cheap ways through the graph, connecting them. Theyform clusters in the shape map. During model learning the algo-rithm estimates the shape map of the emerging shape model, in or-der to structure it according to the data.
Given correspondences G the shape map is built for the entireset of landmarks resulting in a map Wt(j) with j = 1, . . ., k. On thismap we perform k-means clustering to find groups of landmarks
sub shape models which adapt to the behavior of the data. For each method the

G. Langs et al. / Medical Image Analysis 15 (2011) 12–21 17
which act coherently during the sequence, i.e., which exhibit lowmutual deformation complexity.
For our experiments we determine the number of clusters byevaluating the silhouette value of the resulting clusters (Rousseeuw,1990). This results in a partitioning of the landmark set:P � Pð1; . . . ; kÞ. In Fig. 5 a synthetic example illustrates a structurecomposed of two endograft wire rings moving individually.Although a spatial separation is not possible, the trajectories fallinto two seperate clusters in the shape map. By learning this struc-ture information during model building it is possible to avoid erro-neous correspondences as shown in left part of the figure, whichresult from local spatial models.
5. Criterion function to find correspondences
The criterion function encompasses the description lengths ofmodels that capture the deformation of sets of landmarks. Wecan adopt three different criteria by choosing a way of definingthese sets. In Fig. 4 three different ways are illustrated. We canoptimize for (A) a global shape model, that describes the deforma-tion of the entire structure, for (B) a set of local models, that are de-fined by local spatial neighborhoods of the individual landmarks,or (C) we can choose to optimize only within sub models, that de-scribe parts of the data, which behave in a coherent way. Theseparts are formed by the clusters in the shape map described in Sec-tion 4. The shape map approach allows us to deal with a substan-tial amount of non-linearity in the deformation, by partitioning thedata accordingly. It is based on a method proposed in Langs andParagios (2008). Since the difference between the criteria can beformulated by means of a neighborhood definition, we will firstformulate the general criterion, and then differentiate the neigh-borhoods. We will denote the neighborhoods by N A;N B, and N C ,and the resulting criterion is
CðGÞ ¼ 1k
Xi¼1;...;k
CS MN iX;DN i
X
� �þ Ci
continuity
� �; ð10Þ
where DN iX
is the set of landmarks affiliated with a landmark i cho-sen according to a neighborhood function N i
X and MN iX
is theaccording model. The neighborhood can be defined by
N iA :¼ f1; . . . ; kg; 8i ¼ 1; . . . ; k; ð11Þ
i.e., a single global model that captures the entire structure at once,
N iB :¼ fj : kxi; xjk2 < constg; ð12Þ
Fig. 5. Synthetic example: illustration of registration errors due to heterogeneous deformmutual displacement (stent rings are indicated by yellow and blue ground truth trajectrajectory), resulting in a wrong deformation estimation. This is not the case if the modethus correctly separating the two rings during the learning process. (For interpretationversion of this article.)
which defines a local spatial neighborhood for each landmark, andmodels only the local non-rigid shape variation, and
N iC :¼ fj : kxi; xjk2 < const \ fi; jg 2 Pg; ð13Þ
which defines a local neighborhood constraint by the clustermem-bership according to the shape map built on the set of landmarks.
During model building the criterion function is minimized byaltering the matrix G that holds the correspondences betweenthe landmarks and the interest points in the training images. Achange of a single entry in G corresponds to a change of the posi-tion of a landmark in one image from one to another interest pointlocation.
6. Experimental validation
Prior to presenting results, let us first present the practical de-tails of the method.
6.1. Implementation details
The group-wise registration is initialized by a standard trackingof landmarks through the temporal sequence. We applied the fol-lowing coarse initialization: after an alignment that translatesthe interest point sets to have a common centroid, a randomsub-set of candidate points is tracked through the sequence bysearching for the closest candidate points on the stent-graft wirecenterlines in the subsequent frame. This results in the initial cor-respondence matrix Ginit.
After the coarse initialization of the correspondences the crite-rion function is minimized iteratively. This takes advantage of thesystematic deformation of the stent-graft during the cardiac cycle,since the landmarks situated on the individual stent segmentsmove in a correlated manner.
In each iteration the position for each landmark position in eachframe is updated. All interest or endograft wire points within a gi-ven radius are treated as landmark candidates. The location is cor-rected to minimize the criterion function Eq. (10). We do not use areference manifold, but rely only on spatial neighborhoods of theinterest points. For the global, and spatially local models, the iter-ative process is repeated until convergence. For the shape mapmodels we estimate the shape map, and perform clustering to ob-tain P alternately with the optimization step. This allows to use theemerging model to acquire estimates of the behavioral structureand model it accordingly.
ation, 2 stent rings each are subject to non-rigid deformation and at the same time atories). With standard registration a landmark jumps between the two rings (redls are build while at the same time learning the structure of their deformation, andof the references to colour in this figure legend, the reader is referred to the web

18 G. Langs et al. / Medical Image Analysis 15 (2011) 12–21
The computation time of the method for a dataset of approx 300landmarks and 12,000 candidates per frame is 1h using a Matlabimplementation, run on a 2.3 GHz, 2 GB machine.
6.2. Validation
We evaluate the method using a synthetic data set, that simu-lates two stent wire rings, and a typical movement pattern duringthe cardiac cycle, and a set of 10 gated computed tomography se-quences showing endografts in the aortic arch. For both data sets,we evaluate the registration accuracy of three different methods:(A) A group-wise registration with a single full multivariate Gauss-ian deformation model, (B) with multivariate Gaussian local mod-els, each covering only local neighborhood around a landmark,and (C) multivariate Gaussian sub models, based on the shapemap deformation structure of the endograft.
6.3. Synthetic data
The synthetic data comprises two rings of a stent-graft, thatmove similar to an endograft during the cardiac cycle. Due to thesynthetic generation, we know the true correspondences on thetwo rings. The example illustrates the ability of the three different
Table 1Registration errors for the three methods on the entire synthetic structure, I –standard tracking for initialization, A – single model, B – local models, C – sub models.Top: mean and median errors; bottom: box plot showing median, and 25th and 75thpercentiles.
Method Median error Mean error
I 0.972 1.082A 1.007 1.097B 0.788 0.945C 0.382 0.541
Init A B C0
0.5
1
1.5
2
2.5
3
Fig. 6. Complexity of local deformation as a measure of deformation coherence. The colorthe endograft has entered a supra-aortic vessel, while (b) and (c) show a case where twostrong local deformation (as opposed to the elastic deformation of the stent wire) and t
learning approaches to deal with heterogeneous deformationbehavior as can be observed in endografts, i.e., relatively rigid mo-tion within each ring, and less rigid deformation between the rings.On the rings with radius 10 a set of 20,000 points is generated, andcorrespondences for 200 landmarks are calculated by optimizingthe three criterions shown in Section 3.1: (A) a single global model,(B) local models (C) learned sub models, defined by a clustering inthe shape map of the emerging correspondences. No a priori topol-ogy is defined on the data. Fig. 5 shows the correct trajectories ofthe two rings (yellow, blue).
Quantitative results for the synthetic example are reported inTable 1. The global model achieves an accuracy comparable toplain tracking which serves as initialization with mean errors inthe range of 1.09. The local models are able to improve the accu-racy to a mean of 0.945, while the sub models are achieving a meanerror of 0.451. The global model results in 15% of the landmarksbeing within a 0.5 error bound, for the local models this value is39%, while the sub models reach 63%. In Table 1 a box plot of theerror distributions for plain tracking, and the three model learningcriterions is depicted. Note the much lower scatter for learned submodels (method C). Only method C is able to correctly resolve thestructure of the object, and deformation of the data, and thusachieves best correspondence accuracy. The spatial neighborhoodis not a good indicator of coherent behavior in the structure, andthus the local models are distorted because of points situated onboth rings. Besides the distortion this leads to landmark trajecto-ries which incorrectly jump between the two rings. In Fig. 5 sucha trajectory is plotted (indicated by an arrow, jumping betweenyellow and blue correct trajectories). Estimating the behavioraltopology (in our case: two parts) during the model learning processcan solve this problem to a large extent, and thus results in moreaccurate correspondences. A criterion based on a global model, orlocal models, results in optimal, but erroneous correspondences.
6.4. In situ endograft data
We performed the model learning on gated CT sequences for 10cases of patients with endografts. For 4 cases 8 frames, and for theremaining six cases 10 frames were reconstructed from a gated CTsequence showing the aortic arch of patients. The patients hadundergone endograft placement after a traumatic rupture of theaortic isthmus. The gated CT sequence depicts the entire cardiaccycle, and thus the deformation of the endograft structure, andthe surrounding anatomy. The frames show subsequent time-points during the cardiac cycle. The CT volumes have an in-sliceresolution ranging from 0.65 mm � 0.65 mm to 0.98 mm �0.98 mm and a slice thickness of 0.625 mm. Stent wire center-lines
indicates the complexity of the deformation during the cardiac cycle. In (a) a part ofwire rings are close and partially overlap during the cardiac cycle. This causes very
hus decreases the coherence measure substantially.

Fig. 7. Accuracy of endograft wire mapping based on correspondences after modellearning. Green: actual wire, blue: mapped wire after tracking based initialization,red: mapped wire after model learning with the proposed method. (For interpre-tation of the references to colour in this figure legend, the reader is referred to theweb version of this article.)
Init A B C
0.3
0.35
0.4
0.45
0.5
0.55
0.6
0.65
0.7
0.75
Init A B C0.6
0.65
0.7
0.75
0.8
0.85
0.9
0.95
1
1.05
1.1
Fig. 9. Mapping error after registration: mean absolute error for all 10 data sets,median relative error vs. plain tracking. To show the improvement for the mostaccurate points, only values for points which have error below 0.3 are taken intoaccount. It indicates a stronger influence of the variant B and C to improve the finedeviations of the structure.
G. Langs et al. / Medical Image Analysis 15 (2011) 12–21 19
were extracted on the individual frames, and the group-wise regis-tration was performed on each of the 10 sequences. The visiblestent had a diameter in the range of 1–2 voxels (vx), and center-lines were sampled with an average distance of 0.1 vx betweenneighboring points. The dense sampling allows for a more accurateregistration of positions along the contour. No manual annotationsof correspondences are possible, thus to obtain quantitative resultsfor the registration quality we used one frame as reference frameand propagated the stent centerlines to the remaining frames ina leave on out procedure based on the correspondences acquiredduring model learning. Based on these mappings we evaluatedthe correspondence quality, assuming that correct correspon-dences will results in minimal distances between mapped center-lines and actual centerlines in an individual frame. This was notused as an explicit criterion during model learning.
In Fig. 6 the description length of local models is visualized. Thecolor of each point indicates the complexity of the local deforma-tion during the cardiac cycle. High values indicate a high amountof local deformation. Fig. 6: (a) shows a case where a wire entersa supra-aortic vessel, causing high local deformation during thecardiac cycle, (b) and (c) show an endograft for which two wiresfrom different rings are very close but move rather independently,again causing strong local deformation. Both locations inidicatehigher risk for rupture of the structure.
In Fig. 7 an example of a comparison between mapped and realcenterlines is depicted. The correct centerline is drawn in green,
Fig. 8. Global deformation of an endograft, the colors indicate the standard deviation inclose to the aortic valve (center figure), and relatively low deformation in the descendingmovement around the vessel axis. A single stent-graft is characterized by different localegend, the reader is referred to the web version of this article.)
the tracking based initialization is blue, and the registration resultis drawn in red. A perfect registration would cause the green andred line to coincide. We report mean and median error betweenpropagated centerlines and actual centerlines for each frame inFig. 9. The errors show only moderate differences between thethree approaches. The mean error for global models is 0.453, for lo-cal models 0.425, and for sub models 0.420.
the first principal displacement direction (red-high, blue-low). Note the high valuesaorta (right figure), which besides minor translations is dominated by a rotationary
l deformation patterns. (For interpretation of the references to colour in this figure

0 10 20 30 40 50 60 70 800
50
100
150
200
250
300
350
400
450
500
Local Complexity
Freq
uenc
yMan 1Man 2Man 3Man 4
24
26
28
30
32
34
36
38
40
42
1 2 3 4Manufacturer
Mea
n lo
cal c
ompl
exity
ba
Fig. 10. Distribution of local shape variation complexity on the endografts: (a) profiles for all 10 cases, the four different designs of the endografts in the study are color coded,and the mean curve for each design is indicated with a thick line. Note the high coherence of the profiles within the designs. (b) Shows a box plot for the mean complexityvalues for the four designs. While designs 1 and 4 behave very similar, design 2 shows consistent low values. Compare this also to Fig. 11, where the global deformation of theendografts is depicted.
20 G. Langs et al. / Medical Image Analysis 15 (2011) 12–21
In Fig. 8 the deformation is visualized by the tensor of the first 3principal axes of displacements for individual wire points on anendograft (left). Colors correspond to the amount of displacement.Note the high displacement along two axes in the region close tothe heart (center), and the relatively low, rotational displacementaround the vessel axis in the descending part of the aorta (right).Fig. 11 shows the tensors for all cases in our data set. The mean glo-bal displacement along the first principal axis of displacementranges from 1.0 mm to 1.9 mm the maximum from 3.1 mm to5.9 mm, and the minimum from 0.0 mm to 0.3 mm.
6.5. Differentiating endograft designs – using local deformationcomplexity as a descriptor
The description length of local models can also serve for dataanalysis after model learning is completed. It can be used as adescriptor of the shape variability of the observed objects. A highly
1 (Design 1) 2 (Design 2) 3 (Design 2
6 (Design 2) 7 (Design 3) 8 (Design
Fig. 11. Global deformation for all endografts in the study, for eac
elastic endograft would have a different profile with regard to thedistribution of description length values, as opposed to an endo-graft with relatively rigid wires, and thus potentially higher localdeformation between individual wire rings. To investigate the po-tential of this descriptor we evaluated its discriminative power onthe four different endograft designs in the data set. This is also anindirect indicator of the registration accuracy. In Fig. 10 the histo-grams of local complexity values for the 10 cases are shown. Colorindicates the respective endograft design. The mean local complex-ity for a local neighorhood size of 20 exhibits significant differencesbetween designs 1, 2, and 3 (p < 0.05). Design 4 can only be differ-entiated significantly from design 2. Designs 1 and 4 are very sim-ilar successive designs by the same manufacturer. This is reflectedin their respective profiles in Fig. 10.
The suspected physical reason for the differences is that manu-facturer 2 uses considerably more elastic material, which allowsthe endograft wires to deform in a much more coherent way, with-
) 4 (Design 2) 5 (Design 1)
4) 9 (Design 4) 10 (Design 1)
h endograft the design is indicated (corresponding to Fig. 10).

G. Langs et al. / Medical Image Analysis 15 (2011) 12–21 21
out causing local peaks of deformation between the endograftwires. Designs 1 and 3 are very similar, and this is reflected inthe quantitative deformation behavior.
7. Conclusion
In this paper we propose a method for the autonomous learningof deformation models from heterogeneous data. The approachlearns both a statistical model of shape variation, and the intrinsicstructure of the data, by optimizing a criterion based on thedescription length of models capturing the variation of the ob-served structure. We apply the method to analyse the deformationof endografts in the thoracic aorta during the cardiac cycle. Sinceno retrospective studies of the long-term behavior of stent-graftsin this region with constant deformation are available, the under-standing of stent-graft deformation is highly relevant, to predictrisks, and to reinforce stent-grafts at specific regions where highdeformations occur. The group-wise registration finds correspon-dences for a set of landmarks in the volumes of the gated CT se-quence depicting the stent-graft at different time points in thecardiac cycle. The resulting landmark correspondences and theshape model allow to assess the deformation quantitatively. Theregistration does not require a prior definition of topology butworks on sparse sets of points, that are located on the endograftwires. During the process it establishes the behavioral topologyof the endograft, by adapting the description lenght based criterionto sub structures that behave coherently. Future work will focus onthe simulation of the fabric inbetween the wires, and the separa-tion between different spatial motion components in the data. Ofparticular interest is the relation between the purely statisticaldata driven assessment of shape and deformation described in thispaper and physical models capturing material properties and highlevel knowledge about the observed structures.
Acknowledgments
This work has been supported from the Conseil General de Île-de-France, and the Austrian National Bank Anniversary Fund(12537 COBAQUO, 13497 AORTAMOTION).
References
Amabile, P., Rollet, G., Vidal, V., Collart, F., Bartoli, J.-M., Piquet, P., 2006. Emergencytreatment of acute rupture of the descending thoracic aorta using endovascularstent-grafts. Ann. Vasc. Surg. 20 (6), 723–730.
Beichel, R., Gotschuli, G., Sorantin, E., Leberl, F., Sonka, M., 2002. Diaphragm domesurface segmentation in CT data sets: a 3D active appearance model approach.In: Sonka, M., Fitzpatrick, J. (Eds.), SPIE: Medical Imaging, vol. 4684.
Bookstein, F., 1991. Morphometric Tools for Landmark Data: Geometry and Biology.Cambridge University Press.
Chung, F.R., 1997. Spectral Graph Theory. American Mathematical Society.Coifman, R.R., Lafon, S., 2006. Diffusion maps. Appl. Comput. Harmon. Anal. 21.Cootes, T., Edwards, G.J., Taylor, C.J., 2001. Active appearance models. IEEE TPAMI 23
(6), 681–685.Cootes, T., Twining, C., Petrovic, V., Taylor, C., 2005. Groupwise construction of
appearance models using piece-wise affine deformations. In: BMVC’05.Davies, R.H., Twining, C., Cootes, T.F., Waterton, J.C., Taylor, C.J., 2002. A minimum
description length approach to statistical shape modeling. IEEE TMI 21 (5), 525–537.
Davies, R.H., Twining, C.J., Cootes, T.F., Waterton, J.C., Taylor, C.J., 2002. 3D statisticalshape models using direct optimisation of description length. In: Proc. of ECCV,vol. 3.
Frangi, A.F., Niessen, W.J., Vincken, K.L., Viergever, M.A., 1998. Multiscale vesselenhancement filtering. In: Proc. of MICCAI 1998.
Garzon, G., Fernandez-Velilla, M., Marti, M., Acitores, I., Ybanez, F., Riera, L., 2005.Endovascular stent-graft treatment of thoracic aortic disease. Radiographics 25(Suppl. 1), S229–S244.
Langs, G., Paragios, N., 2008. Modeling the structure of multivariate manifolds:shape maps. In: Proc. CVPR’08.
Langs, G., Donner, R., Peloschek, P., Bischof, H., 2007. Robust autonomous modellearning from 2d and 3d data sets. In: Proc. of MICCAI’07.
Langs, G., Paragios, N., Donner, R., Desgranges, P., Rahmouni, A., Kobeiter, H., 2007.Motion analysis of endovascular stent-grafts by MDL based registration. In:Proc. of MMBIA’07 (ICCV).
Lebl, D.R., Dicker, R.A., Spain, D.A., Brundage, S.I., 2006. Dramatic shift in the primarymanagement of traumatic thoracic aortic rupture. Arch. Surg. 141 (2), 177–180.
Marcheix, B., Dambrin, C., Bolduc, J.-P., Arnaud, C., Hollington, L., Cron, C., Mugniot,A., Soula, P., Bennaceur, M., Chabbert, V., Otal, P., Cerene, A., Rousseau, H., 2006.Endovascular repair of traumatic rupture of the aortic isthmus: midtermresults. J. Thorac. Cardiovasc. Surg. 132 (5), 1037–1041.
Mitchell, S.C., Bosch, J.G., Lelieveldt, B.P.F., van der Geest, R.J., Reiber, J.H.C., Sonka,M., 2002. 3-d active appearance models: segmentation of cardiac MR andultrasound images. IEEE TMI 21 (9), 1167–1178.
Roberts, M., Cootes, T., Adams, J., 2005. Vertebral shape: automatic measurementwith dynamically sequenced active appearance models. In: Proc. of MICCAI2005.
Rousseeuw, K.L.P., 1990. Finding Groups in Data: An Introduction to ClusterAnalysis. Wiley.
Rueckert, D., Frangi, A., Schnabel, J., 2003. Automatic construction of 3-D statisticaldeformation models of the brain using nonrigid registration. IEEE TMI 22 (8),1014–1025.
Shannon, C., 1948. A mathematical theory of communication. Bell SystemsTechnical Journal 27, 379–423.
Stegmann, M.B., Ólafsdóttir, H., Larsson, H.B.W., 2005. Unsupervised motion-compensation of multi-slice cardiac perfusion MRI. Med. Image Anal. 9 (4),394–410.
Thodberg, H.H., Olafsdottir, H., 2003. Adding curvature to minimum descriptionlength shape models. In: Proc. of BMVC’03, vol. 2.
Twining, C.J., Cootes, T., Marsland, S., Petrovic, V., Schestowitz, R., Taylor, C.J., 2005.A unified information-theoretic approach to groupwise non-rigid registrationand model building. In: Proc. of Information Processing in Medical ImagingIPMI.
Walker, K., Cootes, T., Taylor, C., 2002. Automatically building appearance modelsfrom image sequences using salient features. IVC 20 (5), 435–440.
Wellons, E.D., Milner, R., Solis, M., Levitt, A., Rosenthal, D., 2004. Stent-graft repair oftraumatic thoracic aortic disruptions. J. Vasc. Surg. 40 (6), 1095–1100.