memorandum - bpa.gov
TRANSCRIPT
1
Memorandum To: Joan Wang, Bonneville Power Administration
From: Cadeo Group
Date: March 26, 2021
Subject: Adjustable Speed Drives Market Actor Interview Findings
Bonneville Power Administration (BPA) contracted with Cadeo (the research team) to conduct interviews
of market actors in the motor, adjustable speed drive (ASD), and motor-driven equipment supply chains.
This document presents background on the ASD market, a summary of key findings, the methodology
employed by the research team, and more detailed findings from those interviews. The goal of this work is
to help BPA characterize the ASD market and support a market model that characterizes the energy
consumption of standalone motor-driven systems in the region and the impact of ASD adoption. The
findings from these interviews also support other regional activities characterizing the impact of ASDs,
including the research strategy developed by the Regional Technical Forum (RTF) for the Variable Speed
Drives (VSDs) Unit Energy Savings (UES) Measures.1,2
Background
BPA identified electric motors as a major electricity end use in the Pacific Northwest (the region),
consuming approximately 70% of the regional industrial load.3 The use of ASDs to vary motor rotational
speed has a large impact on motor energy consumption. The adoption of ASD technology has increased
dramatically in the past 20 years, representing a technological advancement transforming how motor-
driven systems consume energy. Through an initial review of existing ASD market information, the
research team identified that 1) ASD adoption is increasing across the country and having a large impact
on energy consumption, 2) there is a great deal of regional interest in ASDs, with the Northwest Energy
Efficiency Alliance (NEEA) developing an initiative to increase adoption of efficient motor-driven
equipment and the RTF establishing UES measures for VSDs, and 3) there is no recent market information
on ASD adoption specific to the Pacific Northwest.
Given the lack of regionally specific information on the ASD market, BPA, working with the research team,
set out to fill this gap through interviews with market actors in the motor, ASD, and motor-driven
equipment markets. The effort aimed to develop a market supply chain and identify any differences in the
ASD market based on sector or equipment end-use.
1 This memo uses the term “ASD” to refer to any electronic controller that allows a motor to vary its speed. ASDs include equipment such as
variable frequency drives (VFDs) and VSDs. 2 “Research Strategy: Variable Speed Drives”, VSD_ResearchStrategy202007.docx
https://nwcouncil.app.box.com/v/072020VSDResearchStrat, accessed 03/23/2021 3 Industrial_tool_7thPlan v09.xlsm, tab “End Uses”, Cells E24:T24
https://nwcouncil.app.box.com/v/7thplanconservationdatafiles/file/54717875397, accessed 03/23/2021
2
Key Findings
Motor and ASD Supply Chain
At the onset of this research, BPA had a high-level understanding of the general market actor categories
and flow of products from manufacturers through to end users. The interviews refined this understanding
and produced a detailed supply chain map for both the motor and ASD markets (Figure 1).
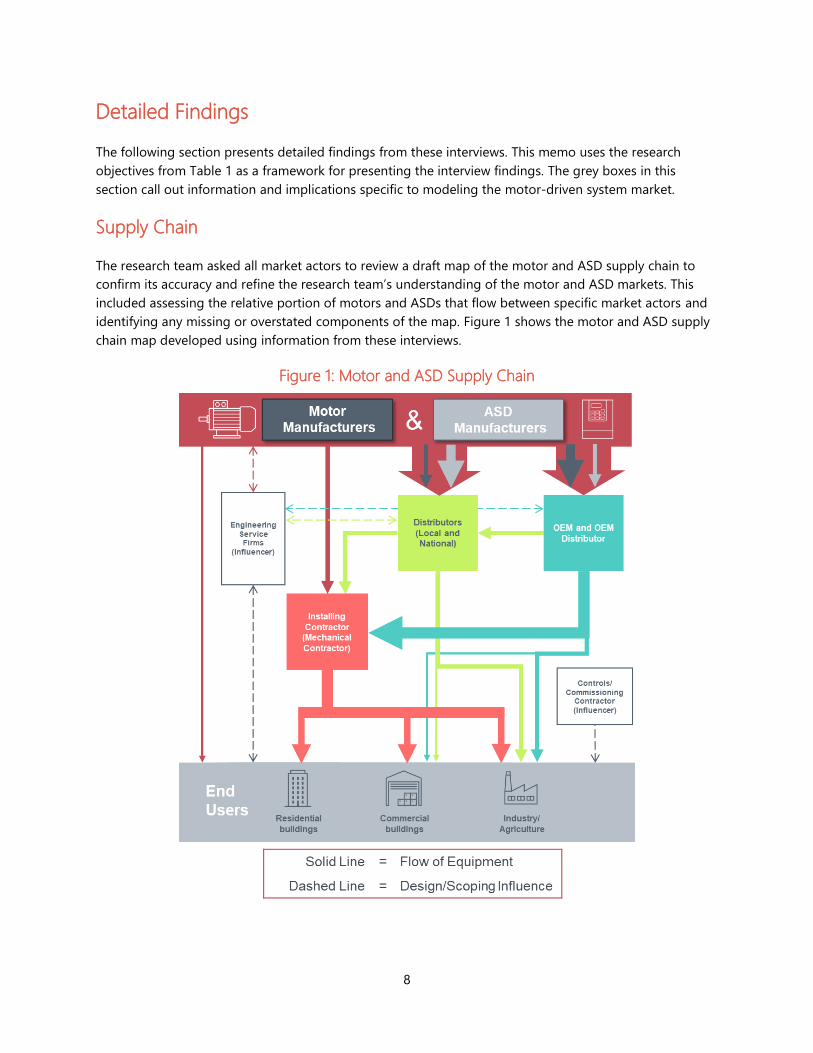
Companies often manufacture both motors and ASDs (as opposed to only one), but motor and ASD
manufacturing is “siloed” within these organizations. While a company may produce both motors and
ASDs, it does not market or sell them paired together. Motors and drives are almost always paired
downstream of the Manufacturer. To fully characterize the number of ASDs installed in the region,
data collection must include information from market actors below the Manufacturer level.
Motors and ASDs have the same supply chain structure, with the same market actors and similar
paths to market. However, the distribution of motors and ASDs flowing through each market actor is
different. Motors most often flow through OEMs (such as fan or pump Manufacturers) to end users,
whereas ASDs are most often sold from Manufacturers to Distributors, to be paired with motors
and equipment at installation. However, given the difficulties associated with collecting data from
installing contractors and end users, the research team identified OEMs and OEM distributors as the
most effective source of information to characterize ASD installations.
ASD Adoption
National data indicates that ASD adoption has been increasing over the past 20 years.4,5 However, there is
no publicly available information on regional changes in ASD adoption. These interviews provided
valuable insight into how ASD adoption has changed in the region and the factors driving that change.
Regional ASD adoption has increased over the past 10 years. Moreover, market actors
overwhelmingly stated that ASD adoption has accelerated continually in the past five to six
years. Decreased cost, improvements in equipment reliability, and increased system controllability
through the Industrial Internet of Things (IIoT) are the main drivers of adoption. Increasing adoption
rates with no indication that they will plateau suggests that ASDs could continue to impact regional
energy consumption through the next five years.
Electronically commutated motors (ECM) are currently the only advanced motor technology6
with a measurable share of the standalone motor market. ECMs currently only serve applications
up to 30 motor HP due to technological limitations. Market actors stated that other advanced motor
technologies do not face the same limitations, but are limited to niche applications due to their
operational characteristics. Without considering those niche applications, a model calculating the
regional energy consumption of motor-driven systems needs only to account for advanced motor
technologies using information on ECM technology.
4 United States Industrial Electric Motor Systems Market Opportunities Assessment, 2002, https://www.energy.gov/eere/amo/us-doe-
motor-system-market-assessment, accessed 3/23/2021
5 The Department of Energy (DOE) has updated this assessment, using information collected in 2018. This report is not yet available online.
6 Advanced motor technology refers to any motor type that, through its design, cannot be installed without a controller that enables
variable speed control. These motor types include ECMs, synchronous reluctance motors, and switch reluctance motors.
3
Market actors noted that geography impacts the saturation of ASDs. The price of electricity and the
prevalence of utility energy-efficiency programs, both of which are regionally dependent,
impact the saturation of ASDs. A regional market model will need to account for differences in
regional ASD saturation compared to national data, as the region has lower-than-average electricity
prices and higher-than-average utility program activity.
Market actors indicated that programs have a large impact on ASD adoption, but also noted that
barriers to custom incentive programs still exist. Complicated and time-intensive program
applications make custom programs inaccessible to some market actors. Streamlining the custom
program process could increase the penetration of ASDs via utility programs.
ASD Installation Trends and Operational Characteristics
The focus of these interviews was on characterizing the motor and ASD market, but the research team
also investigated trends in installation and operational characteristics across different motor-driven
equipment. While fewer market actors provided insights on these topics, the research still gained valuable
insight into trends in installation and equipment operation.
The two standalone commercial fan applications, clean air ventilation and exhaust, have similar
operating characteristics, such as load profile and operating hours. Although there are two
commercial applications for standalone fans, they can be grouped into one application due to similar
operating characteristics of those fans. This eliminates any need to characterize multiple commercial
fan applications to accurately estimate commercial fan energy consumption.
Market actors noted that electrically driven mechanical control devices, like eddy current drives
and hydraulic drives, are “obsolete” and rarely exist in the field. In the installed stock, these
devices only serve large specialty-purpose applications, usually in heavy industry. Distributors and
engineering service firms indicated that the few sales of these devices either replace existing
equipment or are installed in facilities that are currently using these devices to control existing
motors. This finding indicates that the impact of these control devices in the market or installed stock
is minimal and can be excluded from the scope of ASDs in the market model.
Motor-driven systems adopt control strategies for both load control and load trimming. End Users no
longer install mechanical control strategies for fans (e.g., dampers) and pumps (e.g., throttling
valves) for the purpose of load control (as opposed to for load trimming). Market actors did not
identify when mechanical control strategies for fans and pumps stopped being installed for load
control, but they did indicate that if there is expected variability in the load, a system designer will
specify an ASD.
Market actors indicated that approximately 15% of all ASDs serve trim applications or act as a
way to “turn down” the system to meet a constant, reduced load operating point. Market actors
did not indicate differences in this use of ASDs across sectors or motor driven-equipment. Without an
ASD, a system would use mechanical control to meet a decreased operating point, which is less
efficient than using an ASD.
Through these interviews the research team determined that a gap in knowledge exists in the
market surrounding ASD commissioning. There was no consensus on the percent of ASDs that
undergo commissioning, and individuals interviewed in each market actor category identified other
market actor categories—as opposed to themselves—to be responsible for commissioning ASDs.
4
Trends in Air Compressor Installations
As a type of motor-driven equipment, air compressors are currently the least well characterized in the
region. The RTF has UES measures for pumps and fans but not for air compressors. These market actor
interviews informed BPAs understanding of current air compressor applications and the installation of
ASDs on this equipment.
Commercial new construction buildings no longer install large air compressor systems. Market
actors did not identify when companies stopped installing these systems, but they indicated that the
advent of affordable digital control systems drove commercial end users away from compressed air
systems. Engineering service firms and end users are also replacing these systems in existing buildings
with digital control systems. Commercial air compressors already represent a small portion of the
regional energy load7 and these interviews further indicate that this portion is shrinking.
Air compressor OEMs only sell their equipment as packaged units, with the motor, air
compressor, and ASD (if present) as one unit. Currently, air compressor manufacturers do not
produce or market equipment that supports retrofitted ASDs. In contrast to modeling pumps and
fans, modeling the air compressor market will only require collecting information from air compressor
OEMs.
Methodology
The research team set out to conduct up to 60 in-depth interviews with ASD market actors. Before
embarking on recruitment, the research team developed research objectives for these interviews by
completing an initial review of existing information. After outlining the objectives of this research, the
research team developed a recruitment plan, which relied on purposive outreach to recruit relevant
market actors. At completion, the research team interviewed 53 individuals, covering all targeted market
actor categories.
This section presents the research objectives these interviews aimed to answer, followed by the
recruitment and final disposition of interviewees.
Research Objectives and Interview Strategy
Before engaging market actors, the research team reviewed existing information characterizing the motor,
ASD, and motor-driven equipment markets. This review allowed the research team to identify major
information gaps that need filling before developing a market model. During the data review, the research
team identified five categories of information gaps that can be addressed by in-depth interviews, and a
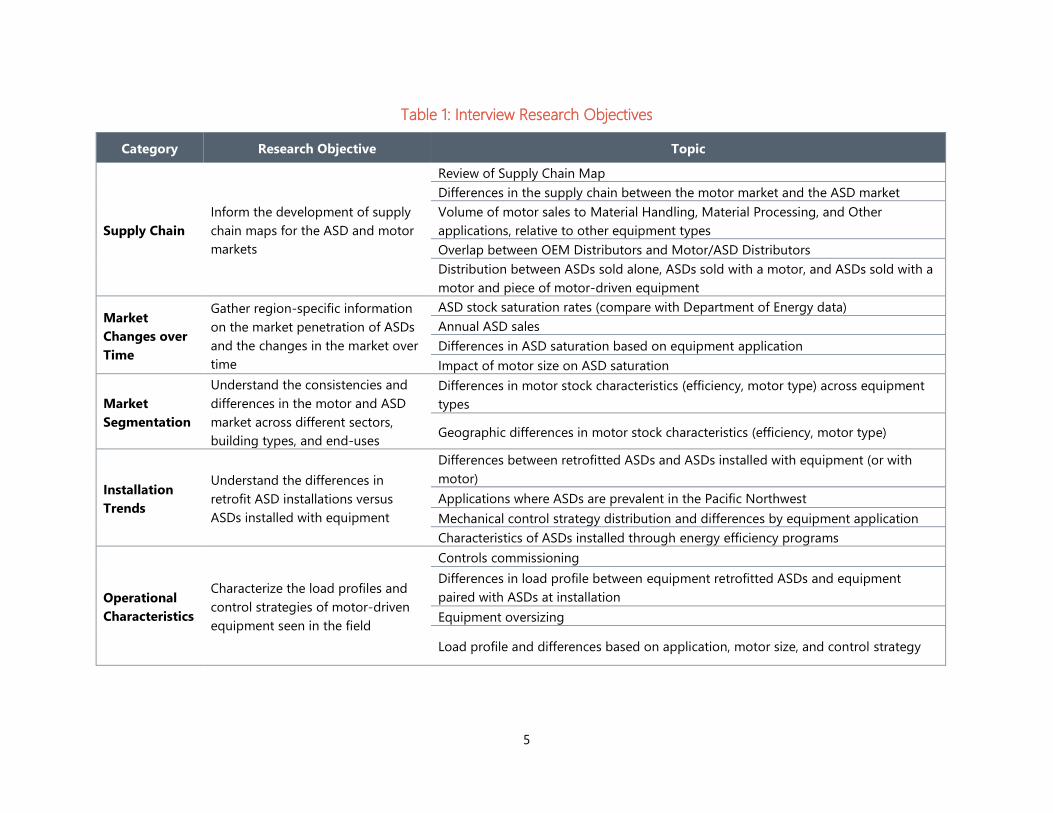
research objective for each category. Table 1 presents each category, its research objective, and the
question topics identified to meet the objective.
7 “Com-AirComp-2021P_V7.xlsx”, Tab “Rotar_Shipments”, Cell B16,
https://nwcouncil.app.box.com/s/u0dgjxkoxoj2tttym81uka3wrjcy6bo6/file/655813213797, accessed 3/23/2021
5
Table 1: Interview Research Objectives
Category Research Objective Topic
Supply Chain
Inform the development of supply
chain maps for the ASD and motor
markets
Review of Supply Chain Map
Differences in the supply chain between the motor market and the ASD market
Volume of motor sales to Material Handling, Material Processing, and Other
applications, relative to other equipment types
Overlap between OEM Distributors and Motor/ASD Distributors
Distribution between ASDs sold alone, ASDs sold with a motor, and ASDs sold with a
motor and piece of motor-driven equipment
Market
Changes over
Time
Gather region-specific information
on the market penetration of ASDs
and the changes in the market over
time
ASD stock saturation rates (compare with Department of Energy data)
Annual ASD sales
Differences in ASD saturation based on equipment application
Impact of motor size on ASD saturation
Market
Segmentation
Understand the consistencies and
differences in the motor and ASD
market across different sectors,
building types, and end-uses
Differences in motor stock characteristics (efficiency, motor type) across equipment
types
Geographic differences in motor stock characteristics (efficiency, motor type)
Installation
Trends
Understand the differences in
retrofit ASD installations versus
ASDs installed with equipment
Differences between retrofitted ASDs and ASDs installed with equipment (or with
motor)
Applications where ASDs are prevalent in the Pacific Northwest
Mechanical control strategy distribution and differences by equipment application
Characteristics of ASDs installed through energy efficiency programs
Operational
Characteristics
Characterize the load profiles and
control strategies of motor-driven
equipment seen in the field
Controls commissioning
Differences in load profile between equipment retrofitted ASDs and equipment
paired with ASDs at installation
Equipment oversizing
Load profile and differences based on application, motor size, and control strategy
6
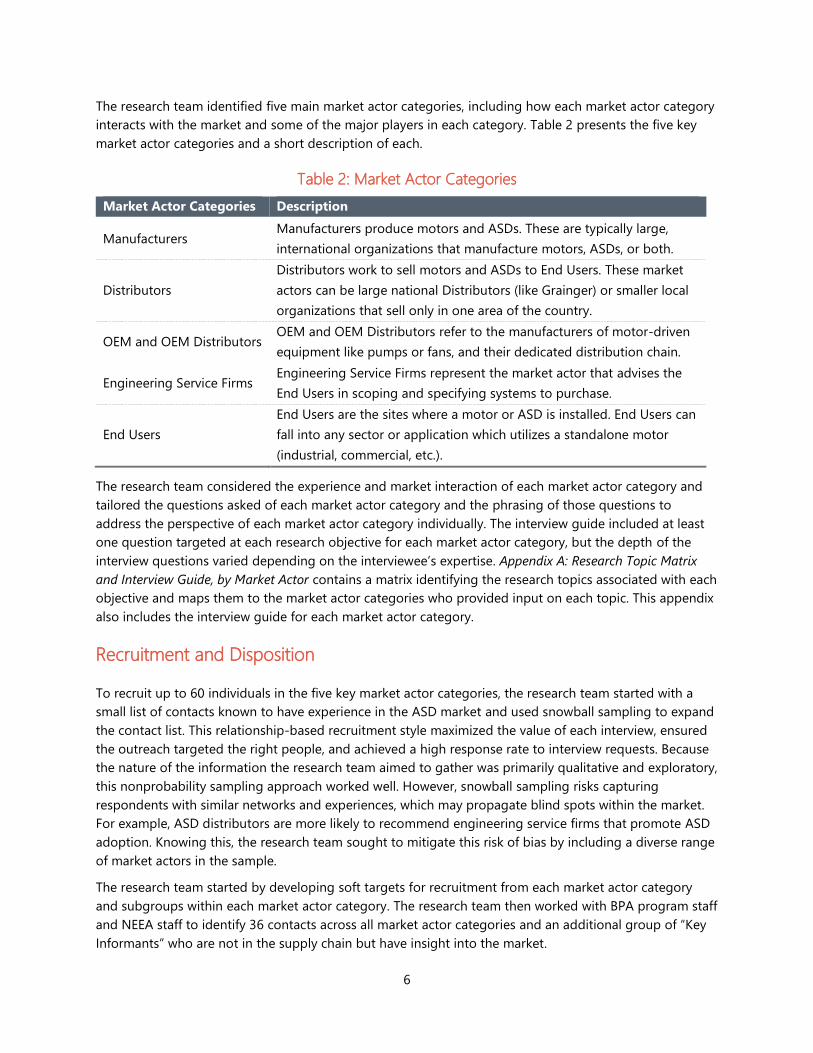
The research team identified five main market actor categories, including how each market actor category
interacts with the market and some of the major players in each category. Table 2 presents the five key
market actor categories and a short description of each.
Table 2: Market Actor Categories
Market Actor Categories Description
Manufacturers Manufacturers produce motors and ASDs. These are typically large,
international organizations that manufacture motors, ASDs, or both.
Distributors
Distributors work to sell motors and ASDs to End Users. These market
actors can be large national Distributors (like Grainger) or smaller local
organizations that sell only in one area of the country.
OEM and OEM Distributors OEM and OEM Distributors refer to the manufacturers of motor-driven
equipment like pumps or fans, and their dedicated distribution chain.
Engineering Service Firms Engineering Service Firms represent the market actor that advises the
End Users in scoping and specifying systems to purchase.
End Users
End Users are the sites where a motor or ASD is installed. End Users can
fall into any sector or application which utilizes a standalone motor
(industrial, commercial, etc.).
The research team considered the experience and market interaction of each market actor category and
tailored the questions asked of each market actor category and the phrasing of those questions to
address the perspective of each market actor category individually. The interview guide included at least
one question targeted at each research objective for each market actor category, but the depth of the
interview questions varied depending on the interviewee’s expertise. Appendix A: Research Topic Matrix
and Interview Guide, by Market Actor contains a matrix identifying the research topics associated with each
objective and maps them to the market actor categories who provided input on each topic. This appendix
also includes the interview guide for each market actor category.
Recruitment and Disposition
To recruit up to 60 individuals in the five key market actor categories, the research team started with a
small list of contacts known to have experience in the ASD market and used snowball sampling to expand
the contact list. This relationship-based recruitment style maximized the value of each interview, ensured
the outreach targeted the right people, and achieved a high response rate to interview requests. Because
the nature of the information the research team aimed to gather was primarily qualitative and exploratory,
this nonprobability sampling approach worked well. However, snowball sampling risks capturing
respondents with similar networks and experiences, which may propagate blind spots within the market.
For example, ASD distributors are more likely to recommend engineering service firms that promote ASD
adoption. Knowing this, the research team sought to mitigate this risk of bias by including a diverse range
of market actors in the sample.
The research team started by developing soft targets for recruitment from each market actor category
and subgroups within each market actor category. The research team then worked with BPA program staff
and NEEA staff to identify 36 contacts across all market actor categories and an additional group of “Key
Informants” who are not in the supply chain but have insight into the market.
7
Recruitment and scheduling of interviews was more difficult than anticipated. As the research progressed,
it became clear that fewer individuals were able to refer additional participants to the research than
initially expected. Specifically, market actors very rarely provided additional contacts for Manufacturers
and Distributors, which created a gap in these categories. To fill this gap, the research team cold called
national and local Manufacturers and Distributors to recruit participants. These cold calls, which resulted
in 7 interviews, helped mitigate potential risks of bias created by snowball sampling.
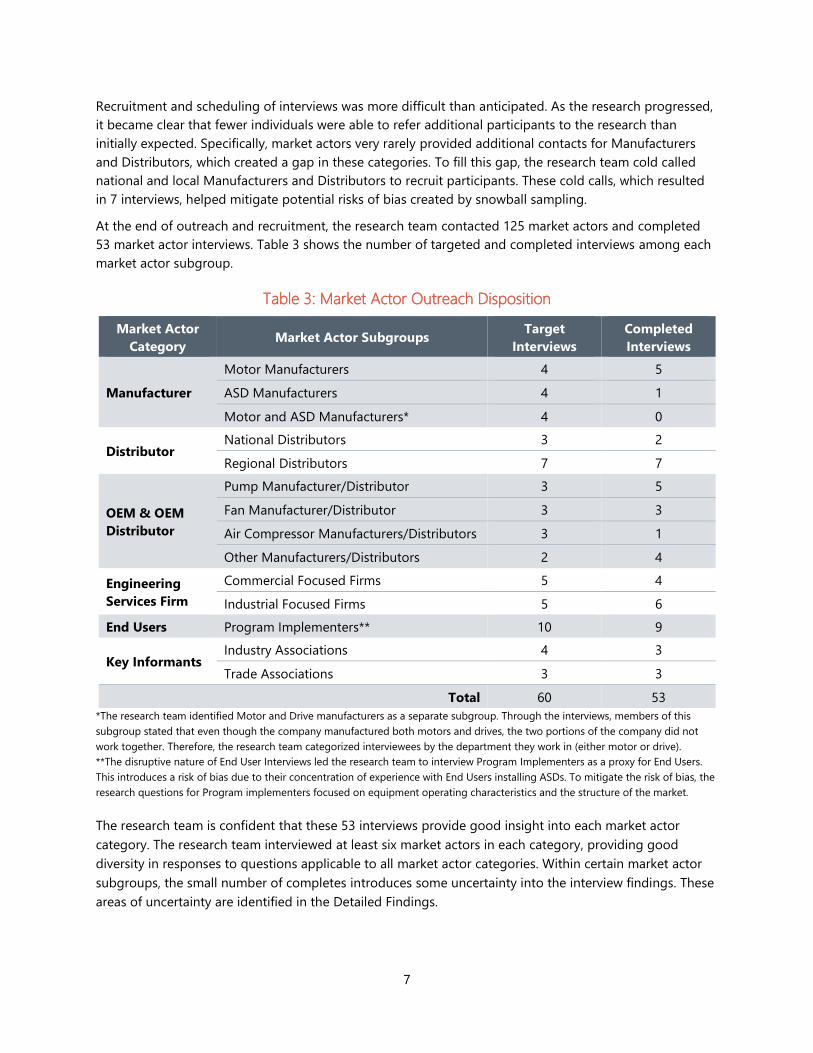
At the end of outreach and recruitment, the research team contacted 125 market actors and completed
53 market actor interviews. Table 3 shows the number of targeted and completed interviews among each
market actor subgroup.
Table 3: Market Actor Outreach Disposition
Market Actor
Category Market Actor Subgroups
Target
Interviews
Completed
Interviews
Manufacturer
Motor Manufacturers 4 5
ASD Manufacturers 4 1
Motor and ASD Manufacturers* 4 0
Distributor National Distributors 3 2
Regional Distributors 7 7
OEM & OEM
Distributor
Pump Manufacturer/Distributor 3 5
Fan Manufacturer/Distributor 3 3
Air Compressor Manufacturers/Distributors 3 1
Other Manufacturers/Distributors 2 4
Engineering
Services Firm
Commercial Focused Firms 5 4
Industrial Focused Firms 5 6
End Users Program Implementers** 10 9
Key Informants Industry Associations 4 3
Trade Associations 3 3
Total 60 53
*The research team identified Motor and Drive manufacturers as a separate subgroup. Through the interviews, members of this
subgroup stated that even though the company manufactured both motors and drives, the two portions of the company did not
work together. Therefore, the research team categorized interviewees by the department they work in (either motor or drive).
**The disruptive nature of End User Interviews led the research team to interview Program Implementers as a proxy for End Users.
This introduces a risk of bias due to their concentration of experience with End Users installing ASDs. To mitigate the risk of bias, the
research questions for Program implementers focused on equipment operating characteristics and the structure of the market.
The research team is confident that these 53 interviews provide good insight into each market actor
category. The research team interviewed at least six market actors in each category, providing good
diversity in responses to questions applicable to all market actor categories. Within certain market actor
subgroups, the small number of completes introduces some uncertainty into the interview findings. These
areas of uncertainty are identified in the Detailed Findings.
8
Detailed Findings
The following section presents detailed findings from these interviews. This memo uses the research
objectives from Table 1 as a framework for presenting the interview findings. The grey boxes in this
section call out information and implications specific to modeling the motor-driven system market.
Supply Chain
The research team asked all market actors to review a draft map of the motor and ASD supply chain to
confirm its accuracy and refine the research team’s understanding of the motor and ASD markets. This
included assessing the relative portion of motors and ASDs that flow between specific market actors and
identifying any missing or overstated components of the map. Figure 1 shows the motor and ASD supply
chain map developed using information from these interviews.
Figure 1: Motor and ASD Supply Chain
9
Market Actor Categories
Through these interviews, the research team refined their understanding of each market actor category,
expanding on the information presented in the Methodology section.
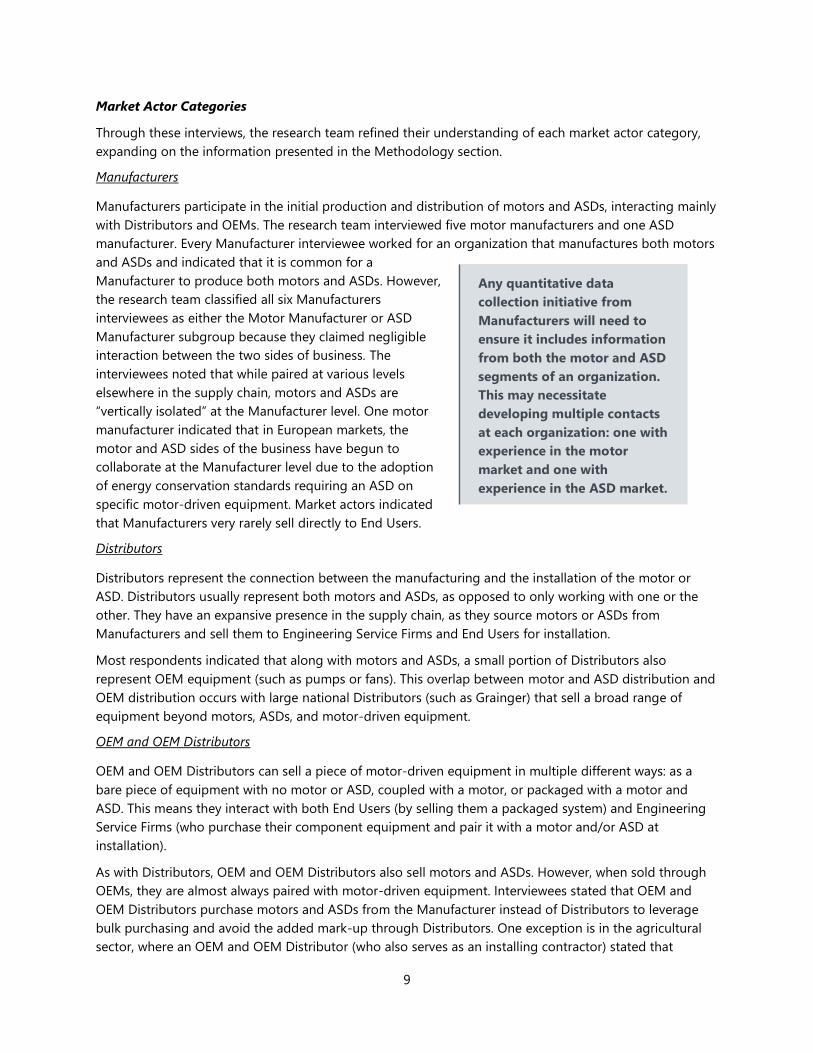
Manufacturers
Manufacturers participate in the initial production and distribution of motors and ASDs, interacting mainly
with Distributors and OEMs. The research team interviewed five motor manufacturers and one ASD
manufacturer. Every Manufacturer interviewee worked for an organization that manufactures both motors
and ASDs and indicated that it is common for a
Manufacturer to produce both motors and ASDs. However,
the research team classified all six Manufacturers
interviewees as either the Motor Manufacturer or ASD
Manufacturer subgroup because they claimed negligible
interaction between the two sides of business. The
interviewees noted that while paired at various levels
elsewhere in the supply chain, motors and ASDs are
“vertically isolated” at the Manufacturer level. One motor
manufacturer indicated that in European markets, the
motor and ASD sides of the business have begun to
collaborate at the Manufacturer level due to the adoption
of energy conservation standards requiring an ASD on
specific motor-driven equipment. Market actors indicated
that Manufacturers very rarely sell directly to End Users.
Distributors
Distributors represent the connection between the manufacturing and the installation of the motor or
ASD. Distributors usually represent both motors and ASDs, as opposed to only working with one or the
other. They have an expansive presence in the supply chain, as they source motors or ASDs from
Manufacturers and sell them to Engineering Service Firms and End Users for installation.
Most respondents indicated that along with motors and ASDs, a small portion of Distributors also
represent OEM equipment (such as pumps or fans). This overlap between motor and ASD distribution and
OEM distribution occurs with large national Distributors (such as Grainger) that sell a broad range of
equipment beyond motors, ASDs, and motor-driven equipment.
OEM and OEM Distributors
OEM and OEM Distributors can sell a piece of motor-driven equipment in multiple different ways: as a
bare piece of equipment with no motor or ASD, coupled with a motor, or packaged with a motor and
ASD. This means they interact with both End Users (by selling them a packaged system) and Engineering
Service Firms (who purchase their component equipment and pair it with a motor and/or ASD at
installation).
As with Distributors, OEM and OEM Distributors also sell motors and ASDs. However, when sold through
OEMs, they are almost always paired with motor-driven equipment. Interviewees stated that OEM and
OEM Distributors purchase motors and ASDs from the Manufacturer instead of Distributors to leverage
bulk purchasing and avoid the added mark-up through Distributors. One exception is in the agricultural
sector, where an OEM and OEM Distributor (who also serves as an installing contractor) stated that
Any quantitative data
collection initiative from
Manufacturers will need to
ensure it includes information
from both the motor and ASD
segments of an organization.
This may necessitate
developing multiple contacts
at each organization: one with
experience in the motor
market and one with
experience in the ASD market.
10
agricultural OEM Distributors sometimes purchase motors and ASDs from Distributors instead of
Manufacturers.
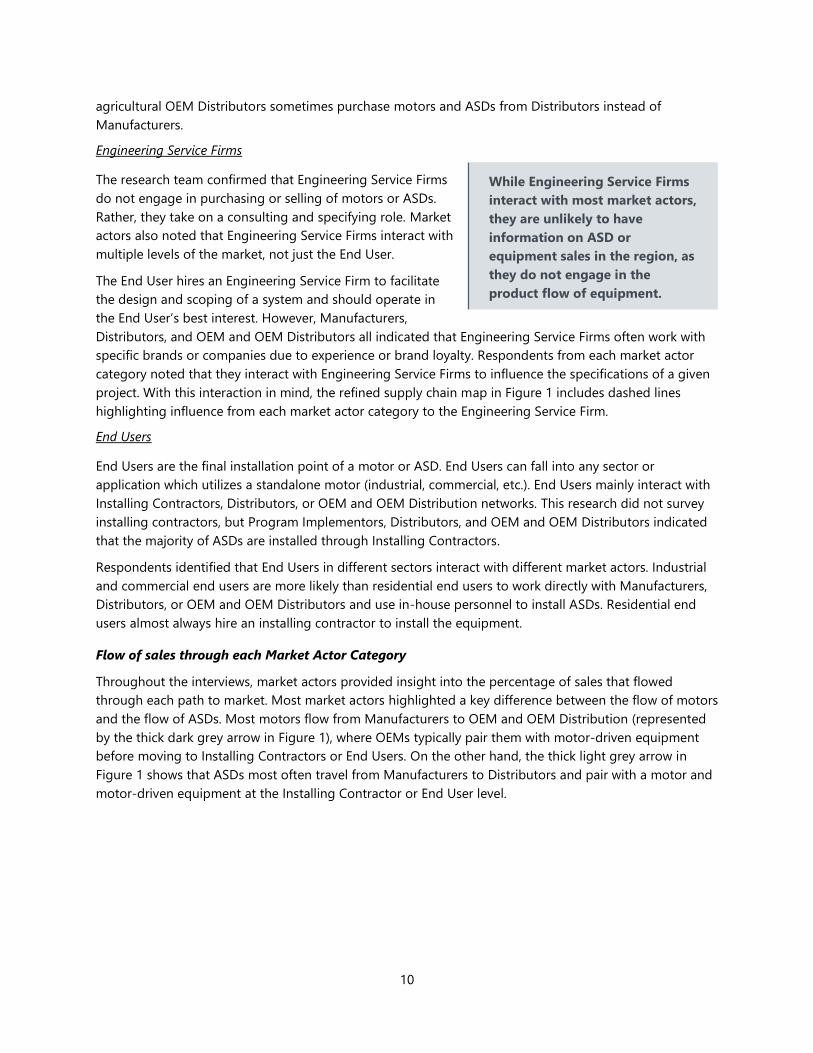
Engineering Service Firms
The research team confirmed that Engineering Service Firms
do not engage in purchasing or selling of motors or ASDs.
Rather, they take on a consulting and specifying role. Market
actors also noted that Engineering Service Firms interact with
multiple levels of the market, not just the End User.
The End User hires an Engineering Service Firm to facilitate
the design and scoping of a system and should operate in
the End User’s best interest. However, Manufacturers,
Distributors, and OEM and OEM Distributors all indicated that Engineering Service Firms often work with
specific brands or companies due to experience or brand loyalty. Respondents from each market actor
category noted that they interact with Engineering Service Firms to influence the specifications of a given
project. With this interaction in mind, the refined supply chain map in Figure 1 includes dashed lines
highlighting influence from each market actor category to the Engineering Service Firm.
End Users
End Users are the final installation point of a motor or ASD. End Users can fall into any sector or
application which utilizes a standalone motor (industrial, commercial, etc.). End Users mainly interact with
Installing Contractors, Distributors, or OEM and OEM Distribution networks. This research did not survey
installing contractors, but Program Implementors, Distributors, and OEM and OEM Distributors indicated
that the majority of ASDs are installed through Installing Contractors.
Respondents identified that End Users in different sectors interact with different market actors. Industrial
and commercial end users are more likely than residential end users to work directly with Manufacturers,
Distributors, or OEM and OEM Distributors and use in-house personnel to install ASDs. Residential end
users almost always hire an installing contractor to install the equipment.
Flow of sales through each Market Actor Category
Throughout the interviews, market actors provided insight into the percentage of sales that flowed
through each path to market. Most market actors highlighted a key difference between the flow of motors
and the flow of ASDs. Most motors flow from Manufacturers to OEM and OEM Distribution (represented
by the thick dark grey arrow in Figure 1), where OEMs typically pair them with motor-driven equipment
before moving to Installing Contractors or End Users. On the other hand, the thick light grey arrow in
Figure 1 shows that ASDs most often travel from Manufacturers to Distributors and pair with a motor and
motor-driven equipment at the Installing Contractor or End User level.
While Engineering Service Firms
interact with most market actors,
they are unlikely to have
information on ASD or
equipment sales in the region, as
they do not engage in the
product flow of equipment.
11
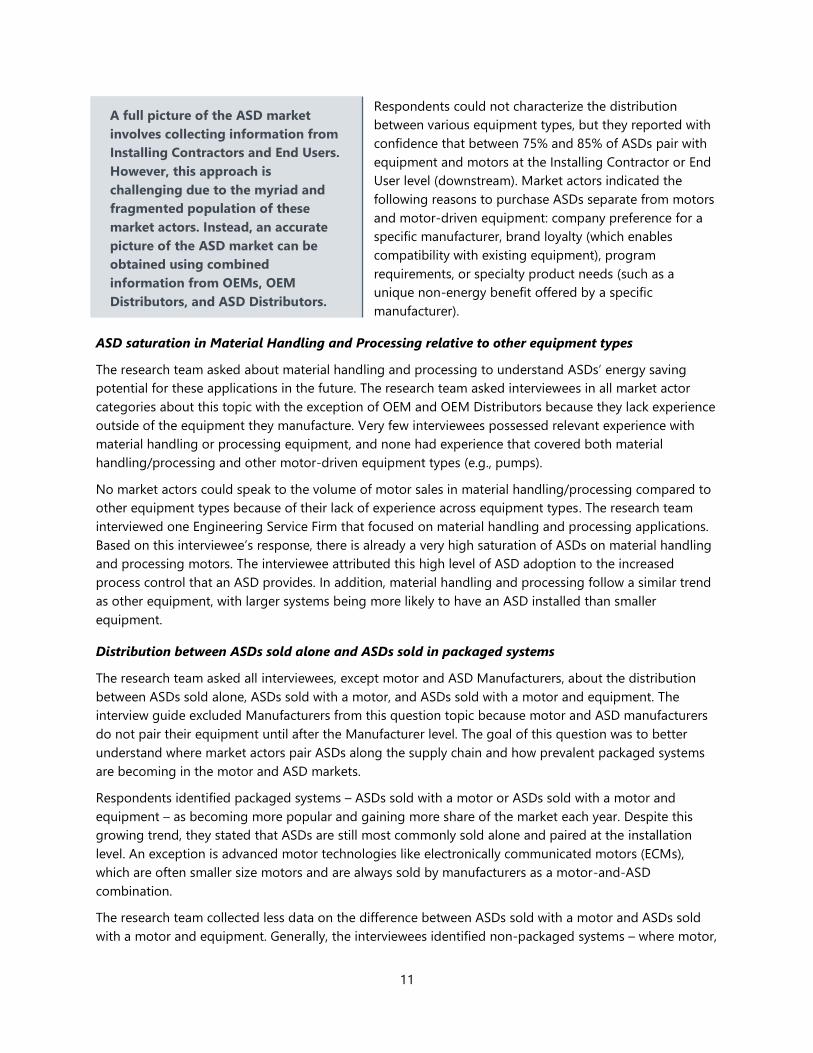
Respondents could not characterize the distribution
between various equipment types, but they reported with
confidence that between 75% and 85% of ASDs pair with
equipment and motors at the Installing Contractor or End
User level (downstream). Market actors indicated the
following reasons to purchase ASDs separate from motors
and motor-driven equipment: company preference for a
specific manufacturer, brand loyalty (which enables
compatibility with existing equipment), program
requirements, or specialty product needs (such as a
unique non-energy benefit offered by a specific
manufacturer).
ASD saturation in Material Handling and Processing relative to other equipment types
The research team asked about material handling and processing to understand ASDs’ energy saving
potential for these applications in the future. The research team asked interviewees in all market actor
categories about this topic with the exception of OEM and OEM Distributors because they lack experience
outside of the equipment they manufacture. Very few interviewees possessed relevant experience with
material handling or processing equipment, and none had experience that covered both material
handling/processing and other motor-driven equipment types (e.g., pumps).
No market actors could speak to the volume of motor sales in material handling/processing compared to
other equipment types because of their lack of experience across equipment types. The research team
interviewed one Engineering Service Firm that focused on material handling and processing applications.
Based on this interviewee’s response, there is already a very high saturation of ASDs on material handling
and processing motors. The interviewee attributed this high level of ASD adoption to the increased
process control that an ASD provides. In addition, material handling and processing follow a similar trend
as other equipment, with larger systems being more likely to have an ASD installed than smaller
equipment.
Distribution between ASDs sold alone and ASDs sold in packaged systems
The research team asked all interviewees, except motor and ASD Manufacturers, about the distribution
between ASDs sold alone, ASDs sold with a motor, and ASDs sold with a motor and equipment. The
interview guide excluded Manufacturers from this question topic because motor and ASD manufacturers
do not pair their equipment until after the Manufacturer level. The goal of this question was to better
understand where market actors pair ASDs along the supply chain and how prevalent packaged systems
are becoming in the motor and ASD markets.
Respondents identified packaged systems – ASDs sold with a motor or ASDs sold with a motor and
equipment – as becoming more popular and gaining more share of the market each year. Despite this
growing trend, they stated that ASDs are still most commonly sold alone and paired at the installation
level. An exception is advanced motor technologies like electronically communicated motors (ECMs),
which are often smaller size motors and are always sold by manufacturers as a motor-and-ASD
combination.
The research team collected less data on the difference between ASDs sold with a motor and ASDs sold
with a motor and equipment. Generally, the interviewees identified non-packaged systems – where motor,
A full picture of the ASD market
involves collecting information from
Installing Contractors and End Users.
However, this approach is
challenging due to the myriad and
fragmented population of these
market actors. Instead, an accurate
picture of the ASD market can be
obtained using combined
information from OEMs, OEM
Distributors, and ASD Distributors.
12
ASD, and motor-driven equipment were purchased “a la carte” – as more prevalent than packaged
systems.
The research team asked market actors about the prevalence of four different ASD installation methods:
Non-Packaged ASDs
Retrofit ASDs: ASDs installed on equipment after the equipment is installed.
Installed with equipment ASDs: ASDs purchased separately but installed at the same time as the
equipment.
Packaged ASDs
Integrated ASDs: a motor and a drive integrated into a “packaged” unit with the equipment.
Advanced motor technologies: motor technologies that cannot operate (at constant speed or
varying speeds) without electronic controls. Manufacturers package these motors with controls,
so the motors are considered inherently variable speed.
Most interviewees indicated that non-packaged ASDs (retrofitted or installed with equipment ASDs) are
the most common installation methods. Those market actors having experience with integrated ASDs and
advanced motor technology noted the risk of more significant maintenance and repair costs for
integrated equipment but stressed that these technologies are becoming more and more common each
year. Respondents could not provide an estimate of the rate at which the region is adopting integrated
ASDs and advanced motors.
Advanced Motor Technologies
Within the advanced motor category, market actors provided insights on three specific technologies in
the market: ECMs, synchronous reluctance motors (SRMs), and permanent magnet motors (PMs). Most
notably, market actors stated that ECM technology stood out as the only advanced motor technology that
has gained any substantial traction in the market, taking hold in the commercial HVAC fans market. The
interviewees identified ECMs are very popular among fans and circulators under ~5 horsepower (HP).
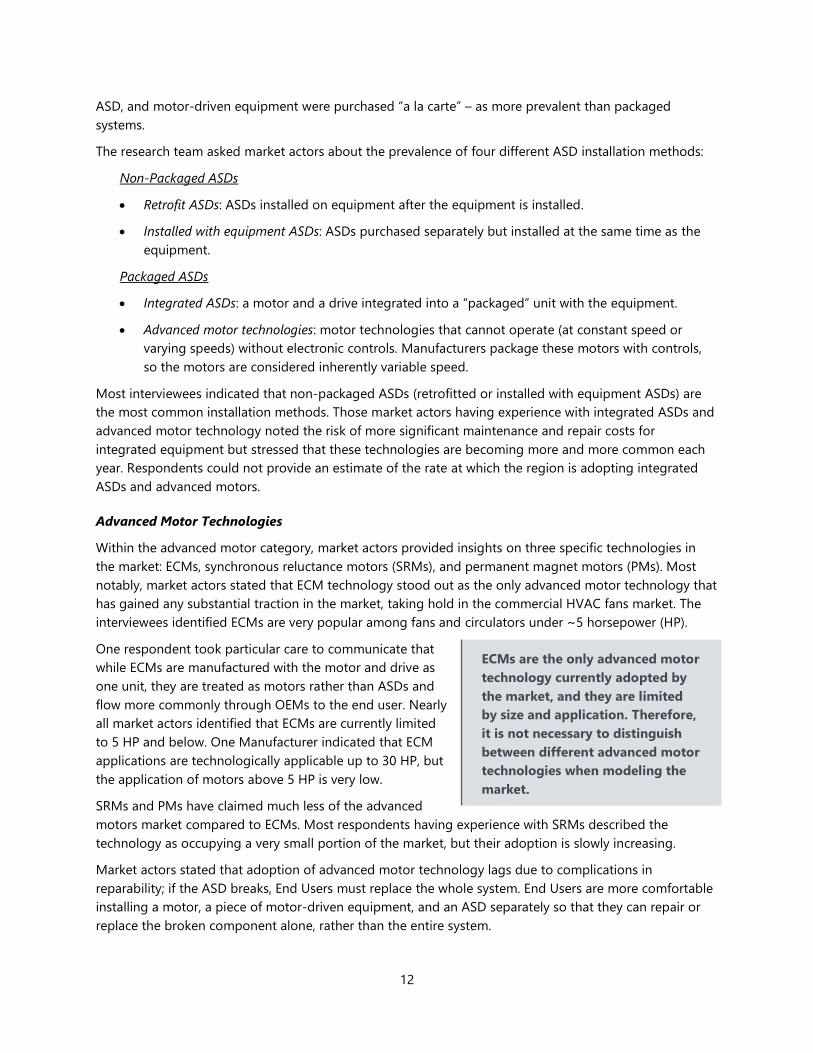
One respondent took particular care to communicate that
while ECMs are manufactured with the motor and drive as
one unit, they are treated as motors rather than ASDs and
flow more commonly through OEMs to the end user. Nearly
all market actors identified that ECMs are currently limited
to 5 HP and below. One Manufacturer indicated that ECM
applications are technologically applicable up to 30 HP, but
the application of motors above 5 HP is very low.
SRMs and PMs have claimed much less of the advanced
motors market compared to ECMs. Most respondents having experience with SRMs described the
technology as occupying a very small portion of the market, but their adoption is slowly increasing.
Market actors stated that adoption of advanced motor technology lags due to complications in
reparability; if the ASD breaks, End Users must replace the whole system. End Users are more comfortable
installing a motor, a piece of motor-driven equipment, and an ASD separately so that they can repair or
replace the broken component alone, rather than the entire system.
ECMs are the only advanced motor
technology currently adopted by
the market, and they are limited
by size and application. Therefore,
it is not necessary to distinguish
between different advanced motor
technologies when modeling the
market.
13
ASD Market Changes over Time
ASD stock saturation rates over time
The research team asked all market actors how the adoption of ASDs has changed over time. Specifically,
they asked market actors to describe how the saturation of ASDs has changed since the 2000 Motor
System Market Assessment and particularly in the past five to six years, and to estimate the saturation of
ASDs in the Pacific Northwest in 2020.
Trends in ASD adoption since 2000
Over 90% of respondents across market sectors described ASD adoption as either increasing steadily,
increasing exponentially, or broadly increasing over the past 20 years. Respondents are confident that
ASD technology has significant momentum for continued mainstream market penetration.
Change in ASD adoption over the past five to six years
Over 75% of respondents reported regional ASD adoption rates to
be significantly increasing year over year, including over the past
five to six years. Most market actors predicted adoption will
continue to accelerate over the next five to six years as well. The
five interviewees who did not mention significant increase claimed
that ASD adoption has plateaued in recent years. The research team
reviewed the five responses and identified no trend in the
categories of market actors providing this response, nor any
correlation with the market actors’ estimate of ASD saturation. No
respondents said that ASD adoption has decreased over the past
five to six years.
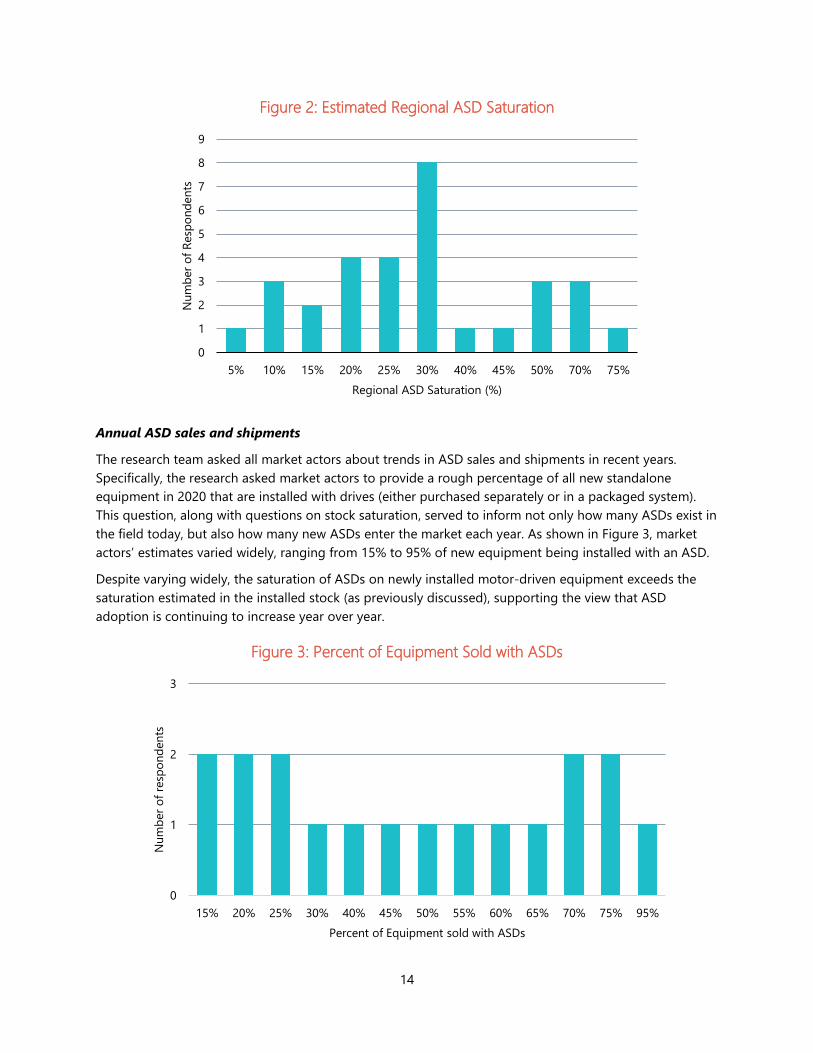
Current Saturation of ASDs in the Pacific Northwest
When asked about the saturation of ASDs on standalone motors in the region in 2020, responses ranged
from 5% to 75% saturation, with over half of respondents indicating a total market saturation value of 20-
30% (more than twice the saturation described by DOE twenty years ago in 2000). While responses varied
greatly based on each interviewee’s experience, most agreed that ample room remains for more ASDs to
enter the market. Figure 2 shows the frequency of responses across different ASD saturation values.
The region can be
confident that ASD
adoption did not level out
or plateau at any point in
the past 20 years. ASD
adoption is still increasing
in the Pacific Northwest
and per the market actors,
it is not likely to stagnate
anytime soon.
14
Figure 2: Estimated Regional ASD Saturation
Annual ASD sales and shipments
The research team asked all market actors about trends in ASD sales and shipments in recent years.
Specifically, the research asked market actors to provide a rough percentage of all new standalone
equipment in 2020 that are installed with drives (either purchased separately or in a packaged system).
This question, along with questions on stock saturation, served to inform not only how many ASDs exist in
the field today, but also how many new ASDs enter the market each year. As shown in Figure 3, market
actors’ estimates varied widely, ranging from 15% to 95% of new equipment being installed with an ASD.
Despite varying widely, the saturation of ASDs on newly installed motor-driven equipment exceeds the
saturation estimated in the installed stock (as previously discussed), supporting the view that ASD
adoption is continuing to increase year over year.
Figure 3: Percent of Equipment Sold with ASDs
0
1
2
3
4
5
6
7
8
9
5% 10% 15% 20% 25% 30% 40% 45% 50% 70% 75%
Nu
mb
er
of
Resp
on
den
ts
Regional ASD Saturation (%)
0
1
2
3
15% 20% 25% 30% 40% 45% 50% 55% 60% 65% 70% 75% 95%
Nu
mb
er
of
resp
on
den
ts
Percent of Equipment sold with ASDs
15
The diversity of responses indicates the estimated percentage of motors sold or installed with ASDs
depends heavily on an individual’s experience in the market. One Program Implementer identified ASD
saturation in current sales to be 95%, the highest value of any respondent. This response may be more
reflective of the work performed by that specific market actor, who focuses on installing ASDs through
incentive programs. On the opposite side of the spectrum, two Manufacturers reported the lowest values
of new equipment installed with ASDs, at 15%. This response is also expected because Manufacturers
typically have less insight into the sale of ASDs paired with equipment at the End User level. Other than
the above observations, the range of responses does not differ distinctly by market actor category.
The research team was not able to identify differences in the sales saturation by equipment type (e.g.,
pumps and fans), but multiple market actors including Distributors, Engineering Service Firms, and
Program Implementers indicated that fans lead the field with respect to ASD adoption.
Differences in ASD saturation based on equipment and application
The research team investigated differences in ASD saturation in the installed stock between different
motor-driven equipment types and different equipment applications. These questions focused on OEM
and OEM Distributors, Engineering Service Firms, and Program Implementers because they work more
directly with motor-driven equipment.
Air Compressors
Respondents with air compressor experience expressed
confidence that air compressor manufacturers currently only
sell ASDs and air compressors as packaged units. The market
no longer facilitates retrofitting ASDs on air compressors. If a
customer with a constant speed air compressor decides to
upgrade to a variable speed air compressor, the customer
must replace the entire package (air compressor, motor, and
ASD). Because air compressors with ASDs are integrated
systems, air compressors have a higher saturation of advanced
motor technology (specifically SRMs) than other equipment
types.
Fans
All respondents who work with fan equipment testified to the ubiquity of ECMs for small fan applications,
primarily in the commercial and residential space. While currently limited to 30 HP, ECMs will compete
with traditional ASDs as the technology continues to develop. While industrial end users can adopt ECMs,
they usually use larger fans that cannot be served by ECM.
Interviewees also stated that energy code requires speed control in many commercial applications, driving
up the saturation of ASDs for fans.
Pumps
Like fans, pumps in commercial HVAC applications possess a high percentage of ASDs due to energy code
requirements in the region. One market actor stated that ASD distribution is starting to migrate towards
OEMs, saying that “every pump Manufacturer has a drive line now.”
The market for ASDs on air
compressors is less fractured
than other equipment because
all ASDs on air compressors
“sold with equipment” at the
OEM level. Sales data from air
compressor Manufacturers
would provide a complete
picture of the ASDs installed on
air compressors.
16
Other Equipment
Market actors provided little insight into equipment beyond pumps, fans, and air compressors. However,
pump manufacturers also manufacture circulators (or small HP dedicated purpose pumps) which are
different enough in design and application that End Users often consider them a separate equipment
type. OEMs that produce circulators indicated the adoption of ASDs for circulators is relatively new.
Circulators with ASDs must have ECM technology, and one OEM and OEM Distributor noted that
companies started selling circulators with ECMs as recently as 2010.
Differences in ASD saturation based on motor size
The research team aimed to gain a more robust understanding of different factors to consider when
modeling ASDs in the Pacific Northwest. As part of this effort, the research team asked each market actor
how ASD saturation differs by motor size. All respondents stated that the larger the motor the more likely
it will have an ASD. Respondents provided two reasons for this. First, the return on investment is much
greater for larger systems (higher absolute energy consumption equates to larger savings). Second,
inefficiencies or disruptions in service of a larger system result in a more significant impact on the system
than for smaller systems. Installing an ASD on larger systems not only reduces the energy input, but also
ensures that the system runs reliably and can effectively account for changes in load.
Factors impacting ASD adoption
A large portion of market actors stated that the evolution of federal and state codes and regulations has
driven the market towards ASD adoption. They emphasized that regardless of the benefits ASDs provide,
the most effective tool in driving market change over time has been regulatory bodies increasing their
requirements for ASDs.
Other than regulatory signals, the majority of those
interviewed across all market actor categories identified
energy savings as the main influencer for adopting an ASD.
However, responses showed that recent advances in
technology – like more reliable ASDs, better process control,
and the ability to control equipment through the industrial
internet of things (IIoT) – also promote continuous increases
in ASD adoption. While ASDs have provided similar energy
benefits since their advent, the ASDs sold today are more
reliable than their predecessors, and market actors are more
comfortable with the technology. The integration of
controls and monitoring into the equipment also provides
additional benefits to End Users that – along with decreases
in ASD cost – promote the adoption of ASDs on equipment
that previously could not be justified.
Regarding reliability, an end user’s personal experience with ASDs or the perception of their reliability
heavily impact their choice to adopt ASDs. Market actors indicated that negative perceptions of the ASD
market arose early in the technology’s development due to complicated, unreliable equipment and a few
prominent equipment failures. While End User perception tends to change slowly, ASD technology has
greatly improved its reliability and adoption rates have increased steadily. One respondent noted that
people now must justify why they do not put in an ASD, rather than justify why they do.
Non-energy benefits have a large
impact on adoption of ASDs,
increasing the value proposition
beyond the energy savings.
Manufacturers have started
building more functionality into
ASDs, increasing adoption in
markets that were previously
cost prohibitive. It could be
worthwhile to investigate the
differences in non-energy
benefits between retrofitted
ASDs and integrated systems.
17
Market actors identified comfort with the technology as a key factor in driving ASD adoption across the
region. Many respondents up and down the supply chain stated that an increase in education for all
market actors would increase the adoption of ASDs, but targeted training to Engineering Service Firms, or
the individuals who design and specify systems, would have the greatest impact on ASD adoption. In
addition to training Engineering Service Firms, respondents mentioned end user education as a top
priority for increasing ASD adoption. Respondents across market segments believe this education
initiative will push the ASD market forward and make End Users more comfortable spending the money to
purchase and operate an ASD.
Market Segmentation
Differences in motor and ASD stock characteristics across equipment types
The research team asked all market actors about the differences in motor and ASD stock characteristics
across equipment types. The objective of this prompt was to inform how motor and ASD efficiency and
type varied in the installed stock. Most respondents who commented on this question indicated that the
motor efficiency of current sales aligns with DOE’s energy conservation standard (which requires the
National Electrical Manufacturers Association’s “NEMA Premium” efficiency motors). This indicates that
motor efficiency of the stock is continuing to increase through the introduction of DOE-compliant motors.
It is uncommon for End Users to purchase more efficient motors where not required. Respondents also
indicated that ASDs do not possess different characteristics based on the equipment to which End Users
apply them (that is, ASDs installed on pumps have the same average efficiency and operating
characteristics as ASDs installed on fans).
Market actors stated that larger commercial air compressor systems are becoming obsolete. In the past,
large rotary air compressor systems in commercial buildings
served pneumatic control systems. Interviewees indicated that
digital control systems have become the standard for commercial
buildings due to the decreasing cost of electronics and the lower
operating cost compared to compressed air systems. Engineering
Service Firms indicated that new buildings no longer have
pneumatic control systems and compressed air systems in existing
buildings are most often replaced with digital control systems
when an air compressor reaches its end of useful life.
Geographic differences in motor and ASD stock characteristics
The research team asked each market actor about the geographic differences in motor and ASD adoption
and characteristics. This question aimed to identify specific differences between the Pacific Northwest and
other areas of the nation, as well as how the application of ASDs in urban areas compares to application
in rural parts of the region.
Urban vs. Rural ASD Adoption
Market actors with insight into the agricultural sector reported that adoption of ASDs in the agricultural
sector is high due to this sector’s emphasis on cost savings and reliability. Additionally, farmers with low
margin crops or larger irrigation systems adopt ASDs at even higher rates due to the paramount
importance of reliability in the system.
The dwindling application of
rotary air compressors in the
commercial market indicates
there is little potential to
achieve savings through the
installation of ASDs on
commercial air compressors.
18
A few market actors claimed that there was a difference in saturation between urban vs. rural applications,
but most respondents stated that the urban-rural distinction is of little importance to the topic of ASD
saturation.
Pacific Northwest vs. National Adoption of ASDs
Most respondents identified that ASD saturation varies based on geography. Some interviewees identified
the two main factors impacting the difference as 1) the cost of electricity and 2) the existence of utility
incentive programs. Areas with higher electricity costs will see higher adoption rates of ASDs due to
shorter payback periods. Utility incentives serve to decrease the initial cost of the ASD (decreasing the
payback period) as well as increase the knowledge of ASD benefits, driving adoption rates higher.
The consensus among respondents was that, regardless of urban vs. rural, the Pacific Northwest has a
higher saturation of ASDs than other regions in the United States. Market actors attributed this to more
stringent code requirements, a more environmentally minded populace, and the presence of successful
incentive programs. No respondents could speak to the differences in motor characteristics within the
region.
Installation Trends
Differences between retrofitted ASDs and ASDs installed with motor or equipment
Market actors did not know of any differences in the installation of retrofitted ASDs versus ASDs installed
with equipment. However, they noted that there remains a large opportunity to retrofit ASDs on
previously installed equipment. Smaller equipment has a higher saturation of integrated and advanced
motor technology, so retrofits have more opportunity on larger systems.
Applications where ASDs are applied in the Pacific Northwest
The research team asked OEM and OEM Distributors, Engineering Service Firms, and Program
Implementers to identify applications where ASDs are applied in the Pacific Northwest. The goal of this
question was to inform whether future research on ASDs should be disaggregated by any equipment
applications.
Table 4 shows the current disaggregation of equipment
applications. All market actors who responded to this
question indicated that ASDs are applied in the region to
each application listed in Table 4. Engineering Service Firms
and Program Implementers provided the most insight on this
topic because they interact most directly with ASDs in the
field. These respondents indicated that the two commercial
standalone fan applications (clean air ventilation and exhaust)
serve similar load profiles and operating hours (dependent upon building occupancy patterns) and could
be considered as one application.
Any research into fan operating
characteristics could collapse
commercial fan applications into
one category without losing
granularity of the operating
characteristics.
19
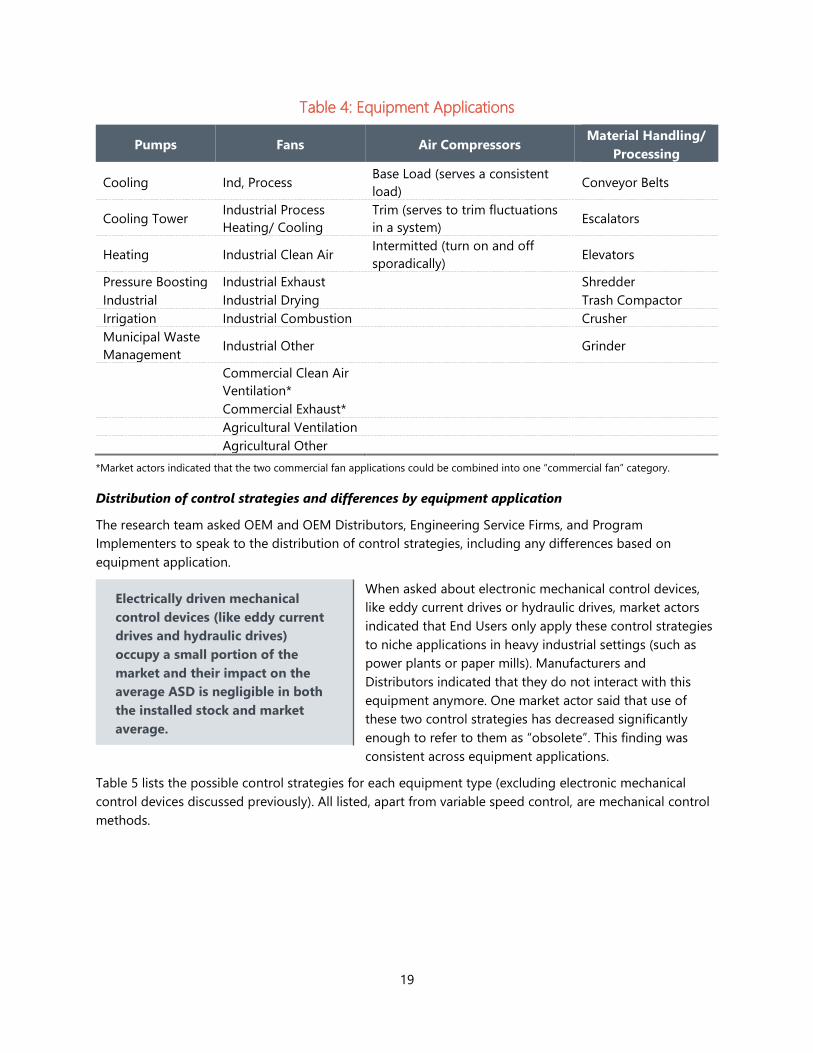
Table 4: Equipment Applications
Pumps Fans Air Compressors Material Handling/
Processing
Cooling Ind, Process Base Load (serves a consistent
load) Conveyor Belts
Cooling Tower Industrial Process
Heating/ Cooling
Trim (serves to trim fluctuations
in a system) Escalators
Heating Industrial Clean Air Intermitted (turn on and off
sporadically) Elevators
Pressure Boosting Industrial Exhaust Shredder
Industrial Industrial Drying Trash Compactor
Irrigation Industrial Combustion Crusher
Municipal Waste
Management Industrial Other Grinder
Commercial Clean Air
Ventilation*
Commercial Exhaust*
Agricultural Ventilation
Agricultural Other
*Market actors indicated that the two commercial fan applications could be combined into one “commercial fan” category.
Distribution of control strategies and differences by equipment application
The research team asked OEM and OEM Distributors, Engineering Service Firms, and Program
Implementers to speak to the distribution of control strategies, including any differences based on
equipment application.
When asked about electronic mechanical control devices,
like eddy current drives or hydraulic drives, market actors
indicated that End Users only apply these control strategies
to niche applications in heavy industrial settings (such as
power plants or paper mills). Manufacturers and
Distributors indicated that they do not interact with this
equipment anymore. One market actor said that use of
these two control strategies has decreased significantly
enough to refer to them as “obsolete”. This finding was
consistent across equipment applications.
Table 5 lists the possible control strategies for each equipment type (excluding electronic mechanical
control devices discussed previously). All listed, apart from variable speed control, are mechanical control
methods.
Electrically driven mechanical
control devices (like eddy current
drives and hydraulic drives)
occupy a small portion of the
market and their impact on the
average ASD is negligible in both
the installed stock and market
average.

20
Table 5: Control Strategies by Equipment Type
Equipment Control Strategies
Pumps No Control or Bypass (i.e., constant operation or Start/Stop)
Throttle
Variable Speed Control via ASDs
Fans
No Control or Bypass Dampers (i.e., constant operation or Start/Stop)
Discharge Dampers
Outlet Damper
Inlet Damper Box
Inlet Guide Vane
Inlet Vane Dampers
Variable Speed Control via ASDs
Air Compressors
No Control (i.e., constant operation or Start/Stop)
Load/Unload
Inlet Valve Modulation
Variable Displacement
Variable Speed Control via ASDs
Material Handling &
Material Processing
No Control (i.e., constant operation or Start/Stop)
Variable Speed Control via ASDs
Most market actors agreed that manufacturers still sell all control strategies listed in Table 5. For air
compressors, the installed stock and the market average include both mechanical speed control and
ASDs. However, for fans or pumps, End Users no longer install mechanical control strategies as the
primary speed control strategy. Mechanical control strategies persist to balance a system, but End Users
and Engineering Service Firms now favor ASDs for primary speed control for fans and pumps. For fans
specifically, End Users could install a fan system with both an ASD and a mechanical control device, but
would not control the system with the mechanical control device. Market actors having experience with
pumps did not speak to this trend for pumps.
Market actors also noted that End Users sometimes install ASDs on belt-driven equipment. While belt-
driven equipment usually achieve speed changes through sheaves, ASDs can be applied to systems that
require high torque (produced by higher motor speeds) and low flowrates (produced by lower equipment
speeds).
Characteristics of ASDs installed through utility programs
The research team asked all market actors about their interaction with utility programs to understand the
role of utility programs on ASD adoption currently and historically.
The only characteristic identified as potentially distinguishing ASDs installed through programs from
those installed outside of programs relates to controls commissioning. Interviewees indicated that some
programs require proper commissioning with certain market actors (like the Distributor) present at the
time of installation to confirm the end user installed it correctly. Typically, when someone purchases an
ASD through a program, the Engineering Service Firm will also be part of the commissioning process.
The perception of programs’ impact on ASD adoption differed distinctly based on market actor category.
Market actors further upstream, such as Manufacturers and Distributors, asserted that incentive programs
21
do not cover enough of the cost associated with acquiring an ASD: many utility programs account for the
cost of the ASD itself, but not the cost of ASD installation. Market actors identified the following barriers
to ASD program adoption: program applications are too complicated, too time-intensive, and broadly
inaccessible to a point of discouraging End Users from submitting a rebate application.
Operational Characteristics
Controls Commissioning
The research team asked all market actors to describe the
commissioning process of ASDs, including who is
responsible for commissioning and how often they
commission ASDs. The responses on this topic varied
widely, speaking to the greater unknowns around
commissioning of ASDs in the field.
Some Distributors, OEM Distributors and Engineering Service Firms reported that they commission the
systems they sold or specified and that 100% of systems receive proper commissioning. However, other
market actors indicated that as low as 20% of equipment achieves proper commissioning. Most
commonly, respondents estimated that proper commissioning occurs on 50% of systems. These diverging
perspectives surrounding proper commissioning supports more targeted research on the topic.
Market actors contended that recent and widespread reduction in employee training is another reason for
inconsistencies in commissioning. Interviewees indicated that some Distributors still provide adequate
training for their employees, but most companies have cut funds for employee training and
commissioning support in recent years. Though this indicates that Distributors were historically more
involved in commissioning, this does not necessarily mean that an End User’s employees are
commissioning systems themselves. Rather, in some cases, this suggests a trend toward outsourcing the
commissioning process to engineering service firms or dedicated commissioning contractors.
The responses to questions on commissioning indicated a lack of understanding about which market
actor is responsible for commissioning. Many respondents identified other parties as responsible for
commissioning. Very few respondents placed Distributors as responsible for commissioning systems, yet
one large distribution company said that they personally commission all their systems. Another
respondent cited some cases in which the customer must take the initiative to get their system
commissioned by trained professionals; sellers do not guarantee it upon purchase. Lastly, sometimes
customers will commission their system themselves with no outside help. These perspectives stood out to
the research team as unique yet valid anecdotal experience.
An aspect of commissioning all market actors agree on is that many or all interested parties must be
present at the time of commissioning to ensure the components are properly integrated. This often
includes the OEM Distributor, the Installing Contractor (including mechanical and electrical contracting),
and the End User. The End User must receive training on initial system operation as well as how to meet
adjusting needs over time. Many market actors noted that the commissioning process frequently happens
with only an Installing Contractor or a private commissioning agent to reduce cost. By limiting the
commissioning event to only two people present, the End User runs the risk of incomplete commissioning
or poor commissioning. This research did not investigate the rates of retro-commissioning for these
systems.
The region needs targeted research
on controls commissioning to
develop a more detailed
characterization of the impact
commissioning has on a system.
22
Differences in load profile between retrofitted ASDs and ASDs installed with equipment
The research team asked all market actors except Manufacturers to identify any differences in the load
profile between retrofitted ASDs and ASDs installed with equipment. Very few respondents had an answer
to this question, and those who did could not name any significant differences. The research indicates that
the operational characteristics of an ASD installed for retrofit and those for a new equipment are
indistinguishable.
Equipment oversizing
Previous studies have found evidence that End Users oversize equipment motors to compensate for
system fluctuations or potential miscalculations in the specifying process.8 The research team asked OEMs,
Engineering Service Firms, and Program Implementers whether they experienced the application of ASDs
for “trim” purposes and how often End Users install an ASD for the purpose of mitigating the effects of an
oversized system.
Most respondents confirmed there is a certain portion of ASDs
installed for the purpose of managing an oversized system. In this
case, the ASD uses its variable speed control to bring the speed of
the system down to its optimal operating point, then does not vary
over the course of operation. Over half of respondents reported
that about 15% of ASDs serve trim applications across motor-driven
equipment and applications.
Market actors also added that air compressor motors are not oversized. The systems themselves may be
oversized and “trimmed” to meet the load, but manufacturers match the motor size to meet the air
compressor load requirements exactly since they tend to package motor, ASD, and air compressor
together in one unit.
Load profile characteristics based on application, motor size, and control strategy
The research team asked OEMs, Engineering Service Firms, and Program Implementers about differences
in load profile based on factors such as application, motor size, and control strategy. Most market actors
responded in broad terms, with a focus on how ASDs serve different loads – trim loads (“right sizing”) vs.
variable loads (“load matching”).
As stated in the previous section, about 15% of ASDs enable systems to operate at a constant (reduced)
speed, including the use of ASDs as soft starters, which control the acceleration of a motor on start-up,
but do not vary the motor speed during operation. Market actors claimed that they see trim-use more
commonly on smaller systems, while larger systems tend to use VFDs for load matching purposes.
Because larger systems are more complex and expensive, End Users dedicate more time and resources to
making the system as efficient as possible. Load requirements (the demand of the system served by the
motor and ASD) do not seem to drive this difference. The prevalence of load-matching applications on
larger systems relative to smaller systems is driven more by the payback associated with correctly
commissioning the system (larger systems have a faster payback period).
8“Extended Motor Products Savings Validation Research on Clean Water Pumps and Circulators”, available at
https://neea.org/resources/extended-motor-products-savings-validation-research-on-clean-water-pumps-and-circulators, accessed
3/8/2021
Any model calculating
energy consumption of
motor driven equipment
must account for a portion
of ASDs serving to trim
equipment.

23
Several respondents also noted that an ASD is not always the proper solution for a system. They did not
provide an estimate of the number of systems nor the prevalence of this case but stated that when a
system operates nearly always at 100% capacity, the energy consumed to keep the ASD operating may
exceed the energy saved by varying the speed of the system. Therefore, for systems operating nearly
always at 100% capacity, it is more energy efficient to not install an ASD.
24
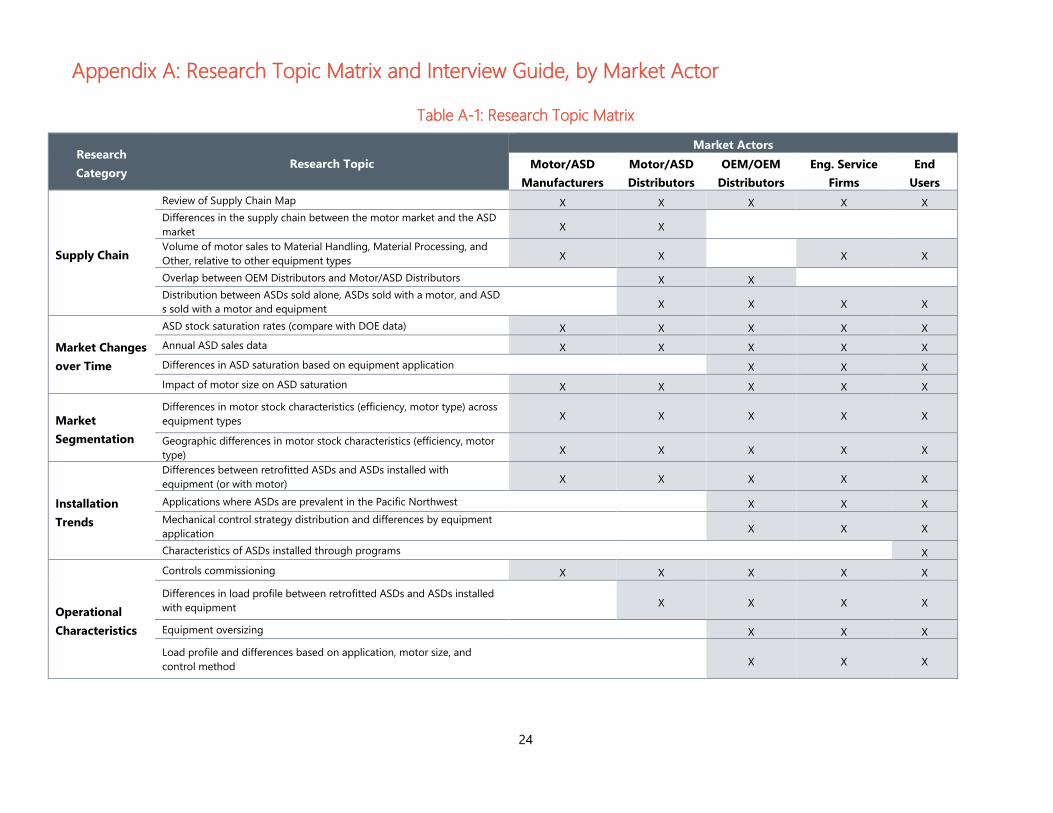
Appendix A: Research Topic Matrix and Interview Guide, by Market Actor
Table A-1: Research Topic Matrix
Research
Category Research Topic
Market Actors
Motor/ASD
Manufacturers
Motor/ASD
Distributors
OEM/OEM
Distributors
Eng. Service
Firms
End
Users
Supply Chain
Review of Supply Chain Map X X X X X
Differences in the supply chain between the motor market and the ASD
market X X
Volume of motor sales to Material Handling, Material Processing, and
Other, relative to other equipment types X X
X X
Overlap between OEM Distributors and Motor/ASD Distributors X X
Distribution between ASDs sold alone, ASDs sold with a motor, and ASD
s sold with a motor and equipment
X X X X
Market Changes
over Time
ASD stock saturation rates (compare with DOE data) X X X X X
Annual ASD sales data X X X X X
Differences in ASD saturation based on equipment application X X X
Impact of motor size on ASD saturation X X X X X
Market
Segmentation
Differences in motor stock characteristics (efficiency, motor type) across
equipment types X X X X X
Geographic differences in motor stock characteristics (efficiency, motor
type) X X X X X
Installation
Trends
Differences between retrofitted ASDs and ASDs installed with
equipment (or with motor) X X X X X
Applications where ASDs are prevalent in the Pacific Northwest X X X
Mechanical control strategy distribution and differences by equipment
application
X X X
Characteristics of ASDs installed through programs X
Operational
Characteristics
Controls commissioning X X X X X
Differences in load profile between retrofitted ASDs and ASDs installed
with equipment
X X X X
Equipment oversizing X X X
Load profile and differences based on application, motor size, and
control method
X X X
25
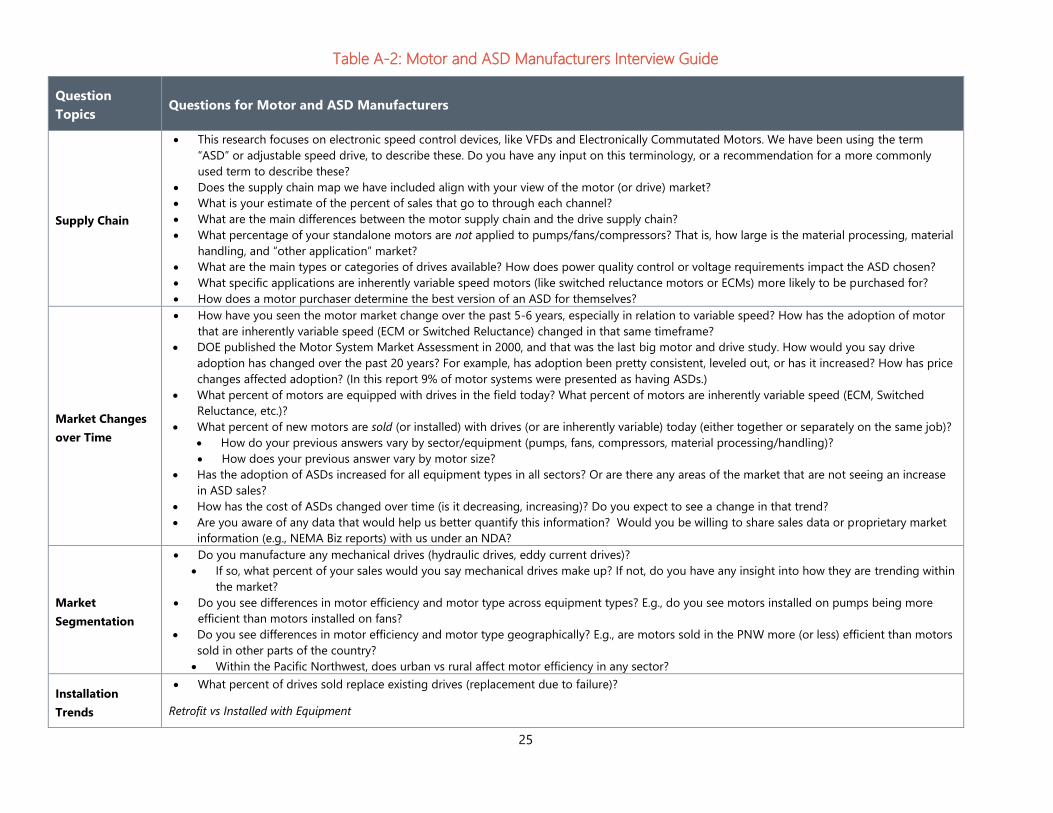
Table A-2: Motor and ASD Manufacturers Interview Guide
Question
Topics Questions for Motor and ASD Manufacturers
Supply Chain
This research focuses on electronic speed control devices, like VFDs and Electronically Commutated Motors. We have been using the term
“ASD” or adjustable speed drive, to describe these. Do you have any input on this terminology, or a recommendation for a more commonly
used term to describe these?
Does the supply chain map we have included align with your view of the motor (or drive) market?
What is your estimate of the percent of sales that go to through each channel?
What are the main differences between the motor supply chain and the drive supply chain?
What percentage of your standalone motors are not applied to pumps/fans/compressors? That is, how large is the material processing, material
handling, and “other application” market?
What are the main types or categories of drives available? How does power quality control or voltage requirements impact the ASD chosen?
What specific applications are inherently variable speed motors (like switched reluctance motors or ECMs) more likely to be purchased for?
How does a motor purchaser determine the best version of an ASD for themselves?
Market Changes
over Time
How have you seen the motor market change over the past 5-6 years, especially in relation to variable speed? How has the adoption of motor
that are inherently variable speed (ECM or Switched Reluctance) changed in that same timeframe?
DOE published the Motor System Market Assessment in 2000, and that was the last big motor and drive study. How would you say drive
adoption has changed over the past 20 years? For example, has adoption been pretty consistent, leveled out, or has it increased? How has price
changes affected adoption? (In this report 9% of motor systems were presented as having ASDs.)
What percent of motors are equipped with drives in the field today? What percent of motors are inherently variable speed (ECM, Switched
Reluctance, etc.)?
What percent of new motors are sold (or installed) with drives (or are inherently variable) today (either together or separately on the same job)?
How do your previous answers vary by sector/equipment (pumps, fans, compressors, material processing/handling)?
How does your previous answer vary by motor size?
Has the adoption of ASDs increased for all equipment types in all sectors? Or are there any areas of the market that are not seeing an increase
in ASD sales?
How has the cost of ASDs changed over time (is it decreasing, increasing)? Do you expect to see a change in that trend?
Are you aware of any data that would help us better quantify this information? Would you be willing to share sales data or proprietary market
information (e.g., NEMA Biz reports) with us under an NDA?
Market
Segmentation
Do you manufacture any mechanical drives (hydraulic drives, eddy current drives)?
If so, what percent of your sales would you say mechanical drives make up? If not, do you have any insight into how they are trending within
the market?
Do you see differences in motor efficiency and motor type across equipment types? E.g., do you see motors installed on pumps being more
efficient than motors installed on fans?
Do you see differences in motor efficiency and motor type geographically? E.g., are motors sold in the PNW more (or less) efficient than motors
sold in other parts of the country?
Within the Pacific Northwest, does urban vs rural affect motor efficiency in any sector?
Installation
Trends
What percent of drives sold replace existing drives (replacement due to failure)?
Retrofit vs Installed with Equipment
26
Question
Topics Questions for Motor and ASD Manufacturers
In your experience, do most ASDs get installed on existing motors or installed when the motor is installed? What percent is that breakdown?
How has this breakdown changed over time? For example, has the fact that motors have been being retrofitted with drives for the past ~20
years caused a slow-down in retrofits, or pushed people to think a system needs to have a drive when installed?
Is there a difference in the types of equipment/loads that drives are retrofitted on, as opposed to installed with equipment?
Operational
Characteristics
Does your company offer training/commissioning support on your products? If so, how often do customers make use of them?
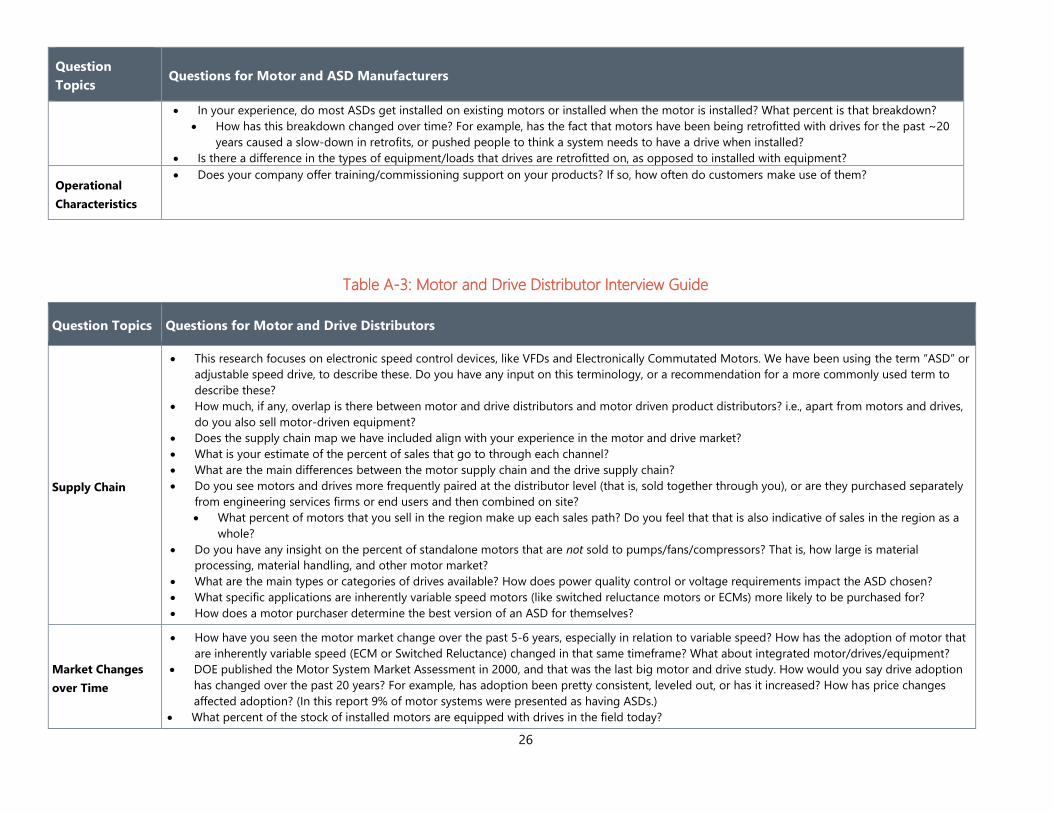
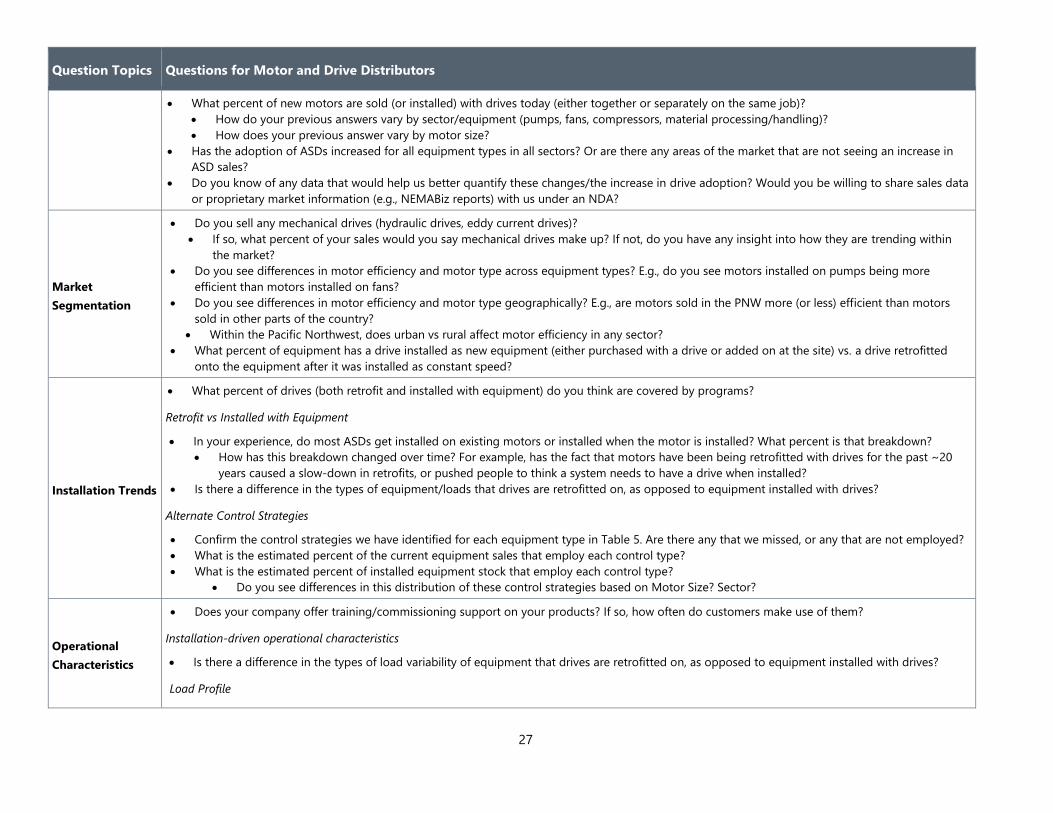
Table A-3: Motor and Drive Distributor Interview Guide
Question Topics Questions for Motor and Drive Distributors
Supply Chain
This research focuses on electronic speed control devices, like VFDs and Electronically Commutated Motors. We have been using the term “ASD” or
adjustable speed drive, to describe these. Do you have any input on this terminology, or a recommendation for a more commonly used term to
describe these?
How much, if any, overlap is there between motor and drive distributors and motor driven product distributors? i.e., apart from motors and drives,
do you also sell motor-driven equipment?
Does the supply chain map we have included align with your experience in the motor and drive market?
What is your estimate of the percent of sales that go to through each channel?
What are the main differences between the motor supply chain and the drive supply chain?
Do you see motors and drives more frequently paired at the distributor level (that is, sold together through you), or are they purchased separately
from engineering services firms or end users and then combined on site?
What percent of motors that you sell in the region make up each sales path? Do you feel that that is also indicative of sales in the region as a
whole?
Do you have any insight on the percent of standalone motors that are not sold to pumps/fans/compressors? That is, how large is material
processing, material handling, and other motor market?
What are the main types or categories of drives available? How does power quality control or voltage requirements impact the ASD chosen?
What specific applications are inherently variable speed motors (like switched reluctance motors or ECMs) more likely to be purchased for?
How does a motor purchaser determine the best version of an ASD for themselves?
Market Changes
over Time
How have you seen the motor market change over the past 5-6 years, especially in relation to variable speed? How has the adoption of motor that
are inherently variable speed (ECM or Switched Reluctance) changed in that same timeframe? What about integrated motor/drives/equipment?
DOE published the Motor System Market Assessment in 2000, and that was the last big motor and drive study. How would you say drive adoption
has changed over the past 20 years? For example, has adoption been pretty consistent, leveled out, or has it increased? How has price changes
affected adoption? (In this report 9% of motor systems were presented as having ASDs.)
What percent of the stock of installed motors are equipped with drives in the field today?
27
Question Topics Questions for Motor and Drive Distributors
What percent of new motors are sold (or installed) with drives today (either together or separately on the same job)?
How do your previous answers vary by sector/equipment (pumps, fans, compressors, material processing/handling)?
How does your previous answer vary by motor size?
Has the adoption of ASDs increased for all equipment types in all sectors? Or are there any areas of the market that are not seeing an increase in
ASD sales?
Do you know of any data that would help us better quantify these changes/the increase in drive adoption? Would you be willing to share sales data
or proprietary market information (e.g., NEMABiz reports) with us under an NDA?
Market
Segmentation
Do you sell any mechanical drives (hydraulic drives, eddy current drives)?
If so, what percent of your sales would you say mechanical drives make up? If not, do you have any insight into how they are trending within
the market?
Do you see differences in motor efficiency and motor type across equipment types? E.g., do you see motors installed on pumps being more
efficient than motors installed on fans?
Do you see differences in motor efficiency and motor type geographically? E.g., are motors sold in the PNW more (or less) efficient than motors
sold in other parts of the country?
Within the Pacific Northwest, does urban vs rural affect motor efficiency in any sector?
What percent of equipment has a drive installed as new equipment (either purchased with a drive or added on at the site) vs. a drive retrofitted
onto the equipment after it was installed as constant speed?
Installation Trends
What percent of drives (both retrofit and installed with equipment) do you think are covered by programs?
Retrofit vs Installed with Equipment
In your experience, do most ASDs get installed on existing motors or installed when the motor is installed? What percent is that breakdown?
How has this breakdown changed over time? For example, has the fact that motors have been being retrofitted with drives for the past ~20
years caused a slow-down in retrofits, or pushed people to think a system needs to have a drive when installed?
Is there a difference in the types of equipment/loads that drives are retrofitted on, as opposed to equipment installed with drives?
Alternate Control Strategies
Confirm the control strategies we have identified for each equipment type in Table 5. Are there any that we missed, or any that are not employed?
What is the estimated percent of the current equipment sales that employ each control type?
What is the estimated percent of installed equipment stock that employ each control type?
Do you see differences in this distribution of these control strategies based on Motor Size? Sector?
Operational
Characteristics
Does your company offer training/commissioning support on your products? If so, how often do customers make use of them?
Installation-driven operational characteristics
Is there a difference in the types of load variability of equipment that drives are retrofitted on, as opposed to equipment installed with drives?
Load Profile

28
Question Topics Questions for Motor and Drive Distributors
In the field, do you see ASDs installed only on variable loads, or are they installed on systems regardless of actual load variability? What percent of
drives are installed on variable loads, moderately variable loads, and constant loads?
Motor Oversizing
How does the oversizing of air compressors compare to pumps or fans (20%)?
Controls commissioning
When a drive is installed, how often is it commissioned and operating in its more energy efficient mode? How often are drives installed and not
operated efficiently?
What control strategies to drives typically replace? How does this vary by equipment type?
Table A-4: OEM and OEM Distributor Interview Guide
Question Topics Questions for OEM and OEM Distributors
Supply Chain
This research focuses on electronic speed control devices, like VFDs and Electronically Commutated Motors. We have been using the term “ASD”
or adjustable speed drive, to describe these. Do you have any input on this terminology, or a recommendation for a more commonly used term to
describe these?
Does the supply chain map we have included align with your view of the motor and drive market?
Do motor distributors and equipment distributors overlap, or are they separate market actors?
What is your estimate of the percent of sales that go to through each channel?
What percentage of the equipment you sell has a drive included at point of sale? What percent of your newly sold equipment is installed with
drives in the field? Would you say that is representative of this equipment market, or your organizations sales specifically?
What are the main types or categories of drives available for your equipment? Are there certain inherently variable speed motors (like switched
reluctance motors or ECMs) that are more likely to be purchased for this equipment?
How does a motor purchaser determine the best version of an ASD for themselves?
Market Changes
over Time
How has the adoption of ASDs changed over the past 5-6 years for {insert equipment type}? What’s your estimated change in percent of (insert
equipment type} equipped with a drive over this timeframe?
DOE published the Motor System Market Assessment in 2000, and that was the last big motor and drive study. Would you say drive adoption for
[your equipment type] has been consistent over the past 20 years, has it leveled out, or has it increased?
How have you seen the equipment market change over time, especially in relation to variable speed adoption? This could be the adoption of
external drives, or the purchase of motor technology like ECMs that is inherently variable speed.
Are there certain sectors that you are not seeing ASDs being adopted?
Are there any sectors/applications in which ASD adoption has plateaued?
What percent of [your equipment type] are equipped with drives in the field today?
What percent of [your equipment type] are sold with drives today (either together or separately on the same job)?

29
Question Topics Questions for OEM and OEM Distributors
How does your previous answers vary by sector? (Commercial, Industrial)
Does your previous answer vary by application? (within the equipment type) If so, which applications?
Does equipment size impact your previous answer? (motor HP)
Do you know of any data that would help us characterize the change in ASD saturation over time? Or help us characterize the differences based
on application? Would you be willing to share sales data or proprietary market information with us under an NDA?
Market
Segmentation
Do you see differences in motor efficiency and motor type across applications?
Do you see differences in motor efficiency and motor type geographically? E.g., are motors sold in the PNW more (or less) efficient than motors
sold in other parts of the country?
Within the Pacific Northwest, does urban vs rural affect motor efficiency in any sector?
What percent of equipment has a drive installed as new equipment (either purchased with a drive or added on at the site) vs a drive retrofitted
onto the equipment after it was installed as constant speed?
Installation Trends
Retrofit vs Installed with Equipment
In your experience, do most ASDs get installed on existing motors, or installed when the motor is installed? What percent is that breakdown?
How has this breakdown changed over time? For example, has the fact that motors have been being retrofitted with drives for the past ~20
years caused a slow-down in retrofits, or pushed people to think a system needs to have a drive when installed?
Is there a difference in the types of equipment/loads that drives are retrofitted on, as opposed to equipment installed with drives?
Alternate Control Strategies
Can you confirm the control strategies we have identified for each equipment type in Table 5? Are there any that we missed, or any that are not
employed?
What is the estimated percent of current sales that employ each control type?
What is the estimated percent of installed stock that employ each control type?
Do you see differences in the distribution of these control strategies based on Motor Size? Sector?
Applications
Of the applications listed in Table 4, are there any that aren’t present or are very rare in the Pacific Northwest? Which are the most prevalent?
Do you see differences in control installation characteristics on an application level, or are they consistent up to an equipment level (it can be
different for different equipment types)?
Operational
Characteristics
Installation-driven operational characteristics
Is there a difference in the types of load variability of equipment that drives are retrofitted on, as opposed to equipment installed with drives?
Load Profile
What percent of the systems operates with a relatively constant load profile, a variable load profile, and a moderately variable load profile? E.g., Is
there more or less variability in fans than pumps?
Is there a difference between load profiles for equipment with different size motors (e.g., usually see larger HP fans with more constant or
more variable loads)?
Do you see a dramatic difference in the load profile for equipment falling into the different applications listed in Table 4?
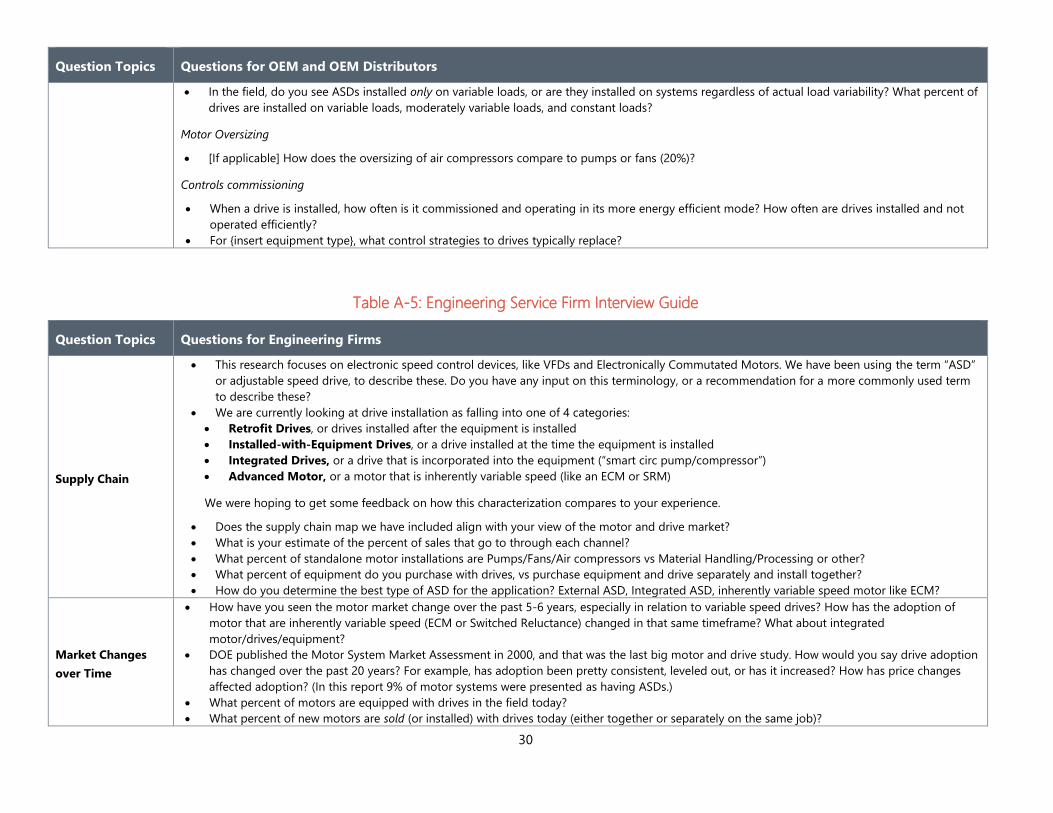
30
Question Topics Questions for OEM and OEM Distributors
In the field, do you see ASDs installed only on variable loads, or are they installed on systems regardless of actual load variability? What percent of
drives are installed on variable loads, moderately variable loads, and constant loads?
Motor Oversizing
[If applicable] How does the oversizing of air compressors compare to pumps or fans (20%)?
Controls commissioning
When a drive is installed, how often is it commissioned and operating in its more energy efficient mode? How often are drives installed and not
operated efficiently?
For {insert equipment type}, what control strategies to drives typically replace?
Table A-5: Engineering Service Firm Interview Guide
Question Topics Questions for Engineering Firms
Supply Chain
This research focuses on electronic speed control devices, like VFDs and Electronically Commutated Motors. We have been using the term “ASD”
or adjustable speed drive, to describe these. Do you have any input on this terminology, or a recommendation for a more commonly used term
to describe these?
We are currently looking at drive installation as falling into one of 4 categories:
Retrofit Drives, or drives installed after the equipment is installed
Installed-with-Equipment Drives, or a drive installed at the time the equipment is installed
Integrated Drives, or a drive that is incorporated into the equipment (“smart circ pump/compressor”)
Advanced Motor, or a motor that is inherently variable speed (like an ECM or SRM)
We were hoping to get some feedback on how this characterization compares to your experience.
Does the supply chain map we have included align with your view of the motor and drive market?
What is your estimate of the percent of sales that go to through each channel?
What percent of standalone motor installations are Pumps/Fans/Air compressors vs Material Handling/Processing or other?
What percent of equipment do you purchase with drives, vs purchase equipment and drive separately and install together?
How do you determine the best type of ASD for the application? External ASD, Integrated ASD, inherently variable speed motor like ECM?
Market Changes
over Time
How have you seen the motor market change over the past 5-6 years, especially in relation to variable speed drives? How has the adoption of
motor that are inherently variable speed (ECM or Switched Reluctance) changed in that same timeframe? What about integrated
motor/drives/equipment?
DOE published the Motor System Market Assessment in 2000, and that was the last big motor and drive study. How would you say drive adoption
has changed over the past 20 years? For example, has adoption been pretty consistent, leveled out, or has it increased? How has price changes
affected adoption? (In this report 9% of motor systems were presented as having ASDs.)
What percent of motors are equipped with drives in the field today?
What percent of new motors are sold (or installed) with drives today (either together or separately on the same job)?
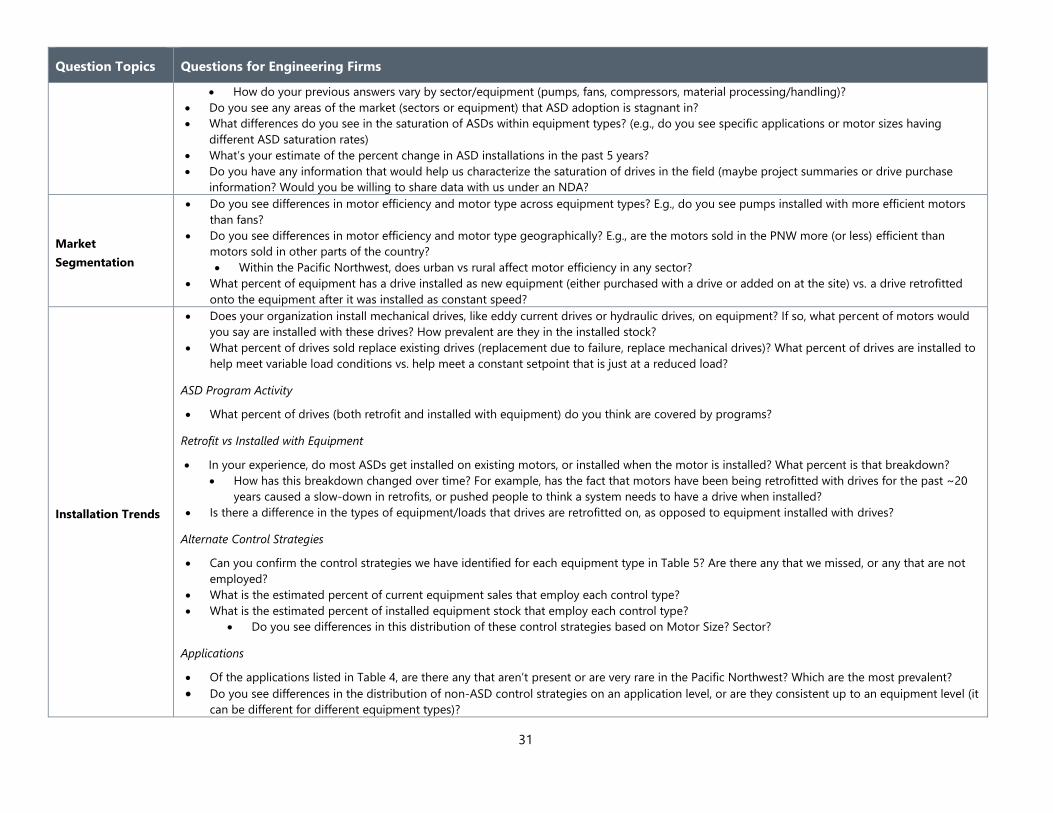
31
Question Topics Questions for Engineering Firms
How do your previous answers vary by sector/equipment (pumps, fans, compressors, material processing/handling)?
Do you see any areas of the market (sectors or equipment) that ASD adoption is stagnant in?
What differences do you see in the saturation of ASDs within equipment types? (e.g., do you see specific applications or motor sizes having
different ASD saturation rates)
What’s your estimate of the percent change in ASD installations in the past 5 years?
Do you have any information that would help us characterize the saturation of drives in the field (maybe project summaries or drive purchase
information? Would you be willing to share data with us under an NDA?
Market
Segmentation
Do you see differences in motor efficiency and motor type across equipment types? E.g., do you see pumps installed with more efficient motors
than fans?
Do you see differences in motor efficiency and motor type geographically? E.g., are the motors sold in the PNW more (or less) efficient than
motors sold in other parts of the country?
Within the Pacific Northwest, does urban vs rural affect motor efficiency in any sector?
What percent of equipment has a drive installed as new equipment (either purchased with a drive or added on at the site) vs. a drive retrofitted
onto the equipment after it was installed as constant speed?
Installation Trends
Does your organization install mechanical drives, like eddy current drives or hydraulic drives, on equipment? If so, what percent of motors would
you say are installed with these drives? How prevalent are they in the installed stock?
What percent of drives sold replace existing drives (replacement due to failure, replace mechanical drives)? What percent of drives are installed to
help meet variable load conditions vs. help meet a constant setpoint that is just at a reduced load?
ASD Program Activity
What percent of drives (both retrofit and installed with equipment) do you think are covered by programs?
Retrofit vs Installed with Equipment
In your experience, do most ASDs get installed on existing motors, or installed when the motor is installed? What percent is that breakdown?
How has this breakdown changed over time? For example, has the fact that motors have been being retrofitted with drives for the past ~20
years caused a slow-down in retrofits, or pushed people to think a system needs to have a drive when installed?
Is there a difference in the types of equipment/loads that drives are retrofitted on, as opposed to equipment installed with drives?
Alternate Control Strategies
Can you confirm the control strategies we have identified for each equipment type in Table 5? Are there any that we missed, or any that are not
employed?
What is the estimated percent of current equipment sales that employ each control type?
What is the estimated percent of installed equipment stock that employ each control type?
Do you see differences in this distribution of these control strategies based on Motor Size? Sector?
Applications
Of the applications listed in Table 4, are there any that aren’t present or are very rare in the Pacific Northwest? Which are the most prevalent?
Do you see differences in the distribution of non-ASD control strategies on an application level, or are they consistent up to an equipment level (it
can be different for different equipment types)?

32
Question Topics Questions for Engineering Firms
Operational
Characteristics
Do you install harmonic filters on the VFDs you install? If so, is this on all VFDs, or only certain ones? What instigates you to install a harmonic
filter?
We have heard that oversizing a VFD by one size is pretty common in the field. How does this compare to your experience?
Installation-driven operational characteristics
Is there a difference in the types of equipment/loads that drives are retrofitted on, as opposed to equipment installed with drives?
Load Profile
From an equipment perspective, what percent of the systems do you see operate with a relatively constant load profile, a variable load profile, and
a moderately variable load profile? E.g., Is there more or less variability in fans than pumps?
Is there a difference between load profiles for equipment with different size motors (e.g., usually see larger HP fans with more constant or
more variable loads)?
Do you see a dramatic difference in the load profile for equipment falling into the different applications listed in Table 4?
In the field, do you see ASDs installed only on variable loads, or are they installed on systems regardless of actual load variability? What percent of
drives are installed on variable loads, moderately variable loads, and constant loads?
Motor Oversizing
How does motor oversizing in air compressors compare to pumps or fans (20%)?
How does motor oversizing in material handling/processing and other compare to pumps, fans, and air compressors?
Controls commissioning
When a drive is installed, how often is it commissioned and operating in its more energy efficient mode? How often are drives installed and not
operated efficiently?
What control strategies to drives typically replace? How does this vary by equipment type?
Table A-6: Program Implementors Interview Guide
Question
Topics Questions for Program Implementors
Supply Chain
This research focuses on electronic speed control devices, like VFDs and Electronically Commutated Motors. We have been using the term “ASD” or
adjustable speed drive, to describe these. Do you have any input on this terminology, or a recommendation for a more commonly used term to
describe these?
We are currently looking at drive installation as falling into one of 4 categories:
Retrofit Drives, or drives installed after the equipment is installed
Installed-with-Equipment Drives, or a drive installed at the time the equipment is installed
Integrated Drives, or a drive that is incorporated into the equipment (“smart circ pump/compressor”)
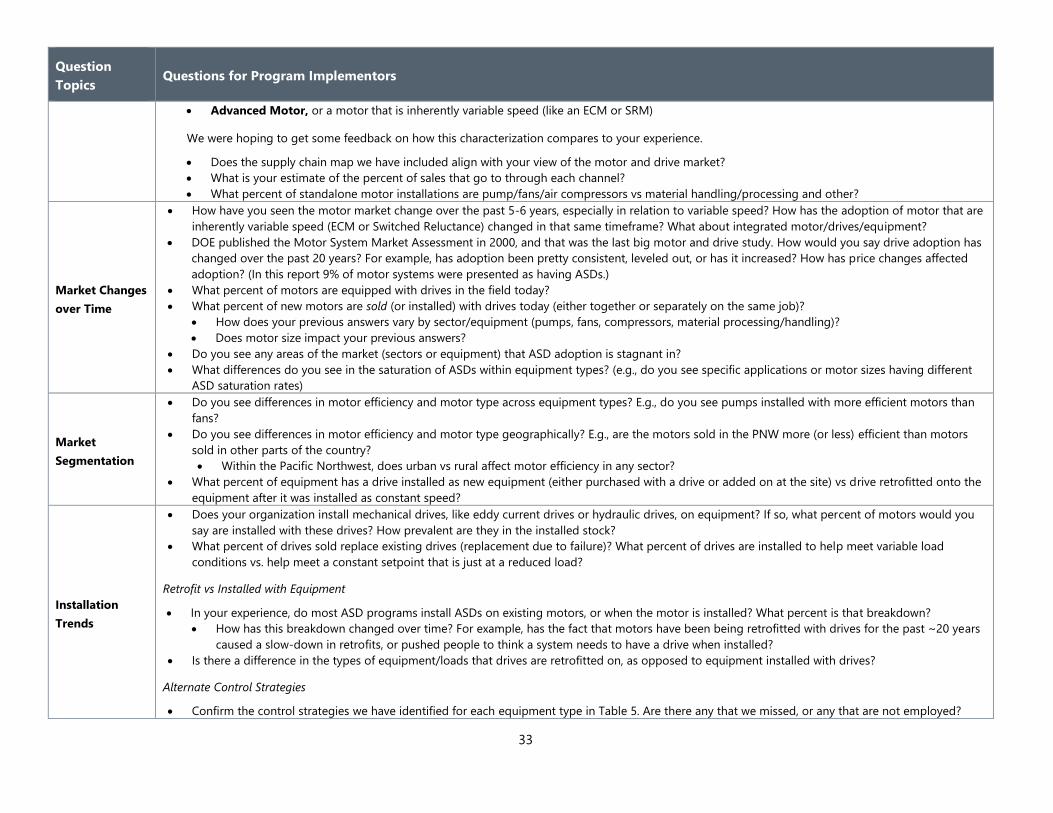
33
Question
Topics Questions for Program Implementors
Advanced Motor, or a motor that is inherently variable speed (like an ECM or SRM)
We were hoping to get some feedback on how this characterization compares to your experience.
Does the supply chain map we have included align with your view of the motor and drive market?
What is your estimate of the percent of sales that go to through each channel?
What percent of standalone motor installations are pump/fans/air compressors vs material handling/processing and other?
Market Changes
over Time
How have you seen the motor market change over the past 5-6 years, especially in relation to variable speed? How has the adoption of motor that are
inherently variable speed (ECM or Switched Reluctance) changed in that same timeframe? What about integrated motor/drives/equipment?
DOE published the Motor System Market Assessment in 2000, and that was the last big motor and drive study. How would you say drive adoption has
changed over the past 20 years? For example, has adoption been pretty consistent, leveled out, or has it increased? How has price changes affected
adoption? (In this report 9% of motor systems were presented as having ASDs.)
What percent of motors are equipped with drives in the field today?
What percent of new motors are sold (or installed) with drives today (either together or separately on the same job)?
How does your previous answers vary by sector/equipment (pumps, fans, compressors, material processing/handling)?
Does motor size impact your previous answers?
Do you see any areas of the market (sectors or equipment) that ASD adoption is stagnant in?
What differences do you see in the saturation of ASDs within equipment types? (e.g., do you see specific applications or motor sizes having different
ASD saturation rates)
Market
Segmentation
Do you see differences in motor efficiency and motor type across equipment types? E.g., do you see pumps installed with more efficient motors than
fans?
Do you see differences in motor efficiency and motor type geographically? E.g., are the motors sold in the PNW more (or less) efficient than motors
sold in other parts of the country?
Within the Pacific Northwest, does urban vs rural affect motor efficiency in any sector?
What percent of equipment has a drive installed as new equipment (either purchased with a drive or added on at the site) vs drive retrofitted onto the
equipment after it was installed as constant speed?
Installation
Trends
Does your organization install mechanical drives, like eddy current drives or hydraulic drives, on equipment? If so, what percent of motors would you
say are installed with these drives? How prevalent are they in the installed stock?
What percent of drives sold replace existing drives (replacement due to failure)? What percent of drives are installed to help meet variable load
conditions vs. help meet a constant setpoint that is just at a reduced load?
Retrofit vs Installed with Equipment
In your experience, do most ASD programs install ASDs on existing motors, or when the motor is installed? What percent is that breakdown?
How has this breakdown changed over time? For example, has the fact that motors have been being retrofitted with drives for the past ~20 years
caused a slow-down in retrofits, or pushed people to think a system needs to have a drive when installed?
Is there a difference in the types of equipment/loads that drives are retrofitted on, as opposed to equipment installed with drives?
Alternate Control Strategies
Confirm the control strategies we have identified for each equipment type in Table 5. Are there any that we missed, or any that are not employed?
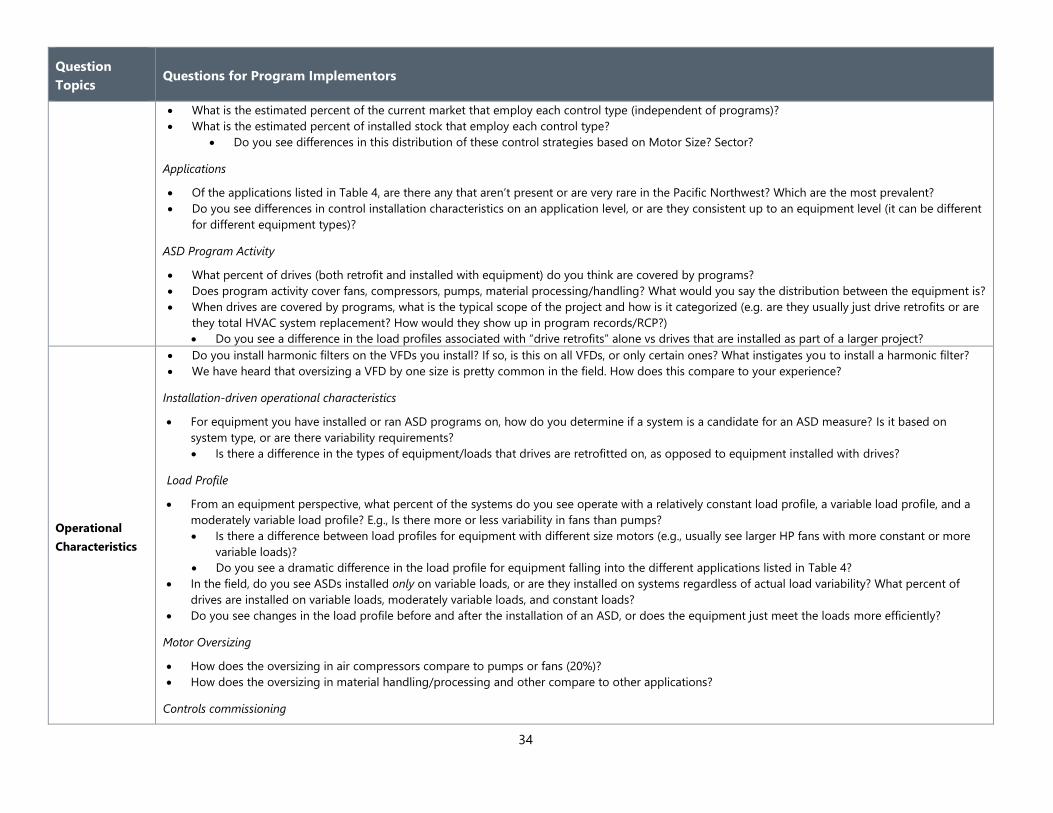
34
Question
Topics Questions for Program Implementors
What is the estimated percent of the current market that employ each control type (independent of programs)?
What is the estimated percent of installed stock that employ each control type?
Do you see differences in this distribution of these control strategies based on Motor Size? Sector?
Applications
Of the applications listed in Table 4, are there any that aren’t present or are very rare in the Pacific Northwest? Which are the most prevalent?
Do you see differences in control installation characteristics on an application level, or are they consistent up to an equipment level (it can be different
for different equipment types)?
ASD Program Activity
What percent of drives (both retrofit and installed with equipment) do you think are covered by programs?
Does program activity cover fans, compressors, pumps, material processing/handling? What would you say the distribution between the equipment is?
When drives are covered by programs, what is the typical scope of the project and how is it categorized (e.g. are they usually just drive retrofits or are
they total HVAC system replacement? How would they show up in program records/RCP?)
Do you see a difference in the load profiles associated with “drive retrofits” alone vs drives that are installed as part of a larger project?
Operational
Characteristics
Do you install harmonic filters on the VFDs you install? If so, is this on all VFDs, or only certain ones? What instigates you to install a harmonic filter?
We have heard that oversizing a VFD by one size is pretty common in the field. How does this compare to your experience?
Installation-driven operational characteristics
For equipment you have installed or ran ASD programs on, how do you determine if a system is a candidate for an ASD measure? Is it based on
system type, or are there variability requirements?
Is there a difference in the types of equipment/loads that drives are retrofitted on, as opposed to equipment installed with drives?
Load Profile
From an equipment perspective, what percent of the systems do you see operate with a relatively constant load profile, a variable load profile, and a
moderately variable load profile? E.g., Is there more or less variability in fans than pumps?
Is there a difference between load profiles for equipment with different size motors (e.g., usually see larger HP fans with more constant or more
variable loads)?
Do you see a dramatic difference in the load profile for equipment falling into the different applications listed in Table 4?
In the field, do you see ASDs installed only on variable loads, or are they installed on systems regardless of actual load variability? What percent of
drives are installed on variable loads, moderately variable loads, and constant loads?
Do you see changes in the load profile before and after the installation of an ASD, or does the equipment just meet the loads more efficiently?
Motor Oversizing
How does the oversizing in air compressors compare to pumps or fans (20%)?
How does the oversizing in material handling/processing and other compare to other applications?
Controls commissioning
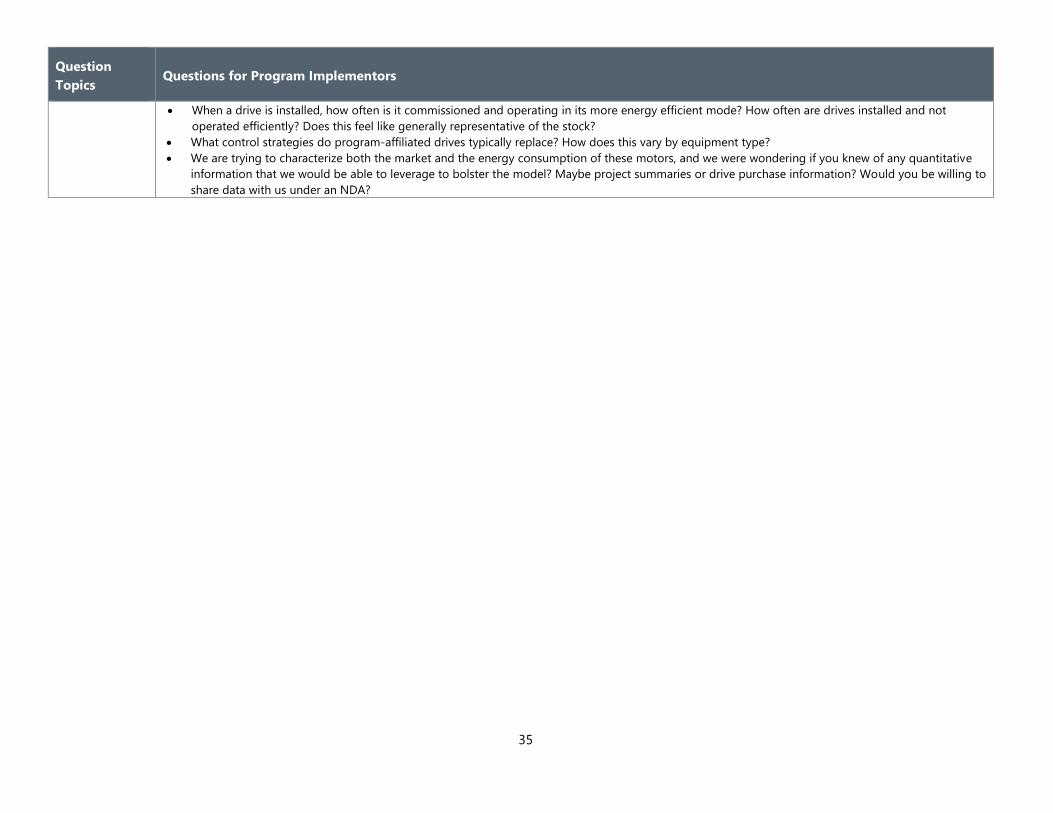
35
Question
Topics Questions for Program Implementors
When a drive is installed, how often is it commissioned and operating in its more energy efficient mode? How often are drives installed and not
operated efficiently? Does this feel like generally representative of the stock?
What control strategies do program-affiliated drives typically replace? How does this vary by equipment type?
We are trying to characterize both the market and the energy consumption of these motors, and we were wondering if you knew of any quantitative
information that we would be able to leverage to bolster the model? Maybe project summaries or drive purchase information? Would you be willing to
share data with us under an NDA?