metabolic syndrome and diabetes: evaluating cvd risk and strategies for cvd risk reduction nathan d....
TRANSCRIPT
Metabolic Syndrome and Diabetes: Evaluating CVD
Risk and Strategies for CVD Risk Reduction
Nathan D. Wong, PhD, FACC, FAHA
Professor and Director Heart Disease Prevention Program
Division of CardiologyUniversity of California, Irvine
Immediate Past President, American Society for Preventive Cardiology

• Review the role and limitations of global risk assessment
• Review the evidence and recommendations for biomarkers in CVD risk assessmennt
• Review the evidence and recommendations for subclinical disease evaluation / imaging in CVD risk assessment
• Discuss features that will be considered in the new NHLBI risk assessment guidelines to be released in 2013
Outline


Age-adjusted prevalence of obesity in adults 20–74 years of age, by sex and survey year
(NHES: 1960–1962; NHANES: 1971–1975, 1976–1980, 1988–1994, 1999-2002 and 2003-2006).
.
Men Women0
5
10
15
20
25
30
35
40
10.7
15.7
12.2
16.8
12.8
17.1
20.6
26.028.1
34.033.135.2
1960-62 1971-75 1976-80 1988-94 1999-2002 2003-06
Per
cen
t o
f P
op
ula
tio
n
Obesity is defined as a BMI of ≥30.0. Source: Health, United States, 2009 (NCHS).
©2010 American Heart Association, Inc. All rights reserved. Roger VL et al. Published online in Circulation Dec. 15, 2010

Diabetes: A Growing ChallengePrevalence in the United States
0
1
2
3
4
5
6
7
19
58
19
61
19
64
19
67
19
70
19
73
19
76
19
79
19
82
19
85
19
88
19
91
19
94
19
97
20
00
20
03
20
06
0
2
4
6
8
10
12
14
16
18
20
Percentage of Population
Number (Millions)
Centers for Disease Control and Prevention, Division of Diabetes Translation. National Diabetes Surveillance System. Available at http://www.cdc.gov/diabetes/statistics.
Diagnosed Diabetes
% o
f P
op
ula
tio
n
# o
f P
atie
nts
in M
illio
ns

Age-Adjusted Prevalence of Type 2 DM: California Adults Aged >18 Including Hispanic and Asian Subgroups 2009
N.D. Wong, California Health Interview Survey (unpublished)

Years from diagnosis
0 5-10 -5 10 15Onse
tDiagnosis
Insulin secretion
Postprandial glucose
Ramlo-Halsted BA et al. Prim Care. 1999;26:771-789Nathan DM et al. NEJM 2002;347:1342-1349
Fasting glucose
Natural History of Type II Diabetes Mellitus
Insulin resistance
Microvascular complications
Macrovascular complications
Type II diabetesPre-diabetes

Diagnostic Criteria forGlycemic Abnormalities
FPG=Fasting plasma glucose, PG=Plasma glucose, OGTT=Oral glucose tolerance test
To convert mg/dL to mmol/L multiply mg/dl by 0.055
The Expert Committee on the Diagnosis and Classification of Diabetes Mellitus. Diabetes Care 2001;24:S5-S20American Diabetes Association. Diabetes Care 2010;33:S11-61
FPG
126 mg/dL
100 mg/dL
7.0 mmol/L
5.6 mmol/L
Prediabetes
Normal
Diabetes Mellitus
2-Hour PG on OGTT
200 mg/dL
140 mg/dL
11.1
mmol/L
7.8 mmol/L
Impaired Glucose Tolerance
Normal
Diabetes Mellitus
Hemoglobin A1C
6.5%
6.0%
Prediabetes
Normal
Diabetes Mellitus

Narayan et al. JAMA 2003;290:1884-1890.
Diabetes Mellitus:Lifetime Risk

Diabetes and CVD• Atherosclerotic complications responsible for
– 80% of mortality among patients with diabetes– 75% of cases due to coronary artery disease
(CAD)– Results in >75% of all hospitalizations for diabetic
complications
• 50% of patients with type 2 diabetes have preexisting CAD. (This number may be less now that more younger people are diagnosed with diabetes.)
• 1/3 of patients presenting with myocardial infarction have undiagnosed diabetes mellitus
Lewis GF. Can J Cardiol. 1995;11(suppl C):24C-28CNorhammar A, et.al. Lancet 2002;359;2140-2144

AGE=Advanced glycation end products, CRP=C-reactive protein, CHD=Coronary heart disease HDL=High-density lipoprotein, HTN=Hypertension, IL-6=Interleukin-6, LDL=Low-density lipoprotein, PAI-1=Plasminogen activator inhibitor-1, SAA=Serum amyloid A protein, TF=Tissue factor, TG=Triglycerides, tPA=Tissue plasminogen activator
Subclinical Atherosclerosis
Atherosclerotic Clinical Events
Hyperglycemia
AGE Oxidative
stress
Inflammation
IL-6 CRP SAA
Infection
Defensemechanisms
Pathogen burden
Insulin Resistance
HTN Endothelial dysfunction
Dyslipidemia
LDL TG HDL
Thrombosis
PAI-1 TF tPA
Disease Progression
Biondi-Zoccai GGL et al. JACC 2003;41:1071-1077.
Mechanisms by which Diabetes MellitusLeads to Coronary Heart Disease

Most Cardiovascular Patients Have Abnormal Glucose Metabolism
35% 31%
34%
37%18%
45%
37% 27%
36%
GAMIn = 164
EHSn = 1920
CHSn = 2263
GAMI = Glucose Tolerance in Patients with Acute Myocardial Infarction study; EHS = Euro Heart Survey; CHS = China Heart Survey
PrediabetesNormoglycemia Type 2 Diabetes
Anselmino M, et al. Rev Cardiovasc Med. 2008;9:29-38.

Risk of Cardiovascular Events in Patients with Diabetes: Framingham Study
Age-adjusted Biennial Rate Age-
adjusted Per 1000 Risk Ratio
Cardiovascular Event Men Women Men WomenCoronary Disease 39 21 1.5** 2.2***Stroke 15 6 2.9*** 2.6***Peripheral Artery Dis. 18 18 3.4*** 6.4***Cardiac Failure 23 21 4.4*** 7.8***All CVD Events 76 65 2.2*** 3.7***
Subjects 35-64 36-year Follow-up **P<.001,***P<.0001
_________________________________________________________________
_________________________________________________________________

Diagnostic Criteria for Metabolic Syndrome: Modified NCEP ATP III
AHA/NHLBI Scientific Statement; Circulation 2005; 112:e285-e290.
≥3 Components Required for Diagnosis
Components Defining Level
Increased waist circumferenceMenWomen
≥ 40 in≥ 35 in
Elevated triglycerides ≥150 mg/dL(or Medical Rx)
Reduced HDL-CMenWomen
<40 mg/dL<50 mg/dL
(or Medical Rx)
Elevated blood pressure ≥130 / ≥85 mm Hg(or Medical Rx)
Elevated fasting glucose ≥100 mg/dL(or Medical Rx)

IDF Criteria: Abdominal Obesity and Waist Circumference Thresholds
Men WomenEuropid ≥ 94 cm (37.0 in) ≥ 80 cm (31.5 in)
South Asian ≥ 90 cm (35.4 in) ≥ 80 cm (31.5 in)
Chinese ≥ 90 cm (35.4 in) ≥ 80 cm (31.5 in)
Japanese ≥ 85 cm (33.5 in) ≥ 90 cm (35.4 in)
• AHA/NHLBI criteria: ≥ 102 cm (40 in) in men, ≥ 88 cm (35 in) in women
• Some US adults of non-Asian origin with marginal increases should benefit from lifestyle changes. Lower cutpoints (≥ 90 cm in men and ≥ 80 cm in women) for Asian Americans
Alberti KGMM et al. Lancet 2005;366:1059-1062. | Grundy SM et al. Circulation 2005;112:2735-2752.
>90cm (male) and >80cm (female) recommended for persons of Central and South American ancestry (including US Hispanics)
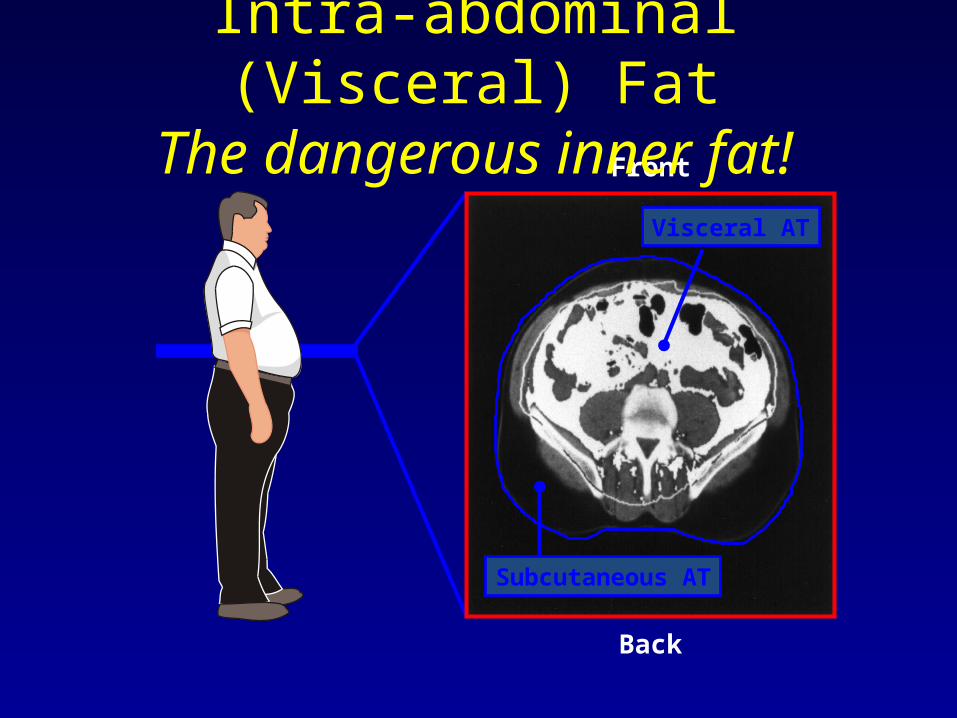
Back
Visceral AT
Subcutaneous AT
Front
Intra-abdominal (Visceral) FatThe dangerous inner fat!

0
5
10
15
20
25
<28 >28-29 30-31 32-33 34-35 36-37 ≥38
Rel
ativ
e R
isk
of
Dia
bet
es
Waist Circumference (in)
Abdominal Adiposity Is Associated With Increased Risk of Diabetes
P value for trend <0.001
Carey VJ, et al. Am J Epidemiol. 1997;145:614-619

MACE patient (CABG): 58-year-old woman with BMI 32.8 and CCS = 0, PFV = 187 cm3 and TFV 315 cm3
After adjustment for Framingham risk score (FRS), CCS, and body mass index, PFV and TFV were significantly associated with MACE (odds ratio [OR]: 1.74, 95% confidence interval [CI]: 1.03 to 2.95 for each doubling of
PFV; OR: 1.78, 95% CI: 1.01 to 3.14 for TFV).
Pericardial Fat Predicts CVD Risk
Cheng et al. JACC Img 2010;3:352-60

0
1
2
3
4
5
6
7
CHD Mortality CVD Mortality Total Mortality
Rel
ativ
e R
isk
None
MetS
Diabetes
CVD
CVD+Diabetes
Metabolic Syndrome and Diabetes in Relation to CHD, CVD, and Total Mortality: U.S. Men and Women Ages 30-74
* p<.05, ** p<.01, **** p<.0001 compared to none
*
***
***
***
**
***
***
***
***
***
***
Malik and Wong, et al., Circulation 2004.
(Risk-factor Adjusted Cox Regression) NHANES II Follow-up (n=6255)
***

Global Risk Assessment in DM: 10-year Total CVD Risk
(Wong ND et al., Diab Vas Dis Res 2012)

Annual CHD Event Rates (in %) by Calcium Score Events by CAC Categories in Subjects with DM, MetS, or Neither Disease
(Malik and Wong et al., Diabetes Care 2011)
Coronary Heart Disease
Coronary Artery Calcium Score
ACCF/AHA 2010 Guideline: CAC Scoring for CV risk assessment in asymptomatic adults aged 40 and over with diabetes (Class IIa-B)
0 1-99 100-399400+
Neither MetS/DM
MetSDM
0.4
1.5 1.9
4
0.20.8
2.1
3.5
0.1 0.41.3
2.2
00.5
11.5
22.5
33.5
4
Annual CHD Event Rate

Mean Absolute Progression of CAC (Volume Score) in Persons with and without MetS and DM, CAC>0 at baseline, MESA Study
Wong ND et al., JACC Cadiovasc Imaging 2012
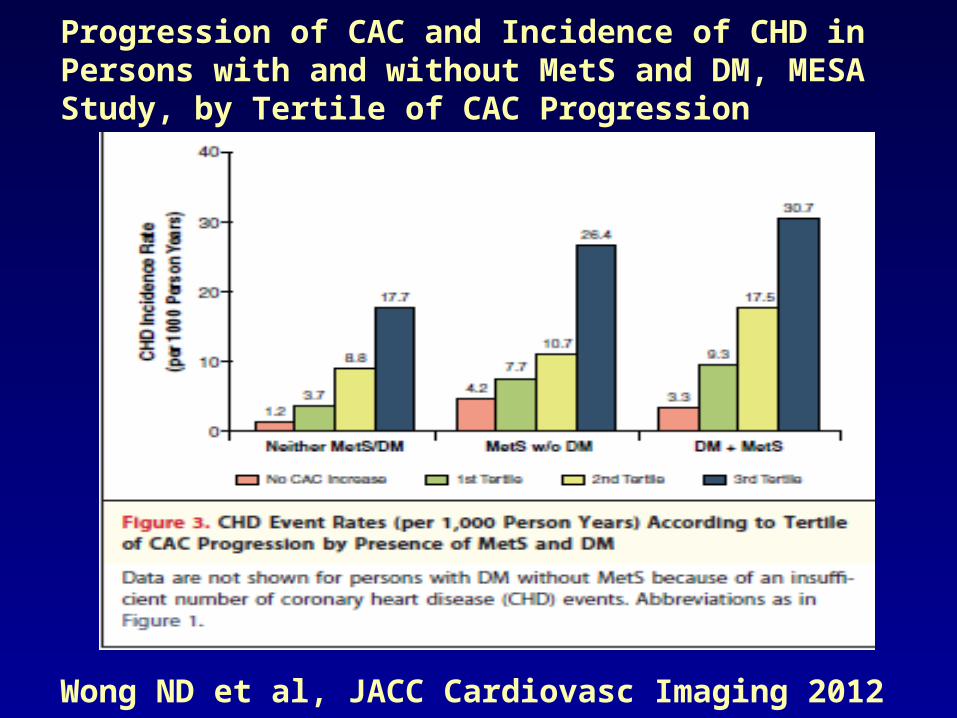
Progression of CAC and Incidence of CHD in Persons with and without MetS and DM, MESA Study, by Tertile of CAC Progression
Wong ND et al, JACC Cardiovasc Imaging 2012

CS Men AA Men CS Women AA Women600
625
650
675
700
725
750
775
800
825
850
705
806
748
782
652
720
685
734
MS(-)MS(+)
Metabolic syndrome & Intimal Medial Thickness in Caucasian (CS) and African American (AA) men and women in ARIC Study
Carotid IMT
(micro- mm)
McNeill AM, et al. AJC 2004.

0 RF 1 RF 2 RF 3 RF 4 RF 5 RF0
5
10
15
20
25
30
ABI<0.9 (%)
Prevalence of reduced Ankle Brachial Index according to Increasing components of Metabolic Syndrome
P<0.001 for trend
Olijhoek JK, et al. Eur Heart J 2004.

0 1 2 3 4 50
2
4
6
8
C-r
eact
ive
prot
ein
(mg/
L)
Number of Components of the Metabolic Syndrome
Ridker et al, Circulation 2003;107:391-7
Metabolic Syndrome is an Inflammatory Condition: Plasma hs-CRP Levels According to
Severity of the Metabolic Syndrome

Summary of Care: ABC's for Providers
A A1c Target Aspirin Daily
B Blood Pressure ControlC Cholesterol Management
Cigarette Smoking Cessation
D Diabetes and Pre-Diabetes Management
E ExerciseF Food Choices

A1c TargetAspirin Therapy
• A1c Target: In persons with diabetes, glucose lowering to achieve normal to near normal plasma glucose, as defined by the HbA1c<7% - also consider measurement of HbA1c for CVD risk assessment in asymptomatic adults w/o DM (ACCF/AHA 2010)
• Aspirin Daily: Patients with type 2 DM >40 years of age or with prevalent CVD, OR those with metabolic syndrome without DM who are at intermediate or higher risk (e.g., >=10% 10-year risk of CHD)

1. Steering Committee of the Physicians' Health Study Research Group. NEJM 1989;321:129-35
2. ETDRS Investigators. JAMA 1992;268:12923. Antiplatelet Trialists' Collaboration. BMJ 1994;
308:81
0
5
10
15
20
25
PHS ETDRS APT BIP PPP POPADAD JPAD
End
poin
t (%
)
No ASA
ASA
n= 533 3711 4502 2368 1031 1276 2539 Endpoint 5 yr MI 7 yr MI 1 yr MCE 5 yr CV Death 4 yr MCE 7yr MCE 4 yr MCE # Events 26 vs 11 283 vs 241 502 vs 415 183 vs 133 20 vs 22 117 vs 116 86 vs 68
Diabetes Mellitus:Effect of Aspirin
4. Harpaz D et al. Am J Med 1998;105:494
3. Sacco M et al. Diabetes Care 2003;26:3264
4. Belch J et al. BMJ 2008; 337:a18405. Ogawa H et al. JAMA 2008; 300: 2134
p=.04p < 0.001
p<0.002
p=NS
p=NS
p=NS
NS=Not Significant
p<0.05

Recommendations:Antiplatelet Agents (1)
• Consider aspirin therapy (75–162 mg/day) (C)– As a primary prevention strategy in those with type 1 or type 2 diabetes
at increased cardiovascular risk (10-year risk >10%)– Includes most men >50 years of age or women >60 years of age who
have at least one additional major risk factor• Family history of CVD• Hypertension• Smoking• Dyslipidemia• Albuminuria
ADA. VI. Prevention, Management of Complications. Diabetes Care 2013;36(suppl 1):S32-S33.

Recommendations:Antiplatelet Agents (2)
• Aspirin should not be recommended for CVD prevention for adults with diabetes at low CVD risk, since potential adverse effects from bleeding likely offset potential benefits (C)• 10-year CVD risk <5%: men <50 and women <60
years of age with no major additional CVD risk factors
• In patients in these age groups with multiple other risk factors (10-year risk5–10%), clinical judgment is required (E)
ADA. VI. Prevention, Management of Complications. Diabetes Care 2013;36(suppl 1):S33.

Recommendations:Antiplatelet Agents (3)
• Use aspirin therapy (75–162 mg/day)– Secondary prevention strategy in those with diabetes with a history
of CVD (A)
• For patients with CVD and documented aspirin allergy– Clopidogrel (75 mg/day) should be used (B)
• Combination therapy with aspirin (75–162 mg/day) and clopidogrel (75 mg/day)– Reasonable for up to a year after an acute coronary syndrome (B)
ADA. VI. Prevention, Management of Complications. Diabetes Care 2013;36(suppl 1):S33-S34.

Summary of Intervention Studies Risk Reduction with Individual Treatments
Persons with Diabetes Mellitus
Blood pressure treatment 30-50%
Lipid treatment 25-55%
Glucose treatment 10-20%per 1% HbA1c
MacrovascularEvent Reduction

Poor Control of Multiple Cardiovascular Risk Factors Among U.S. Adults with Type 2 Diabetes
– NHANES Survey 2003-2006, n=889 (14.3 million) or 6.6% of adults aged >/=18 years had type 2 diabetes
– 58.2% at HbA1c goal <7%– 44.2% at BP goal <130/80 mmHg– 56.4% at recommended HDL-C >/=40 (M), >/=50 (F)– 25.8% at recommended triglycerides <150 mg/dl– 13.9% at BMI<25 kg/m2
– Overall, only 10.5% of men and 9.9% of women at goal for HbA1c, BP, and LDL-C simultaneously; only 0.3% at goal also including BMI.
Wong K, Wong ND et al . J Diab Complic 2012

0
10
20
30
40
50
60
Myocardial Infarction Microvascular Disease
5.5%6.5%7.5%8.5%9.5%10.5%
Stratton IM et al. BMJ 2000;321:405-12
United Kingdom Prospective Diabetes Study (UKPDS) 35
Diabetes Mellitus:Impact of Glycemic Control on CV Risk
CHD=Coronary heart disease, HbA1C=Glycated hemoglobin
%

-25-21
-16-12
-33
-50
-40
-30
-20
-10
0
Microalbuminuria at 12 years Microvascular complicationsRetinopathy Myocardial infarctionAny DM endpoint
% r
ela
tive r
isk
reduct
ion
P=0.03
P<0.01
P<0.01
P=0.05 P=0.02
UKPDS Group. Lancet 1998;352:837-853
Intensive glycemic control in DM reduces the risk of microvascular complications
DM=Diabetes mellitus, HbA1C=Glycosylated hemoglobin
United Kingdom Prospective Diabetes Study (UKPDS)
Diabetes Mellitus (Type II):Effect of Intensive Glycemic Control
3,867 patients with DM randomized to intensive therapy with a sulphonylurea or insulin (mean HbA1C 7.0%) or conventional therapy (mean HbA1C 7.9%)

UKPDS 34, Lancet 352: 854, 1998
UKPDS Metformin Sub-Study: CHD Events
Myocardial Infarction
0
5
10
15
20
Inci
den
ce
per
100
0 p
atie
nt
yea
rs
ConventionalDiet
InsulinSU’s
Metformin
p=0.01
NS
39%Reduction
Coronary Deaths
0
2
4
6
8
10 p=0.02
50%Reduction
Metformin
Inci
den
ce
per
100
0 p
atie
nt
yea
r s
ConventionalDiet
n= 411 951 342 411 342#Events 73 139 39 36 16

N Engl J Med 2008;359:1577-89.
Glycemic Legacy?

Recent Trials Show No Reduction in CV Events with More Intensive Glycemic Control
1ACCORD Study Group. N Engl J Med. 2008;358:2545-2559.2ADVANCE Collaborative Group. N Engl J Med. 2008;358:2560-2572.
Number at RiskIntensive 5570 5369 5100 4867 4599 1883Standard 5569 5342 5065 4808 4545 1921
25
20
15
10
5
00 12 24 36 48 60
Cu
mu
lati
ve i
nci
de
nce
(%
)
Months of follow-up
Standard therapyIntensive therapy
ADVANCE: Primary Outcome
Number at RiskIntensive 5128 4843 4390 2839 1337 475 448Standard 5123 4827 4262 2702 1186 440 395
Pat
ien
ts w
ith
ev
ents
(%
)
0 1 2 3 4 5 6
25
20
15
10
5
0
Years
Standard therapyIntensive therapy
ACCORD: Primary Outcome

Was Intensive Glycemic Control Harmful? A closer look at ACCORD AND ADVANCE
• ACCORD was discontinued early due to increased total and CVD mortality in the intensive arm.
• VA Diabetes Trial showed severe hypoglycemia to be a powerful predictor of CVD events.
• A recent analysis of ACCORD (Diabetes Care, May 2010) showed deaths related to unsuccessful intensive therapy where A1c remained high.
• But in both ACCORD AND ADVANCE, those without macrovascular disease at baseline had an actual benefit in the primary endpoint.
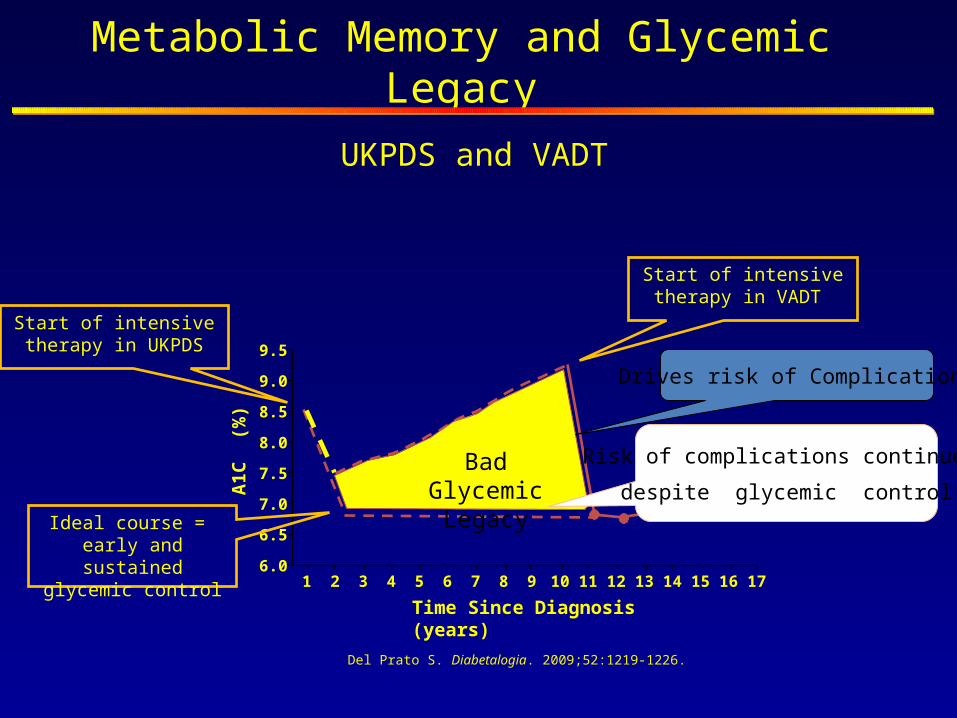
Metabolic Memory and Glycemic Legacy
Del Prato S. Diabetalogia. 2009;52:1219-1226.
Time Since Diagnosis (years)
A1C
(%
)
1 2 3 4 5 6 7 8 9 10 11 12 13 14 15 16 17
9.5
9.0
8.5
8.0
7.5
7.0
6.5
6.0
Start of intensive therapy in VADT
Ideal course = early and sustained
glycemic control
Bad Glycemic Legacy
Start of intensive therapy in UKPDS
Drives risk of Complications
Risk of complications continues
despite glycemic control
UKPDS and VADT
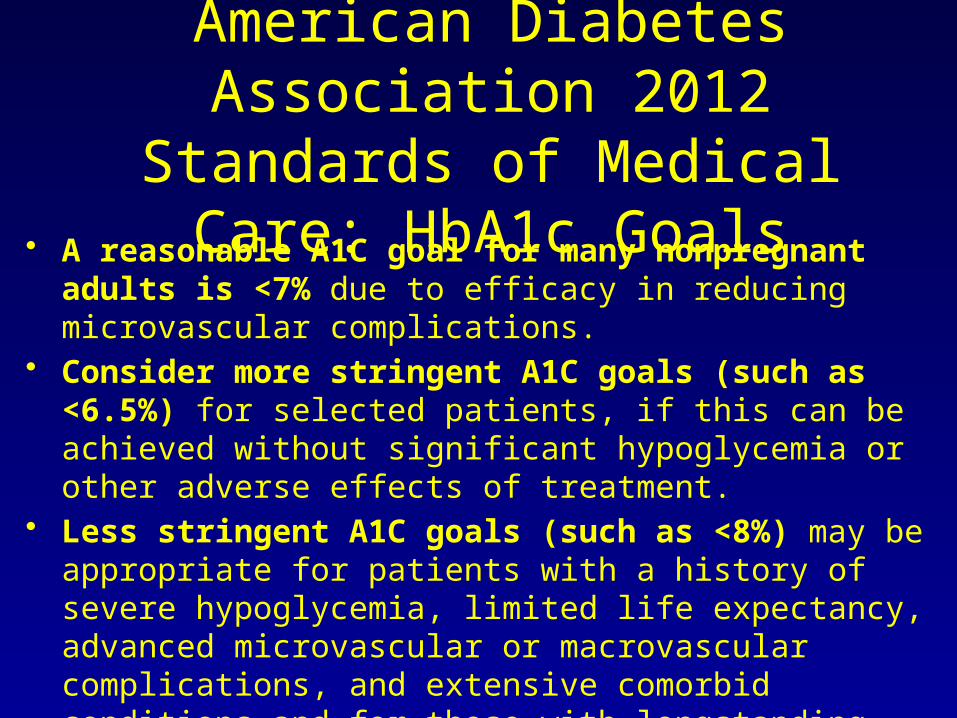
American Diabetes Association 2012 Standards of Medical
Care: HbA1c Goals• A reasonable A1C goal for many nonpregnant adults is
<7% due to efficacy in reducing microvascular complications.• Consider more stringent A1C goals (such as <6.5%) for
selected patients, if this can be achieved without significant hypoglycemia or other adverse effects of treatment.
• Less stringent A1C goals (such as <8%) may be appropriate for patients with a history of severe hypoglycemia, limited life expectancy, advanced microvascular or macrovascular complications, and extensive comorbid conditions and for those with longstanding diabetes in whom the general goal is difficult to attain.

UKPDS: Effects of Tight vs. Less-Tight Blood Pressure Control
UK Prospective Diabetes Study Group. BMJ. 1998; 317:703-713.

Diabetes Mellitus:Effect of Blood Pressure Control
Action to Control Cardiovascular Risk in Diabetes (ACCORD) Blood Pressure TrialP
atie
nts
wit
h E
ven
ts (
%)
0
5
10
15
20
Years Post-Randomization0 1 2 3 4 5 6 7 8
Pat
ien
ts w
ith
Eve
nts
(%
)
0
5
10
15
20
Years Post-Randomization0 1 2 3 4 5 6 7 8
Tota
l Str
oke
HR=0.8895% CI (0.73-1.06)
HR=0.5995% CI (0.39-0.89)
4,733 diabetic patients randomized to intensive BP control (target SBP <120 mm Hg) or standard BP control (target SBP <140 mm Hg)
for 4.7 years
Intensive BP control in DM does not reduce a composite of adverse CV events, but does reduce
the rate of stroke
Nonfa
tal M
I,
nonfa
tal st
roke
, or
CV
death
BP=Blood pressure, DM=Diabetes mellitus, HR=Hazard ratio, SBP=Systolic blood pressureACCORD study group. NEJM 2010

Recommendations: Hypertension/Blood Pressure Control
Goals• People with diabetes and hypertension should be treated to a
systolic blood pressure goal of <140 mmHg (B)• Lower systolic targets, such as <130 mmHg, may be
appropriate for certain individuals, such as younger patients, if it can be achieved without undue treatment burden (C)
• Patients with diabetes should be treated to a diastolic blood pressure <80 mmHg (B)
ADA. VI. Prevention, Management of Complications. Diabetes Care 2013;36(suppl 1):S29.

Recommendations: Hypertension/Blood Pressure Control
Treatment (1)• Patients with a blood pressure (BP) >120/80 mmHg
should be advised on lifestyle changes to reduce BP (B)• Patients with confirmed BP ≥140/80 mmHg should, in
addition to lifestyle therapy, have prompt initiation and timely subsequent titration of pharmacological therapy to achieve BP goals (B)
ADA. VI. Prevention, Management of Complications. Diabetes Care 2013;36(suppl 1):S29.

Recommendations: Hypertension/Blood Pressure Control
Treatment (2)• Lifestyle therapy for elevated BP (B)
– Weight loss if overweight– DASH-style dietary pattern including reducing sodium,
increasing potassium intake– Moderation of alcohol intake– Increased physical activity
ADA. VI. Prevention, Management of Complications. Diabetes Care 2013;36(suppl 1):S29.

Recommendations: Hypertension/Blood Pressure Control
Treatment (3)• Pharmacological therapy for patients with diabetes and hypertension
(C)– A regimen that includes either an ACE inhibitor or angiotensin II receptor
blocker; if one class is not tolerated, substitute the other
• Multiple drug therapy (two or more agents at maximal doses) generally required to achieve BP targets (B)
• Administer one or more antihypertensive medications at bedtime (A)
ADA. VI. Prevention, Management of Complications. Diabetes Care 2013;36(suppl 1):S29.
Recommendations: Hypertension/Blood Pressure Control
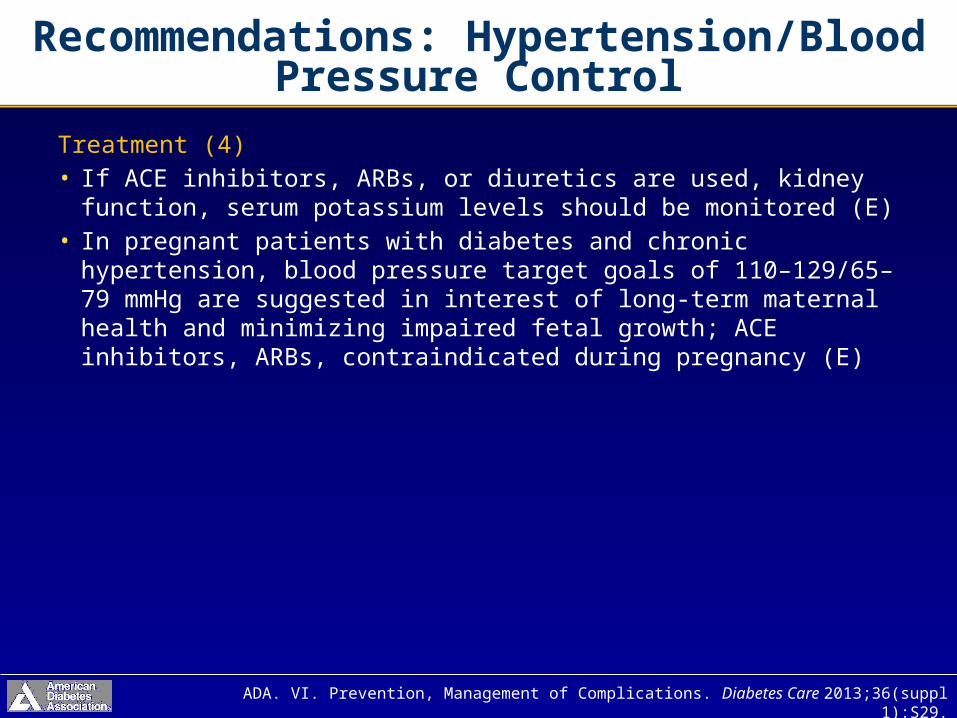
Treatment (4)• If ACE inhibitors, ARBs, or diuretics are used, kidney function,
serum potassium levels should be monitored (E)• In pregnant patients with diabetes and chronic hypertension,
blood pressure target goals of 110–129/65–79 mmHg are suggested in interest of long-term maternal health and minimizing impaired fetal growth; ACE inhibitors, ARBs, contraindicated during pregnancy (E)
ADA. VI. Prevention, Management of Complications. Diabetes Care 2013;36(suppl 1):S29.

Diabetes Mellitus:Effect of an HMG-CoA Reductase Inhibitor
Cholesterol Treatment Trialists’ (CTT) Collaborators. Lancet 2008;37:117-25
Meta-analysis of 18,686 patients with DM randomized to treatment with a HMG-CoA Reductase Inhibitor
Statins reduce CV events 21% in diabetics (similar to non-diabetics)

ACCORD Lipid Study Results (NEJM 2010; 362: 1563-74)
• 5518 patients with type 2 DM treated with open label simvastatin randomly assigned to fenofibrate or placebo and followed for 4.7 years.
• Annual rate of primary outcome of nonfatal MI, stroke or CVD death 2.2% in fenofibrate group vs. 1.6% in placebo group (HR=0.91, p=0.33).
• Pre-specified subgroup analyses showed possible benefit in men vs. women and those with high triglycerides and low HDL-C.
• Results support statin therapy alone to reduce CVD risk in high risk type 2 DM patients.


Recommendations:Dyslipidemia/Lipid Management (1)
Screening• In most adult patients, measure fasting lipid profile at
least annually (B)• In adults with low-risk lipid values
(LDL cholesterol <100 mg/dL, HDL cholesterol >50 mg/dL, and triglycerides <150 mg/dL), lipid assessments may be repeated every 2 years (E)
ADA. VI. Prevention, Management of Complications. Diabetes Care 2013;36(suppl 1):S31.

Recommendations:Dyslipidemia/Lipid Management (2)
Treatment recommendations and goals (1)• To improve lipid profile in patients with diabetes, recommend
lifestyle modification (A), focusing on– Reduction of saturated fat, trans fat, cholesterol intake– Increased n-3 fatty acids, viscous fiber,
plant stanols/sterols– Weight loss (if indicated)– Increased physical activity
ADA. VI. Prevention, Management of Complications. Diabetes Care 2013;36(suppl 1):S31.

Recommendations:Dyslipidemia/Lipid Management (3)
Treatment recommendations and goals (2)• Statin therapy should be added to lifestyle therapy, regardless of baseline
lipid levels – with overt CVD (A)– without CVD >40 years of age who have one or more other CVD risk factors (A)
• For patients at lower risk (e.g., without overt CVD, <40 years of age) (C)– Consider statin therapy in addition to lifestyle therapy if LDL cholesterol remains
>100 mg/dL– In those with multiple CVD risk factors
ADA. VI. Prevention, Management of Complications. Diabetes Care 2013;36(suppl 1):S31.

Recommendations:Dyslipidemia/Lipid Management (4)
Treatment recommendations and goals (3)• In individuals without overt CVD
– Primary goal is an LDL cholesterol<100 mg/dL (2.6 mmol/L) (B)
• In individuals with overt CVD– Lower LDL cholesterol goal of <70 mg/dL
(1.8 mmol/L), using a high dose of a statin,is an option (B)
ADA. VI. Prevention, Management of Complications. Diabetes Care 2013;36(suppl 1):S31.

Recommendations:Dyslipidemia/Lipid Management (5)
Treatment recommendations and goals (4)• If targets not reached on maximal tolerated statin therapy
– Alternative therapeutic goal: reduce LDL cholesterol ~30–40% from baseline (B)
• Triglyceride levels <150 mg/dL(1.7 mmol/L), HDL cholesterol >40 mg/dL (1.0 mmol/L) in men and >50 mg/dL(1.3 mmol/L) in women, are desirable (C)– However, LDL cholesterol–targeted statin therapy remains the preferred strategy
(A)
ADA. VI. Prevention, Management of Complications. Diabetes Care 2013;36(suppl 1):S31.

Recommendations:Dyslipidemia/Lipid Management (6)
Treatment recommendations and goals (5)• Combination therapy has been shown not to
provide additional cardiovascular benefit above statin therapy alone and is not generally recommended (A)
• Statin therapy is contraindicated in pregnancy (B)
ADA. VI. Prevention, Management of Complications. Diabetes Care 2013;36(suppl 1):S31.

Benefit of Comprehensive, Intensive Management: STENO 2 Study
• Treatment Goals:– Intensive TLC– HgbA1c <6.5%– Cholesterol <175– Triglycerides <150– BP <130/80 0
0
10
20
40
50
60
Conventional Therapy
Intensive Therapy
30
Months of Follow Up
Primary End Point=CV events (%)
12 24 36 48 60 72 84 96
n =80
n =80
Gaede, P. et al, NEJM 2003;348:390-393

• Up to 80% of heart disease, stroke and type 2 diabetes and over a third of the most common cancers could be prevented by eliminating obesity, unhealthy diets and physical inactivity
• Call for commitments at the global and national level to address these risk factors including:– Control food supply, food
information and marketing and promotion of energy-dense, nutrient-poor foods that are high in saturated, trans-fat, salt or refined sugars
Nutrition, physical activity and NCD prevention

Modifiable causative risk factors
Tobacco useUnhealthy
dietsPhysical inactivity
Harmful use of alcohol
Non-communicable Diseases
Heart disease and stroke
Diabetes Cancer Chronic lung disease
The NCD Alliance: United by 4 risk factors

The Global CVD Taskforce calls on the CVD community to endorse and support the following top 4 targets to address NCDs and help ensure achievement of the 2025 goal of reducing NCD mortality by 25%:
1) Physical inactivity: 10% relative reduction in prevalence of insufficient physical activity
2) Raised blood pressure: 25% relative reduction in prevalence of raised blood pressure
3) Salt/Sodium Intake: 30% relative reduction in mean population intake of salt, with aim of achieving recommended level of <5 g/d (2000 mg of sodium) (note various organizations such as the AHA call for a limit of 1500 mg/day)
4) Tobacco: 30% relative reduction in prevalence of current tobacco smoking
Smith SC et al., 2012

Weight Management Recommendations Goals Recommendations
Calculate BMI* and measure waist circumference
Monitor response to treatmentBMI 18.5 to 24.9 kg/m2
Women: <35 inchesMen: <40 inches
Start weight management and physical activity as appropriate
If BMI and/or waist circumference is above goal, initiate caloric restriction and increase caloric expenditure
BMI=Body mass index, Rx=Treatment
*BMI is calculated as the weight in kilograms divided by the body surface area in meters2
10% weight reduction within the 1st yr of Rx
Source: Smith SC Jr. et al. JACC 2006;47:2130-9
I IIa IIb III


Diabetes Prevention Program: Reduction in Diabetes Incidence

Recommendations:Medical Nutrition Therapy (MNT)
ADA. V. Diabetes Care. Diabetes Care 2013;36(suppl 1):S22.
• Individuals who have prediabetes or diabetes should receive individualized MNT as needed to achieve treatment goals, preferably provided by a registered dietitian familiar with the components of diabetes MNT (A)
• Because MNT can result in cost-savings and improved outcomes (B), MNT should be adequately covered by insurance and other payers (E)

Look AHEAD (Action for Health in Diabetes): Trial Halted Early
1, 2. Look AHEAD Research Group. Diabetes Care. 2007;30:1374-1383 and Arch Intern Med.2010;170:1566–1575; http://www.nih.gov/news/health/oct2012/niddk-19.htm.
• Intensive lifestyle intervention resulted in1
– Average 8.6% weight loss– Significant reduction of A1C– Reduction in several CVD risk factors
• Benefits sustained at 4 years2
• However, trial halted after 11 years of follow-up because there was no significant difference in primary cardiovascular outcome between weight loss, standard care group

American Heart Association (AHA) Nutrition Committee Dietary Recommendations
• Balance calorie intake and physical activity to achieve or maintain a healthy body weight
• Consume a diet rich in fruits and vegetables• Consume whole-grain, high-fiber foods• Consume fish, especially oily fish, at least twice a week• Limit intake of saturated fat to <7%, trans fat to <1% of
energy, and cholesterol <300 mg/day by:– Choosing lean mean and vegetable alternatives– Choosing fat free (skim), 1% fat, and low-fat dairy products,– Minimizing intake of partially hydrogenated fats
• Minimize intake of beverages and foods with added sugar• Choose and prepare foods with little or no salt
(AHA 2011 rec. <1500mg/d)• If alcohol is consumed, do so in moderation
Recommendations for Cardiovascular Disease Risk Reduction
Source: AHA Nutrition Committee. Circulation 2006;114:82-96

71
Modification Recommendation Approximate SBP Reduction Range
Weight reduction Maintain normal body weight (BMI=18.5-24.9)
5-20 mmHg/10 kg weight lost
Adopt DASH eating plan
Diet rich in fruits, vegetables, low fat dairy and reduced in fat
8-14 mmHg
Restrict sodium intake
<2.4 grams of sodium per day 2-8 mmHg
Physical activity Regular aerobic exercise for at least 30 minutes on most days of the week
4-9 mmHg
Moderate alcohol consumption
<2 drinks/day for men and <1 drink/day for women
2-4 mmHg
JNC VII Lifestyle Modifications for BP Control
Chobanian AV et al. JAMA. 2003;289:2560-2572
BMI=Body mass index, SBP=Systolic blood pressure

Recommendations:Smoking Cessation
• Advise all patients not to smoke or use tobacco products (A)
• Include smoking cessation counseling and other forms of treatment as a routine component of diabetes care (B)
ADA. VI. Prevention, Management of Complications. Diabetes Care 2013;36(suppl 1):S34.

THE REAL NIGHTMARE

Recommendations: Physical Activity
• Advise people with diabetes to perform at least 150 min/week of moderate-intensity aerobic physical activity (50–70% of maximum heart rate), spread over at least 3 days per week with no more than2 consecutive days without exercise (A)
• In absence of contraindications, adults with type 2 diabetes should be encouraged to perform resistance training at least twice per week (A)
ADA. V. Diabetes Care. Diabetes Care 2013;36(suppl 1):S24.

RCT Trial Assessment of Pedometer Interventions
Bravata, DM et al. JAMA 2007; 298:2296-2304
N=277; 8 TrialsPedometer increased steps by 2500/day

Recommendations:Psychosocial Assessment and Care
• Ongoing part of medical management of diabetes (E)
• Psychosocial screening/follow-up: attitudes about diabetes, medical management/outcomes expectations, affect/mood, quality of life, resources, psychiatric history (E)
• When self-management is poor, screen for psychosocial problems: depression, diabetes-related anxiety, eating disorders, cognitive impairment (B)
ADA. V. Diabetes Care. Diabetes Care 2013;36(suppl 1):S25-S26.

SUMMARY
• MetS and DM confer increased risks for CVD complications
• The wide spectrum in CVD risks, however, warrants careful CVD risk assessment in such individuals
• Lifestyle modification remains the cornerstone of efforts to prevent and reduce progression of MetS and DM globally
• Glycemic, blood pressure, lipid, and antiplatelet therapy are key to reduce CVD risks associated with MetS and DM

American Society for Preventive Cardiology
www.aspconline.org
Thank You!
www.heart.uci.edu