metering and allocation plan - ca state lands...
TRANSCRIPT
EXHIBIT D
MEMORANDUM OF AGREEMENT
ON
MEASUREMENT AND ALLOCATION WITH SURFACE COMMINGLING OF OIL AND GAS PRODUCTION FROM THE
POINT PEDERNALES UNIT, THE TRANQUILLON RIDGE UNIT AND CALIFORNIA STATE LANDS TRANQUILLON RIDGE
AREA
BETWEEN
THE MINERALS MANAGEMENT SERVICE,
THE STATE OF CALIFORNIA,
AND
PLAINS EXPLORATION & PRODUCTION COMPANY
W 40807

TABLE OF CONTENTS
MEASUREMENT AND ALLOCATION PLANPOINT PEDERNALES UNIT, TRANQUILLON RIDGE UNIT AND
CALIFORNIA STATE LANDS TRANQUILLON RIDGE AREAPage
Section 1 Introduction ………………………………………………….. 1Section 2 Oil Metering...................................................................... 1Section 3 Gas Metering.................................................................... 6Section 4 Charts............................................................................... 10
4.1 Metering Block Flow Diagram.............................. 10Gas Plant Balance……………….…………………… 11Computational Block Definitions ………………… 12Computational Block for Pipeline Blowdown….. 13Gas Plant Balance Computation…………………. 14
4.2 Meter Calibration Frequency Table..................... 154.3 Annual Calibration Schedule............................... 16
Quarterly Coefficients Table................................ 174.4 Chromatography Frequency................................ 204.5 FMP Legal Locations & Meter Counts................ 214.6 Basic Meter Data................................................... 224.7 Meter Provers........................................................ 234.8 LOGP Location Plat.............................................. 244.9 Meter & Tank Status............................................. 254.10 LOGP Plant Statement.......................................... 264.11 Gas Allocation Methodology............................... 294.12 Gas Injection Imbalance Statement.................... 304.13 Royalty Basis........................................................ 314.14 Oil Allocation Methodology................................. 32
Section 5 BP-Mix Sales Measurement Methodology.................... 34Section 6 Sulfur Measurement Methodology................................. 34Exhibits
A. Month End Well Production Report.................... E-1B. Well Test history Report....................................... E-3C. Condensate – Meter 2469..................................... E-5E. LACT Tickets......................................................... E-6F. Thirty-One Day Gauge and Production Report. . E-10

Page i of iii
WITNESSETH:
WHEREAS, Platform Irene is situated in the outer continental shelf on OCS – P 0441,
WHEREAS, Oil and gas production began at Platform Irene from the federal Point Pedernales Unit (hereinafter “Pt Ped Unit”) in 1987,
WHEREAS, Well A-28 was drilled from Platform Irene into the a new area called the Tranquillon Ridge field, and the federal Tranquillon Ridge Unit (hereinafter “T-Ridge Unit”) was created in 1997 to provide for the production of oil and gas from this new area,
WHEREAS, A Measurement and Allocation plan was generated by the operator and approved by the Minerals Management Service to account for the production from these two units from Platform Irene,
WHEREAS, The development and production of oil and gas reserves related to the state tidelands from the California State Lands Tranquillon Ridge Area (hereinafter “Tidelands”) will be conducted from Platform Irene. This Tidelands development fits within the existing framework of the facility infrastructure at Platform Irene and the Lompoc Oil and Gas Plant (hereinafter “LOGP”).
WHEREAS, The parties now wish to generate a revised measurement and allocation procedure to account for the development of the Tidelands,
WHEREAS, Upon production of oil and gas from the Tidelands, this Memorandum of Agreement (“hereinafter “MOA”) will supersede the previous Measurement and Allocation Plan,
Dec 2008/rev1.0

Page ii of iii
NOW THEREFORE, in consideration of the premises and promises contained herein,
the California State Lands Commission; Minerals Management Service, and Plains
Exploration & Production Company do hereby agree as follows:
I. PARTIES
This MOA is entered into effective the date provided below by and among the Minerals
Management Service, the California State Lands Commission, and Plains Exploration &
Production Company.
II. PURPOSE OF THE AGREEMENT
This MOA has been generated in order to comply with the requirements of 30 CFR,
Part 250.1100 & 250.1200, for Pt Ped Unit and T-Ridge Unit along with California
Public Resources Code, Division 6 for Tidelands. It has been developed to replace that
certain Measurement and Allocation Plan that covered only the federal T-Ridge Unit
and Pt Ped Unit prior to the expansion into the Tidelands.
III. DEFINITIONS
“Condensate” - Any liquid hydrocarbon recovered from the vessels at the inlet to the
LOGP and metered through meter 2469.
“BP-Mix” or “LPG” A mixture of propanes and butanes extracted in the gas
processing unit at LOGP and delivered for sale via the truck loading rack for BP-Mix,
“Natural Gasoline” or “Gasoline” – Liquid hydrocarbons typically in the range of
pentane and heavier recovered during processing of the gas stream at LOGP and
delivered to the truck loading racks for natural gasoline or metered through meter 2468,
“Natural Gas Liquids” – Liquid hydrocarbons typically in the range of propane and
heavier recovered during processing of the gas stream at LOGP and delivered to the
truck loading racks for either Natural Gasoline or BP Mix or metered through 2468
Dec 2008/rev1.0

Page iii of iii
“Pt Ped” – The lands, wells and hydrocarbons collectively associated with the Pt Ped
Unit and the T-Ridge Unit.
“Theoretical Tidelands Oil Production” or “Theo Tidelands” - The sum of the
Tidelands meter readings multiplied by the Tidelands oil cut determined by the
Tidelands OWD probe and corrected for temperature.
“Theoretical Pt Ped Oil Production” or “Theo Pt Ped”- The sum of the Pt Ped meter
readings multiplied by the Pt Ped oil cut determined by the Pt Ped OWD probe and
corrected for temperature. This includes volumes from both Pt Ped Unit and T-Ridge
Unit.
“Theoretical Platform Irene Total Oil production” or “Theo Irene” - The sum of the
Theoretical Tidelands Oil Production and the Theoretical Pt Ped Oil Production.
“Theoretical Tidelands Gas” All Tidelands gas separated on Platform Irene, as
adjusted which is metered with FE-200.
“Theoretical Pt Ped Gas” All Pt Ped gas separated on Platform Irene, which is
metered with FE-221. This includes volumes from both Pt Ped Unit and T-Ridge Unit.
Dec 2008/rev1.0

Page 1 of 35
IV. AGREEMENT
1.0 INTRODUCTIONOil and gas production shall be prorated under a two tiered allocation. The first tier being an allocation to Tidelands and Pt Ped. The second tier being from the Tidelands or Pt Ped to their respective wells. Each allocation is more fully described below.
2.0 OIL METERING
2.1 PROCESS DESCRIPTION
Chart 4.1 in Section 4 is a block flow diagram showing the overall gas and liquid flows for Platform Irene and LOGP. The gas which is not in solution in the oil is separated from the oil on Platform Irene. The oil produced from the Tidelands wells will be segregated from the oil produced from the existing Pt Ped production and metered by turbine meters and adjusted for sediments and water (hereinafter “S&W”) on Platform Irene. Gravity samples will also be taken before commingling so that each area can receive the corresponding price adjustment for the purchaser’s gravity scale. Initially, two of the test separators will be dedicated to the Tidelands wells. One of the test separators will be used as a gross separator. Once the production exceeds the capacity of the test separator which is being used as a gross separator, excess volume will be delivered to the three phase separator dedicated to the Tidelands wells.
All Tidelands oil produced will be combined before entering a three phase separator then metered (FT-250 & FT-251) separately and adjusted for temperature and S&W (TA-250 & OWD-250) before being commingled with Pt Ped production.
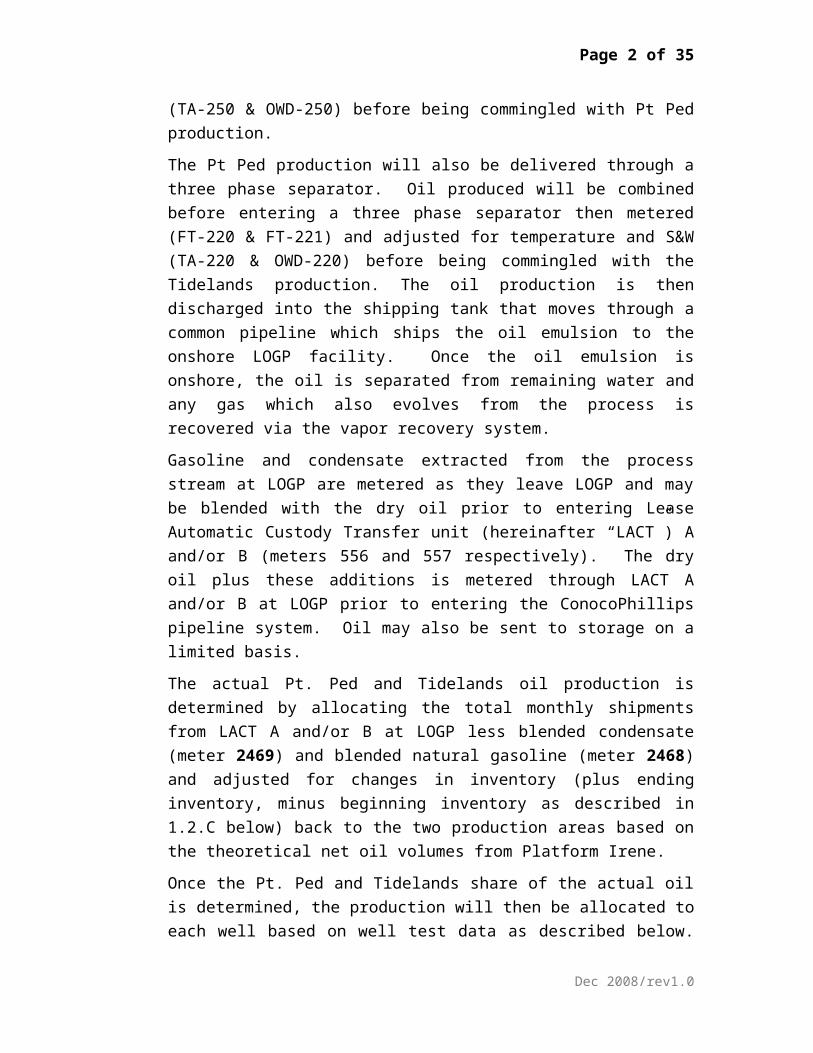
The Pt Ped production will also be delivered through a three phase separator. Oil produced will be combined before entering a three phase separator then metered (FT-220 & FT-221) and adjusted for temperature and S&W (TA-220 & OWD-220) before being commingled with the Tidelands production. The oil production is then discharged into the shipping tank that moves through a common pipeline which ships the oil
Dec 2008/rev1.0

Page 2 of 35
emulsion to the onshore LOGP facility. Once the oil emulsion is onshore, the oil is separated from remaining water and any gas which also evolves from the process is recovered via the vapor recovery system.
Gasoline and condensate extracted from the process stream at LOGP are metered as they leave LOGP and may be blended with the dry oil prior to entering Lease Automatic Custody Transfer unit (hereinafter “LACT”) A and/or B (meters 556 and 557 respectively). The dry oil plus these additions is metered through LACT A and/or B at LOGP prior to entering the ConocoPhillips pipeline system. Oil may also be sent to storage on a limited basis.
The actual Pt. Ped and Tidelands oil production is determined by allocating the total monthly shipments from LACT A and/or B at LOGP less blended condensate (meter 2469) and blended natural gasoline (meter 2468) and adjusted for changes in inventory (plus ending inventory, minus beginning inventory as described in 1.2.C below) back to the two production areas based on the theoretical net oil volumes from Platform Irene.
Once the Pt. Ped and Tidelands share of the actual oil is determined, the production will then be allocated to each well based on well test data as described below. Generally, every well is tested at least twice per month for a period of 24 hours. When a well is not in test, the fluid flows through a gross separator, one designated for Pt Ped production and one designated for Tidelands production. The individual theoretical well production is determined by multiplying the applicable well test production rate per day by the corresponding days the individual well was open to production [well test production rate x days on production = individual well theoretical production]. The total Tidelands or Pt Ped actual oil production will be prorated to the producing wells by multiplying the total Tidelands or Pt Ped production by the result of dividing the individual well theoretical production by sum of all theoretical well production from the corresponding area which equals the actual individual well production [total Tidelands or Pt Ped production x (individual well theoretical production / sum of all area theoretical well production) = actual individual well production].
Dec 2008/rev1.0

Page 3 of 35
2.2 METERINGOil metering and allocation of production described by the following (Well A-23 is used for sample calculations) is to demonstrate the well level allocation of the volume from Section 2.1. Calculation differences between the formulas below and Exhibit A are due to rounding.
A. OIL/CONDENSATE ALLOCATION BY COMPLETION REPORT
Exhibit “A” is the allocation report which depicts each well’s proportionate share of production/sales based on the metering and allocation method described herein for oil and condensate.
B. METERING METHOD
1. Oil Sales – Column 5 Exhibit A
Oil Sales is measured by LOGP LACT meters (Exhibit E). Commingled in the LACT meters is condensate blended through meter 2469 (Exhibit C) and natural gasoline blended through meter 2468 (Exhibit D). Condensate is deducted from LACT sales and shown as Condensate on Exhibit A (Row 8). Natural gasoline is deducted from LACT sales and processed on the LOGP Facility Report with the Natural Gas Liquids.
2. Condensate – Meter 2469, Exhibit C
Corresponds to “PRODUCTION VOLUME” column 4 of Exhibit A – “PRODUCT TOTALS” as noted on page 2, Row 8 for each well.
3. Blended Natural Gasoline - Meter 2468, Exhibit D
Corresponds to Column 13 of Chart 4.10, LOGP Gas Plant Statement. Included here only as information since the metered volume is used to adjust the LACT for actual oil sales.
4. Beginning Inventory – Column 3 Exhibit A
Ending Inventory includes tank storage and pipeline fill from prior month, similar to Exhibit F.
5. Ending Inventory – Column 6 Exhibit A
Ending Inventory includes tank storage and pipeline fill (Exhibit F).
Dec 2008/rev1.0
Page 4 of 35
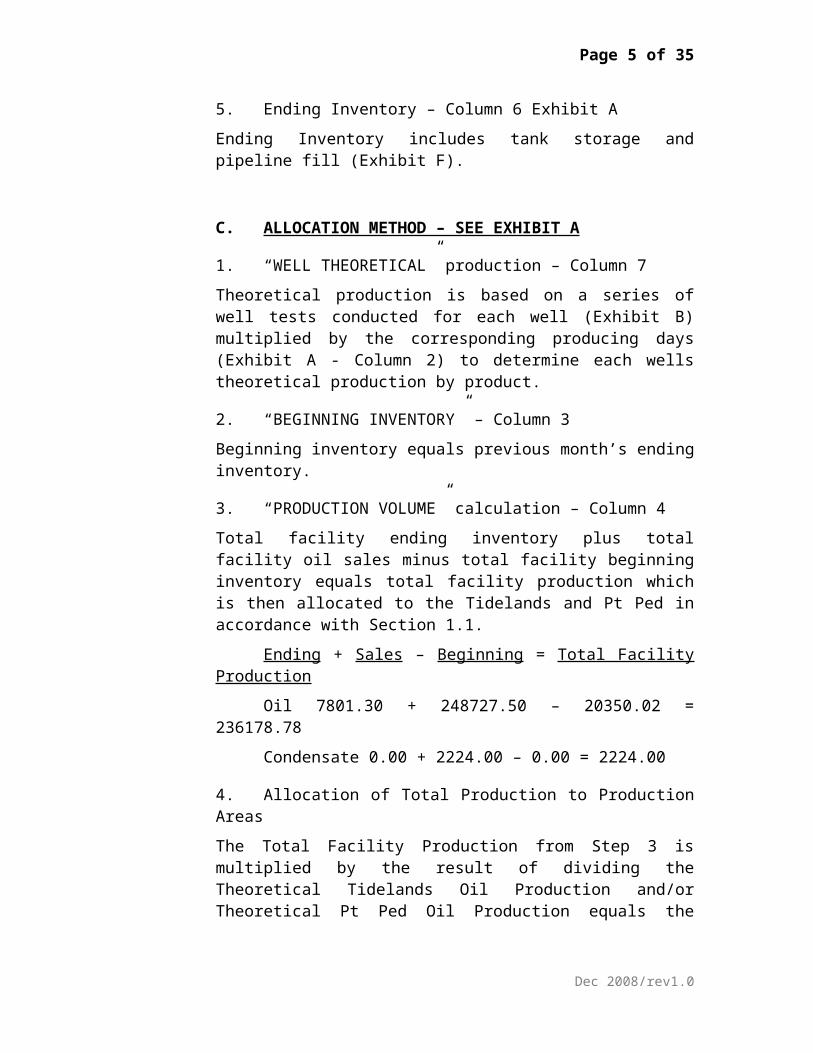
C. ALLOCATION METHOD – SEE EXHIBIT A
1. “WELL THEORETICAL” production – Column 7
Theoretical production is based on a series of well tests conducted for each well (Exhibit B) multiplied by the corresponding producing days (Exhibit A - Column 2) to determine each wells theoretical production by product.
2. “BEGINNING INVENTORY” – Column 3
Beginning inventory equals previous month’s ending inventory.
3. “PRODUCTION VOLUME” calculation – Column 4
Total facility ending inventory plus total facility oil sales minus total facility beginning inventory equals total facility production which is then allocated to the Tidelands and Pt Ped in accordance with Section 1.1.
Ending + Sales – Beginning = Total Facility Production
Oil 7801.30 + 248727.50 – 20350.02 = 236178.78
Condensate 0.00 + 2224.00 – 0.00 = 2224.00
4. Allocation of Total Production to Production Areas
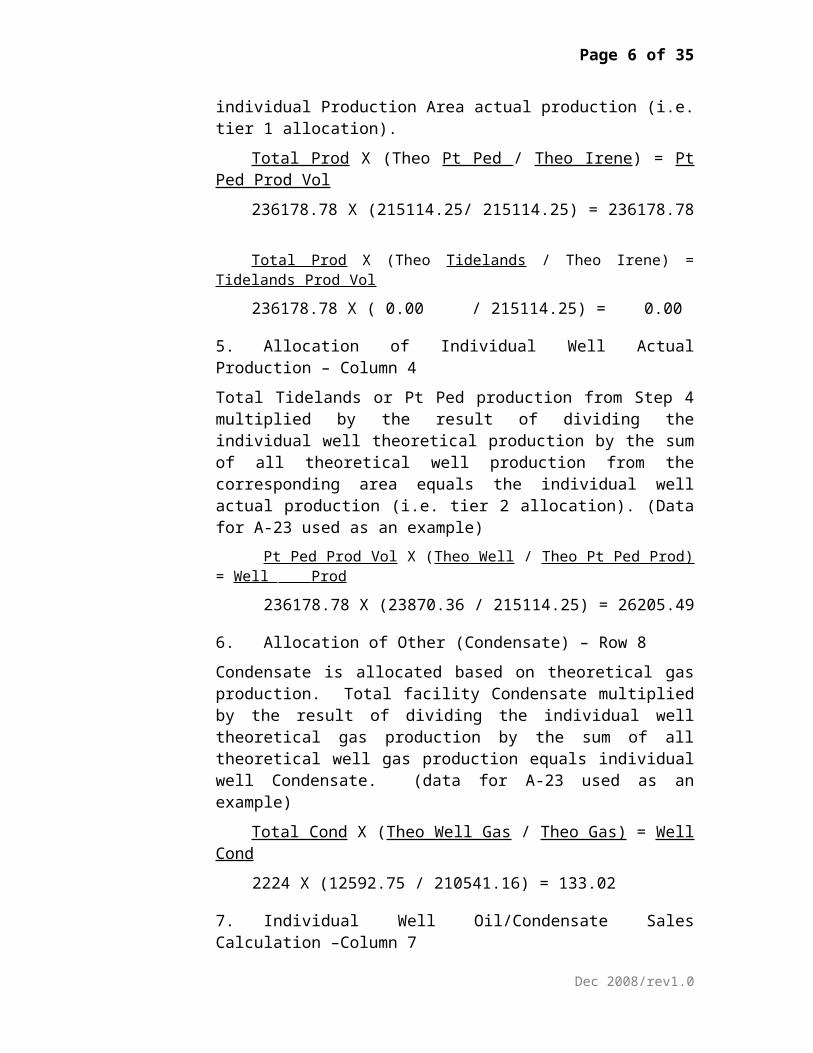
The Total Facility Production from Step 3 is multiplied by the result of dividing the Theoretical Tidelands Oil Production and/or Theoretical Pt Ped Oil Production equals the individual Production Area actual production (i.e. tier 1 allocation).
Total Prod X (Theo Pt Ped / Theo Irene) = Pt Ped Prod Vol
236178.78 X (215114.25/ 215114.25) = 236178.78Total Prod X (Theo Tidelands / Theo Irene) = Tidelands Prod Vol
236178.78 X ( 0.00 / 215114.25) = 0.00
5. Allocation of Individual Well Actual Production – Column 4
Total Tidelands or Pt Ped production from Step 4 multiplied by the result of dividing the individual well theoretical production by the sum of all theoretical well production from the corresponding area equals the individual well actual production (i.e. tier 2 allocation). (Data for A-23 used as an example)
Pt Ped Prod Vol X (Theo Well / Theo Pt Ped Prod) = Well Prod
236178.78 X (23870.36 / 215114.25) = 26205.49
Dec 2008/rev1.0

Page 5 of 35
6. Allocation of Other (Condensate) – Row 8
Condensate is allocated based on theoretical gas production. Total facility Condensate multiplied by the result of dividing the individual well theoretical gas production by the sum of all theoretical well gas production equals individual well Condensate. (data for A-23 used as an example)
Total Cond X (Theo Well Gas / Theo Gas) = Well Cond
2224 X (12592.75 / 210541.16) = 133.02
7. Individual Well Oil/Condensate Sales Calculation –Column 7
Total facility oil sales less beginning inventory, prorated to each well based on current month well oil production from above, divided by total facility oil production for the month plus beginning well inventory (if any). (data for A-23 used as an example)
(Total Facility Oil Sales–Beg Inv)X(Well Oil Prod / Total Fac Oil Prod)=Sub-Total
Oil (248727.50-20350.02)X(26205.46/236178.78)=25339.79
Sub-Total + Beg Inv = Well Oil Sales
Oil 25339.79 + 2293.10 = 27632.89
(Total Fac Cond Sales–Beg Inv)X(Well Cond Prod/Total Fac Cond Prod)=Well Sales
Condensate (2224.00 - 0.00) X (133.02 / 2224.00) = 133.02
8. Ending Inventory Calculation – Column 8
Beginning oil inventory plus oil production minus oil sales equals ending inventory. (data for A-23 used as an example)
Beg Inv + Oil Prod – Oil Sales = End Inv
2293.10 + 26205.46 – 27632.89 = 865.67
9. Water Production – Row 9
Water production is a series of well tests for each well to determine well estimated water production.
10. Days Produced – Column 2
Days produced is determined by tracking the downtime of each well to arrive at the number of days the well is open for production.
Dec 2008/rev1.0

Page 6 of 35
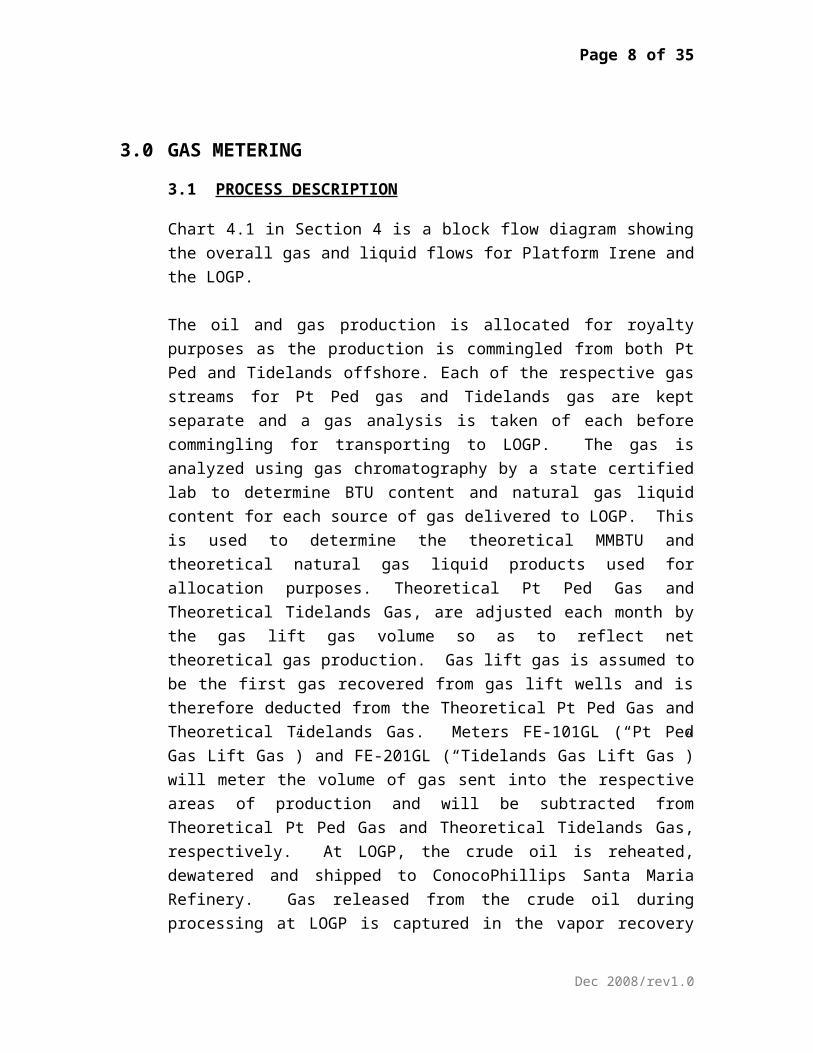
3.0 GAS METERING
3.1 PROCESS DESCRIPTION
Chart 4.1 in Section 4 is a block flow diagram showing the overall gas and liquid flows for Platform Irene and the LOGP.
The oil and gas production is allocated for royalty purposes as the production is commingled from both Pt Ped and Tidelands offshore. Each of the respective gas streams for Pt Ped gas and Tidelands gas are kept separate and a gas analysis is taken of each before commingling for transporting to LOGP. The gas is analyzed using gas chromatography by a state certified lab to determine BTU content and natural gas liquid content for each source of gas delivered to LOGP. This is used to determine the theoretical MMBTU and theoretical natural gas liquid products used for allocation purposes. Theoretical Pt Ped Gas and Theoretical Tidelands Gas, are adjusted each month by the gas lift gas volume so as to reflect net theoretical gas production. Gas lift gas is assumed to be the first gas recovered from gas lift wells and is therefore deducted from the Theoretical Pt Ped Gas and Theoretical Tidelands Gas. Meters FE-101GL (“Pt Ped Gas Lift Gas”) and FE-201GL (“Tidelands Gas Lift Gas”) will meter the volume of gas sent into the respective areas of production and will be subtracted from Theoretical Pt Ped Gas and Theoretical Tidelands Gas, respectively. At LOGP, the crude oil is reheated, dewatered and shipped to ConocoPhillips Santa Maria Refinery. Gas released from the crude oil during processing at LOGP is captured in the vapor recovery system and combined (via meter 2452) with gas from Platform Irene (via meter 2453). This mixture passes through meter 2450 and mixes with gas from Lompoc Field (from meter 2675) along with gas recovered from injection ( (Purisima 73, meter 2451) before treatment in the gas processing unit.
The gas processing unit removes heavy hydrocarbons (C3+) and waste products (water, H2S, and CO2) from the gas to be sold. Treated gas is normally compressed and sold into the SOCAL Pipeline (via meter 5811).
Dec 2008/rev1.0
Page 7 of 35
During maintenance shutdowns or whenever the sales gas is “off specification,” the gas is injected into the Lompoc Field at Purisima well P-73 (via meter 2462). Gas from Platform Irene that is injected onshore, is metered, allocated and royalties are paid on the volume injected based on the weighted average sales price per Mcf for the month of injection. Gas recovered from storage (via meter 2451) is non-royalty bearing since the royalty was paid as the gas was injected.
Natural Gas Liquids condense in the gas plant. Natural Gasoline is usually blended into the dry crude oil (via meter 2468) using a metering pump as discussed in Section 2. The Natural Gasoline may also be sold by loading it onto tank trucks (via meter 2470). This generally occurs during shut-downs of the refinery and/or the oil pipeline The Natural Gasoline produced can vary from 0 to 11,000 gallons per day (“gpd”).
The BP-Mix that is removed from the gas stream at the gas processing unit is sold and transported by truck (via meter 2471). BP-Mix production will vary from 0 to 18,000 gpd.
Each well that is produced by gas lift has an individual meter for the gas volume injected. The gas production from the test separator (when a well is in test), is adjusted for the gas injected volume to arrive at the well’s theoretical produced gas. For wells that are produced using electric submersible pumps, the gas which is metered at the test separator is the theoretical produced gas for the well.
3.2 METERING
The LOGP Facility is equipped with meters for all major gas and liquid streams. Turbine, mass flow, diaphragm, rotary vane, and orifice meters are used, depending on the service. All natural gas liquid flows are measured by meters. The measurement methodology for BP-Mix sales is included in Section 5.
A list of meters and their calibration frequencies are shown in Chart 4.2 (see Section 4). Basic meter data is summarized in Chart 4.6.
Dec 2008/rev1.0
Page 8 of 35
3.3 CALIBRATION
The meters will be calibrated as indicated on Chart 4.2, with frequencies ranging between twice a month to annually. The MMS and State will be notified before calibration where indicated in Chart 4.2. The MMS and State shall also be notified concerning the calibration of the SOCAL meter. A yearly calibration schedule is shown on Chart 4.3.
3.4 ANALYSES
The process stream analytical schedule is given in Chart 4.4. Notifications are to be made according to the information shown in this chart.
3.5 ALLOCATION
Allocations are calculated using the attached spreadsheet, Chart 4.10. Calculation methodology is explained on Chart 4.11. The Gas Injection Imbalance Statement is included herewith as Chart 4.12. Tidelands and Pt Ped royalty allocation basis is outlined on Chart 4.13.
3.6 FLARE GAS
Gas sent to flare on Platform Irene will be identified as to the source (ie: Tidelands, Pt Ped, Combined) and reported on the Daily Report. Gas from a vessel or well prior to FE-221 will be reported as Pt Ped gas, gas prior to FE-200 will be reported as Tidelands gas, and gas flared after FE-221 and FE-200 will be reported as Combined flare. Combined flare gas will be allocated in the same manner as sold gas, prorated based on FE-221 and FE-200. The Daily Report volumes will be summarized each month for allocation and reporting.
3.7 GAS LIFT GAS
Gas used for gas lift will be metered before injection via meters FE-101GL
(“Pt Ped Gas Lift Gas”) and FE-201GL (“Tidelands Gas Lift Gas”). This gas will
be recovered at the separators on Platform Irene. Gas Lift Gas is treated as a closed loop and assumed to be the first gas recovered from wells on
Dec 2008/rev1.0

Page 9 of 35
Gas Lift. Metered volumes at FE-221 and FE-200 are adjusted for Gas Lift volumes along with gas metered during well test of wells on Gas Lift.
3.8 IRENE GAS INJECTION
Gas injected at platform Irene will be allocated in the same manner as gas sold, prorated based on FE-221 and FE-200. No royalty will be calculated on Pt Ped gas that is injected since it still remains within the boundaries of Pt Ped except as noted below. Royalty will be calculated only on Tidelands gas that is injected at Irene. Gas injection at platform Irene is typically for operational upset conditions. The operator will notify the MMS District Office when gas is injected similar to the flare notice. Should it be necessary to inject on a more frequent basis the operator will contact the MMS to obtain a Gas Storage Agreement and royalties will be paid to the MMS on gas injected under the Gas Storage Agreement.
Dec 2008/rev1.0
Page 10 of 35
4.0 CHARTS
Dec 2008/rev1.0

Page 11 of 35
Dec 2008/rev1.0
LOGP - Gas Plant Balance
2675Lompoc Field Gas
2451Gas FromInjection
2490Acid Gas
580
2466
5811
910
920
999
+ / - Balance
Flare
Fuel
Sales Gas
To Injection
Gasoline Shrinkage
BP- Mix Shrinkage
Actual MetersComputational Blocks( please refer to computational block definitions )
2462
9######
2465Fuel Gas From
SOCAL
LOGP Facility +Platform Irene Gas
901
904
Pipeline Blow Down

Page 12 of 35
Dec 2008/rev1.0
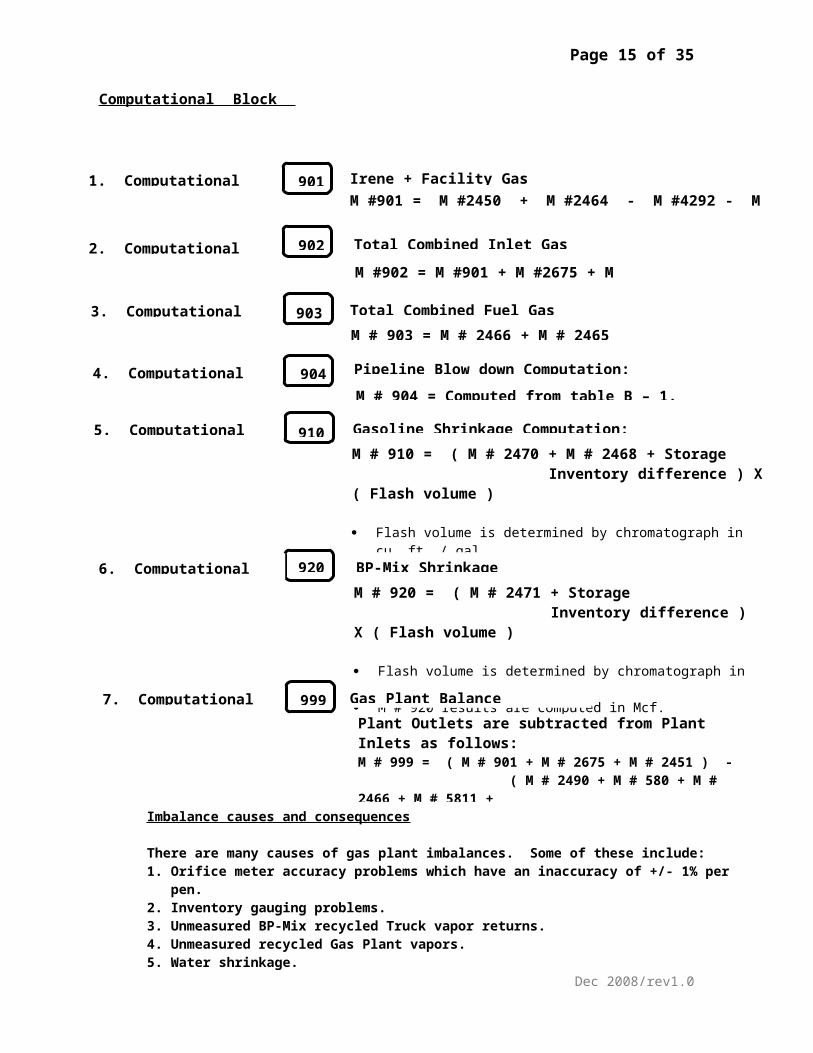
Computational Block Definitions:
1. Computational Block Irene + Facility Gas Computation:M #901 = M #2450 + M #2464 - M #4292 - M #4200
2. Computational 902 Total Combined Inlet Gas Computation:
M #902 = M #901 + M #2675 + M #2451
3. Computational Total Combined Fuel Gas Computation:M # 903 = M # 2466 + M # 2465
4. Computational Block 904 Pipeline Blow down Computation:
M # 904 = Computed from table B – 1.
5. Computational Block 910 Gasoline Shrinkage Computation:M # 910 = ( M # 2470 + M # 2468 + Storage Inventory difference ) X ( Flash volume )
Flash volume is determined by chromatograph in cu. ft. / gal. M # 910 results are computed in Mcf.
6. Computational Block 920 BP-Mix Shrinkage Computation:M # 920 = ( M # 2471 + Storage Inventory difference ) X ( Flash volume )
Flash volume is determined by chromatograph in cu. ft. / gal. M # 920 results are computed in Mcf.
7. Computational Block Gas Plant Balance Computation:Plant Outlets are subtracted from Plant Inlets as follows:M # 999 = ( M # 901 + M # 2675 + M # 2451 ) - ( M # 2490 + M # 580 + M # 2466 + M # 5811 + M # 2462 + M # 910 + M # 920 )
Imbalance causes and consequences
There are many causes of gas plant imbalances. Some of these include:1. Orifice meter accuracy problems which have an inaccuracy of +/- 1% per pen.2. Inventory gauging problems.3. Unmeasured BP-Mix recycled Truck vapor returns.4. Unmeasured recycled Gas Plant vapors.5. Water shrinkage.
If gas plant imbalance exceeds 10%, meter calibration frequency should be increased.
901
903
999

Page 13 of 35
Dec 2008/rev1.0
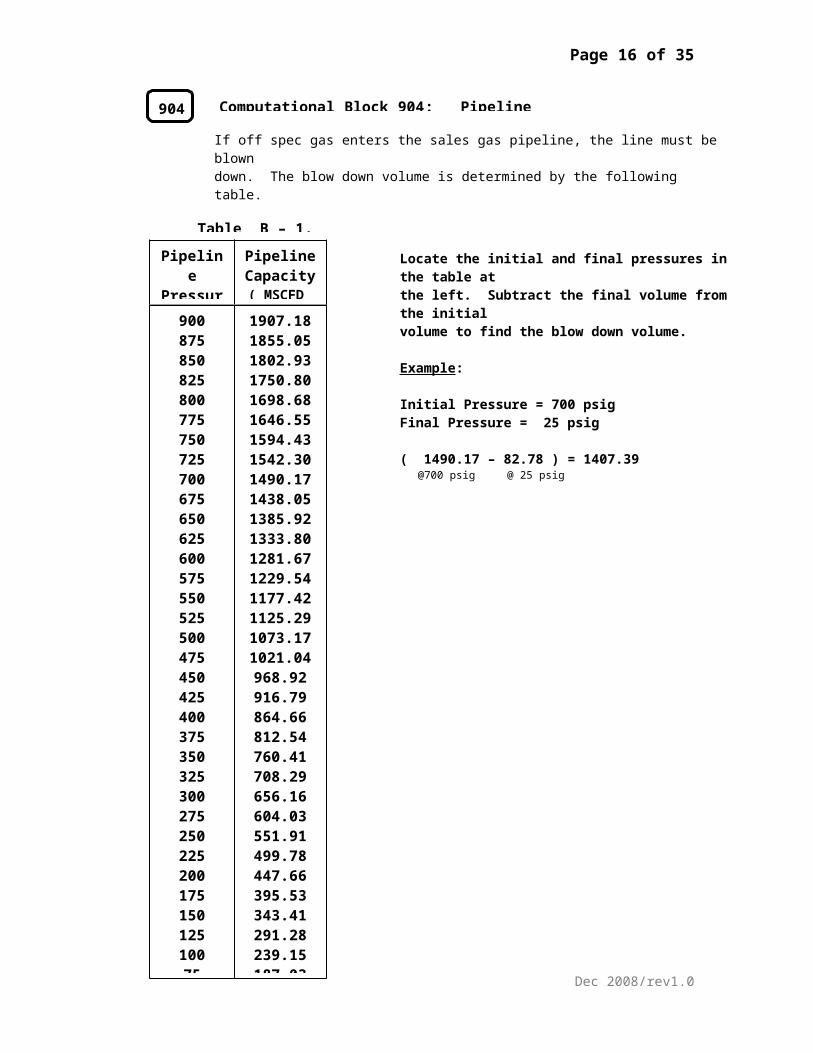
904 Computational Block 904: Pipeline Blowdown
If off spec gas enters the sales gas pipeline, the line must be blowndown. The blow down volume is determined by the following table.Table values are computed from the relationship: P1V1 = P2V2 , andthe pipeline dimensions of 7.39 miles of 12” pipe.
PipelinePressure
( PSIG )
PipelineCapacity( MSCFD )
9008758508258007757507257006756506256005755505255004754504254003753503253002752502252001751501251007550250
1907.181855.051802.931750.801698.681646.551594.431542.301490.171438.051385.921333.801281.671229.541177.421125.291073.171021.04968.92916.79864.66812.54760.41708.29656.16604.03551.91499.78447.66395.53343.41291.28239.15187.03134.9082.7830.65
Locate the initial and final pressures in the table atthe left. Subtract the final volume from the initialvolume to find the blow down volume.
Example:
Initial Pressure = 700 psigFinal Pressure = 25 psig
( 1490.17 – 82.78 ) = 1407.39 @700 psig @ 25 psig
Table B – 1.

Page 14 of 35
NOT PART OF DOCUMENT
Note:
For page 10 A-D see Chart 4.1 Metering Flow Diagram under separate PDF file from Autocad.
Dec 2008/rev1.0
Page 15 of 35
NOT PART OF DOCUMENT
Note:
For page 14 see ‘Gas Plant Balance Computation’ saved under separate file.
For page 15 see Chart 4.2 Meter Calibration Frequency Table under separate file.
For page 16 see Chart 4.3 Annual Schedule under separate file.
For page 17 see ‘Gas Gravity & Coefficient Update Chart’ saved under separate file.
All above pages contained in file:
Pt. Ped & LOGP Metering Plan Charts (excel file)
Dec 2008/rev1.0

Page 16 of 35
Blank for formatting
Dec 2008/rev1.0
Page 17 of 35
Blank for formatting
Dec 2008/rev1.0
Page 18 of 35
BLANK SCHEDULE FORMS
Included herein are 8½-by-11 blank meter calibration schedule originals.
Dec 2008/rev1.0
Page 19 of 35
NOT PART OF DOCUMENT4-21-05
Note:
For page 19 see Chart 4.3 Annual Schedule (blanks) under separate file.
File name is:
Pt. Ped & LOGP Metering Plan Charts (excel file)
Dec 2008/rev1.0

Page 20 of 35
CHART 4.4
CHROMATOGRAPHY FREQUENCY
SAMPLE POINT PERIOD
Lompoc Compressor SuctionTidelands Sales Gas at IrenePt Ped Sales Gas at Irene
QuarterlyQuarterly (1)Quarterly (1)
meter 2450meter 2451meter 2452meter 2453meter 2461meter 2462meter 2468meter 2675meter A28-1meter A28-2
MonthlyMonthlyMonthlyMonthlyMonthlyMonthlyMonthlyMonthlyMonthlyMonthly
(1) Sample monthly during initial start-up of Tidelands
Dec 2008/rev1.0
Page 21 of 35
NOT PART OF DOCUMENT4-21-05
Note:
For page 21 see Chart 4.5 FMP Legal Locations & Meter Counts under separate file.
For page 22 see Chart 4.6 Basic Meter Data under separate file.
All above pages contained in file:
Pt. Ped & LOGP Metering Plan Charts (excel file)
Dec 2008/rev1.0
Page 22 of 35
Blank for formatting
Dec 2008/rev1.0

Page 23 of 35
4.7 METER PROVERS
Meter proving is currently done by either Century Calibrating Company or Calib/Tech. Basic data on the prover instruments used by these contractors is available for review at PXP’s Orcutt office during normal business hours.
Dec 2008/rev1.0

NOT PART OF DOCUMENT4-21-05
Note:
For page 24 see Chart 4.8 Location Plat under separate file. LOGP Meter Locations.pdf
For page 25 see Chart 4.9 Meter & Tank Status under separate file.
For pages 26 - 31 see Chart 4.10 LOGP – Gas Plant Statement under separate file.
For page 32 see Chart 4.11 Allocation Methodology under separate file.
For page 33 see Chart 4.12 LOGP – Gas Plant Gas Injection Imbalance Statement under separate file.
For page 34 see Chart 4.13 under separate file.
All above pages (except page 23) contained in file:
Pt. Ped & LOGP Metering Plan Charts (excel file)
Dec 2008/rev1.0

Page 32 of 35
4.14 Oil Allocation Methodology & Basic Royalty Valuation
1. Pt Ped and Tidelands Oil Production Calculation a. Gross Oil Sales to Tidelands & Pt Ped areas: volume from FT-220 and FT-221
for Pt Ped; volume from FT-250 and FT-251 for Tidelands
Times
b. Oil percentage net of S&W from OWD-220 for Pt Ped; Oil percentage net of S&W from OWD-250 for Tidelands
Adjusted for
c. Temperature correction factor: TA-220 for Pt Ped; TA-250 for Tidelands
Equals
d. Theoretical Tidelands Oil Production volume for Tidelands and Theoretical Pt Ped Oil Production for Pt Ped areas: FT-220 and FT-221 adjusted for PT PED; FT-250 and FT-251adjusted for Tidelands
2. Net Oil Sales Calculation a. Current monthly LACT sales: Sum of LACT A&B adjusted for temperature,
gravity and S&W to arrive at Net Total Sales volume
Minus
b. Current blended gasoline {C5+} sales: Meter 2468
Minus
c. Current blended Condensate sales: Meter 2469
Equals
d. Net Oil Sales volume
3. Total Oil Productiona. Ending Inventory (Exhibit F)
Minus
b. Beginning Inventory (Exhibit F)
Plus
c. Net Oil Sales (from 2.d. above)
Equals
d. Total Oil Production
Prorated based on
Dec 2008/rev1.0
Page 33 of 35
e. Theoretical Tidelands Oil Production and Theoretical Pt Ped Oil Production (from 1.d. above) plus any other metered oil delivers (net of S&W and adjusted for temperature)
Equals
f. Actual Oil Production for each area, respectively
4. Oil Sales: calculated on First-in-First-out basis (Beginning Inventory for all areas is deemed to be sold first)
a. Net Oil Sales volume
Minus
b. Beginning Inventory for each area respectively
Equals
c. Oil Sales from Production
Prorated based on
d. Oil Production from each area, respectively (3.f.)
Equals
e. Current Produced Oil Sold for each area, respectively
Plus
f. Beginning Inventory for each area, respectively
Equals
g. Total Current Month Sales for each area, respectively
Times
h. Current month sales price adjusted for oil gravity prior to C5+ blending
Equals
i. Current month Oil Sales Value for each area, respectively
Times
j. The royalty interest for each area, respectively
Equals
k. Current month Oil Royalty Value for each area, respectively
Dec 2008/rev1.0

Page 34 of 35
5.0 BP-MIX SALES MEASUREMENT METHODOLOGY
TRUCK SHIPMENT OF BP-MIXTrucks are loaded through a Daniel Instruments hydrocarbon liquid
loading system (hereinafter “Danload System”). This system measures
the volume of the liquid loaded in the truck and records the volume in
gallons. The DanLoad System is temperature corrected. Meters 2470 and 2471 are used as inputs to the DanLoad System.
6.0 SULFUR MEASUREMENT METHODOLOGYTRUCK SHIPMENT OF SULFURThe sulfur produced from the gas plant is a waste product of very low
quality. Of the total volume shipped, 80% is solids and 20% is water. Of
the 80% solids, 80% is sulfur and the rest is other impurities. The
solids/water cake is sold on a weight basis. The Trucks are weighed at
State of California Certified public scales and the payment is based on the
difference between truck weight empty and truck weight full. The value
received for sulfur sales is significantly less than the costs to recover and
deliver due to the low quality. The value received is recorded as a credit
to processing expense since the removal and transportation costs are
greater than the value due to the sulfur’s low quality.
Dec 2008/rev1.0
Page 35 of 35
IN WITNESS WHEREOF, The State of California, State Lands
Commission; the Department of the Interior, Minerals Management
Service; and Plains Exploration & Production Company have caused this
MOA to be executed as of the dates set forth next to their respective
signatures below, but effective for all purposes on the date of production
of oil and gas from state Tidelands.
By: _________________________________________ Date: ________
Title: ______________________________________________________
(State of California)
By: __________________________________________Date:_________
Title: ______________________________________________________
(Minerals Management Service)
By: _________________________________________Date: _________
Title: ______________________________________________________
(Plains Exploration & Production Company)
Dec 2008/rev1.0