metrics - github pages
TRANSCRIPT

Metrics
Release 202001
https://chaoss.community/metrics
MIT License
Copyright © 2020 CHAOSS a Linux Foundation® Project

CHAOSS Contributors include: Ahmed Zerouali, Akshita Gupta, Amanda Brindle, Alberto Martín, Alberto Pérez García-Plaza, Alexander Serebrenik, Alexandre Courouble, Alolita Sharma, Alvaro del Castillo, Ahmed Zerouali, Ana Jimenez Santamaria, Andre Klapper, Andrea Gallo, Andy Grunwald, Andy Leak, Aniruddha Karajgi, Anita Sarma, Ankit Lohani, Ankur Sonawane, Anna Buhman, Armstrong Foundjem, Atharva Sharma, Ben Lloyd Pearson, Benjamin Copeland, Bingwen Ma, Boris Baldassari, Bram Adams, Brian Proffitt, Camilo Velazquez Rodriguez, Carol Chen, Carter Landis, Chris Clark, Christian Cmehil-Warn, Damien Legay, Dani Gellis, Daniel German, Daniel Izquierdo Cortazar, David A. Wheeler, David Moreno, David Pose, Dawn Foster, Derek Howard, Don Marti, Drashti, Dylan Marcy, Eleni Constantinou, Emma Irwin, Fil Maj, Gabe Heim, Georg J.P. Link, Gil Yehuda, Harish Pillay, Harshal Mittal, Henri Yandell, Henrik Mitsch, Ildiko Vancsa, Jacob Green, Jaice Singer Du Mars, Jason Clark, Javier Luis Cánovas Izquierdo, Jeff McAffer, Jeremiah Foster, Jessica Wilkerson, Jesus M. Gonzalez-Barahona, Jocelyn Matthews, Johan, Johan Linåker, John Mertic, Jon Lawrence, Jonathan Lipps, Jono Bacon, Jordi Cabot, Jose Manrique Lopez de la Fuente, Joshua R. Simmons, Josianne Marsan, Kate Stewart, Keanu Nichols, Kevin Lumbard, Kristof Van Tomme, Lars, Laura Gaetano, Lawrence Hecht, Leslie Hawthorne, Luis Cañas-Díaz, Luis Villa, Lukasz Gryglicki, Mark Matyas, Martin Coulombe, Matthew Broberg, Matt Germonprez, Matt Snell, Michael Downey, Miguel Ángel Fernández, Mike Wu, Neil Chue Hong, Nick Vidal, Nicole Huesman, Nishchith K Shetty, Nithya Ruff, Parth Sharma, Patrick Masson, Peter Monks, Pranjal Aswani, Prodromos Polychroniadis, Quan Zhou, Ray Paik, Remy DeCausemaker, Robert Lincoln Truesdale III, Robert Sanchez, Rupa Dachere, Saloni Garg, Saleh Motaal, Samantha Logan, Santiago Dueñas, Sarvesh Mehta, Sarah Conway, Sean P. Goggins, Shane Curcuru, Sharan Foga, Shreyas, Stefano Zacchiroli, Thom DeCarlo, Tobie Langel, Tom Mens, UTpH, Valerio Cosentino, Venu Vardhan Reddy Tekula, Vicky Janicki, Victor Coisne, Vinod Ahuja, Vipul Gupta, Will Norris, Xavier Bol, Zibby Keaton The CHAOSS Governing Board at time of release:
• Andrea Gallo, Linaro • Ben Lloyd Pearson, Nylas • Brian Proffitt, Red Hat • Daniel Izquierdo, Bitergia • Daniel M. German, University of Victoria • Dawn Foster, Pivotal • Don Marti, Mozilla • Georg Link, Bitergia • Ildikó Vancsa, OpenStack • Kate Stewart, Linux Foundation • Matt Germonprez, University of Nebraska at Omaha • Nicole Huesman, Intel • Ray Paik, GitLab • Sean Goggins, University of Missouri • Wayne Beaton, Eclipse Foundation

CHAOSS Metrics by Working Groups and Focus Areas 3
1) Activity Dates and Times 12
2) Time to First Response 16
3) Contributors 18
4) Organizational Diversity 23
5) Attendee Demographics 27
6) Code of Conduct at Event 29
7) Diversity Access Tickets 31
8) Family Friendliness 33
9) Speaker Demographics 35
10) Board Council Diversity 36
11) Code of Conduct 38
12) Mentorship 40
13) Sponsorship 43
14) Code Changes 46
15) Code Changes Lines 50
16) Reviews Accepted 54
17) Reviews Declined 59
18) Review Duration 62
19) Reviews 65
20) Issues New 69
21) Issues Active 72
22) Issues Closed 76
23) Issue Age 80
24) Issue Response Time 83
25) Issue Resolution Duration 85
26) New Contributors Closing Issues 87
27) Committers 89
28) Elephant Factor 94
29) Test Coverage 98

30) License Count 101
31) License Coverage 103
32) License Declared 105
33) OSI Approved Licenses 108
34) CII Best Practices Badge 110
35) Social Currency) System 113
36) Labor Investment 121
37) Project Velocity 123
38) Organizational Project Skill Demand 126
39) Job Opportunities 129
Release History 131
The MIT License 133

CHAOSS MetricsRelease 202001Released metrics are only a subset of metric ideas that are being developed. If youwould like to learn more and discuss different metrics please visit the working grouprepositories. The metrics are sorted into Focus Areas. CHAOSS uses a Goal-Question-Metric format to present metrics. Individual metrics are released based on identi�edgoals and questions. The metrics include a detail page with de�nitions, objectives, andexamples.
Focus Areas by Working GroupCommon Metrics WG
When: TimeWho: People
Diversity and Inclusion WGEvent DiversityGovernanceLeadership
Evolution WGCode Development ActivityCode Development E�ciencyCode Development Process QualityIssue ResolutionCommunity Growth
Risk WGBusiness RiskCode QualityLicensing
CHAOSS Metrics by Working Groups and Focus Areas 3

Security
Value WGEcosystem ValueLabor InvestmentLiving Wage
Important Dates for Release 202001Release Freeze: January 1st, 2020Candidate Release: January 24th, 2020Public Comment Period: January 1st, 2020 to January 24th, 2020Metrics Release Date: January 31st, 2020
Common MetricsCommon Metrics Repository: https://github.com/chaoss/wg-common
Focus Area - When: TimeGoal:Understand when contributions from organizations and people are happening.
Metric/Details Question
Activity Datesand Times What are the dates and timestamps of when contributor activities occur?
Time to FirstResponse
How much time passes between when an activity requiring attention iscreated and the �rst response?
Focus Area - Who: PeopleGoal:Understand organizational and personal engagement with open source projects.
CHAOSS Metrics by Working Groups and Focus Areas 4

Metric/Details QuestionMetric/Details Question
Contributors Who are the contributors to a project?
OrganizationalDiversity What is the organizational diversity of contributions?
Diversity and InclusionD&I Repository: https://github.com/chaoss/wg-diversity-inclusion
Focus Area - Event DiversityGoal:Identify the diversity and inclusion at events.
Metric/Details Question
AttendeeDemographics How diverse and inclusive are the attendees?
Code ofConduct atEvent
How does the Code of Conduct for events support diversity and inclusion?
Diversity AccessTickets
How are Diversity Access Tickets used to support diversity and inclusion foran event?
FamilyFriendliness
How does enabling families to attend together support diversity andinclusion of the event?
SpeakerDemographics
How well does the speaker lineup for the event represent a diverse set ofdemographics and can be improved in the future?
Focus Area - GovernanceGoal:Identify how diverse and inclusive project governance is.
CHAOSS Metrics by Working Groups and Focus Areas 5

Metric/Details QuestionMetric/Details Question
Board/CouncilDiversity What is the diversity within our governing board or council?
Code ofConduct forProject
How does the Code of Conduct for the project support diversity andinclusion?
Focus Area - LeadershipGoal:Identify how healthy community leadership is.
Metric/Details Question
Mentorship How effective are our mentorship programs at supporting diversity andinclusion in our project?
Sponsorship How effective are long-time members who sponsor people in supportingdiversity and inclusion in a community?
EvolutionEvolution Repository: https://github.com/chaoss/wg-evolution
Scope: Aspects related to how the source code changes over time, and the mechanismsthat the project has to perform and control those changes.
Focus Area - Code Development ActivityGoal:Learn about the types and frequency of activities involved in developing code.
Metric/Details Question
Code Changes What changes were made to the source code during a speci�ed period?
CHAOSS Metrics by Working Groups and Focus Areas 6

Metric/Details Question
Code ChangesLines
What is the sum of the number of lines touched (lines added plus linesremoved) in all changes to the source code during a certain period?
Focus Area - Code Development E�ciencyGoal:Learn how e�ciently activities around code development get resolved.
Metric/Details Question
ReviewsAccepted How many accepted reviews are present in a code change?
ReviewsDeclined
What reviews of code changes ended up declining the change during acertain period?
ReviewsDuration
What is the duration of time between the moment a code review starts andmoment it is accepted?
Focus Area - Code Development Process QualityGoal:Learn about the processes to improve/review quality that are used (for example: testing,code review, tagging issues, tagging a release, time to response, CII Badging).
Metric/Details Question
Reviews What new review requests for changes to the source code occurred during acertain period?
Focus Area - Issue ResolutionGoal:Identify how effective the community is at addressing issues identi�ed by communityparticipants.
CHAOSS Metrics by Working Groups and Focus Areas 7

Metric/Details QuestionMetric/Details Question
Issues New What are the number of new issues created during a certain period?
Issues Active What is the count of issues that showed activity during a certain period?
Issues Closed What is the count of issues that were closed during a certain period?
Issue Age What is the average time that open issues have been open?
Issue ResponseTime
How much time passes between the opening of an issue and a response inthe issue thread from another contributor?
Issue ResolutionDuration How long does it take for an issue to be closed?
Focus Area - Community GrowthGoal:Identify the size of the project community and whether it is growing, shrinking, or stayingthe same.
Metric/Details Question
NewContributorsClosing Issues
How many contributors are closing issues for the �rst time?
RiskRisk Repository: https://github.com/chaoss/wg-risk
Focus Area - Business RiskGoal:Understand how active a community exists around/to support a given softwarepackage.
CHAOSS Metrics by Working Groups and Focus Areas 8

Metric/Details QuestionMetric/Details Question
Committers How robust and diverse are the contributors to a community?
Elephant Factor What is the distribution of work in the community?
Focus Area - Code QualityGoal:Understand the quality of a given software package.
Metric/Details Question
Test Coverage How well is the code tested?
Focus Area - LicensingGoal:Understand the potential intellectual property(IP) issues associated with a givensoftware package’s use.
Metric/Details Question
License Count How many different licenses are there?
LicenseCoverage How much of the code base has declared licenses?
LicenseDeclared What are the declared software package licenses?
OSI ApprovedLicenses
What percentage of a project’s licenses are OSI approved open sourcelicenses?
Focus Area - SecurityGoal:Understand how transparent a given software package is with respect to dependencies,licensing (?), security processes, etc.
CHAOSS Metrics by Working Groups and Focus Areas 9

Metric/Details Question
CII BestPractices badge What is the current CII Best Practices status for the project?
ValueValue Repository: https://github.com/chaoss/wg-value
Focus Area - Ecosystem ValueGoal:Estimate the value of an open source project’s ecosystem.
Metric/Details Question
Social CurrencyMetric System(SCMS)
How does one measure the value of community interactions and accuratelygauge “trust” within a community as evident from qualitative sentiment?
Focus Area - Labor InvestmentGoal:Estimate the labor investment in open source projects.
Metric/Details Question
LaborInvestment
What was the cost of an organization for its employees to create thecounted contributions (e.g., commits, issues, and pull requests)?
Project Velocity What is the development speed for an organization?
Focus Area - Living Wage
CHAOSS Metrics by Working Groups and Focus Areas 10

Goal:Expanding opportunities for people to make a living wage in open source.
Metric/Details Question
OrganizationalProject SkillDemand
How many organizations are using this project and could hire me if I becomepro�cient?
JobOpportunities How many job postings request skills with technologies from a project?
Copyright © 2020 CHAOSS a Linux Foundation® project. All rights reserved. The LinuxFoundation has registered trademarks and uses trademarks. For a list of trademarks ofThe Linux Foundation, please see our Trademark Usage page. Linux is a registeredtrademark of Linus Torvalds. Privacy Policy and Terms of Use.
CHAOSS Metrics by Working Groups and Focus Areas 11

Activity Dates and TimesQuestion: What are the dates and timestamps of when contributor activities occur?
DescriptionIndividuals engage in activities in open source projects at various times of the day. Thismetric is aimed at determining the dates and times of when individual activities werecompleted. The data can be used to probabilistically estimate where on earthcontributions come from in cases where the time zone is not UTC.
ObjectivesImprove transparency for employers about when organizational employees areengaging with open source projectsImprove transparency for open source project and community managers as to whenactivity is occurring
ImplementationFilters
Individual by OrganizationAggregation of time by UTC time
Can show what times across the globe contributions are made; when the projectis most active.
Aggregation of time by local timeCan show what times of day in their local times they contribute. Conclusionsabout the If contributions are more during working hours, or if contributions aremore during evening hours.
Repository ID
Visualizations
1) Activity Dates and Times 12

1) Activity Dates and Times 13

Tools Providing MetricGrimoireLab
Augur Date/Timestamps
1) Activity Dates and Times 14

ReferencesCoordinated Universal Time
1) Activity Dates and Times 15

Time to First ResponseQuestion: How much time passes between when an activity requiring attention iscreated and the �rst response?
DescriptionThe �rst response to an activity can sometimes be the most important response. The�rst response shows that a community is active and engages in conversations. A longtime to respond to an activity can be a sign that a community is not responsive. A shorttime to respond to an activity can help to engage more members into furtherdiscussions and within the community.
ObjectivesIdentify cadence of �rst response across a variety of activities, including PRs, Issues,emails, IRC posts, etc. Time to �rst response is an important consideration for new andlong-time contributors to a project along with overall project health.
ImplementationTime to �rst response of an activity = time �rst response was posted to the activity -time the activity was created.
FiltersRole of responder, e.g., only count maintainer responsesAutomated responses, e.g., only count replies from real people by �ltering bots andother automated replies
Visualizations
2) Time to First Response 16

Tools Providing the MetricGrimoireLab Panel: E�ciency Timing OverviewKata Containers dashboard e�ciency panel
References
2) Time to First Response 17

ContributorsQuestion: Who are the contributors to a project?
DescriptionA contributor is de�ned as anyone who contributes to the project in any way. This metricensures that all types of contributions are fully recognized in the project.
ObjectivesOpen source projects are comprised of a number of different contributors. Recognizingall contributors to a project is important in knowing who is helping with such activitiesas code development, event planning, and marketing efforts.
ImplementationCollect author names from collaboration tools a project uses.
Aggregators:
Count. Total number of contributors during a given time period.
Parameters:
Period of time. Start and �nish date of the period. Default: forever. Period duringwhich contributions are counted.
FiltersBy location of engagement. For example:
Repository authorsIssue authorsCode review participants
3) Contributors 18
Mailing list authorsEvent participantsIRC authorsBlog authorsBy release cycleTimeframe of activity in the projectProgramming languages of the projectRole or function in project
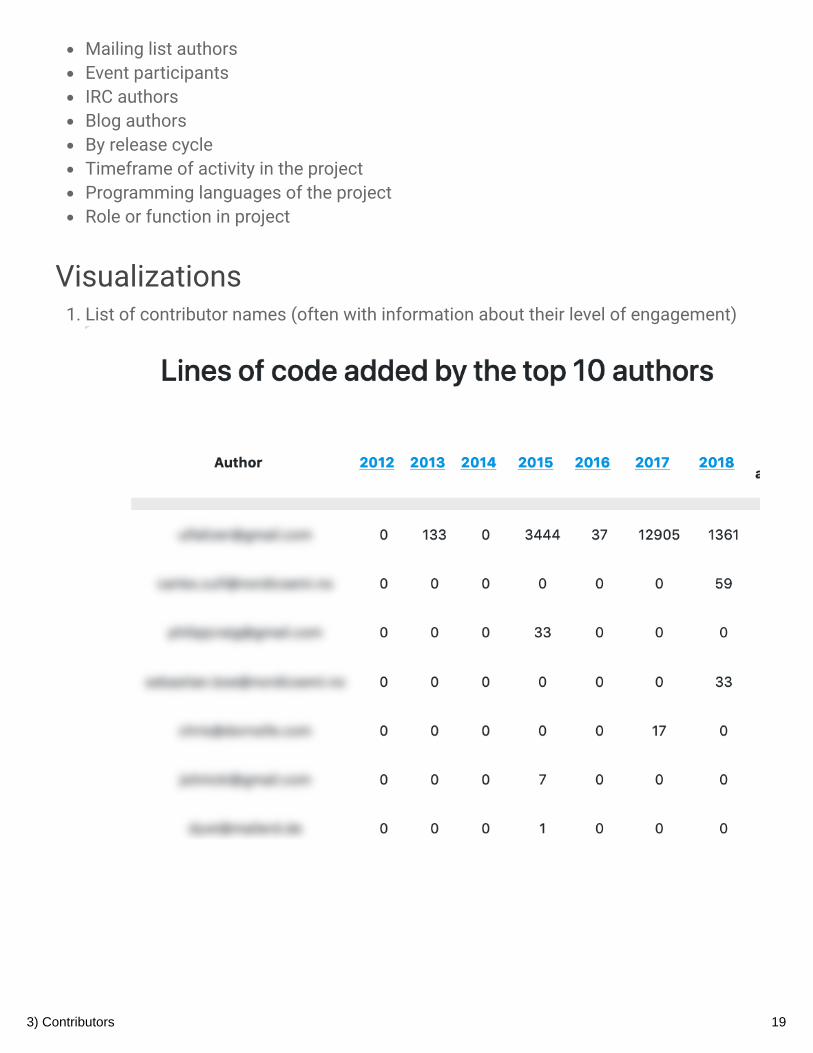
Visualizations1. List of contributor names (often with information about their level of engagement)
3) Contributors 19

2. Summary number of contributors
3. Change in the number of active contributors over time
3) Contributors 20

4. New contributors (sort list of contributors by date of �rst contribution)
Tools Providing the MetricGrimoireLabAugur
Data Collection StrategiesAs indicated above, some contributor information is available via software such asGrimoireLab and Augur. However, some contributor insights are less easily obtained viatrace data. In these cases, surveys with community members or event registrations canprovide the desired information. Sample questions include:
Interview question: Which contributors do not typically appear in lists ofcontributors?Interview question: Which contributors are often overlooked as importantcontributors because their contributions are more “behind the scenes”?Interview question: What other community members do you regularly work with?
Additionally, surveys with community members can provide insight to learn more aboutcontributions to the project. Sample questions include:
Likert scale [1-x] item: I am contributing to the project
3) Contributors 21

Matrix survey item: How often do you engage in the following activities in theproject?
Column headings: Never, Rarely(less than once a month), Sometimes (more thanonce a month), Often(once a week or more)Rows include: a) Contributing/reviewing code, b) Creating or maintainingdocumentation, c) Translating documentation, d) Participating in decisionmaking about the project’s development, e) Serving as a community organizer, f)Mentoring other contributors, g) Attending events in person, h) Participatingthrough school or university computing programs, i) Participating through aprogram like Outreachy, Google Summer of Code, etc., j) Helping with the ASFoperations (e.g., board meetings or fundraising)
References
3) Contributors 22

Organizational DiversityQuestion: What is the organizational diversity of contributions?
DescriptionOrganizational diversity expresses how many different organizations are involved in aproject and how involved different organizations are compared to one another.
ObjectivesGet a list of organizations contributing to a project.See the percentage of contributions from each organization within a de�ned periodof time.See the change of composition of organizations within a de�ned period of time.Get a list of people that are associated with each organization.
ImplementationCollect data from data sources where contributions occur.Identify contributor a�liations to get a good estimate of which organizations theybelong to.Correlate information about contributions, assigning each to appropriateorganization.Depending on the needs of the project, you may want to consider such issues ashow to handle multiple email addresses, a�liation changes over time, or contractorvs. employee.
Tools Providing the MetricGrimoireLab supports organizational diversity metrics out of the box. TheGrimoireLab SortingHat manages identities. The GrimoireLab Hatstall user interfaceallows correcting organizational a�liation of people and even recording a�liationchanges.
View an example visualization on the CHAOSS instance of Bitergia Analytics.4) Organizational Diversity 23

Download and import a ready-to-go dashboard containing examples for thismetric visualization from the GrimoireLab Sigils panel collection.Add a sample visualization to any GrimoreLab Kibiter dashboard following theseinstructions:
Create a new Pie chartSelect the all_onion index
Metrics Slice Size: Sum Aggregation, contributions Field, Contributions
Custom LabelBuckets Split Slices: Terms Aggregation, author_or_name Field,
metric: Contributions Order By, Descending Order, 500 Size,
Organization Custom Label
Example Screenshot
4) Organizational Diversity 24

LF Analytics provides organization diversity metrics in the primary view for commits,issues �led, and communication channels (current support for Slack and groups.io)
Data Collection StrategiesQualitative
Footprint of an organization in a project or ecosystemIn�uence of an organization in a project or ecosystemA�liation diversity in governance structures.
Quantitative
% of commits by each organization% of merges/reviews from each organization% of any kind of contributors from each organization% of lines of code contributed by each organization% issues �led by each organizationContributing Organizations - What is the number of contributing organizations?New Contributing Organizations - What is the number of new contributingorganizations?New Contributor Organizations - New organizations contributing to the project overtime.Number of Contributing Organizations - Number of organizations participating in theproject over time.
4) Organizational Diversity 25

Elephant Factor - If 50% of community members are employed by the samecompany, it is the elephant in the room. Formally: The minimum number ofcompanies whose employees perform 50% of the commitsA�liation Diversity - Ratio of contributors from a single company over allcontributors. Also described as: Maintainers from different companies. Diversity ofcontributor a�liation.In projects with the concept of code ownership, % of code owners a�liated witheach organization weighed by the importance/size/LoC of the code they own andthe number of co-owners.
ReferencesPotential implementations and references:
https://bitergia.gitlab.io/panel-collections/open_source_program_o�ce/organizational-diversity.htmlKata Containers dashboard entry page (bottom of this)Augur
4) Organizational Diversity 26

Attendees DemographicsQuestion: How diverse and inclusive are the attendees?
DescriptionAttendee demographics help indicate the potential for different viewpoints and broaderperspectives at an event.
ObjectivesDetermine if attendees are from diverse backgrounds. Determine if the diversity isshared across different event spaces like sessions and tracks. Help retain attendeesfrom diverse backgrounds for future events.
ImplementationFilters
demographics: Some subjective questions should be analyzed in light of theresponder’s demographics. Everyone has a different perspective. Investigating theresponses for each group of demographics can indicate whether somedemographics feel less included than the average.Keynotes, sessions, and tracks
Data Collection StrategiesInterview attendees to understand more about why the event did or did not meettheir diversity and inclusion expectations.
Interview question: What can this event do to improve the diversity and inclusionat this event?Interview question: What are some examples of how this event met, exceeded, orfell short of your diversity and inclusion expectations?
Survey speakers and attendees to learn to what extent the event met their diversityand inclusion expectations. Sample questions include:
5) Attendee Demographics 27

Likert scale [1-x] item (ask all attendees): How well did the event meet yourdiversity and inclusion expectations?Likert scale [1-x] item (ask all attendees): How was your diversity and inclusionexperience at this event?
Quantify the demographics of attendees.
Use registration data for attendee demographics (if available).Use a survey to gather attendee demographics. (For example, using the OpenDemographics questions)
References
5) Attendee Demographics 28

Code of Conduct at EventQuestion: How does the Code of Conduct for events support diversity and inclusion?
DescriptionA code of conduct describes rules of good behavior between event participants andwhat avenues are available when someone violates those expected good behaviors. Anevent with a code of conduct sends the signal that the organizers are willing to respondto incidences.
An event with a code of conduct sends the signal that the organizers are willing torespond to incidences, which helps people from all backgrounds feel included andcomfortable attending the event. Event participants are empowered to report incidencesand proactively help mitigate situations of unwanted behavior.
ObjectivesAn event organizer wants to make sure they have effective processes in place todeal with misbehaving attendees.An event organizer wants to make sure that participants have a positive experienceat the event.Event participants want to know how to report offensive behavior.Event participants want to know that they will be safe at an event.
ImplementationData Collection Strategies
Interview and/or survey participants to understand more about why the event codeof conduct did or did not meet their expectations.
What can this event do to improve the code of conduct at this event?What are some examples of how this event met or exceeded your code ofconduct expectations?
6) Code of Conduct at Event 29
Are participants required to accept the code of conduct before completingregistration?
Observe event website for a code of conduct.Observe whether a code of conduct is posted at an event.Observe that code of conduct has a clear avenue for reporting violations at theevent.Observe that code of conduct/event website provides information about possibleways to provide support victims of inappropriate behaviour, eventually links toexternal bodies?Browse the event website. If code of conduct is posted and there is a clear avenuefor reporting violations at the event, this criteria is ful�lled. (Note: ideally, the code ofconduct would be discoverable)As an attendee or event staff, observe whether participants will have an easy time�nding a code of conduct posted at the event. Having a code of conduct prominentlyposted at a registration site may be useful.Survey participants about the code of conduct:
Likert scale [1-x] item: How well did the event meet your code of conductexpectations.On registration, and during the event were you made aware of the code ofconduct and how to report violations? [i]Did the existence of the code of conduct make you feel safer, and moreempowered to fully participate at this event? [i]If you reported a violation of the code of conduct, was it resolved to yoursatisfaction? [i]
ReferencesAttendee Procedure For Incident Handling2018 Pycon Code Of ConductConference anti-harassmentWomen In Tech Manifesto
[i] Some sample questions re-used from the Mozilla project.
6) Code of Conduct at Event 30

Diversity Access TicketsQuestion: How are Diversity Access Tickets used to support diversity and inclusion foran event?
DescriptionInviting diverse groups of people may be made explicit by offering speci�c tickets forthem. These tickets may be discounted to add further incentive for members of theinvited groups to attend. A popular example are reduced tickets for students.
Diversity access tickets can enable community members to attend events andencourage new members to join. Especially unemployed, underemployed, or otherwiseeconomically disadvantaged people may otherwise be excluded from attending anevent. Furthermore, diversity access tickets can encourage additional contributions andongoing contributions.
ObjectivesDemonstrate effectiveness of increasing diversity at events.Enable attendees to attend who could not without a discount due to their economicsituation.Encourage members from underrepresented groups to attend.Track effectiveness of outreach efforts.
ImplementationData Collection Strategies
Observe website for availability and pricing of diversity access tickets.
How many (different) diversity access tickets are available?What are the criteria for qualifying for a diversity access ticket?What is the price difference between regular and diversity access tickets?Are regular attendees encouraged to sponsor diversity access tickets?Are sponsors of diversity access tickets named?
7) Diversity Access Tickets 31
Are numbers from previous conferences displayed on website about how manydiversity access tickets were used?
Interview organizers:
How were the diversity access tickets allocated?How many (different) diversity access tickets are available?What are the criteria for qualifying for a diversity access ticket?How many attendees used diversity access tickets?Where did you advertise diversity access tickets?If any, who sponsored diversity access tickets?
Survey participants about perception of diversity access tickets.
Likert scale [1-x] item: The availability of discounted student [replace withwhatever group was invited] tickets was effective in increasing participation ofstudents [or other group].True/False item: I was aware that [this conference] provided diversity accesstickets.True/False/Don't Know item: I quali�ed for a diversity access ticket.True/False item: A diversity access ticket enabled me to attend [this conference].
Track attendance numbers based on diversity access tickets.
Count use of different discount codes to track outreach effectiveness and whichgroups make use of the diversity access tickets. Requires conferenceregistration system that tracks use of discount codes.Count at each event, how many diversity access tickets were sold or given outand compare this to how many participants with those tickets sign-in at theevent.
Referenceshttps://diversitytickets.org/https://internetfreedomfestival.org/internet-freedom-festival-diversity-inclusion-fund/
7) Diversity Access Tickets 32

Event Diversity - FamilyFriendlinessQuestion: How does enabling families to attend together support diversity and inclusionof the event?
DescriptionFamily friendliness at events can lower the barrier of entry for some attendees byallowing them to bring their family. This could include childcare, activities for children, ortracks at the event targeted at youths and families.
ObjectivesAn open source project wants to know whether an event is inclusive for attendeeswith families.An event organizer wants to know whether inviting people who are caregivers knowabout the availability of these family-oriented activities.A parent, guardian, or caregiver with children under the age of 18, want to know ifthey can bring their children.A parent, guardian, or caregiver, with children under the age of 18, with no option, butto bring their children, evaluate their ability to attend as a family.
ImplementationData Collection Strategies
Interview conference staff
Question: What services does the conference have for attendees who havechildren to take care of?Question: Do you have a mother’s room? If yes, describe.Question: Do you offer child care during the event? If yes, describe.Question, if childcare is offered, for what ages?
8) Family Friendliness 33

Question: Are there activities and care that support tweens/teens (youth) and notonly young children.Question: Do you have special sessions for children? If yes, describe.
Survey conference participants
Likert scale [1-x] item: How family friendly is the event?Likert scale [1-x] item: Anyone can bring their children to the event and know thatthey have things to do.Likert scale [1-x] item: Children have a place at the conference to play withoutdisturbing other attendees.
Analyze conference website [check list]
Does the conference promote having a mother’s room?Does the conference promote activities for children and youth?Does the conference promote family-oriented activities?Does the conference explicitly invite attendees to bring their children?Does the conference offer childcare, including youth space?
ReferencesChildcare at Conferences Toolkit by AdacareImproving Childcare at Conferences
8) Family Friendliness 34

keynotes
9) Speaker Demographics 35

Board/Council DiversityQuestion: What is the diversity within our governing board or council?
DescriptionA governance board or council comprises a group of people who steer an open sourceproject. Diversity in this important group is bene�cial to signal that the project embracesdiversity and that leadership roles are available to everyone. A diverse board or councilalso increases the chance that issues of members of a diverse background are heardand understood.
ObjectivesA project member needs to know that someone on the board or council is representingtheir interests. A board or council wants to make sure that it is not living in an echochamber. Having a diverse board or council helps others to see themselves re�ectedand advance in their careers. This metric helps the board to be aware of the currentsituation of the diversity of the board if compared to other areas such as technicalleaders or the community itself.
ImplementationData Collection Strategies
Observe whether open elections are held to see if candidates are representative ofthe member base. (Note: elections typically favor candidates of majorities and donot ensure that minorities are represented after the election)Observe the diversity of board or council members from the project webpage(limitation: demographics are not always self-evident).Ask the board for a report of the diversity of the board or council.Survey project members about their perceived diversity of the board or council.
Likert scale [1-x] item: I feel represented in the board or council.Likert scale [1-x] item: The board or council attentive to minorities within theproject.
10) Board Council Diversity 36

Likert scale [1-x] item: The board or council represents the diversity of the projectcommunity.
Referenceshttps://www.openstack.org/foundation/2018-openstack-foundation-annual-reporthttps://www.linuxfoundation.org/about/diversity-inclusiveness/
10) Board Council Diversity 37

Code of Conduct for ProjectQuestion: How does the Code of Conduct for the project support diversity and inclusion?
DescriptionA code of conduct signals to project members what behavior is acceptable. A code ofconduct also provides enforcement mechanisms to deal with people who misbehave.
ObjectivesA code of conduct in a project provides the following:
Knowing that a community takes diversity and inclusion seriously.Evaluating a community for diverse and inclusive design, before investing any time inthat project.Identifying whether or not their demographic is protected prior to participating in aproject.Ensuring that project partnerships, and allies take diversity and inclusion seriously asit can impact their own reputation and community health.Understanding how a violation is reported and handled.Observing that the code of conduct is being enforced; and not just the potential forenforcement.
ImplementationTools Providing the Metric
Mozilla Code of Conduct Assessment Tool
Data Collection StrategiesIdentify the location of the code of conduct as it pertains to primary areas ofinteraction and participation in projects and events (i.e., repo root, event entrance,communication channels).
11) Code of Conduct 38

Survey project members about their perception of how a code of conduct in�uencestheir participation and sense of safety.Follow-up survey for reporting, around discoverability, clarity, and relevance.
Qualitative
Code of Conduct passes Mozilla’s Code of Conduct Assessment ToolInterview and/or survey community members to understand more about why thecode of conduct does or does not meet their expectations.
What can the project do to improve the code of conduct?What are some examples of how this community met or exceeded your code ofconduct expectations?
Quantitative
Browse the project website. If code of conduct is posted and there is a clear avenuefor reporting violations, this criteria is ful�lled. (Note: ideally, the code of conductwould be discoverable)Survey participants about the code of conduct:
Likert scale [1-x] item: How well did the project meet your code of conductexpectations?Likert scale [1-x] item: How clear are you on the rights and responsibilites ofcommunity members as described in the code of conduct?Were you made aware of the code of conduct and how to report violations? [i]Did the existence of the code of conduct make you feel safer, and moreempowered to fully participate in this project? [i]If you reported a violation of the code of conduct, was it resolved to yoursatisfaction? [i]
ReferencesCHAOSS metric: Code of Conduct at Events
[i] Some sample questions re-used from the Mozilla project.
11) Code of Conduct 39

MentorshipQuestion: How effective are our mentorship programs at supporting diversity andinclusion in our project?
DescriptionMentorship programs are a vital component in growing and sustaining a community byinviting newcomers to join a community and helping existing members grow within acommunity, thereby ensuring the health of the overall community. Through mentorshipprograms, we can invite diverse contributors and create inclusive environments forcontributors to grow and ideally give back to the community.
ObjectivesTo increase the number and diversity of new contributors as well as increase the level ofcontributions from each contributor. To increase the number of and diversity ofcontributors, encouraging them to grow into new roles with increasing responsibilitywithin a community. To increase the number of advocates/evangelists for a project aswell as the number of paid mentors and mentees. To cultivate a culture of inclusivitythrough identifying and supporting mentors and mentees.
ImplementationData Collection Strategies
Interview mentors and mentees
Ask community members about existing formal or informal mentorshipprograms
Observe people informally mentoring new contributorsObserve contributions that mentees make during and after the mentorship programObserve the trajectory of mentees within a project during and after the mentorshipprogram
Mentee became a subject matter expert12) Mentorship 40

Mentee is integrated into the communityMentee is comfortable asking for help from anyone in the communityMentee grew their professional networkMentee has taken on responsibilities within the communityMentee contributes to the community after the end of the mentorship projectObserve the retention rate of mentees vs the usual retention rate in thecommunity
Observe the nature of the mentorship program
Variety of projects participating in a mentorship program (e.g., in the OpenStackGender Report a few of them were participating)Variety of mentorship programs across a project ecosystem targeting differentcontribution levels (e.g., contribution ladder, onion layers)Number of o�cial mentors in the mentorship programs
Mentors experience (rounds or years mentored)How many mentors repeat the position in the following years
Survey mentors and mentees
Survey Likert item (1-x): I have found the mentoring experience personallyrewarding.Survey Likert item (1-x): I would recommend mentoring for this community.Mentor survey feedback:
What training did you receive that helped your mentoring activity?What community support was helpful for your mentoring activity?What communication channels did you use for mentoring?What are the �rst things you do with a new mentee?
Collect demographic information from mentors and mentees
Number of mentees who �nished a mentorship program (assumes atime/project bound mentorship program like GSoC, Outreachy, orCommunityBridge)Number of mentees who started a mentorshipNumber of mentors in the communityNumber of diverse menteesGeographic distribution of mentees
ReferencesGSoC Mentor Guide
12) Mentorship 41

GSoC Student GuideEsther Schindler, 2009. Mentoring in Open Source Communities: What Works? WhatDoesn't?OpenStack Gender Report: Mentorship focused
12) Mentorship 42

SponsorshipQuestion: How effective are long-time members who sponsor people in supportingdiversity and inclusion in a community?
DescriptionSponsoring a community member is different from mentoring (4). A mentor providesguidance, shares experience, and challenges a mentee to grow. A mentor can be fromoutside a community. In contrast, a sponsor is someone within the community who putstheir reputation on the line to create opportunities for the sponsee to move up in thecommunity.
Sponsoring is only recently adopted in industry. Sponsorship is an effective leadershiptactic for increasing diversity. Sponsored people are 90 percent less likely to perceivebias in a community (1). A sponsee knows that their sponsor has their back andchampions for them to get opportunities in the community. A sponsee is likely to go intoa community or experience with a peace of mind that they know that someone wishesthe best for them and wants to recognize them. This is effective to overcome protégésprevious negative experiences possibly tied to their different or diverse background. Asponsor puts their reputation on the line to advance the protégés trajectory within thecommunity.
ObjectivesRetain new members longer.Grow base of contributors, and convert newer (or less active) members into moreactive members, and ultimately, leaders in the communityFoster stronger community bonds between members.Reduce perceived bias within the community.Give new members from different backgrounds a chance.Guide and train new members for new responsibilities and increased leadership.Demonstrate dedication toward increasing diversity and inclusion and promotesponsorship activity through blogs, speaking, and press interviews.Recognize potential subject matter experts with diverse backgrounds to sponsor.Convert sponsees into sponsors, continue the cycle.
13) Sponsorship 43

ImplementationData Collection Strategies
Interview members:
For protégés: In what ways has the sponsorship program helped you becomemore successful?In what ways has the sponsorship program improved diversity and inclusionwithin the project?In what ways could the sponsorship program be improved?Did the sponsorship program help you gain more responsibility and/or moreleadership within the project?Capture information about potential diverse proteges in events/meetups
Have you sponsored someone who identi�es as a different gender than you?Exchange gender with any dimension of interest from the Dimensions ofDemographics.
Survey members:
Survey members: “Do you consider yourself to be sponsoring other members?”Survey protégés: “Do you have a sponsor helping you?”Likert scale [1-x] item: I am sponsoring other members.Likert scale [1-x] item: I am sponsoring members who are different from me.Likert scale [1-x] item: I have a sponsor within the community who puts theirreputation on the line to advocate for me.Likert scale [1-x] item: How effective is the sponsorship program?
Referenceshttps://fortune.com/2017/07/13/implicit-bias-perception-costs-companies/Sponsor Effect 2.0: Road Maps for Sponsors and Protégés
By Center for Talent Innovation (Pay Link)http://www.talentinnovation.org/publication.cfm?publication=1330The Key Role of Sponsorship:https://inclusion.slac.stanford.edu/sites/inclusion.slac.stanford.edu/�les/The_Key_
Perceived unfairness is a major reason to leave a communityhttps://www.kaporcenter.org/tech-leavers/
Sponsors Need to Stop Acting Like MentorsBy Julia Taylor Kennedy and Pooja Jain-Link
13) Sponsorship 44

https://hbr.org/2019/02/sponsors-need-to-stop-acting-like-mentors
13) Sponsorship 45

Code ChangesQuestion: How many changes were made to the source code during a speci�ed period?
DescriptionThese are changes to the source code during a certain period. For "change" we considerwhat developers consider an atomic change to their code. In other words, a change issome change to the source code which usually is accepted and merged as a whole, andif needed, reverted as a whole too. For example, in the case of git, each "change"corresponds to a "commit", or, to be more precise, "code change" corresponds to the partof a commit which touches �les considered as source code.
ObjectivesVolume of coding activity. Code changes are a proxy for the activity in a project. Bycounting the code changes in the set of repositories corresponding to a project, youcan have an idea of the overall coding activity in that project. Of course, this metric isnot the only one that should be used to track volume of coding activity.
ImplementationAggregators:
Count. Total number of changes during the period.
Parameters:
Period of time. Start and �nish date of the period. Default: forever. Period duringwhich changes are considered.Criteria for source code. Algorithm. Default: all �les are source code. If focused onsource code, criteria for deciding whether a �le is a part of the source code or not.
Filters14) Code Changes 46

By actors (author, committer). Requires actor merging (merging ids corresponding tothe same author).By groups of actors (employer, gender...). Requires actor grouping, and likely, actormerging.By tags (used in the message of the commits). Requires a structure for the messageof commits. This tag can be used in an open-source project to communicate to everycontributors if the commit is, for example, a �x for a bug or an improvement of afeature.
VisualizationsCount per month over timeCount per group over time
These could be represented as bar charts, with time running in the X axis. Each barwould represent a code changes during a certain period (eg, a month).
Tools Providing the MetricGrimoireLab provides this metric out of the box.
View an example on the CHAOSS instance of Bitergia Analytics.Download and import a ready-to-go dashboard containing examples for thismetric visualization from the GrimoireLab Sigils panel collection.Add a sample visualization to any GrimoreLab Kibiter dashboard following theseinstructions:
Create a new Vertical Bar chart
Select the git index
Y-axis: Unique Count Aggregation, hash Field, # Commits Custom Label
X-axis: Date Histogram Aggregation, grimoire_creation_date Field, Auto
Interval, Time Custom Label
14) Code Changes 47

Example screenshot:
Augur provides this metric both as Code Changes and as Code Changes Lines. Bothmetrics are available in both the repo and the repo_group metric forms - more on
that in the Augur documentation.Gitdm
Data Collection StrategiesSpeci�c description: Git
See reference implementation for git
Mandatory parameters (for Git):
Date type. Either author date or committer date. Default: author date.For each git commit, two dates are kept: when the commit was authored, and when itwas committed to the repository. For deciding on the period, one of them has to beselected.Include merge commits. Boolean. Default: True.Merge commits are those which merge a branch, and in some cases are notconsidered as re�ecting a coding activity.Include empty commits. Boolean. Default: True.Empty commits are those which do not touch �les, and in some cases are notconsidered as re�ecting a coding activity.
14) Code Changes 48

Referenceshttps://www.odoo.com/documentation/13.0/reference/guidelines.html#tag-and-module-name
14) Code Changes 49

Code Changes LinesQuestion: What is the sum of the number of lines touched (lines added plus linesremoved) in all changes to the source code during a certain period?
DescriptionWhen introducing changes to the source code, developers touch (edit, add, remove) linesof the source code �les. This metric considers the aggregated number of lines touchedby changes to the source code performed during a certain period. This means that if acertain line in a certain �le is touched in three different changes, it will count as threelines. Since in most source code management systems it is di�cult or impossible to tellaccurately if a lines was removed and then added, or just edited, we will consider editinga line as removing it and later adding it back with a new content. Each of those(removing and adding) will be considered as "touching". Therefore, if a certain line in acertain �le is edited three times, it will count as six different changes (three removals,and three additions).
For this matter, we consider changes to the source code as de�ned in Code Changes.Lines of code will be any line of a source code �le, including comments and blank lines.
ObjectivesVolume of coding activity:Although code changes can be a proxy to the coding activity of a project, not allchanges are the same. Considering the aggregated number of lines touched in allchanges gives a complementary idea of how large the changes are, and in general,how large is the volume of coding activity.
ImplementationAggregators:
Count. Total number of lines changes (touched) during the period.
15) Code Changes Lines 50

Parameters:
Period of time: Start and �nish date of the period. Default: forever.Period during which changes are considered.Criteria for source code; Algorithm Default: all �les are source code.If we are focused on source code, we need a criterion for deciding whether a �le is apart of the source code or not.Type of source code change:
Lines addedLines removedWhitespace
FiltersBy actors (author, committer). Requires actor merging (merging ids corresponding tothe same author).By groups of actors (employer, gender...). Requires actor grouping, and likely, actormerging.By tags (used in the message of the commits). Requires a structure for the messageof commits. This tag can be used in an open-source project to communicate to everycontributors if the commit is, for example, a �x for a bug or an improvement of afeature.
VisualizationsCount per month over timeCount per group over time
These could be represented as bar charts, with time running in the X axis. Each barwould represent a code changes during a certain period (eg, a month).
Tools Providing the MetricGrimoireLab provides this metric out of the box.
View an example on the CHAOSS instance of Bitergia Analytics.Download and import a ready-to-go dashboard containing examples for thismetric visualization from the GrimoireLab Sigils panel collection.Add a sample visualization to any GrimoreLab Kibiter dashboard following theseinstructions:
15) Code Changes Lines 51

Create a new Area chart
Select the git index
Y-axis 1: Sum Aggregation, lines_added Field, Lines Added Custom Label
Y-axis 2: Sum Aggregation, painless_inverted_lines_removed_git Field,
Lines Removed Custom Label
X-axis: Date Histogram Aggregation, grimoire_creation_date Field, Auto
Interval, Time Custom Label
Example screenshot:
Data Collection StrategiesSpeci�c description: Git
In the cases of git, we de�ne "code change" and "date of a change" as we detail in CodeChanges. The date of a change can be de�ned (for considering it in a period or not) asthe author date or the committer date of the corresponding git commit.
15) Code Changes Lines 52

Since git provides changes as diff patches (list of lines added and removed), each ofthose lines mentioned as a line added or a line removed in the diff will be considered asa line changed (touched). If a line is removed and added, it will be considered as two"changes to a line".
Mandatory parameters:
Kind of date. Either author date or committer date. Default: author date.For each git commit, two dates are kept: when the commit was authored, and when itwas committed to the repository. For deciding on the period, one of them has to beselected.Include merge commits. Boolean. Default: True.Merge commits are those which merge a branch, and in some cases are notconsidered as re�ecting a coding activity
Referenceshttps://www.odoo.com/documentation/13.0/reference/guidelines.html#tag-and-module-name
15) Code Changes Lines 53

Reviews AcceptedQuestion: How many accepted reviews are present in a code change?
DescriptionReviews are de�ned as in Reviews. Accepted reviews are those that end with thecorresponding changes �nally merged into the code base of the project. Acceptedreviews can be linked to one or more changes to the source code, those correspondingto the changes proposed and �nally merged.
For example, in GitHub when a pull request is accepted, all the commits included in it aremerged (maybe squashed, maybe rebased) in the corresponding git repository. Thesame can be said of GitLab merge requests. In the case of Gerrit, a code review usuallycorresponds to a single commit.
ObjectivesVolume of coding activity.Accepted code reviews are a proxy for the activity in a project. By counting acceptedcode reviews in the set of repositories corresponding to a project, you can have anidea of the overall coding activity in that project that leads to actual changes. Ofcourse, this metric is not the only one that should be used to track volume of codingactivity.
ImplementationAggregators:
Count. Total number of accepted reviews during the period.Ratio. Ratio of accepted reviews over total number of reviews during that period.
Parameters:
16) Reviews Accepted 54

Period of time. Start and �nish date of the period during which accepted reviews areconsidered. Default: forever.Criteria for source code. Algorithm. Default: all �les are source code.If we focus on source code, we need a criterion for deciding whether a �le belongs tothe source code or not.
FiltersBy actor type (submitter, reviewer, merger). Requires merging identitiescorresponding to the same actor.By groups of actors (employer, gender... for each of the actors). Requires actorgrouping, and likely, actor merging.
VisualizationsCount per time period over timeRatio per time period over time
These could be grouped by actor type or actor group by applying the �lters de�nedabove. These could be represented as bar charts, with time running in the X axis. Eachbar would represent accepted reviews to change the code during a certain period (eg, amonth).
Tools Providing the MetricGrimoirelab provides this metric out of the box for GitHub Pull Requests and alsoprovides data to build similar visualizations for GitLab Merge Requests and GerritChangesets.
View an example on the CHAOSS instance of Bitergia Analytics.Download and import a ready-to-go dashboard containing examples for thismetric visualization based on GitHub Pull Requests data from the GrimoireLabSigils panel collection.Add a sample visualization for GitHub Pull requests to any GrimoreLab Kibiterdashboard following these instructions:
Create a new Timelion visualization.
Select Auto as Interval.
Paste the following Timelion Expression:
16) Reviews Accepted 55

The expression, step by step:.es() : used to de�ne an ElasticSearch query.
index=git : use git index.
q="title:Merge* OR files:0" : heuristic to �lter in merges.
timefield=grimoire_creation_date : time will be based on commit
creation date (as our query looks for merge commits, it should be thedate in which the merge was effectively done).
.bars() : draw bars instead of lines.
.color() and .label() : some formatting options.
If you wish to get also the trend, use this instead (i.e. repeating the sameexpression twice and calling trend() the second time):
As discussed above for GitHub case, sometimes is not easy to identifymerges. As you probably noticed, in this example we based our expressionon GrimoireLab Git index. Besides, it could be applied to any other similarenvironment using Git repositories, not only to GitHub.
.es(index=git, q="title:Merge* OR files:0", timefield=grimoire_creation_da
.es(index=git, q="title:Merge* OR files:0", timefield=grimoire_creation_da
.es(index=git, q="title:Merge* OR files:0", timefield=grimoire_creation_da
16) Reviews Accepted 56

Example screenshot:
Data Collection StrategiesSpeci�c description: GitHub
In the case of GitHub, accepted reviews are de�ned as "pull requests whose changes areincluded in the git repository", as long as it proposes changes to source code �les.
Unfortunately, there are several ways of accepting reviews, not all of them making it easyto identify that they were accepted. The easiest situation is when the pull request isaccepted and merged (or rebased, or squashed and merged). In that case, the pullrequest can easily be identi�ed as accepted, and the corresponding commits can befound via queries to the GitHub API.
But reviews can also be closed, and commits merged manually in the git repository. Inthis case, commits may still be found in the git repository, since their hash is the samefound in the GitHub API for those in the pull request.
In a more di�cult scenario, reviews can also be closed, and commits rebased, or maybesquashed and then merged, manually. In these cases, hashes are different, and only anapproximate matching via dates and authors, and/or comparison of diffs, can be used totrack commits in the git repository.
From the point of view of knowing if they were accepted, the problem is that if they areincluded in the git repository manually, the only way of knowing that the pull request was
16) Reviews Accepted 57

accepted is �nding the corresponding commits in the git repository.
In some cases, projects have policies of mentioning the commits when the pull requestis closed (such as "closing by accepting commits xxx and yyyy"), which may help to trackcommits in the git repository.
Mandatory parameters (for GitHub):
Heuristic for detecting accepted pull requests not accepted via the web interface.Default: None.
Speci�c description: GitLab
In the case of GitLab, accepted reviews are de�ned as "merge requests whose changesare included in the git repository", as long as it proposes changes to source code �les.
Mandatory parameters (for GitLab):
Heuristic for detecting accepted pull requests not accepted via the web interface.Default: None.
Speci�c description: Gerrit
In the case of Gerrit, accepted reviews are de�ned as "changesets whose changes areincluded in the git repository", as long as they proposes changes to source code �les.
Mandatory parameters (for Gerrit): None.
References
16) Reviews Accepted 58

Reviews DeclinedQuestion: What reviews of code changes ended up declining the change during a certainperiod?
DescriptionReviews are de�ned as in Reviews. Declined reviews are those that are �nally closedwithout being merged into the code base of the project.
For example, in GitHub when a pull request is closed without merging, and the commitsreferenced in it cannot be found in the git repository, it can be considered to be declined(but see detailed discussion below). The same can be said of GitLab merge requests. Inthe case of Gerrit, code reviews can be formally "abandoned", which is the way ofdetecting declined reviews in this system.
ObjectivesVolume of coding activity. Declined code reviews are a proxy for the activity in aproject. By counting declined code reviews in the set of repositories correspondingto a project, you can have an idea of the overall coding activity in that project that didnot lead to actual changes. Of course, this metric is not the only one that should beused to track volume of coding activity.
ImplementationAggregators:
Count. Total number of declined reviews during the period.Ratio. Ratio of declined reviews over the total number of reviews during that pariod.
Parameters:
Period of time. Start and �nish date of the period during which declined reviews areconsidered. Default: forever.
17) Reviews Declined 59

Criteria for source code. Algorithm. Default: all �les are source code.If we focus on source code, we need a criterion to decide whether a �le belongs tothe source code or not.
FiltersBy actors (submitter, reviewer, merger). Requires merging identities corresponding tothe same actor.By groups of actors (employer, gender... for each of the actors). Requires actorgrouping, and likely, actor merging.
VisualizationsCount per period over timeRatio per period over time
These could be grouped (per actor type, or per group of actors) by applying the �lters,and could be represented as bar charts, with time running in the X axis. Each bar wouldrepresent declined reviews during a certain period (eg, a month).
Data Collection StrategiesSpeci�c description: GitHub
In the case of GitHub, accepted reviews are de�ned as "pull requests that are closedwith their changes not being included in the git repository", as long as it proposeschanges to source code �les.
See the discussion in the speci�c description for GitHub in Reviews Accepted, since itapplies here as well.
Mandatory parameters (for GitHub):
Heuristic for detecting declined pull requests, telling apart those cases where thepull request was closed, but the changes were included in the git repositorymanually. Default: None.
Speci�c description: GitLab
17) Reviews Declined 60

In the case of GitLab, accepted reviews are de�ned as "merge requests that are closedwith their changes not being included in the git repository", as long as it proposeschanges to source code �les.
Mandatory parameters (for GitLab):
Heuristic for detecting declined merge requests, telling apart those cases where themerge request was closed, but the changes were included in the git repositorymanually. Default: None.
Speci�c description: Gerrit
In the case of Gerrit, declined reviews are de�ned as "changesets abandoned", as longas they propose changes to source code �les.
Mandatory parameters (for Gerrit): None.
References
17) Reviews Declined 61
Reviews DurationQuestion: What is the duration of time between the moment a code review starts and themoment it is accepted?
DescriptionReviews are de�ned as in Reviews. Accepted reviews are de�ned in Reviews Accepted.
The review duration is the duration of the period since the code review started, to themoment it ended (by being accepted and being merged in the code base). This onlyapplies to accepted reviews.
For example, in GitLab a merge request starts when a developer uploads a proposal for achange in code, opening a merge request. It �nishes when the proposal is �nallyaccepted and merged in the code base, closing the merge request.
In case there are comments or other events after the code is merged, they are notconsidered for measuring the duration of the code review.
ObjectivesDuration of acceptance of contributions processes. Review duration for acceptedreviews is one of the indicators showing how long does a project take beforeaccepting a contribution of code. Of course, this metric is not the only one thatshould be used to track volume of coding activity.
ImplementationAggregators:
Median. Median (50% percentile) of review duration for all accepted reviews in theconsidered period of time.
Parameters:18) Review Duration 62

Period of time. Start and �nish date of the period. Default: forever.Period during which accepted reviews are considered. An accepted review isconsidered to be in the period if its creation event is in the period.Criteria for source code. Algorithm. Default: all �les are source code.If we are focused on source code, we need a criteria for deciding whether a �le is apart of the source code or not.
FiltersBy actors (submitter, reviewer, merger). Requires actor merging (merging idscorresponding to the same author).By groups of actors (employer, gender... for each of the actors). Requires actorgrouping, and likely, actor merging.
VisualizationsMedian per month over timeMedian per group over time
These could be represented as bar charts, with time running in the X axis. Each barwould represent accepted reviews to change the code during a certain period (eg, amonth).
Distribution of durations for a certain period
These could be represented with the usual statistical distribution curves, or with barcharts, with buckets for duration in the X axis, and number of reviews in the Y axis.
Data Collection StrategiesSpeci�c description: GitHub
In the case of GitHub, duration is considered for pull requests that are accepted andmerged in the code base. For an individual pull request, duration starts when it isopened, and �nishes when the commits it includes are merged into the code base.
Mandatory parameters (for GitHub): None.
Speci�c description: GitLab18) Review Duration 63

In the case of GitLab, duration is considered for merge requests that are accepted andmerged in the code base. For an individual merge request, duration starts when it isopened, and �nishes when the commits it includes are merged into the code base.
Mandatory parameters (for GitLab): None.
Speci�c description: Gerrit
In the case of Gerrit, duration is considered for code reviews that are accepted andmerged in the code base. For an individual cod review, duration starts when it is opened,and �nishes when the commits it includes are merged into the code base.
Mandatory parameters (for Gerrit): None.
References
18) Review Duration 64
ReviewsQuestion: What new review requests for changes to the source code occurred during acertain period?
DescriptionWhen a project uses code review processes, changes are not directly submitted to thecode base, but are �rst proposed for discussion as "proposals for change to the sourcecode". Each of these proposals are intended to be reviewed by other developers, whomay suggest improvements that will lead to the original proposers sending new versionsof their proposals, until reviews are positive, and the code is accepted, or until it isdecided that the proposal is declined.
For example, "reviews" correspond to "pull requests" in the case of GitHub, to "mergerequests" in the case of GitLab, and to "code reviews" or in some contexts "changesets"in the case of Gerrit.
ObjectivesVolume of changes proposed to a project. Reviews are a proxy for the activity in aproject. By counting reviews to code changes in the set of repositoriescorresponding to a project, you can have an idea of the overall activity in reviewingchanges to that project. Of course, this metric is not the only one that should beused to track volume of coding activity.
ImplementationAggregators:
Count. Total number of reviews during the period.
Parameters:
19) Reviews 65

Period of time. Start and �nish date of the period. Default: forever.Period during which reviews are considered.Criteria for source code. Algorithm. Default: all �les are source code.If we are focused on source code, we need a criteria for deciding whether a �le is apart of the source code or not.
FiltersBy actors (submitter, reviewer, merger). Requires actor merging (merging idscorresponding to the same author).By groups of actors (employer, gender... for each of the actors). Requires actorgrouping, and likely, actor merging.
VisualizationsCount per month over timeCount per group over time
These could be represented as bar charts, with time running in the X axis. Each barwould represent reviews to change the code during a certain period (eg, a month).
Tools Providing the MetricGrimoirelab provides this metric out of the box for GitHub Pull Requests, GitLabMerge Requests and Gerrit Changesets.
View an example on the CHAOSS instance of Bitergia Analytics.Download and import a ready-to-go dashboard containing examples for thismetric visualization based on GitHub Pull Requests data from the GrimoireLabSigils panel collection.Add a sample visualization for GitHub Pull requests to any GrimoreLab Kibiterdashboard following these instructions:
Create a new Vertical Bar chart.
Select the github_issues index.
Filter: pull_request is true .
Metrics Y-axis: Count Aggregation, # Pull Requests Custom Label.
19) Reviews 66
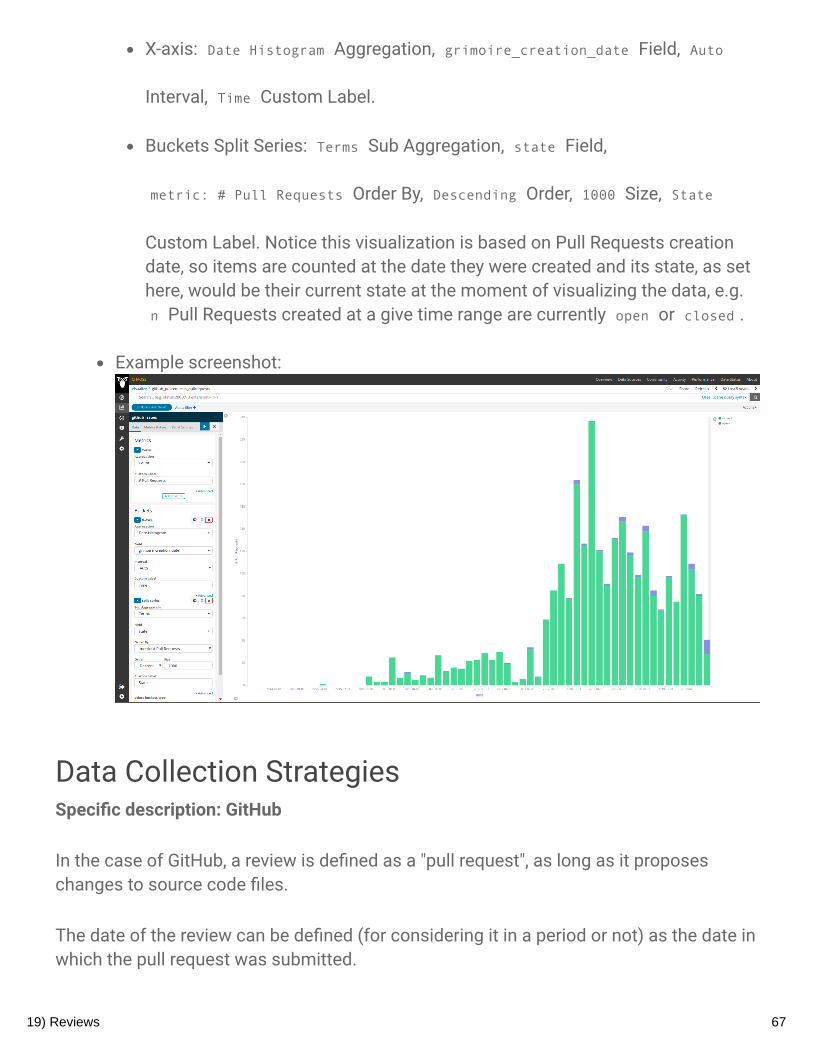
X-axis: Date Histogram Aggregation, grimoire_creation_date Field, Auto
Interval, Time Custom Label.
Buckets Split Series: Terms Sub Aggregation, state Field,
metric: # Pull Requests Order By, Descending Order, 1000 Size, State
Custom Label. Notice this visualization is based on Pull Requests creationdate, so items are counted at the date they were created and its state, as sethere, would be their current state at the moment of visualizing the data, e.g. n Pull Requests created at a give time range are currently open or closed .
Example screenshot:
Data Collection StrategiesSpeci�c description: GitHub
In the case of GitHub, a review is de�ned as a "pull request", as long as it proposeschanges to source code �les.
The date of the review can be de�ned (for considering it in a period or not) as the date inwhich the pull request was submitted.
19) Reviews 67
Speci�c description: GitLab
In the case of GitLab, a review is de�ned as a "merge request", as long as it proposeschanges to source code �les.
The date of the review can be de�ned (for considering it in a period or not) as the date inwhich the merge request was submitted.
Speci�c description: Gerrit
In the case of Gerrit, a review is de�ned as a "code review", or in some contexts, a"changeset", as long as it proposes changes to source code �les.
The date of the review can be de�ned (for considering it in a period or not) as the date inwhich the code review was started by submitting a patchset for review.
References
19) Reviews 68

New IssuesQuestion: How many new issues are created during a certain period?
DescriptionProjects discuss how they are �xing bugs, or adding new features, in tickets in the issuetracking system. Each of these tickets (issues) are opened (submitted) by a certainperson, and are later commented and annotated by many others.
Depending on the issue system considered, an issue can go through several states (forexample, "triaged", "working", "�xed", "won't �x"), or being tagged with one or more tags,or be assigned to one or more persons. But in any issue tracking system, an issue isusually a collection of comments and state changes, maybe with other annotations.Issues can also be, in some systems, associated to milestones, branches, epics orstories. In some cases, some of these are also issues themselves.
At least two "high level" states can usually be identi�ed: open and closed. "Open" usuallymeans that the issues is not yet resolved, and "closed" that the issue was alreadyresolved, and no further work will be done with it. However, what can be used to identifyan issue as "open" or "closed" is to some extent dependent on the issue tracking system,and on how a given project uses it. In real projects, �ltering the issues that are directlyrelated to source code is di�cult, since the issue tracking system may be used for manykinds of information, from �xing bugs and discussing implementation of new features,to organizing a project event or to ask questions about how to use the results of theproject.
In most issue trackers, issues can be reopened after being closed. Reopening an issuecan be considered as opening a new issue (see parameters, below).
For example, "issues" correspond to "issues" in the case of GitHub, GitLab or Jira, to "bugreports" in the case of Bugzilla, and to "issues" or "tickets" in other systems.
Objectives20) Issues New 69

Volume of issues discussed in a project. Issues are a proxy for the activity in a project.By counting issues discussing code in the set of repositories corresponding to a project,you can have an idea of the overall activity in discussing issues in that project. Ofcourse, this metric is not the only one that should be used to track volume of codingactivity.
ImplementationAggregators:
Count. Total number of new issues during the period.Ratio. Ratio of new issues over total number of issues during that period.
Parameters:
Period of time. Start and �nish date of the period during which issues areconsidered. Default: forever.Criterion for source code. Algorithm. Default: all issues are related to source code.If we focus on source code, we need a criterion for deciding whether an issue isrelated to the source code or not.Reopen as new. Boolean. Default: False.Criterion for de�ning whether reopened issues are considered as new issues.
FiltersBy actors (submitter, commenter, closer). Requires merging identities correspondingto the same author.By groups of actors (employer, gender... for each of the actors). Requires actorgrouping, and likely, actor merging.
VisualizationsCount per time period over timeRatio per time period over time
These could be grouped by applying the �lters de�ned above. These could berepresented as bar charts, with time running in the X axis. Each bar would representproposals to change the code during a certain period (eg, a month).
20) Issues New 70

Data Collection StrategiesSpeci�c description: GitHub
In the case of GitHub, an issue is de�ned as an "issue".
The date of the issue can be de�ned (for considering it in a period or not) as the date inwhich the issue was opened (submitted).
Speci�c description: GitLab
In the case of GitHub, an issue is de�ned as an "issue".
The date of the issue can be de�ned (for considering it in a period or not) as the date inwhich the issue was opened (submitted).
Speci�c description: Jira
In the case of Jira, an issue is de�ned as an "issue".
The date of the issue can be de�ned (for considering it in a period or not) as the date inwhich the issue was opened (submitted).
Speci�c description: Bugzilla
In the case of Bugzilla, an issue is de�ned as a "bug report", as long as it is related tosource code �les.
The date of the issue can be de�ned (for considering it in a period or not) as the date inwhich the bug report was opened (submitted).
References
20) Issues New 71
Issues ActiveQuestion: How many issues were active during a certain period?
DescriptionIssues are de�ned as in Issues New. Issues showing some activity are those that hadsome comment, or some change in state (including closing the issue), during a certainperiod.
For example, in GitHub Issues, a comment, a new tag, or the action of closing an issue, isconsidered as a sign of activity.
ObjectivesVolume of active issues in a project. Active issues are a proxy for the activity in aproject. By counting active issues related to code in the set of repositoriescorresponding to a project, you can have an idea of the overall activity in workingwith issues in that project. Of course, this metric is not the only one that should beused to track volume of coding activity.
ImplementationAggregators:
Count. Total number of active issues during the period.Ratio. Ratio of active issues over total number of issues during that period.
Parameters:
Period of time. Start and �nish date of the period during which issues areconsidered. Default: forever.Criteria for source code. Algorithm. Default: all issues are related to source code.If we focus on source code, we need a criterion for deciding whether an issue isrelated to the source code or not.
21) Issues Active 72

FiltersBy actor (submitter, commenter, closer). Requires merging identities correspondingto the same author.By groups of actors (employer, gender... for each of the actors). Requires actorgrouping, and likely, actor merging.
VisualizationsCount per period over timeRatio per period over time
These could be grouped by applying the previously de�ned �lters. These could berepresented as bar charts, with time running in the X axis. Each bar would representproposals to change the code during a certain period (eg, a month).
Tools Providing the MetricGrimoireLab provides data for computing a metric close to the one described in thispage for GitHub Issues, GitLab issues, Jira, Bugzilla and Redmine. In terms of themetric, GrimoireLab data have only the date of the last update of each item, whichlimits computing this metric to time ranges ending on the current date.
Depending on the source API, the de�nition of what is considered an update onthe issue could vary. GrimoireLab uses metadata__updated_on to store latest
issue update, please check Perceval documentation to look for the speci�c API�eld being used in each case and understand its limitations, if any.Currently, there is no dashboard showing this in action. Nevertheless, it is easy tobuild a visualization that shows the number uses which last activity occurred atsome point between a date and current date (we'll do it for GitHub Issues here).Add a sample visualization to any GrimoreLab Kibiter dashboard following theseinstructions:
Create a new Metric visualization.
Select the github_issues index.
Filter: pull_request is false .
Metric: Count Aggregation, # Issues Active Custom Label.
21) Issues Active 73

Buckets: Date Range Aggregation, metadata__updated_on Field, now-1M From
(or whatever interval may �t your needs), now To, leave Custom Label empty
to see the speci�c dates in the legend.Have a look at the time picker on the top right corner to make sure it is set toinclude the whole story of the data so we are not excluding any item basedon its creation date.
Example screenshot:
.
Data Collection StrategiesSpeci�c description: GitHub
In the case of GitHub, active issues are de�ned as "issues which get a comment, achange in tags, a change in assigned person, or are closed".
Speci�c description: GitLab
In the case of GitLab, active issues are de�ned as "issues which get a comment, achange in tags, a change in assigned person, or are closed".
Speci�c description: Jira
21) Issues Active 74

In the case of Jira, active issues are de�ned as "issues which get a comment, a changein state, a change in assigned person, or are closed".
Speci�c description: Bugzilla
In the case of Bugzilla, active issues are de�ned as "bug reports which get a comment, achange in state, a change in assigned person, or are closed".
References
21) Issues Active 75

Issues ClosedQuestion: How many issues were closed during a certain period?
DescriptionIssues are de�ned as in Issues New. Issues closed are those that changed to stateclosed during a certain period.
In some cases or some projects, there are other states or tags that could be consideredas "closed". For example, in some projects they use the state or the tag "�xed" for statingthat the issue is closed, even when it needs some action for formally closing it.
In most issue trackers, closed issues can be reopened after they are closed. Reopeningan issue can be considered as opening a new issue, or making void the previous close(see parameters, below).
For example, in GitHub Issues or GitLab Issues, issues closed are issues that wereclosed during a certain period.
ObjectivesVolume of issues that are dealt with in a project. Closed issues are a proxy for theactivity in a project. By counting closed issues related to code in the set of repositoriescorresponding to a project, you can have an idea of the overall activity in �nishing workwith issues in that project. Of course, this metric is not the only one that should be usedto track volume of coding activity.
ImplementationAggregators:
Count. Total number of active issues during the period.Ratio. Ratio of active issues over total number of issues during that period.
22) Issues Closed 76

Parameters:
Period of time. Start and �nish date of the period during which issues areconsidered. Default: forever.Criteria for source code. Algorithm. Default: all issues are related to source code.If we focus on source code, we need a criterion for deciding whether an issue isrelated to the source code or not. All issues could be included in the metric byaltering the default.Reopen as new. Boolean, de�ning whether reopened issues are considered as newissues. If false, it means the closing event previous to a reopen event should beconsidered as void. Note: if this parameter is false, the number of closed issues forany period could change in the future, if some of them are reopened.Criteria for closed. Algorithm. Default: having a closing event during the period ofinterest.
FiltersBy actors (submitter, commenter, closer). Requires merging identities correspondingto the same author.By groups of actors (employer, gender... for each of the actors). Requires actorgrouping, and likely, actor merging.
VisualizationsCount per time period over timeRatio per time period over time
These could be grouped by applying the �lters de�ned aboce. These could berepresented as bar charts, with time running in the X axis.
Tools Providing the MetricGrimoireLab provides data for computing this metric for GitHub Issues, GitLabissues, Jira, Bugzilla and Redmine. Current dashboards show information based oncreation date, that means they show current status of the issues that were createdduring a time period (e.g. GitHub Issues dashboard, you can see it in action).Nevertheless, it is easy to build a visualization that shows issues based on closingdate by following the next steps:
Add a sample visualization to any GrimoreLab Kibiter dashboard following theseinstructions:
22) Issues Closed 77

Create a new Vertical Bar chart.
Select the github_issues index.
Filter: pull_request is false .
Filter: state is closed .
Metrics Y-axis: Count Aggregation, # Closed Issues Custom Label.
Buckets X-axis: Date Histogram Aggregation, closed_at Field, Weekly
Interval (or whatever interval may �t your needs, depending on the whole timerange you wish to visualize in the chart), Time Custom Label.
Example screenshot:
.
Data Collection StrategiesSpeci�c description: GitHub
In the case of GitHub, closed issues are de�ned as "issues which are closed".
Speci�c description: GitLab
22) Issues Closed 78

In the case of GitLab, active issues are de�ned as "issues that are closed".
Speci�c description: Jira
In the case of Jira, active issues are de�ned as "issues that change to the closed state".
Speci�c description: Bugzilla
In the case of Bugzilla, active issues are de�ned as "bug reports that change to theclosed state".
References
22) Issues Closed 79
Issue AgeQuestion: How long have open issues been left open?
DescriptionThis metric is an indication of how long issues have been left open in the consideredtime period. If an issue has been closed but re-opened again within that period if will beconsidered as having remained open since its initial opening date.
ObjectivesWhen the issue age is increasing, identify the oldest open issues in a project to gaininsight as to why they have been open for an extended period of time. Additionally, tounderstand how well maintainers are resolving issues and how quickly issues areresolved.
ImplementationFor all open issues, get the date the issue was opened and calculate the number of daysto current date.
Aggregators:
Average. Average age of all open issues.Median. Median age of all open issues.
Parameters:
Period of time. Start and �nish date of the period during which open issues areconsidered. Default: forever (i.e., the entire observable period of the project's issueactivity).
Filters23) Issue Age 80

Module or working groupTags/labels on issue
Visualizations1. Summary data for open issues
2. Count of open issues per day
Tools Providing the MetricGrimoireLabAugur
23) Issue Age 81

Data Collection StrategiesFor speci�c descriptions of collecting data about closed issues, please refer to thecorresponding section of Issues New.
References
23) Issue Age 82

Issue Response TimeQuestion: How much time passes between the opening of an issue and a response inthe issue thread from another contributor?
DescriptionThis metric is an indication of how much time passes between the opening of an issuesand a response from other contributors.
This metric is a speci�c case of the Time to First Reponse metric in the Commonworking group.
ObjectivesLearn about the responsiveness of an open source community.
ImplementationAggregators:
Average. Average response time in days.Median. Median response time in days.
Parameters:
Period of time. Start and �nish date of the period. Default: forever.Period during which responses are counted.
Filtersresponse from role in project (e.g., �rst maintainer response)bot versus human (e.g., �lter out automated “welcome �rst contributor messages”)opened by role in project (e.g., responsiveness to new contributors versus long-timers)
24) Issue Response Time 83

date issue was openedstatus of issue (e.g., only look at currently open issues)
Visualizations
Tools Providing the MetricGrimoireLabAugur
Data Collection StrategiesLook at the Issues New metric for a de�niton of “issues.” Subtract the issue openedtimestamp from the �rst response timestamp. Do not count responses if created by theauthor of the issue.
References
24) Issue Response Time 84

Issue Resolution DurationQuestion: How long does it take for an issue to be closed?
DescriptionThis metric is an indication of how long an issue remains open, on average, before it isclosed. Issues are de�ned as in Issues Closed.
For issues that were reopened and closed again, only the last close date is relevant forthis metric.
ObjectivesThis metric can be used to evaluate the effort and time needed to conclude and resolvediscussions. This metric can also provide insights to the level of responsiveness in aproject.
ImplementationFor each closed issue:
Issue Resolution Duration = Timestamp of issue closed - Timestamp of issueopened
Aggregators:
Average. Average amount of time (in days, by default) for an issue in the repositoryto be closed.
Parameters:
Period of time. Start and �nish date of the period. Default: forever.Period during which issues are considered.
25) Issue Resolution Duration 85

FiltersBy time. Provides average issue resolution duration time starting from the providedbeginning date to the provided end date.
By open time. Provides information for how long issues created from theprovided beginning date to the provided end date took to be resolved.By closed time. Provides information for how long old issues were that wereclosed from the provided beginning date to the provided end date took to beresolved.
By actors (submitter, commenter, closer). Requires actor merging (merging idscorresponding to the same author).By groups of actors (employer, gender... for each of the actors). Requires actorgrouping, and likely, actor merging.
VisualizationsAverage over time (e.g. average for January, average for February, average for March,etc.)Average for a given time period (e.g. average for all of 2019, or average for Januaryto March)
Tools Providing the MetricAugur provides this metric as Closed Issue Resolution Duration. This metrics areavailable in both the repo and the repo_group metric forms - more on that in the
Augur documentation.
Data Collection StrategiesFor speci�c descriptions of collecting data about closed issues, please refer to thecorresponding section of Issues Closed.
References
25) Issue Resolution Duration 86

New Contributors ClosingIssuesQuestion: How many contributors are closing issues for the �rst time in a given project?
DescriptionThis metric is an indication of the volume of contributors who are closing issues for their�rst time within a given project. When a contributor closes an issue for the �rst time it issome indication of "stickiness" of the individual within that project, especially forcontributors who are not also committers.
ObjectivesTo know how contributors are moving through the contributor funnel by identifying“closing issues” as a milestone in the contributor journey.
ImplementationAggregators:
Count. Total number of contributors closing issues on this project for the �rst timeduring a given time period.Percentage. Proportion of contributors closing issues on this project for the �rsttime during a given time period, computed against all contributors having closedissues on this project during the same time period.
Parameters:
Period of time. Start and �nish date of the period during which new issue closers arecounted. Default: forever (i.e., the entire observable project lifetime)
Filters26) New Contributors Closing Issues 87

Exclude reopened issues (optionally, �lter if reopened in less than 1 hour)
VisualizationsTable with names of contributors who closed an issue for the �rst time and whenthat was.Timeline showing the time on the x-axis, and the aggregated metric value on the y-axis for �xed consecutive periods of time (e.g. on a monthly basis). Thisvisualisation allows to show how the metric is evolving over time for the consideredproject.
Data Collection StrategiesBased on the Issues Closed and Contributor de�nitions, enrich contributors with the dateof their �rst time closing an issue.
ReferencesContributor Funnel by Mike McQuaid
26) New Contributors Closing Issues 88

CommittersQuestion: How robust are the contributors to a community?
DescriptionThe Committers metric is the number of individuals who have committed code to aproject. This is distinct from the more broadly construed "Contributors" CHAOSS metric,speaking directly to the one speci�c concern that arises in the evaluation of risk bymanagers deciding which open source project to use. While not necessarily true in allcases, it is generally accepted that the more contributors there are to a project, the morelikely that project is to continue to receive updates, support, and necessary resources.The metric therefore allows organizations to make an informed decision as to whetherthe number of committers to a given project potentially poses a current or future riskthat the project may be abandoned or under-supported.
ObjectivesFrom the point of view of managers deciding among open source projects to incorporateinto their organizations, the number of committers sometimes is important. Codecontributions, speci�cally, can vary signi�cantly from larger scale contributor metrics(which include documentation authors, individuals who open issues, and other types ofcontributions), depending on the management style employed by an open sourceproject. McDonald et al (2014) drew attention to how different open source projects areled using an open, distributed model, while others are led following highly centralizedmodels. Fewer code contributors may indicate projects less open to outsidecontribution, or simply projects that have a small number of individuals who understandand contribute to the code base.
ImplementationIn an open source project every individual email address that has a commit merged intothe project is a "committer" (see "known issues" in the next section). Identifying thenumber of unique committers during a speci�c time period is helpful, and the formulafor doing so is simple:
27) Committers 89

Number_of_committers = distinct_contributor_ids (during some period of time with a beg
. For example, I may want to know how many distinct people have committed code to aproject in the past 18 months. Committers reveals the answer.
Known Issues with Data QualityMany contributors use more than one email, which may arti�cially elevate thenumber of total committers if these shared identities are not reconciled.Several committers making small, "drive by" contributions may arti�cially elevate thisnumber as well.
VisualizationsFrom Grimoire Lab showing committers
FiltersTime: Knowing the more recent number of distinct committers may more clearlyindicate the number of people engaged in a project than examining the number overa project's (repository's) lifetime.Commit Size: Small commits, as measured by lines of code, could be excluded toavoid a known issueCommit Count: Contributors with fewer than some minimum threshold of commitsin a time period could be excluded from this number.
27) Committers 90

Tools Providing the MetricAugur maintains a table for each commit record in a repository.
27) Committers 91
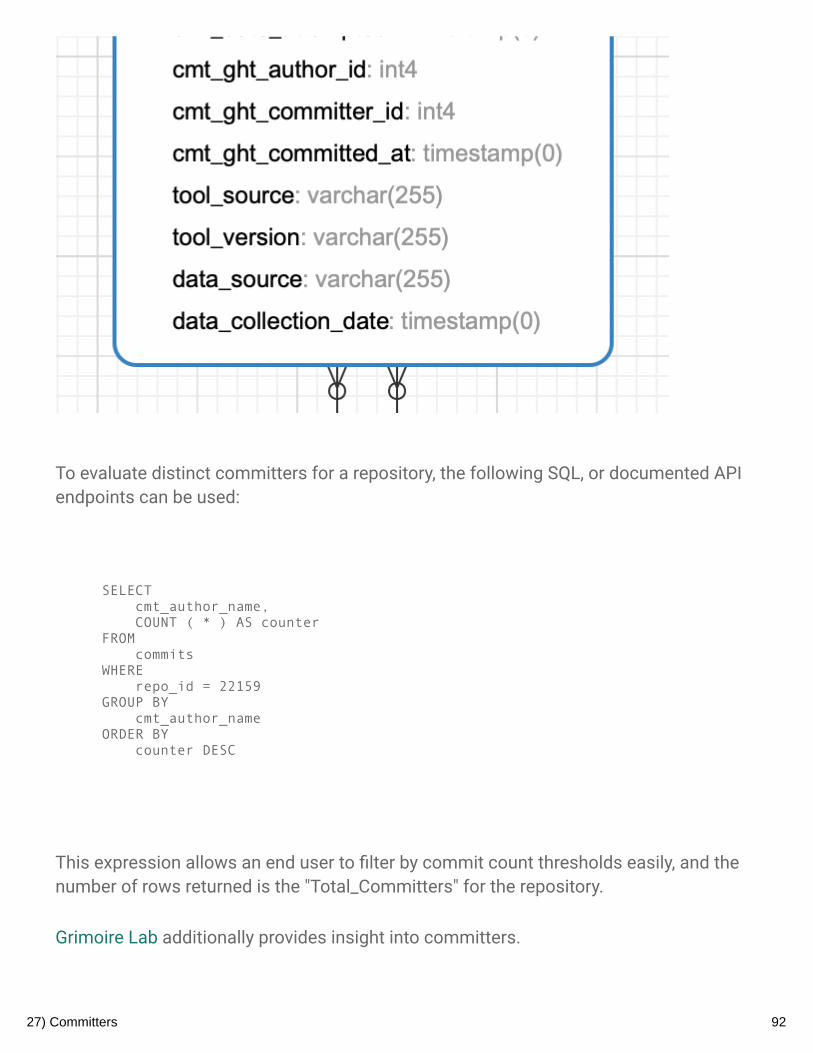
To evaluate distinct committers for a repository, the following SQL, or documented APIendpoints can be used:
SELECT cmt_author_name, COUNT ( * ) AS counter FROM commits WHERE repo_id = 22159GROUP BY cmt_author_name ORDER BY counter DESC
This expression allows an end user to �lter by commit count thresholds easily, and thenumber of rows returned is the "Total_Committers" for the repository.
Grimoire Lab additionally provides insight into committers.
27) Committers 92

References1. Nora McDonald, Kelly Blincoe, Eva Petakovic, and Sean Goggins. 2014. Modeling
Distributed Collaboration on GitHub. Advances in Complex Systems 17(7 & 8).
27) Committers 93

Elephant FactorQuestion: What is the distribution of work in the community?
DescriptionThe minimum number of companies whose employees perform a parameterizablede�nition of the total percentage of commits in a software repository is a project's'elephant factor'. For example, one common �lter is to say 50% of the commits areperformed by n companies and that is the elephant factor. One would begin adding up to
the parameterized percentage using the largest organizations making contributions, andthen the next largest and so on. So, for example, a project with 8 contributingorganizations who each contributed 12.5% of the commits in a project would, if theelephant factor is parameterized at 50%, have an elephant factor of "4". If one of thoseorganizations was responsible for 50% of commits in the same scenario, then theelephant factor would be "1".
Elephant Factor provides an easy-to-consume indication of the minimum number ofcompanies performing a certain percentage (i.e. 50%) of the work. The origin of the term"elephant factor" is not clearly delineated in the literature, though it may arise out of thegeneral identi�cation of software sustainability as a critical non-functional softwarerequirements by Venters et al (2014).
ObjectivesA company evaluating open source software products might use elephant factor tocompare how dependent a project is on a small set of corporate contributors. Projectswith low elephant factors are intuitively more vulnerable to decisions by one enterprisecascading through any enterprise consuming that tool. The parameterized �lter shouldreasonably be different for a project to which 1,000 organizations contribute than one towhich, perhaps 10 contribute. At some volume of organizational contribution, probablysomething less than 1,000 organizations, elephant factor is likely not a centralconsideration for software acquisition because reasonable managers will judge theproject not vulnerable to the decisions of a small number of actors. Such thresholds arehighly contextual.
28) Elephant Factor 94

ImplementationThe formula for elephant factor is a percentile calculation. If we have 8 organizationswho each contribute the following number of commits to a project: 1000,202,90,33,332,343,42,433 , then we can determine the elephant factor by �rst
identifying the 50th percentile of total commits for all the companies.
Summary: 50th percentile = 267, so the elephant factor is 4.
Full Solution:
1. Arrange the data in ascending order: 33, 42, 90, 202, 332, 343, 433, 10002. Compute the position of the pth percentile (index i):
1. i = (p / 100) * n), where p = 50 and n = 8
2. i = (50 / 100) * 8 = 4
3. The index i is an integer ⇒ the 50th percentile is the average of the values in the 3thand 4th positions (202 and 332 respectively)
4. Answer: the 50th percentile is (202 + 332) / 2 = 267, therefore the elephant factor = 4 .
FiltersTime: Reasonably the Elephant Factor will change if one takes a snapshot of anyprior time period, so the elephant factor over the life of a product may misrepresentthe current level of organizational diversity supported by the project.Repository Group: Many open source projects include multiple repositories, and insome cases examining all of the repositories associated with any given projectprovides a more complete picture of elephant factor.
Tools Providing the Metric1. Augur2. GrimoireLab provides this metric out of the box, not as a single number but as a
visualization.
28) Elephant Factor 95
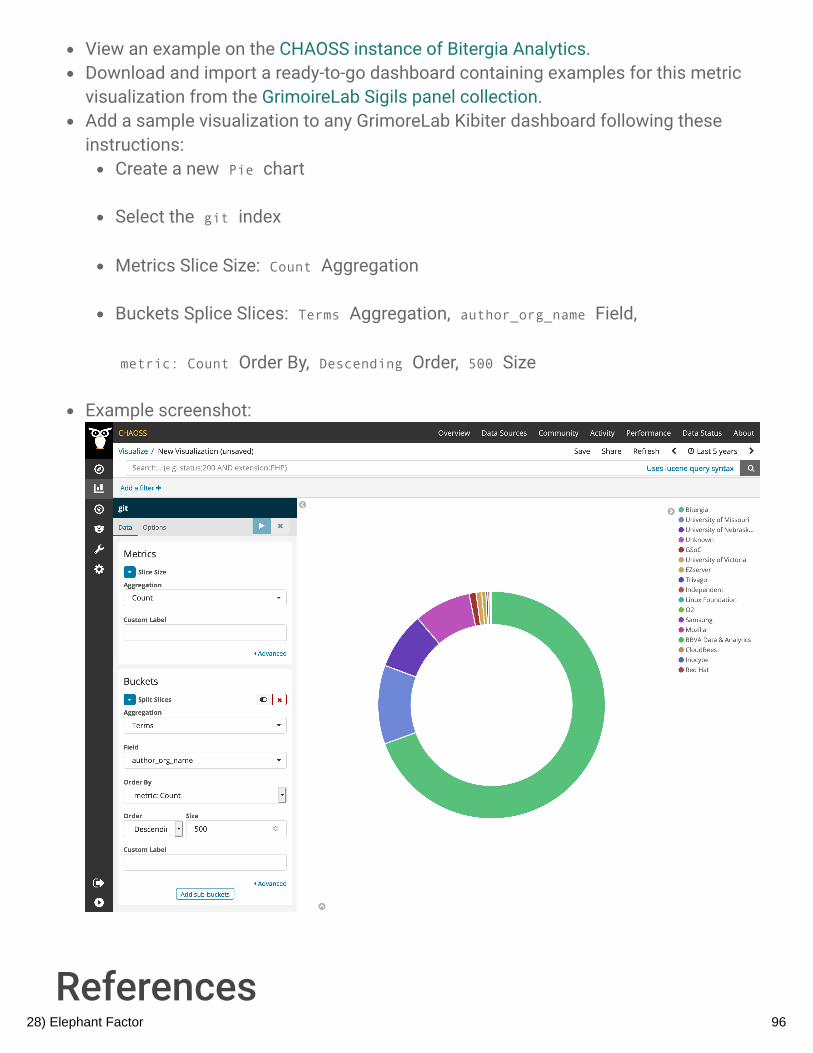
View an example on the CHAOSS instance of Bitergia Analytics.Download and import a ready-to-go dashboard containing examples for this metricvisualization from the GrimoireLab Sigils panel collection.Add a sample visualization to any GrimoreLab Kibiter dashboard following theseinstructions:
Create a new Pie chart
Select the git index
Metrics Slice Size: Count Aggregation
Buckets Splice Slices: Terms Aggregation, author_org_name Field,
metric: Count Order By, Descending Order, 500 Size
Example screenshot:
References28) Elephant Factor 96

1. Colin C. Venters, Lydia Lau, Michael K. Gri�ths, Violeta Holmes, Rupert R. Ward,Caroline Jay, Charlie E. Dibsdale, and Jie Xu. 2014. The Blind Men and the Elephant:Towards an Empirical Evaluation Framework for Software Sustainability. Journal ofOpen Research Software 2, 1. https://doi.org/10.5334/jors.ao
2. http://philslade.blogspot.com/2015/07/what-is-elephant-factor.html3. https://blog.bitergia.com/2016/06/07/landing-the-new-eclipse-open-analytics-
dashboard/4. https://www.stackalytics.com/
28) Elephant Factor 97
Test CoverageQuestion: How well is the code tested?
DescriptionTest coverage describes how much of a given code base is covered by at least one testsuite. There are two principle measures of test coverage. One is the percentage ofsubroutines covered in a test suite run against a repository. The other principleexpression of test coverage is the percentage of statements covered during theexecution of a test suite. The CHAOSS metric de�nition for "Test Coverage" includesboth of these discrete measures.
Programming languages refer to subroutines speci�cally as "functions", "methods","routines" or, in some cases, "subprograms." The percentage of coverage for a particularrepository is constrained in this de�nition to methods de�ned within a speci�crepository, and does not include coverage of libraries or other software upon which therepository is dependent.
ObjectivesUnderstanding the level of test coverage is a signal of software quality. Code with littletest coverage signals a likelihood of less rigorous software engineering practice and acorresponding increased probability that defects will be detected upon deployment anduse.
ImplementationStatements include variable assignments, loop declarations, calls to system functions,"go to" statements, and the common return statement at the completion of a function
or method, which may or may not include the return of a value or array of values .
Subroutine Coverage
29) Test Coverage 98

Statement Coverage
FiltersTime: Changes in test coverage over time provide evidence of project attention tomaximizing overall test coverage. Speci�c parameters include start date and
end date for the time period.
Code_File: Each repository contains a number of �les containing code. Filteringcoverage by speci�c �le provides a more granular view of test coverage. Somefunctions or statements may lead to more severe software failures than others. Forexample, untested code in the fail safe functions of a safety critical system are
more important to test than font color function testing.
Programming_Language: Most contemporary open source software repositoriescontain several different programming languages. The coverage percentage of each Code_File
Tools Providing the MetricProviding Test Coverage Information
Python's primary testing framework is PyTestThe Flask web framework for python enables coverage testingOpen source code coverage tools for common languages like Java, C, and C++are available from my sites, including this one.
Storing Test Coverage Information
Augur has test coverage implemented as a table that is a child of the mainrepository table in its repository. Each time test coverage is tested, a record is
29) Test Coverage 99

made for each �le tested, the testing tool used for testing and the number ofstatements/subroutines in the �le, as well as the number of statements andsubroutines tested. By recording test data at this level of granularity, Augurenables Code_File and Programming_Language summary level statistics and
�lters.
References1. J.H. Andrews, L.C. Briand, Y. Labiche, and A.S. Namin. 2006. Using Mutation Analysis
for Assessing and Comparing Testing Coverage Criteria. IEEE Transactions onSoftware Engineering 32, 8: 608–624. https://doi.org/10.1109/TSE.2006.83
2. Phyllis G Frankl and Oleg Iakounenko. 1998. Further Empirical Studies of TestEffectiveness. In Proceedings of the 6thACM SIGSOFT International SymposiumonFoundations of Software Engineering, 153–162.
3. Phyllis G Frankl and Stewart N Weiss. 1993. An Experimental Comparison of theEffectiveness of Branch Testing and Data Flow Testing. EEE Transactions onSoftwareEngineering 19, 8: 774–787.
4. Laura Inozemtseva and Reid Holmes. 2014. Coverage is not strongly correlated withtest suite effectiveness. In Proceedings of the 36th International Conference onSoftware Engineering - ICSE 2014, 435–445.https://doi.org/10.1145/2568225.2568271
5. Akbar Siami Namin and James H. Andrews. 2009. The in�uence of size andcoverage on test suite effectiveness. In Proceedings of the eighteenth internationalsymposium on Software testing and analysis - ISSTA ’09, 57.https://doi.org/10.1145/1572272.1572280
29) Test Coverage 100

License CountQuestion: How many different licenses are there?
DescriptionThe total count of identi�ed licenses in a software package where the same license canbe counted more than once if it is found in multiple source �les. This can include bothsoftware and document related licenses. This metric also provides a binary indicator ofwhether or not the repository contains �les without license declarations. This metric is a"complexity of licensing case" �ag for open source managers. For example, the idealcase would look like the table below:
Number of Licenses Files Without Licenses
1 FALSE
A more common case would require references to Licenses Declared and LicenseCoverage metrics, in the situation re�ected in this table:
Number of Licenses Files Without Licenses
11 TRUE
ObjectivesThe most simple case for an IT Manager overseeing the acquisition and management ofopen source software or an Open Source Program O�ce or community managerdelivering open source software to the marketplace is to have a single license typedeclared across all �les. This metric will illustrate quickly and visibly if there is onelicense or more than one; and the larger the number, the more complex theconsiderations grow for decision makers.
The second aspect of this metric is the binary indicator of whether or not the repository(package) includes �les that do not have license declarations.
30) License Count 101
ImplementationTools Providing the Metric
1. Augur
License count can be found on any Augur risk page under the section "LicensesDeclared". The number of rows in the table is the number of licenses.
References1. https://spdx.org/2. https://www.fossology.org
30) License Count 102

License CoverageQuestion: How much of the code base has declared licenses?
DescriptionHow much of the code base has declared licenses that scanners can recognize whichmay not be just OSI-approved. This includes both software and documentation source�les and is represented as a percentage of total coverage.
ObjectivesLicense Coverage provides insight into the percentage of �les in a software packagethat have a declared license, leading to two use cases:
1. A software package is sourced for internal organizational use and declared licensecoverage can highlight points of interest or concern when using that softwarepackage.
2. Further, a software package is provided to external, downstream projects anddeclared license coverage can make transparent license information needed fordownstream integration, deployment, and use.
ImplementationFiltersTime: Licenses declared in a repository can change over time as the dependencies ofthe repository change. One of the principle motivations for tracking license presence,aside from basic awareness, is to draw attention to any unexpected new licenseintroduction.
VisualizationsWeb Presentation of Augur Output:
31) License Coverage 103

JSON Presentation of Augur Output:
Tools Providng the Metric1. Augur
Data can be pulled and �ltered to get the desired information. License Coverage datacan be found on any Augur risk page
Referenceshttps://spdx.org/https://www.fossology.org
31) License Coverage 104
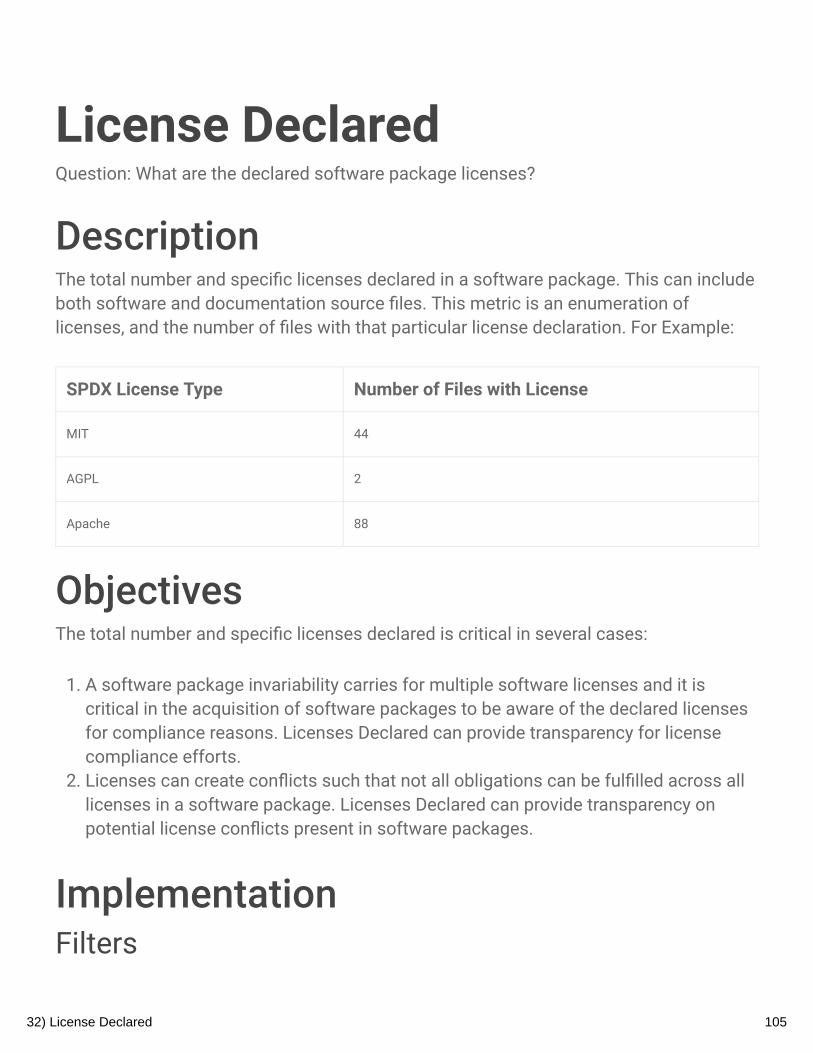
License DeclaredQuestion: What are the declared software package licenses?
DescriptionThe total number and speci�c licenses declared in a software package. This can includeboth software and documentation source �les. This metric is an enumeration oflicenses, and the number of �les with that particular license declaration. For Example:
SPDX License Type Number of Files with License
MIT 44
AGPL 2
Apache 88
ObjectivesThe total number and speci�c licenses declared is critical in several cases:
1. A software package invariability carries for multiple software licenses and it iscritical in the acquisition of software packages to be aware of the declared licensesfor compliance reasons. Licenses Declared can provide transparency for licensecompliance efforts.
2. Licenses can create con�icts such that not all obligations can be ful�lled across alllicenses in a software package. Licenses Declared can provide transparency onpotential license con�icts present in software packages.
ImplementationFilters
32) License Declared 105

Time: Licenses declared in a repository can change over time as the dependenciesof the repository change. One of the principle motivations for tracking licensepresence, aside from basic awareness, is to draw attention to any unexpected newlicense introduction.Declared and Undeclared: Separate enumeration of �les that have licensedeclarations and �les that do not.
Tools Providing the Metric1. Augur
Licenses Declared can be found on any Augur risk page under the section "LicenseDeclared".
2. Augur-SPDX
The Augur-SPDX package is implemented as an Augur Plugin, and uses this data modelfor storing �le level license information. Speci�cally:
Each package (repository) can have a declared and declared license, as determined
by the scan of all the �les in the repository.Each package can also have a number of different non-code documents , which are
SPDX license declarations.Each file can be associated with one or more packages_files . Through the
relationship between files and packages_files , Augur-SPDX allows for the
possibility that one �le in a large collection of repositories could be part of more thanone package, although in practice this seems unlikely.packages and packages_files have a one to many relationship in both directions.
Essentially, this is a reinforcement of the possibility that each file can be part of
more than one package , though it is, again, typical that each package will contain
many package_files .
32) License Declared 106
licenses are associated with files and packages_files . Each file could
possibly have more than one licenses reference, which is possible under the
condition that the license declaration changed between Augur-SPDX scans of the
repository. Each package is stored in its most recent form, and each packages_file
can have one license declaration.
Referenceshttps://spdx.org/https://www.fossology.org
32) License Declared 107

OSI Approved LicensesQuestion: What percentage of a project’s licenses are OSI approved open sourcelicenses?
DescriptionThis metric provides transparency on the open source licenses used within a project.The reason for the needed transparency is that a number of licenses are beingpropagated that are not, in fact, open source friendly. Open source projects may notwant to include any licenses that are not OSI-approved.
As from OSI: “Open source licenses are licenses that comply with the Open SourceDe�nition — in brief, they allow the software to be freely used, modi�ed, and shared. Tobe approved by the Open Source Initiative (also known as the OSI), a license must gothrough the Open Source Initiative's license review process.”
ObjectivesIdentify whether a project has licenses present which do not conform to the de�nition ofopen source. This transparency helps projects make conscious decisions about whetheror not to include licenses that are not approved by OSI.
ImplementationThe OSI-approved licenses can be found in the SPDX-provided Licenses.json.
Visualizations
33) OSI Approved Licenses 108

Tools Providing MetricAugur provides this metric under the Risk page for a project.
Example: http://augur.osshealth.io/repo/Zephyr-RTOS/zephyr/risk
Data Collection StrategiesExtract list of licenses from a code base, same as in License Coverage metric. Comparethe list of licenses to Licenses.json and take note of how many licenses are approved bythe OSI. Calculate the percentage of �les on the OSI license list.
ResourcesOSI license pageSPDX License List
33) OSI Approved Licenses 109

Core Infrastructure InitiativeBest Practices BadgeQuestion: What is the current CII Best Practices status for the project?
DescriptionAs from the CII Best Practices Badging Page: The Linux Foundation Core InfrastructureInitiative (CII) Best Practices badge is a way for open source projects to show that theyfollow best practices. Projects can voluntarily self-certify, at no cost, by using this webapplication to explain how they follow each best practice. Projects receive the passingbadge if they meet all of the required criteria.
ObjectivesAs from the CII Best Practices Badging Page: CII badging indicates a project’s level ofcompliance with “open source project best practices" as de�ned by the LinuxFoundation's core infrastructure initiative, which focuses on CyberSecurity in opensource software. The goal of the program is to encourage projects to produce bettermore secure software and allow others to determine if a project is following bestpractices.
Consumers of the badge can quickly assess which open source projects are followingbest practices and as a result are more likely to produce higher-quality secure software.
ImplementationSee CII’s API documentation for relevant information.
Visualizations
34) CII Best Practices Badge 110

Tools Providing MetricAugur provides an example implementation for the CII Best Practices metric. Anexample of CII metrics in use can be found at http://augur.osshealth.io/repo/Zephyr-RTOS/zephyr/risk
Data Collection StrategiesSee CII’s API documentation for relevant information.
As from the CII Best Practices Badging Page: Projects receive the passing badge if theymeet all of the required criteria. The status of each criterion, for a given project, can be'Met', 'Unmet', 'N/A' or 'unknown'. Each criterion is in one of four categories: 'MUST','SHOULD', 'SUGGESTED', or 'FUTURE'. To obtain a badge, all the MUST and MUST NOTcriteria must be met, all SHOULD criteria must be met OR the rationale for notimplementing the criterion must be documented, and all SUGGESTED criteria have to be
34) CII Best Practices Badge 111

rated as met or unmet. Advanced badge levels of silver and gold are available if theproject satis�es the additional criterion.
ReferencesCII Badging Website: https://bestpractices.coreinfrastructure.org/enAugur: https://github.com/chaoss/augur
34) CII Best Practices Badge 112

Social Currency Metric System(SCMS)Question: How does one measure the value of community interactions and accuratelygauge “reputation” of a community as evident from qualitative sentiment?
DescriptionSocial currency or Social Capital is a social scienti�c theory. It broadly considers howhuman interactions build relationships and trust in a community. The Social CurrencyMetric System represents the reputation of a community as measured via communitytrust, transparency, utility, consistency, and merit.
Interpersonal relationships are the social fabric of communities. This is shown in theLevinger’s Relationship Model and Social Penetration Theory. Community members'sense of personal and group identity grows as they interact. Members build sharedvalues, accumulate a sense of trust, encourage cooperation, and garner reciprocitythrough acts of self-disclosure. These interactions build an increased and measurablesense of connection. The measure of these characteristics is called social currency.
The Social Currency Metrics System is a way to sort through a �re hose of qualitativedata from community interactions. A central premise of this approach is that communitymembers' interactions have an impact on the community. The Social Currency MetricsSystem continually measures the sentiment from those interactions. It illustrates thereputation and level of trust between community members and leaders.
ObjectivesAnalyze the qualitative comments in community interactions. Gain an overview ofsentiment in a community. Get metrics that show at a glance how a community is andwas doing. Use lead metrics from continuous measurements for proactive communitystrategy development. Instill trust in community members that their thoughts andopinions are valued.
35) Social Currency) System 113

ImplementationSet up a Data Collection Platform of your choice as described in the “Tools” sectionbelow. Ensure it has a minimum of 4 dimensions and 3 communication channels. Onceit is set up, the following method is used to collect, analyze, and interpret results:
1. Collect Communication Traces -- Identify online platforms that your community iscommunicating on. Set up data funnels from the primary platform to your SCMStool. The critical data for the system is user generated content.
2. Standardize How Communication Traces Should Be Assessed -- Use a codex tode�ne important concepts as a “tracking keyword” or “category” in the focalcommunity. This uni�ed codex of terms ensures consistent analysis as differentpeople read and tag community sentiment. Formalizing the revision and additionstructure to this codex on a regular basis is a must.
3. Analyze the Communication Traces -- Community sentiment is analyzed in theSCMS tool by tagging data with codex terms. If the tagging is done by a team ofpeople, it is recommended that everyone gets together regularly to discuss trendsand ensure consistent tag use. If the tagging is done by an arti�cial intelligencealgorithm, then a human team should supervise and retrain the AI as necessary.
4. Share and Visualize the Aggregated Analysis -- Visualize the quantitative count ofcodex terms over time, e.g., in a dashboard. This is where the qualitative analysis
35) Social Currency) System 114

results produce an easy to observe dashboard of trends. Share analysis with teammembers.
5. Benchmark, Set Goals & Predict Future Growth -- After getting enough data to forma benchmark, take stock of where your community stands. What are its strengthsand weaknesses? What actions can be taken to make the community healthier andmore robust? Then form community initiatives with well-de�ned goals and executeon these projects to affect the social currency metrics for next week.
6. Repeat the Process -- In regular evaluation meetings, discuss the shortcomings ofthe dataset or collection methods. Come up with methods to address theseshortcomings in the future. Work solutions into the system and move forward. Truthis in the trend, power is in the pattern.
Filters1. Channel: Sort by where the data was collected from.2. Tag: Show data based on what codex tags were used to identify sentiment in
comments.3. Time: Show trends in the data over time and pull speci�c data-sets.4. Most impactful comments: Sort and �lter by �ags that can be placed in the data to
highlight speci�c data points and explain their importance.5. AI vs. Human tagged: Filter by whether tags were applied programmatically or by a
person.6. Weighted currency: Weight the “importance” of certain comments based on any one
individually selected criteria. A resulting weighted view is simply a re-order ofinformation based on weight.
VisualizationsDashboard visualizing the aggregate metrics:
35) Social Currency) System 115

Example SCMS tool: On the left, raw community comments are shown and tags areadded in columns immediately to the right. On the right, a pivot table shows in numbershow often tags occurred in combination with other tags.
Expanded comments view: remove the “quantitative” from the �elds and provide thebest possible way to read the different comments.
35) Social Currency) System 116

Tools Providing the MetricTo implement the metric any MySQL, smart-sheet, excel, or airtable-like excel datasheetprogram works �ne. This data should be simpli�ed enough to interact with other datainterfaces to ensure that data migration is simple, straightforward, and can beautomated (such as google data studio). This requires that systems used to implementthe SCMS work with CSV and other spreadsheet �les, and we heavily recommend opensource programs for its implementation.
Once you have this, create a data set with the following data points:
DataPoints
Description
Date of
entry
Date data was imported to SCMS tool
Date of
comment
Date comment was made on original platform
Comment
Text
Qualitative data brought in. Decide on how large you want these chunks ported. Some may port an entire
email while others will be broken into one row per sentence. It should only have one “sentiment”
Data
channel
Originating data channel the comment came from
35) Social Currency) System 117
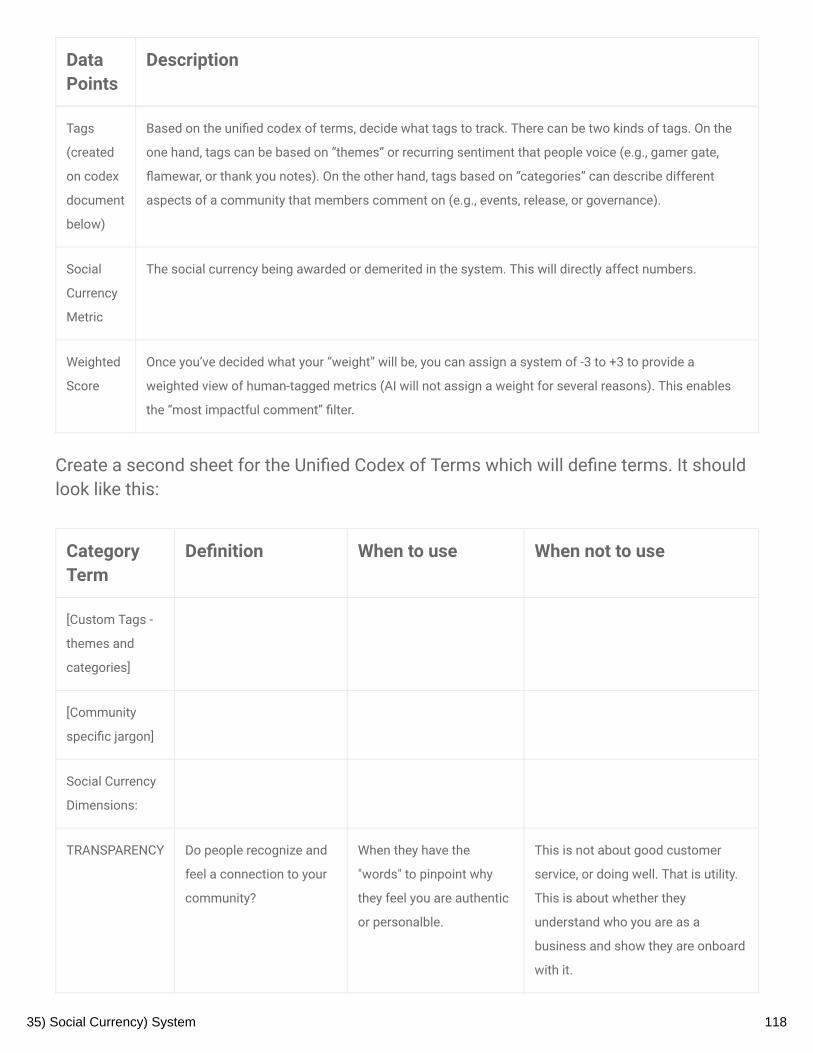
DataPoints
Description
Tags
(created
on codex
document
below)
Based on the uni�ed codex of terms, decide what tags to track. There can be two kinds of tags. On the
one hand, tags can be based on “themes” or recurring sentiment that people voice (e.g., gamer gate,
�amewar, or thank you notes). On the other hand, tags based on “categories” can describe different
aspects of a community that members comment on (e.g., events, release, or governance).
Social
Currency
Metric
The social currency being awarded or demerited in the system. This will directly affect numbers.
Weighted
Score
Once you’ve decided what your “weight” will be, you can assign a system of -3 to +3 to provide a
weighted view of human-tagged metrics (AI will not assign a weight for several reasons). This enables
the “most impactful comment” �lter.
Create a second sheet for the Uni�ed Codex of Terms which will de�ne terms. It shouldlook like this:
CategoryTerm
De�nition When to use When not to use
[Custom Tags -
themes and
categories]
[Community
speci�c jargon]
Social Currency
Dimensions:
TRANSPARENCY Do people recognize and
feel a connection to your
community?
When they have the
"words" to pinpoint why
they feel you are authentic
or personalble.
This is not about good customer
service, or doing well. That is utility.
This is about whether they
understand who you are as a
business and show they are onboard
with it.
35) Social Currency) System 118

CategoryTerm
De�nition When to use When not to use
UTILITY Is your community doing
something useful or is it
contributing value?
Provide parameters that
exclude when the term is
used so that people know
when the category tag
should not be
implemented.
This is not about good customer
service, or doing well. That is utility.
This is about whether they
understand who you are as a
business and show they are onboard
with it.
CONSISTENCY Do you have a history of
being reliable and
dependable?
When they suggest they
have used your brand, or
interacted with you several
times
If they've only provided their
comment to suggest you were useful
once, use utility instead.
MERIT Does your community
merit respect and
attention for your
accomplishments?
When the social currency
garnered from customers
seems it will continue for a
while, and will impact
other people's opinions.
When they suggest they will use you
again in the future use trust instead
as that is a personal trust in the
brand. Merit is external.
TRUST Can people trust that your
community will continue
to provide value and grow
in the future?
When they suggest they
trust you well enough to
continue conversations
with you in the future
When there is not substantial
enough evidence to suggest they will
continue to work with and trust you
as a loyal customer or community
member.
INTERNAL
REPUTATION
Do people believe these
things strongly enough to
warrant conversation or
action?
EXTERNAL
REPUTATION
What amount of your
reputation in your
community is transferable
to strangers outside of
your community (cold
audiences)?
35) Social Currency) System 119

The codex is �lled in by stakeholders on a regular basis by speci�c communities andforms the basis for analysis of the data. This is the MOST IMPORTANT part. Without thisthe subjectivity of qualitative data does not follow the rule of generalization:
“A concept applies to B population ONLY SO FAR AS Climitation.”
Data Collection StrategiesCommunity member comments are available from trace data. The SCMS ideally importsthe comment text automatically into a tool for tagging. Trace data can be collected froma communities' collaboration platforms where members write comments, includingticketing systems, code reviews, email lists, instanct messaging, social media, and fora.
Legal and Regulatory Considerations
Points of destruction: Detailed data is destroyed after xx months has passed.Quantitative calculations are kept for up to 250 weeks per GDPR compliance. Data olderthan 250 weeks becomes archived data you cannot manipulate but can see. Users cannegotiate the primary statistic.
ReferencesAn example implementation on airtableAn example implementation in data studio(report)An example implementation in data studio (data source)An example implementation in google sheetsImplementation documentation (starts on page 33)
35) Social Currency) System 120

Labor InvestmentQuestion: What was the cost of an organization for its employees to create the countedcontributions (e.g., commits, issues, and pull requests)?
DescriptionOpen source projects are often supported by organizations through labor investment.This metric tracks the monetary investment of organizations (as evident in labor costs)to individual projects.
ObjectivesAs organizational engagement with open source projects becomes increasly important,it is important for organization to clearly understand their labor investment. Theobjective of this metric is to improve transparency in labor costs for organizationsengaged with open source projects. This metric gives an Open Source Program O�ce(OSPO) manager a way to compare contributed labor costs across a portfolio ofprojects. For example, the Labor Investment metric can be used to prioritize investmentor determine return on investment such as:
Labor Investment as a means of evaluating OSPO priorities and justifying budgetsLabor Investment as a way to explain product/program management priorityLabor Investment as an argument for the value of continued investing in OSPOsLabor Investment to report and compare labor costs of contributed vs in-house workLabor Investment to compare project effectiveness across a portfolio of projects
ImplementationBase metrics include:
number of contributionsnumber of contributions broken out by contributor types (internal / external)number of contributions broken out by contribution types (e.g., commits, issues, pullrequests)
36) Labor Investment 121

Parameters include:
hourly labor rateaverage labor hours to create contribution (by contribution type)
Labor Investment = For each contribution type, sum (Number of contributions * Averagelabor hours to create contribution * Average hourly rate)
Filtersinternal vs external contributorsissue tagsproject sources (e.g., internal, open-source repos, competitor open-source repos)
Visualizations
Our �rst visualizatoin of parameterized metrics rely on CSV exports that can be madeavailable from Augur. Spreadsheets are used for metric parameters and calculationformulas. Future implementations may add features for parameter manipulation directlyin the webapp.
ReferencesStarting an Open Source Program O�ceCreating an Open Source Program O�ceOpen Source in the Enterprise
36) Labor Investment 122

Project VelocityQuestion: What is the development speed for an organization?
DescriptionProject velocity is the number of issues, the number of pull requests, volume ofcommits, and number of contributors as an indicator of 'innovation'.
ObjectivesGives an Open Source Program O�ce (OSPO) manager a way to compare the projectvelocity across a portfolio of projects.
The OSPO manager can use the Project Velocity metric to:
Report project velocity of open source projects vs in-house projectsCompare project velocity across a portfolio of projectsIdentify which projects grow beyond internal contributors (when �ltering internal vs.external contributors)Identify promising areas in which to get involvedHighlight areas likely to be the successful platforms over the next several years
See Example
ImplementationBase metrics include:
issues closednumber of reviews# of code changes# of committers
Filters37) Project Velocity 123

Internal vs external contributorsProject sources (e.g., internal repositories, open-source repositories, and competitoropen-source repositories)Time
VisualizationsX-Axis: Logarithmic scale for Code ChangesY-Axis: Logarithmic scale of Sum of Number of Issues and Number of ReviewsDot-size: CommittersDots are projects
From CNCF
37) Project Velocity 124

Tools Providng the MetricCNCF - https://github.com/cncf/velocity
ReferencesCan Open Source Innovation work in the Enterprise?Open Innovation for a High Performance CultureOpen Source for the Digital EnterpriseHighest Velocity Open Source Projects
37) Project Velocity 125

Organizational Project SkillDemandQuestion: How many organizations are using this project and could hire me if I becomepro�cient?
DescriptionOrganizations engage with open source projects through use and dependencies. Thismetric is aimed at determining downstream demand of skills related to an open sourceproject. This metric looks at organizations that deploy a project as part of an ITinfrastructure, other open source projects with declared dependencies, and references tothe project through social media, conference mentions, blog posts, and similar activities.
ObjectivesAs a developer, I'd like to invest my skills and time in a project that has a likelihood ofgetting me a decent paying job in the future. People can use the DownstreamOrganizational Impact of a Project Software metric to discover which projects are usedby organizations, and they may, therefore, be able to pursue job opportunities with,possibly requiring IT support services.
ImplementationBase metrics include:
Number of organizations that created issues for a projectNumber of organizations that created pull requests for a projectNumber of organizations that blog or tweet about a projectNumber of organizations that mention a project in open hiring requestsNumber of organizations that are represented at meetups about this projectNumber of other projects that are dependent on a projectNumber of books about a projectGoogle search trends for a project
38) Organizational Project Skill Demand 126

VisualizationsThe following visualization demonstrates the number of downstream projectsdependendent on the project in question. While this visualization does not capture theentirety of the Downstream Organizational Impact of a Project Software metric, itprovides a visual for a portion.
paper image
Other visualizations could include Google search trends (React vs. Angular vs. Vue.js)
Google Trends
ThoughtWorks publishes a series called 'Tech Radar' that shows the popularity oftechnologies for their
TechRadar
Tech Radar allows you to drill down on projects to see how the assessment has changedover time.
Assessment
StackOverview publishes an annual developer's survey
StackOver�ow
Tools Providing the MetricGoogle Trends - for showing search interest over timeThoughtWorks TechRadar - project assessments from a tech consultancyStackOver�ow Developer's Survey - annual project rankingsAugur; Examples are available for multiple repositories:
RailsZephyrCloudStack
38) Organizational Project Skill Demand 127

ReferencesOpen Source SponsorsFiscal Sponsors and Open SourceLarge Corporate OpenSource SponsorsGoogle Trends APIMeasuring Open Source Software ImpactThoughtWorks Tech RadarStack Over�ow Developer's Survey
38) Organizational Project Skill Demand 128

Job OpportunitiesQuestion: How many job postings request skills with technologies from a project?
DescriptionA common way for open source contributors to earn a living wage is to be employed bya company or be a self-employed or freelance developer. Skills in a speci�c project mayimprove a job applicant’s prospects of getting a job. The most obvious indicator fordemand related to a skill learned in a speci�c open source project is when that project orits technology is included in job postings.
ObjectivesThe metric gives contributors a sense of how much skills learned in a speci�c opensource project are valued by companies.
ImplementationTo obtain this metric on a job search platform (e.g., LinkedIn, Indeed, or Dice), go to thejob search and type in the name of the open source project. The number of returned jobpostings is the metric. Periodically collecting the metric through an API of a job searchplatform and storing the results allows to see trends.
FiltersAge of job posting; postings get stale and may not be removed when �lled
VisualizationsThe metric can be extended by looking at:
Salary ranges for jobs returnedLevel of seniority for jobs returnedAvailability of jobs like on-site or off-siteLocation of job
39) Job Opportunities 129

Geography
ReferencesLinkedIn Job Search API: https://developer.linkedin.com/docs/v1/jobs/job-search-api#Indeed Job Search API: https://opensource.indeedeng.io/api-documentation/docs/job-search/Dice.com Job Search API:http://www.dice.com/external/content/documentation/api.htmlMonster Job Search API: https://partner.monster.com/job-searchZiprecruiter API (Requires Partnership): https://www.ziprecruiter.com/zipsearch
Note: This metric is limited to individual projects but engagement in open source can bebene�cial for other reasons. This metric could be tweaked to look beyond a singleproject and instead use related skills such as programming languages, processes, opensource experience, or frameworks as search parameters for jobs.
39) Job Opportunities 130

Release HistoryRelease 202001 Notes:
PDF of released CHAOSS Metrics (v.202001)All Metrics were restructured to conform to the new CHAOSS Project metricsdocument structure.Common WG
New metrics include:Activity Dates and TimesTime to First ResponseContributors
Restructured and renamed focus areasOrganizational Diversity remains unchanged from previous release.
Diversity & Inclusion WGNew metrics include:
SponsorshipBoard/Council Diversity
Improved clarity on several metrics that were in the previous releaseEvolution WG
New metrics include:Issue AgeIssue Response TimeIssue Resolution DurationNew Contributors Closing Issues
Updated focus areas. Refactored the "Code Development" focus area into 3separate focus areas to more closely align with other working groups. Ratherthan having one broad focus area with multiple subsections, we decided ourintent would be better communicated by making each of these subsections intotheir own focus areas. The 3 separate focus areas include:
Code Development ActivityCode Development E�ciencyCode Development Process Quality
Kept the other 2 focus areas (Issue Resolution and Community Growth) thesame.No major changes were made to already existing metrics.
Risk WGRelease History 131

New metrics include:OSI Approved LicensesLicenses DeclaredTest Coverage (Updated)Elephant FactorCommitters
Focused on increasing metrics coverage in the general areas of CNCF CoreInfrastructure badging and licensing.License Count was removed from the release. It is being replaced by theLicenses Declared metric.Software Bill of Materials was removed from the release. It is being reworked asthe SPDX Document metric for the next release.
Value WGNew metrics include:
Social Currency Metric System (SCMS)Job Opportunities
A new focus area of Ecosystem Value was developed
Release 201908 NotesPDF of released CHAOSS Metrics (v.201908)Initial CHAOSS Metrics release.
Release History 132

The MIT License Copyright © 2020 CHAOSS a Linux Foundation® Project Permission is hereby granted, free of charge, to any person obtaining a copy of this software and associated documentation files (the "Software"), to deal in the Software without restriction, including without limitation the rights to use, copy, modify, merge, publish, distribute, sublicense, and/or sell copies of the Software, and to permit persons to whom the Software is furnished to do so, subject to the following conditions: The above copyright notice and this permission notice shall be included in all copies or substantial portions of the Software. THE SOFTWARE IS PROVIDED "AS IS", WITHOUT WARRANTY OF ANY KIND, EXPRESS OR IMPLIED, INCLUDING BUT NOT LIMITED TO THE WARRANTIES OF MERCHANTABILITY, FITNESS FOR A PARTICULAR PURPOSE AND NONINFRINGEMENT. IN NO EVENT SHALL THE AUTHORS OR COPYRIGHT HOLDERS BE LIABLE FOR ANY CLAIM, DAMAGES OR OTHER LIABILITY, WHETHER IN AN ACTION OF CONTRACT, TORT OR OTHERWISE, ARISING FROM, OUT OF OR IN CONNECTION WITH THE SOFTWARE OR THE USE OR OTHER DEALINGS IN THE SOFTWARE.
The MIT License 133