metrics of public owner success - lean … · metrics of public owner success presented to lci...
TRANSCRIPT

METRICS OF PUBLIC OWNER SUCCESS
Presented to LCI NorCal COP May 14, 2014
in Lean Design, Construction, and Facilities Operations and Maintenance

LEAN FUNDAMENTALS

Lean Philosophies
Value •Value is defined by the owner
•Value is not cost
•Define customer value
•Identify and remove waste
•Innovate and perfect

The Eight Wastes as Defined by Toyota (and Liker)
1. Overproduction
2. Waiting
3. Unnecessary transport
4. Over-processing
5. Excess inventory
6. Unnecessary movement
7. Defects
8. Unused employee creativity
4

https://www.gov.uk/government/uploads/system/uploads/attachment_data/fil
e/210099/bis-13-955-construction-2025-industrial-strategy.pdf
UK Construction 2025 Goals

UK Construction 2025 Goals

Source: McGraw-Hill SmartMarketReport (2013)
Perceptions of Efficiency in Our Industry

2-Second Lean (A Guide)
“Fix What Bugs You” – Paul Akers

SAN DIEGO CCD LEAN PRACTICES

Mesa College
San Diego Community College District (SDCCD)
Overview
The Second Largest Community College District in California – Serving 130,000 students
Sixth Largest in Nation
Three Colleges - City, Mesa and Miramar
Six Continuing Education Campuses
District Square Footage - 2,218,031
$1.555 B Locally Approved Capital Bonds
City College Miramar College Continuing Education

San Diego Community College District
Why Go Lean?
Reduced operating budgets of $46 million in past four years (-16%)
Increased build environment footprint of 1.3 million square feet (+65%)
Capital funding from locally approved and funded general obligation
bonds
Reduce waste, create greater value

San Diego Community College District
About the District (Current State)
Square Footage(As of September 2012)
Buildings = 2,560,187 gross square feetParking = 377,712 gross square feet
Current Acres of Landscape = 199.2
Current Utilities ConsumptionElectric = $4,119,936Gas = $334,632Water = $790,322Total = $5,244,890

San Diego Community College District
About the District (Future State)
Projected Square Footage
Additional Building GSF = 720,608
Total Building GSF = 3,280,795
Additional Parking GSF = 279,265
Total Parking GSF = 1,372,622
Grand Total GSF = 5,653,290

Total Cost of Ownership
50-year design life
100,000 square foot classroom building
Design and construction cost - $30 million
Capital Renewal: 2% of current replacement value (APPA benchmark)
O&M Budget $5.69/square foot
Inflation: 3%

15
Total Cost of Ownership
53%
36%
11%
Total Cost of Ownership
Save 5% in Cap. Renewal
Save 10% in O&M
Savings
D&C: $30M Total NPV
Cap. R.: $101M $ 5M $1.1M
O&M: $149M $15M $3.4M
Total: $280M $20M $4.4M

Practicing the Toyota Way Business Principles

17
Early (and continued) Attitudes Toward Lean
We’ve tried that.
We already do that.
We don’t need it.
It won’t work here.
We don’t build cars.
We’re different.
The other guy needs it, not me.
We’re doing well, so why change?
Credit: Lean Construction Institute

Design-Build Statute in California for CCS
As of January 1, 2008, Community Colleges can use design build under SB614.
Must be at least $2.5M in valueRequires project-specific Board resolution
Need to evaluate the project based on five minimum criteria.Price (10%)Technical Experience (10%)Life cycle cost over 15 years (10%)Skilled Labor Force (10%)Safety Record (10%)

Design-Build Scoring Criteria and Weight

20
Integrated Project Delivery Charter

Defining Values for SDCCD
Enhance the student experience
Flexibility in design to accommodate future changes in pedagogy
Lower total cost of ownership
Highly energy efficient buildings
Reduce maintenance and operations costs
Meet or exceed sustainability objectives

1. Target Costing2. A3 Problem Solving and Reporting3. Set-Based Design4. Value Stream Mapping5. Building Information Modeling (BIM)6. The Last Planner™ System
Use of Lean Tools in Capital Project Delivery

Target Costing

Space Programming
Space Efficiency
Targeted Cost
Per Sq. Ft.
Target Costing - Project Budget Development

A3 Problem Solving – Risk/Benefit Analysis

A3 Problem Solving – HVAC Design

A3 Problem Solving – Structural System Design
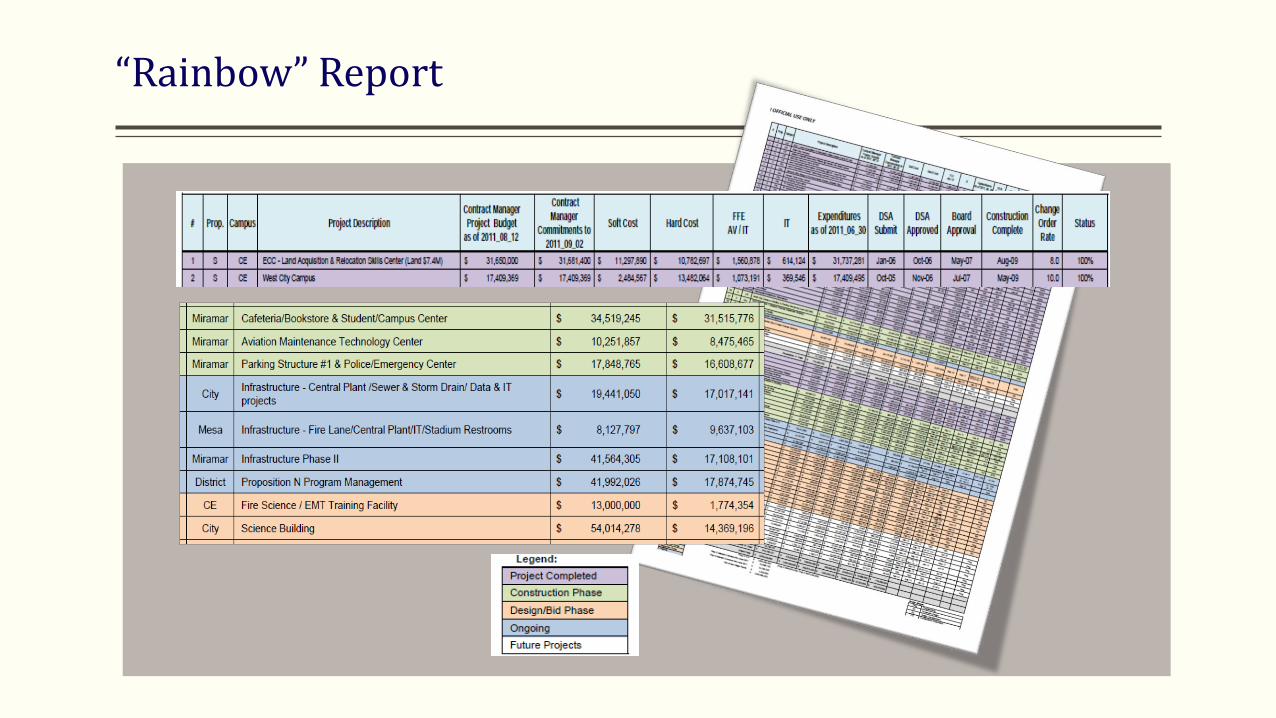
“Rainbow” Report

San Diego Community College District
Monthly Program A3 Report

30
San Diego Community College District
Monthly Program A3 Report

31
San Diego Community College District
Monthly Program A3 Report

Value Stream Mapping – Change Order Process
Resolution toCM
CM Creates RFP;
Issues to Contractor
Price Fair and Reasonable?
CM Creates Change Order
Distribution
Contractor Issues Price, CM Reviews Price, Issues
COR
Negotiate
A/E SignsContractor
Signs
CMSigns
IORSigns
CPMSigns
Richard BSigns
Dave USigns
District Admin. Receives and
Processes
Determine entitlementBefore proceeding
From this point
NO
YES
1 Working Day 15 Working Days 15 Working Days
1 Working Day
5 Working Days5 Working Days
5 Working Days 5 Working Days 5 Working Days 5 Working Days 5 Working Days
0 Working Day
1 Working DaySTARTEND
Old Change Order Process
Total Process Duration:67 Working DaysWith Negotiation

33
Value Stream Mapping – Change Order Process
New Change Order Process
Total Process Duration:28 Working DaysWith Negotiation
Effective January 2011
Resolution toCM
CM Requests Pricing from
Contractor via Fax/Email
Price Fair and Reasonable?
Distribution
Negotiate
CPM Signs
Richard BDave U
Sign
District Admin. Receives and
Processes
Determine entitlementBefore proceeding
From this point
NO
YES
1 Working Day 5 Working Days 7 Working Days
7 Working Days
1 Working Day
1 Working Day
START
END
Contractor Issues Price, CM Reviews &
Prepares Change Order
A/E, IOR, Contractor, CM Sign Separate
CO Cover Sheet
7 Working Days

BIM Standards
http://public.sdccdprops-n.com/Design/SDCCD%20-%20Building%20Design%20Standards/SDCCD%20BIM%20Standards%20Version%202.pdf

Safety – Root Cause Analysis of Repeated Incidents
City College Campus Safety Report – February 2012
Overall Safety Comments Overall Safety Issues

Safety – Root Cause Analysis of Repeated Incidents
Central PlantMath & Social
ScienceBusiness & Humanities Science

37
Safety – Root Cause Analysis of Repeated Incidents
Required fall protection refresher training
Enhanced training for spotters
Enhanced focus on safety culture

Genchi Genbutsu

39
Hourensou

Is Critical Path Method Scheduling Obsolete?

San Diego Community College District
Schedule Performance – Pre-Lean
Change Order RateAverage = 7.1%
CM Multi-Prime
Change Order RateAverage = 10.8%
Project DelayAverage = 43.5 Days
Project DelayAverage = 19.5 Days
Traditional Design-Bid-Build

Schedule Performance
• SDCCD Experience: 34 Major Projects with CPM Scheduling 4 (12%) finished on time
• UC System Experience in past 10 years: More than 30% of projects delayed by more than 90 days
• Research by Glenn Ballard and Greg Howell indicated only 54% of planned weekly activities get completed on average.
• LastPlannerTM pull system – a better way (typically 80-90% percent promises kept)

Last Planner® System
1. Master Scheduling – setting milestones2. Phase (Pull) Planning – specifying handoffs3. Make Work Ready Planning – 6 week look-ahead4. Weekly Work Planning5. Learning - Measure Percent Promises Complete,
conduct root cause analysis and act on reasons for failure to keep promises
5 Major Elements of System
Who are the Last Planners?The foremen and superintendents

Last Planner® System Principles
1. All plans are forecasts and all forecasts are wrong. The longer the forecast the more wrong it is. The more detailed the forecast, the more wrong it is.
2. Plan in greater detail as you get closer to doing the work.3. Produce plans collaboratively with those who will do the
work.4. Reveal and remove constraints on planned tasks as a
team.5. Make reliable promises.6. Learn from breakdowns.

Source: Adrian Smith (2011)

Pull Planning – 6 Week Lookahead
Source: LCI (2009)

Pull Planning Design Phase

San Diego Community College District
Pull Planning Workshop

A PROJECT CASE STUDY WITH LAST PLANNER®
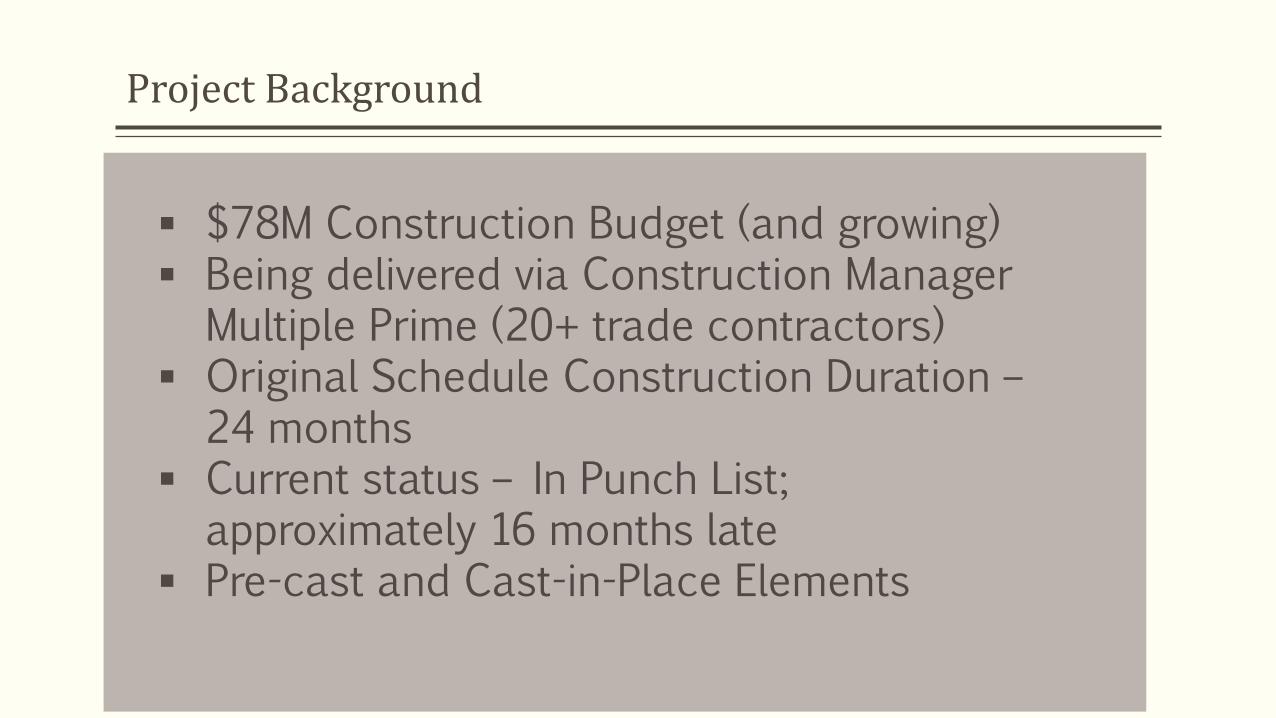
Project Background
$78M Construction Budget (and growing) Being delivered via Construction Manager
Multiple Prime (20+ trade contractors) Original Schedule Construction Duration –
24 months Current status – In Punch List;
approximately 16 months late Pre-cast and Cast-in-Place Elements

9/14/11
Pull planning coach’s first session
CM had used “pull planning” at beginning of project
A P6 consultant led the sessions
Wrote activities on stickies
No predecessor or constraints
Not used after the initial 2 sessions
Created a P6 schedule and handed it out.
Now very far behind.

12/8/11
PPC of 79%. However a pour had been missed.
VARIANCE reason was Concrete Prime asked a Hot RFI a couple of days before pour 2B and even though there was a same day response by the designer the changes needed in the forms delayed the pour (which will now ripple through the WWP).
Concrete Prime says the reason they sent the RFI late was they didn't notice the need for clarification.
The mitigation measure per Concrete Prime is that they will more carefully think through the plans earlier and try to catch these things sooner using the 6 week look-ahead feature of the WWP.
This lesson was discussed for all to learn.

Weekly Work Planning

1/4/12
Lessons reinforced/clarified:Commitments can be re-negotiated but with whole group's awareness/agreement and must be reflected in the tags on the board (in front of the whole group) or it's a miss.
PPC sweet spot is 75-90%. Above 90% the group is not challenging itself enough and you need to see where you can get more efficient and pull out time. You've established a reliable flow.
We're at 89% today.

Lots of Misses and Lack of Coordination

Cramped Space

3/15/12
Concrete Prime Contractor terminated for default for failure to perform by SDCCD Board
Surety bond called
Former Subcontractor engaged as new Prime Contractor

Early WWP

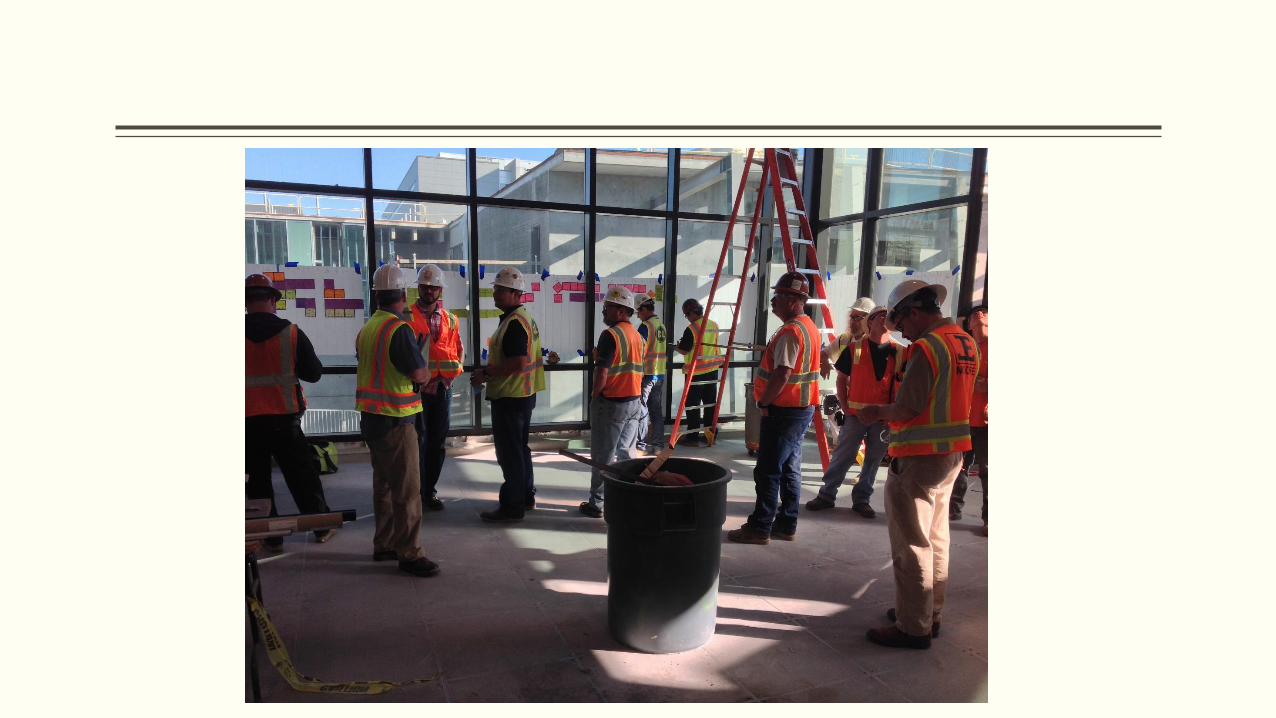
San Diego Community College District
Pull Planning in Action

November 2012
CM contract expires not renewed by District
New CM selected 11/1/12 11/6/12 new CM starts mobilizing
11/19/12 Completely mobilized
11/16/12 prior CM starts demobilizing
Final demob 11/30/12
Existing P6 schedule predicts 11/30/13 completion

January 2013
After weeks of analysis new CM’s Supt declares the P6 projected 11/30/13 completion is not possible Abandons P6 entirely – logic too flawed
Coaching Supt and PE on how to facilitate the WWP sessions
Supt’s analysis moved to Excel P6 and WWP info merged for comparison
Striving to get his head around the details

1/28/13

Pull Planning – 6 Week Look-Ahead
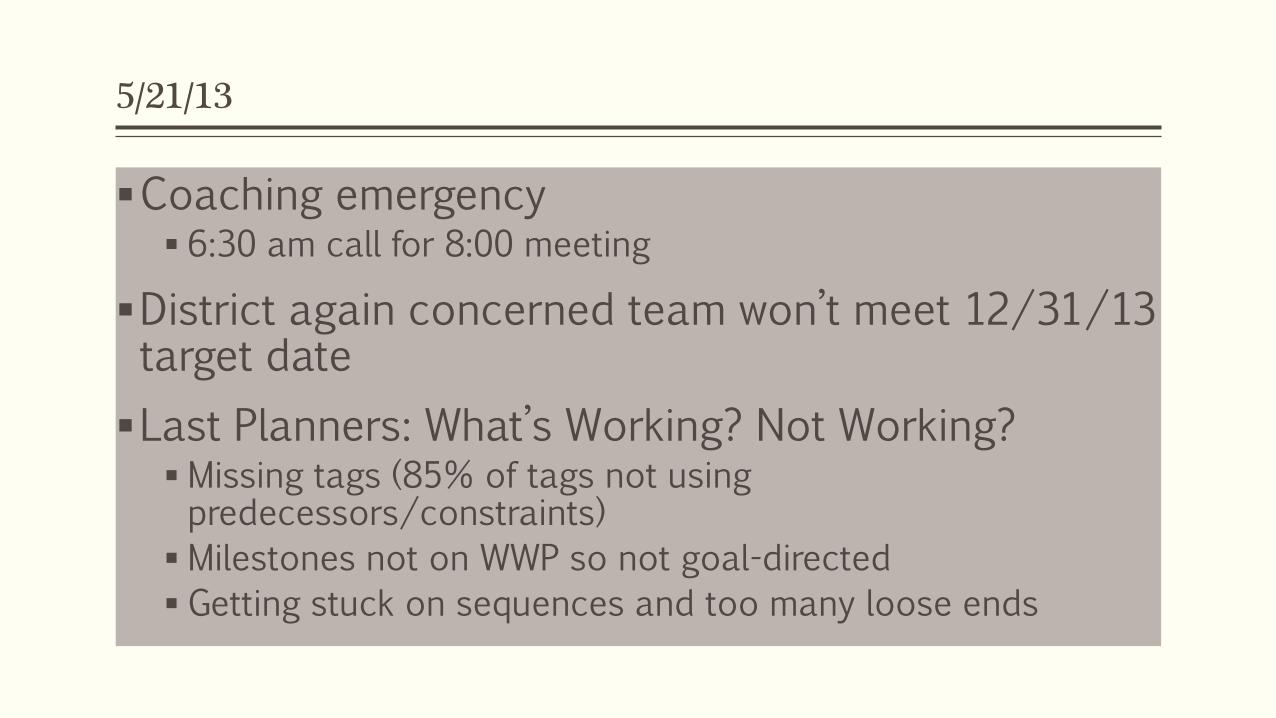
5/21/13
Coaching emergency 6:30 am call for 8:00 meeting
District again concerned team won’t meet 12/31/13 target date
Last Planners: What’s Working? Not Working? Missing tags (85% of tags not using predecessors/constraints)
Milestones not on WWP so not goal-directed
Getting stuck on sequences and too many loose ends

Moved WWP to each Floor
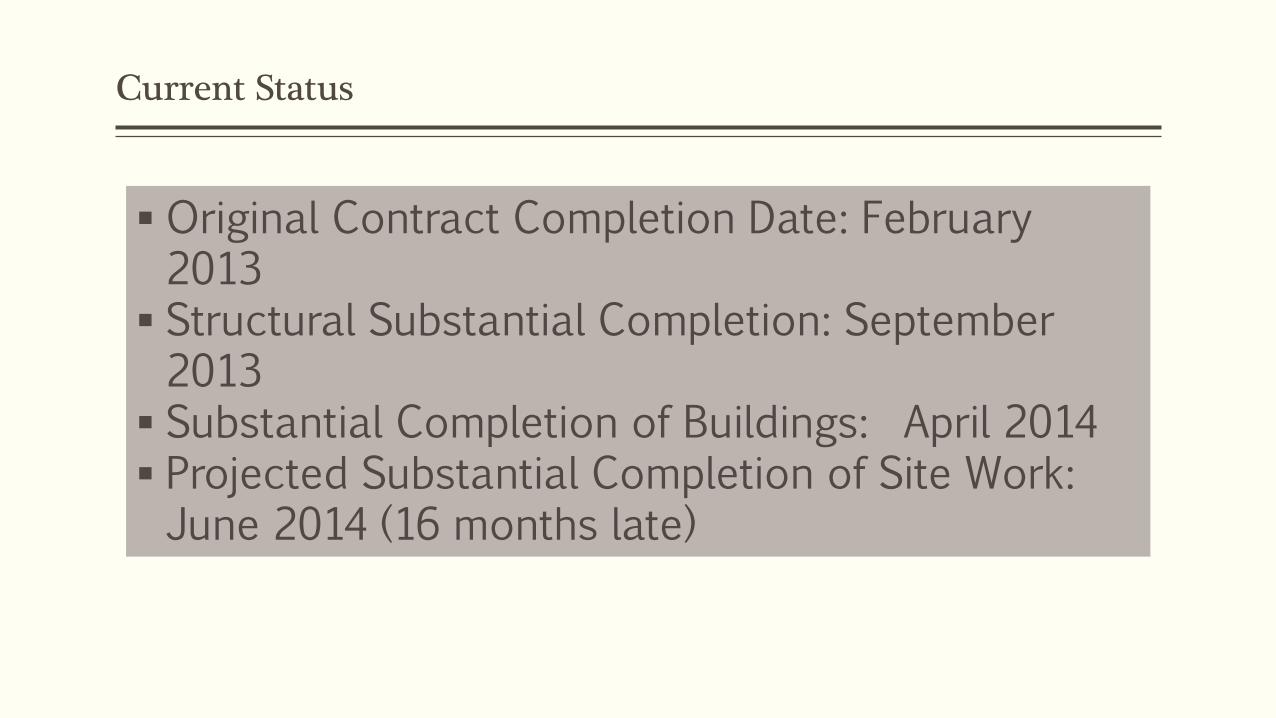
Current Status
Original Contract Completion Date: February 2013
Structural Substantial Completion: September 2013
Substantial Completion of Buildings: April 2014 Projected Substantial Completion of Site Work: June 2014 (16 months late)

Team Comments on Benefits of Pull Planning
“Pull planning exposed the weakness of the early prime concrete contractor.”
Pull planning is here to stay.
Had to figure out constraint tags. We could count on each other to put a final decision to bed.
The people to make these decisions were sitting in the room.
Accountability to go to the meetings.
“This makes so much more sense.”
Visually, it’s easier to understand.
Takes more time, but we got more efficient.
The approach of “Just finish an area on the board” was a good idea.
This process helped build trust.

Team “Delta” Comments
“There was a lack of coordination with the primes.
They hadn’t done pull planning before.
There was no thorough follow-up to prevent schedule slippage.
No consequence when primes missed promised dates.
No accountability ceated a lax attitude toward pull planning process.
Early CM should have asked: “How can we pick dates up?” Not just let dates slide.
Early CM did not consistently require identification of predecessors and constraints.

METRICS DISCUSSION
©2014 Umstot Project & Facilities Solutions, LLC

Selected Metrics
Metric Definition of Metric Lean Principle(s) Evaluated
Total Project Change Order Rates
% of change order costs of total project construction costs
Waste reduction
Change Orders caused by errors and omissions (as %
of project construction costs)
% of change order costs due to errors and omissions of total project construction costs
Waste reduction, collaboration
Project Schedule Performance
Number and % of projects meeting the original contract completion date
Waste reduction, flow, enhanced communication and collaboration
©2014 Umstot Project & Facilities Solutions, LLC

Selected Metrics
Metric Definition of Metric Lean Principle(s) Evaluated
Project Target Value
Design
Number and % of projects
meeting the published target
budget
Value generation, waste
reduction
Sustainability Value
Generation
Number and % of projects that
exceeded LEED Silver
certification
Owner-defined value generation
Annual Maintenance
Costs
Annual total maintenance costs
divided by the square footage
in the portfolio
Waste reduction, process
improvement; value generation
©2014 Umstot Project & Facilities Solutions, LLC

Methodology
Review of nearly 8000 change orders for 2008 –January 31, 2014
Evaluated 35 completed projects (20 without BIM and lean; 15 with BIM and lean)
Construction value of these projects: $584,731,760
11 projects using target costing; 6 have reached GMP
©2014 Umstot Project & Facilities Solutions, LLC

Change Order Rates with/without BIM and Lean
Number of
Projects (n)
Total CO Rate (%)
Errors & Omissions CO Rate
(%)
Ratio of Errors & Omissions Rate/Total CO Rate
Without BIM or Lean 20 7.73 2.99 0.33
With BIM and Lean 15 4.43 1.88 0.36
©2014 Umstot Project & Facilities Solutions, LLC

Change Order Rates – New Construction vs. Renovation
Number of
Projects (n)
Total CO
Rate
Errors &
Omissions CO
Rate
Ratio of Errors &
Omissions Rate /Total
CO Rate
New Construction
Without BIM or Lean 13 7.54% 3.04% 0.305
With BIM and Lean 13 4.38% 1.90% 0.355
Renovation
Without BIM and
Lean
7 8.00% 2.90% 0.367
With BIM and Lean 2 4.80% 1.79% 0.388
©2014 Umstot Project & Facilities Solutions, LLC

Change Orders
Errors & Omissions Total
Lean & BIM: 1.88% 4.43%
No Lean or BIM 2.99% 7.73%
(All Contract Types)
Average $avings per Project: $900k
San Diego CCD Change Order Metrics Summary
©2014 Umstot Project & Facilities Solutions, LLC

Impact of BIM and Lean On Schedule Performance
Number of Projects Completed on Time Percentage
Without BIM nor Lean 19 1 5
With BIM and Lean 15 3 20
©2014 Umstot Project & Facilities Solutions, LLC

Average Delay (All Contract Types)
BIM: 25 days (n=8)
Without BIM: 80 days (n=12)
San Diego CCD Schedule Impacts –BIM vs. No BIM (20 projects)
©2014 Umstot Project & Facilities Solutions, LLC

Target Value Design
• Six projects evaluated• Range of GMP: $4,707,408 to
$50,423,353• Average: $21,768,648• 5/6 (83%) met target budget• Averaged 7% under targer
budget©2014 Umstot Project & Facilities Solutions, LLC

Target Value Design – Root Cause Analysis
• Lack of contemporaneous estimating and exclusion of specialty trades from early participation in project resulted in project exceeding target budget
• Counter measure: All subsequent projects required presentation of budget first
©2014 Umstot Project & Facilities Solutions, LLC

SDCCD Values
Enhance the student experience
Flexibility in design to accommodate future changes in pedagogy
Lower total cost of ownership
Highly energy efficient buildings
Reduce maintenance and operations costs
Meet or exceed sustainability objectives
©2014 Umstot Project & Facilities Solutions, LLC

Potential Sustainability Features
Higher building energy efficiency
Extensive use of daylighting
Use of natural ventilation tied to EMS
Reduced water consumption
Use of reclaimed water for irrigation, flushing
Solid flooring without need for stripping and waxing
©2014 Umstot Project & Facilities Solutions, LLC

Value Generation – LEED Certification Level
Number of Projects
Number of Projects Exceeding LEED Silver
Goal
% of Projects Exceeding LEED Silver
Goal
Without BIM or Lean
9 5 55With BIM and Lean
25 10 40Direct Contracts with Architect
22 11 50Target value design with Design-Builder
12 4 33©2014 Umstot Project & Facilities Solutions, LLC

Value Generation – LEED Certification Level
Number of Projects (LEED v2)
Number of Projects (LEED
v3)
Number of Projects Exceeding LEED Silver
Goal (LEED v2)
Number of Projects Exceeding LEED Silver
Goal (LEED v3)
% of Projects Exceeding LEED Silver
Goal (LEED v2)
% of Projects Exceeding LEED Silver
Goal (LEED v3)
Without BIM or Lean
9 0 5 NA 56% NAWith BIM and Lean
14 14 4 4 29% 29%Direct Contract with Architect 21 5 9 1 42% 20%Target value design with design-builder
1 9 0 4 0% 44%
©2014 Umstot Project & Facilities Solutions, LLC

San Diego Community College District (SDCCD)
Potential Cumulative Savings - $25,863,512
FISCAL YEAR FY 09/10
Custodial FY09 FY10 FY11 FY12 FY13 FY14 FY15 FY16 Avg. Salary Custodial Forecast H/C 104 113 132 149 162 173 189 191 $ 58,643
Cust Forecast Salary $ 6,098,855 $ 6,650,098 $ 7,769,004 $ 8,731,333 $ 9,504,832 $ 10,169,255 $ 11,098,158 $ 1,227,172
Custodial Adj H/C 77 82 88 100 122 130 140 147 45
Custodial Adj Budget $ 4,497,197 $ 4,782,522 $ 5,187,077 $ ,878,320 $ 7,150,669 $ 7,622,296 $ 8,208,826 $ 8,597,611
Delta $ 1,601,658 $ ,867,576 $ 2,581,927 $ 2,853,013 $ ,354,162 $ 2,546,959 $ ,889,331 $ 2,629,561 $ 19,324,187
Hold HC Flat until projection exceeds current HC $ 13,273,027
Maintenance
Maint Forecast H/C 45 50 57 64 69 73 79 80 $ 76,457
Maint Forecast Salary $ 3,440,546 $ 3,793,010 $ 4,344,262 $ 4,857,286 $ 5,245,685 $ 5,579,036 $ 6,044,656 $ 6,108,880
Maintenance Adj H/C 29 32 37 41 45 47 51 52 28
Maint Adj Salary $ 2,236,355 $ 2,465,457 $ 2,823,770 $ 3,157,236 $ 3,409,695 $ 3,626,373 $ 3,929,027 $ 3,970,772
Delta $ 1,204,191 $ 1,327,554 $ ,520,492 $ 1,700,050 $ 1,835,990 $ 1,952,663 $ 2,115,630 $ 2,138,108 $ 13,794,676
Hold HC Flat until projection exceeds current HC $ 12,590,485
©2014 Umstot Project & Facilities Solutions, LLC

Maintenance Costs (2009-2013)
Goal of $2.55 in 2013
©2014 Umstot Project & Facilities Solutions, LLC

Benefits to SDCCD Using Lean
Benefit SDCCD Metric SDCCD ExperienceReduced waste associated with change orders
Total and error & omission change orders as % of total construction cost
Total change orders reduced from 7.73 to 4.46% on average; $13.6M estimated savings; average cost savings of $900,000 per project
Improved schedule performance
% of projects that completed within contractual completion date
Project schedule performance improved using BIM and Lean, but using critical path method scheduling only 20% of projects completed on time; this prompted abandonment of CPM scheduling and requirement to use the Last Planner® System
Meeting programmatic requirements and enhancing value with a constrained budget
# of projects that met target value design budget
Used target value design to enhance value and meet the target budget in 83% of the projects included in this study
©2014 Umstot Project & Facilities Solutions, LLC

Benefits to SDCCD Using Lean
Benefit SDCCD Metric SDCCD ExperienceEnhanced value
generation through
more sustainable
buildings
# of buildings that
exceeded LEED Silver
certification
Using BIM and Lean improved this by a factor of
45% and using target value design improved this
by a factor of 100% from projects where none of
these tools were used.
Enhanced value
generation through
lower operational
and maintenance
costs
Maintenance cost per
square foot
Major factor in helping reduce annual square
footage maintenance costs from $3.73 to $1.46
over a 3-year period
©2014 Umstot Project & Facilities Solutions, LLC

Assessment of Lean Behaviors at SDCCD
©2014 Umstot Project & Facilities Solutions, LLC

Lean Construction Maturity Model
Courtesy: Project_Five

Lean Construction Maturity Model
Courtesy: Project_Five

Questions?
David Umstot, PEUmstot Project & Facilities Solutions, [email protected] (O)www.umstotsolutions.com
Dan Fauchier, CMPThe Realignment [email protected]