michael maccracken, ph.d. – chief scientist, the climate institute us-tag meeting, washington dc...
TRANSCRIPT

Michael MacCracken, Ph.D. – Chief Scientist, The Climate InstituteUS-TAG Meeting, Washington DC
August 4, 2014
UPDATING CLIMATE METRICS
THE NEED FOR CONSISTENCY WITH CONSENSUS SCIENCE AND INTERNATIONAL AGREEMENTS

CURRENT STATE OF CLIMATE SCIENCE AND INTERNATIONAL AGREEMENTS
• Intergovernmental Panel on Climate Change (IPCC) –organized in 1988 by the United Nations and World Meteorological Organization to assess and summarize international scientific and expert understanding.
• IPCC’s assessment reports – Compiled by three working groups, covering the physical science of climate change (WG 1), its impacts (WG 2), and options for addressing it (WG 3). IPCC does not conduct its own research, nor does it monitor climate related data.
• Five assessment reports published since 1990, each unanimously accepted by its 190+ nation membership.
• Fifth Assessment Report (AR5) – WG 1 report approved in September 2013. WG 2 and WG 3 reports approved in April 2014. A Synthesis Report is now in preparation.
IPCC Assessment Reports have been a key reference in better understanding the science.
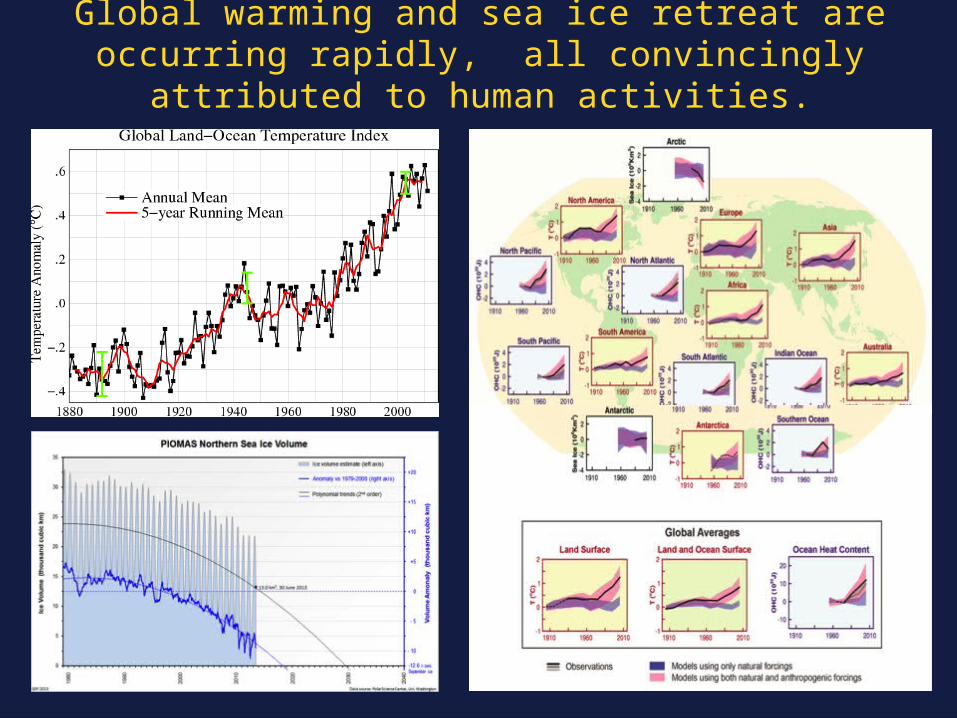
Global warming and sea ice retreat are occurring rapidly, all convincingly attributed to human activities.

While projected increases in global average temperature vary by emissions scenario, all projections for uncontrolled emissions lead to temperature
increases that would cause much more change in the future.
Low scenarioMedium scenarioHigh scenario
Incr
ease
in g
loba
l tem
pera
ture
sin
ce 1
750
(°C)
2.4oC
3.4oC
4.0oCAll emissions scenarios show global average temperature
increasing to levels greater than 2°C above pre-industrial values.
5.0
4.0
3.0
2.0
1.0
0.0Note: Temperature scale used by IPCC has been adjusted so the baseline is the average near the start of the Industrial Revolution.
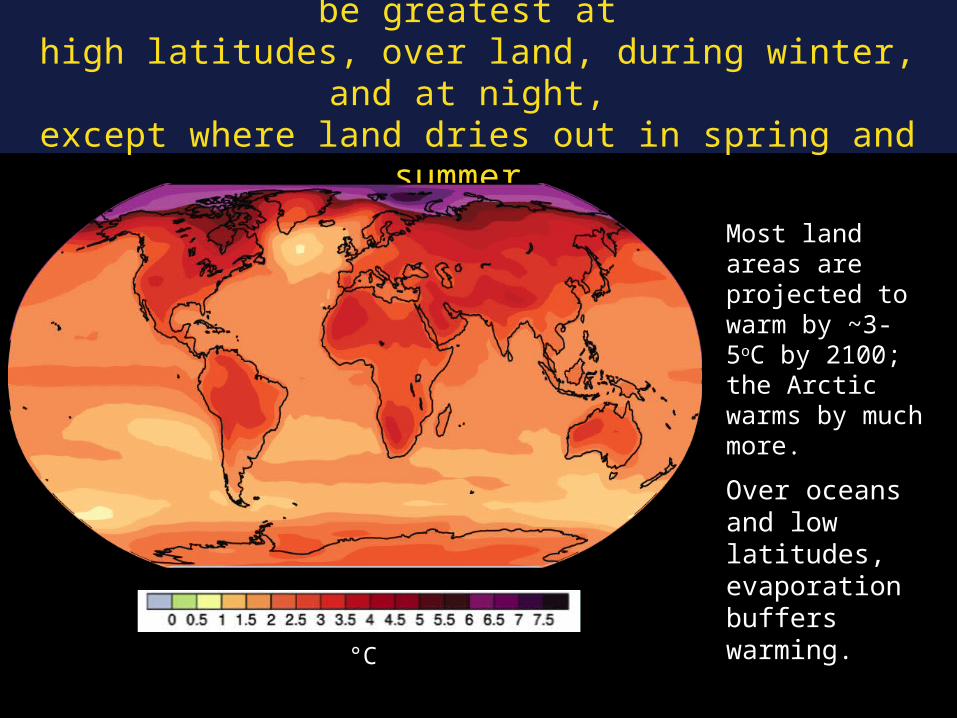
All projections indicate that warming will be greatest at high latitudes, over land, during winter, and at night, except where land dries out in spring and summer.
Most land areas are projected to warm by ~3-5oC by 2100; the Arctic warms by much more.
Over oceans and low latitudes, evaporation buffers warming.
°C
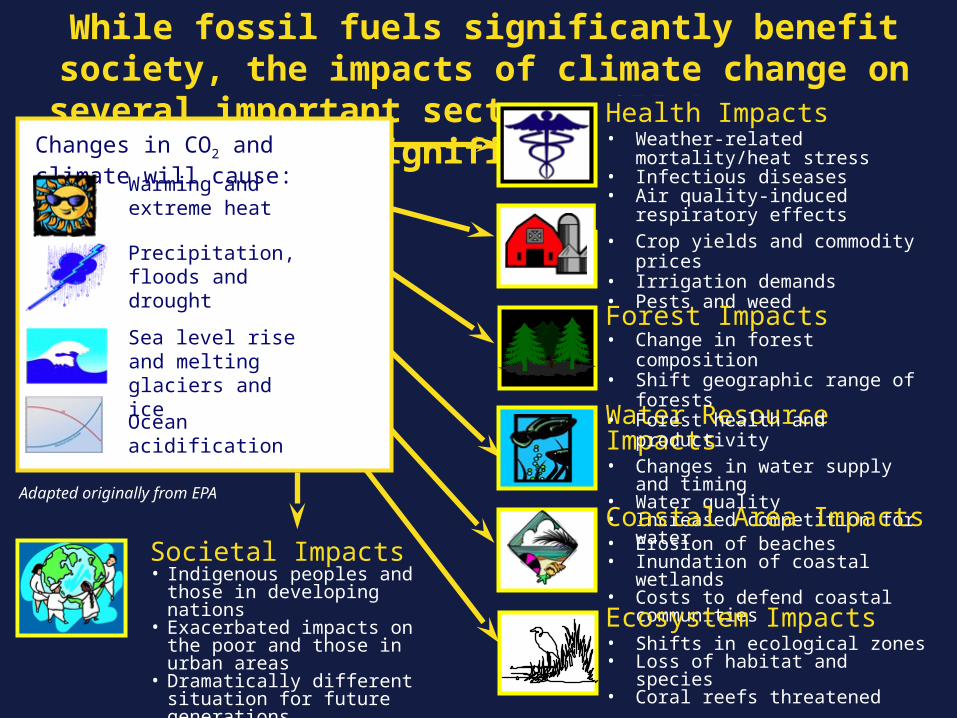
While fossil fuels significantly benefit society, the impacts of climate change on several important sectors will become very significant.
Adapted originally from EPA
Agriculture Impacts• Crop yields and commodity prices• Irrigation demands• Pests and weed
Water Resource Impacts• Changes in water supply and timing• Water quality• Increased competition for water
Coastal Area Impacts • Erosion of beaches• Inundation of coastal wetlands• Costs to defend coastal communities
Forest Impacts• Change in forest composition• Shift geographic range of forests• Forest health and productivity
Ecosystem Impacts• Shifts in ecological zones• Loss of habitat and species• Coral reefs threatened
Societal Impacts• Indigenous peoples and those in
developing nations• Exacerbated impacts on the poor and
those in urban areas• Dramatically different situation for
future generations
Health Impacts• Weather-related mortality/heat stress• Infectious diseases• Air quality-induced respiratory effects
Changes in CO2 and climate will cause:
Sea level rise and melting glaciers and ice
Warming and extreme heat
Precipitation, floods and drought
Ocean acidification
Given such large projected changes, the UN Framework Convention on Climate Change
(UNFCCC) was negotiated and approved in 1992.
UNFCC Objective 2 called for: Stabilization of greenhouse gas (GHG) concentrations in the atmosphere at a
level that would prevent dangerous anthropogenic interference with the climate system.
Such a level should be achieved within a time-frame sufficient to allow ecosystems to adapt naturally to climate change, to ensure that food production is not threatened, and to enable economic development to proceed in a sustainable manner.

Carbon dioxide equivalent (CO2e) is the basic metric used to summarize the relative
contribution of various GHGs to climate change.
CO2e is calculated using a “global warming potential” (GWP)– a factor representing the potency (in terms of “radiative forcing”) of each GHG relative to CO2 over a set time period.
By convention, this relative potency is typically assessed over a 100-year time period (GWP-100) .
The 100-year period provides a means to evaluate the relative contribution of emissions for each chemical species to long-term “peak warming,” which is projected to range up to 6°C.
However:
The metric has been limited to six types of GHGs defined in the Kyoto Protocol.
This focus on the 100-year time period and the Kyoto-listed GHGs has obscured the importance of the near-term warming influence of methane and short-lived climate forcers (SLCFs) – GHGs and aerosols.

THE IMPORTANCE OF UPDATING OUR CLIMATE CHANGE ACCOUNTING METRICS

Scientific studies indicating greatly increased likelihood for “dangerous anthropogenic interference with the climate system” above 2°C led international
leaders to reset their goal to limit warming to 2°C, projected to occur ~2050
Low scenarioMedium scenarioHigh scenario
Incr
ease
in g
loba
l tem
pera
ture
sin
ce 1
750
(°C)
2.4oC
3.4oC
4.0oC
5.0
4.0
3.0
2.0
1.0
0.0Note: Temperature scale adjusted so the baseline is the average near the start of the Industrial Revolution
Dangerous?
Safe?
Can Adapt?

Three global mean temperature (GMT) anomaly levels have been suggested as critical upper limits by international negotiators, each a different number of decades ahead.
+2 °
C
+1.5
° C
+4 °
C

Copenhagen Accord (2009)
• 114 Parties under the UNFCCC agreed that the potential consequences of a GMT increase of more than about 2°C above the pre-industrial baseline are likely to be “dangerous.”
• All major nations, including the United States, were parties to the agreement. Negotiations are underway to agree on an international approach in 2015.
• 1.5°C was initially considered as the internationally agreed-upon threshold. Given the changes already evident at present warming levels (~ 0.8°C), the 1.5°C threshold will be reconsidered as the appropriate goal in 2015.

IPCC AR5 makes clear that CO2, methane, black carbon, and HCFCs have been the main contributors to global warming.
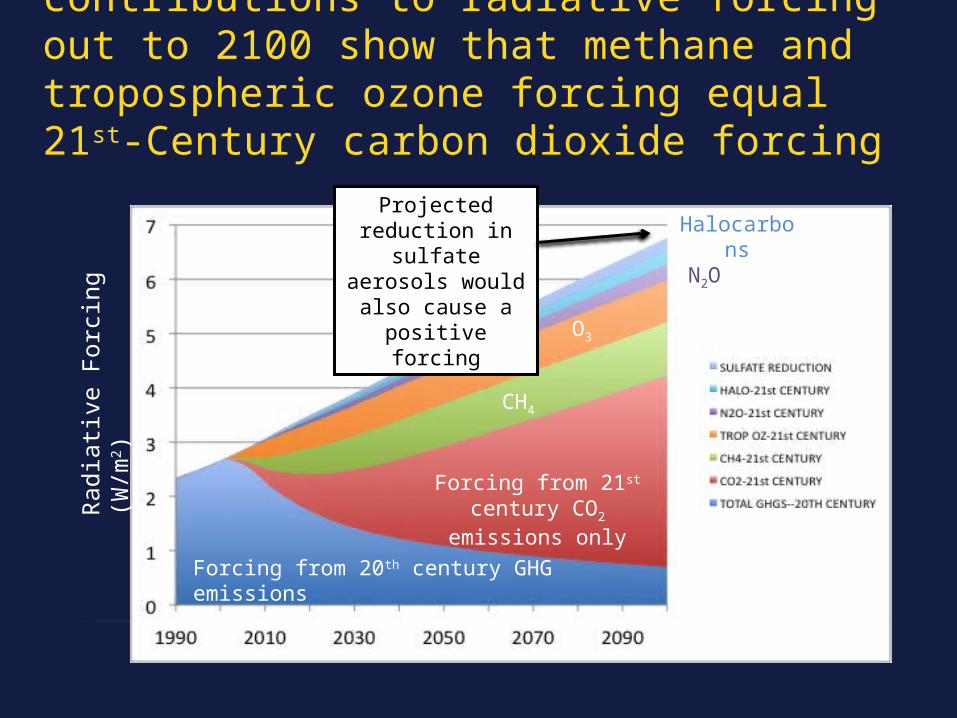
Analysis of the relative contributions to radiative forcing out to 2100 show that methane and tropospheric ozone forcing equal 21st-Century carbon dioxide forcing
Radi
ative
For
cing
(W/m
2 )
Forcing from 20th century GHG emissions
Forcing from 21st century CO2 emissions only
CH4
O3
Halocarbons N2O
Projected reduction in sulfate aerosols would also cause a positive
forcing

When the forcing due to black carbon is added in, it is clear that forcing by short-lived species is well more than half of total forcing from 21st-Century emissions
Radi
ative
For
cing
(W/m
2 )
Forcing from 20th century GHG emissions
Forcing from 21st century CO2 emissions only
CH4
O3
Halocarbons N2O
Black Carbon
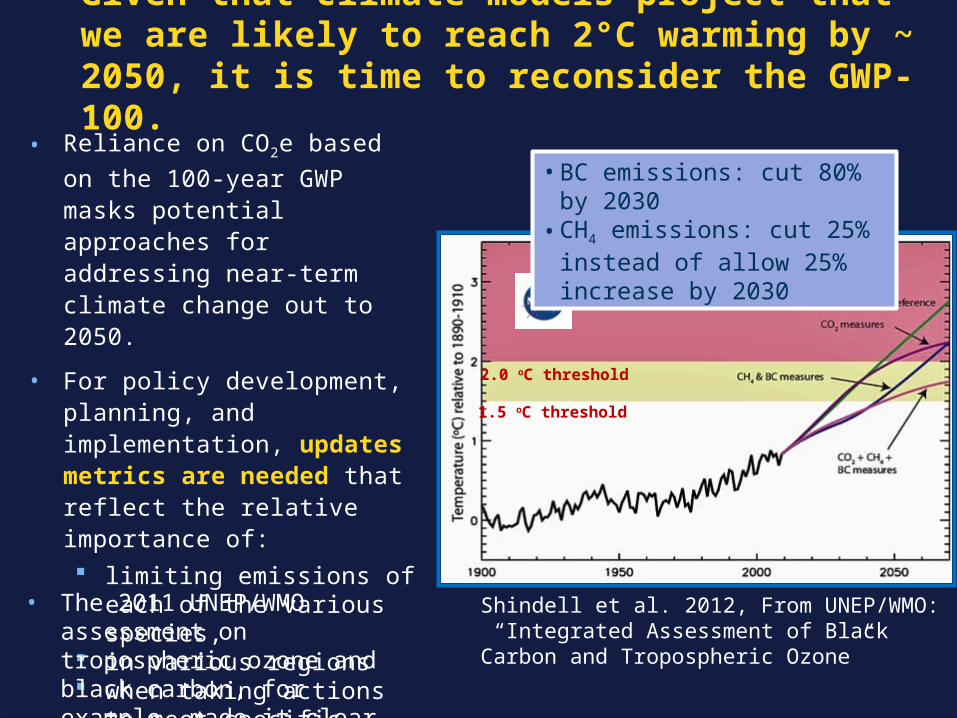
Given that climate models project that we are likely to reach 2°C warming by ~ 2050, it is time to reconsider the GWP-100.
• Reliance on CO2e based on the 100-year GWP masks potential approaches for addressing near-term climate change out to 2050.
• For policy development, planning, and implementation, updates metrics are needed that reflect the relative importance of: limiting emissions of each of the
various species, in various regions when taking actions to meet
specific policy goals over specific periods in the future.
1.5 oC threshold
2.0 oC threshold
• The 2011 UNEP/WMO assessment on tropospheric ozone and black carbon, for example, made it clear that focusing on the Kyoto GHGs alone is not sufficient.
Shindell et al. 2012, From UNEP/WMO: “Integrated Assessment of Black Carbon and Tropospheric Ozone”
• BC emissions: cut 80% by 2030• CH4 emissions: cut 25% instead of
allow 25% increase by 2030

The Climate and Clean Air Coalition to Reduce Short-Lived Climate Pollutants (CCAC) Working Group convened
in Paris, France, from 16-17 July 2014.
More than 90 participants attended, representing state and non-state partners of the CCAC, its Scientific Advisory Panel (SAP), the CCAC Secretariat and observers.
CCAC has approved 10 initiatives, including seven sectoral initiatives:
1. Accelerating methane and black carbon reductions from oil and natural gas production
2. Addressing SLCFs from agriculture
3. Mitigating SLCFs and other pollutants from brick production
4. Mitigating SLCFs from municipal solid waste
5. Promoting HFC alternative technology and standards
6. Reducing black carbon emissions from heavy-duty diesel vehicles and engines
7. Reducing SLCFs from household cooking and domestic heating
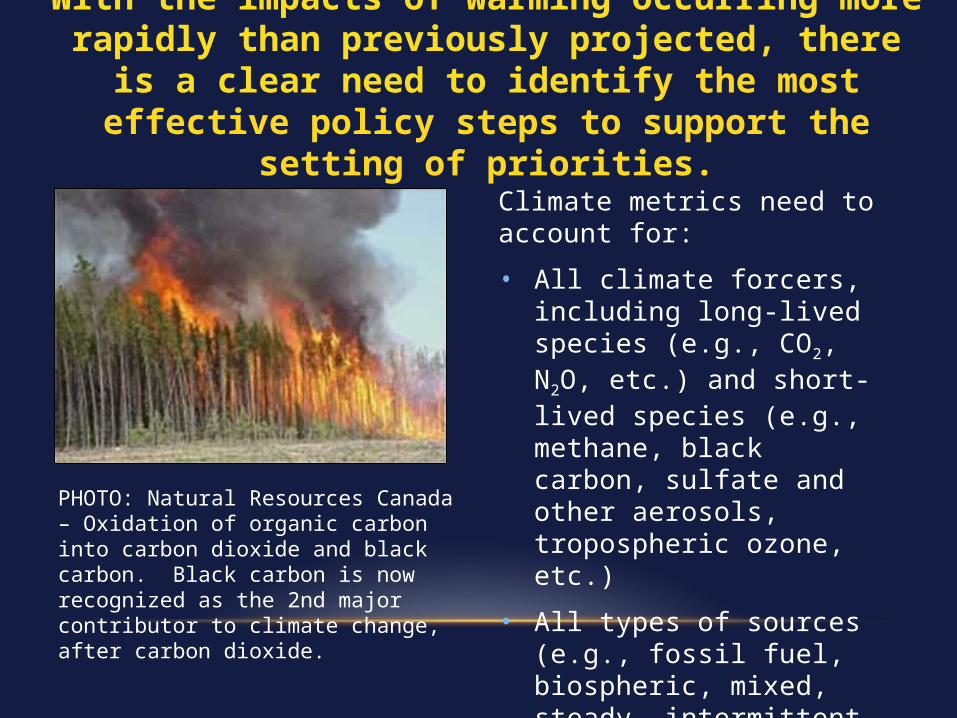
Climate metrics need to account for:
• All climate forcers, including long-lived species (e.g., CO2, N2O, etc.) and short-lived species (e.g., methane, black carbon, sulfate and other aerosols, tropospheric ozone, etc.)
• All types of sources (e.g., fossil fuel, biospheric, mixed, steady, intermittent, etc.)
PHOTO: Natural Resources Canada – Oxidation of organic carbon into carbon dioxide and black carbon. Black carbon is now recognized as the 2nd major contributor to climate change, after carbon dioxide.
With the impacts of warming occurring more rapidly than previously projected, there is a clear need to identify the most
effective policy steps to support the setting of priorities.

The metrics must be capable of reflecting the range of impacts that are occurring in different regions and at different rates.
The metrics should support:
• Prioritization of steps that can be taken to meet goals for different time horizons (e.g., 2035, 2050, 2100)
• Prioritization of actions to limit specific types of emissions in order to address a wide range of impacts, such as: Overall amount of global warming Amplified warming occurring in high
latitudes (and other regions) Ocean acidification
PHOTO: Geophysical Research Letters. Arctic sea ice volume declined 36 % in the autumn and 9 % in the winter over the last decade since 2003.

• The metrics should account not only for emissions by type, but also for their potential influence on regional “hot spots” such as the Arctic, including seasonal variations in impacts.
• For example, black carbon would be expected to have greater impacts when emissions occur near regions of snow and ice, and in the spring and summer when the Sun is up.
• Thus, while the amount of emission can effect the intensity of the impact, so can location and timing—and the impacts are what we are trying to reduce or limit.
Temperatures in the Arctic have risen far faster than the rest of the planet.
For example, in the Arctic, amplified warming is caused by a combination of global warming by long-lived GHGs and further regional amplification from emissions of short-lived species in the region and beyond.

Moving to metrics that focus on impacts resulting from emissions or activities rather than merely on their amounts should provide
greater insight into the most effective ways to take action.
• Upgraded climate accounting metrics, coupled with sustainability standards, can help governments and the public and private sectors better prioritize actions to limit climate change.
• With future international harmonization through ISO, the updated metrics have the potential to facilitate both national and international progress in limiting climate change, sea level rise, and ocean acidification.

Strong Warning from IPCC AR 5 Regarding GWP-100
“The uncertainty in the GWP increases with time horizon, and for the 100-year GWP of WMGHGs the uncertainty can be as large as 40%. Several studies also point out that this metric is not well suited for policies with a maximum temperature target.” …IPCC AR5, TS3.8
Heeding this warning, the updated metrics should encompass near-term temperature thresholds, including 1.5°C (2035) and 2.0°C (2050), as well as 4.0°C (2100).
+2 °
C
+1.5
°
C
+4 °
C
Important assessments and well-reviewed scientific papers have been used in the development of the updated metrics.
• Intergovernmental Panel on Climate Change (IPCC) Assessment Reports
• Arctic Monitoring and Assessment Programme (AMAP)
• National Aeronautics and Space Administration (NASA) analyses
• National Oceanic and Atmospheric Administration (NOAA) summary reports on the climate
In addition, the updated metrics reflect:
• The findings of experts at the Scripps Institute of Oceanography, University of Illinois, University of Michigan, and Stanford University related to black carbon
• Review comments from leading scientists in the field

Having the appropriate metrics is important because of the many uses to which they are put.
Inventories of activities and their coupling to impacts
Indications of trends (and communication of trends to the public)
Determining the coupling to the timing of emissions
Policy development (setting goals and measuring progress)
Setting financial incentives to actions (application across species)
Implementation of Executive Order 13514 and Scope 3
Valuing of emissions in trading or offset schemes
International treaty negotiations (country-to-country comparisons)
Private sector environmental initiatives
VERY CLEARLY, IT IS IMPORTANT TO GET THE METRICS RIGHT

Questions?
Examples of updated data and understanding regarding short-lived climate forcers
Black Carbon
• IPCC estimates that black carbon forcing is 0.6 W/m2. However, it aggregates black carbon from biomass burning with cooling from organic carbon, assuming the net result is zero. Estimates of forcing are not based on observations of black carbon concentrations in the atmosphere, but instead are based upon emissions data, which can be inaccurate for the main sources of black carbon.
• Observational data from a consensus of leading experts has found that black carbon contributes +1.1 W/m2 to total global forcing.

Cooling Aerosols
• Negative forcing from aerosols is uncertain, because of the significance of cloud effects (which are difficult to sum up around the Earth), and the substantial changes in emissions levels of aerosols over the past several decades.
• IPCC aggregates the forcing of all aerosols, including black carbon, to assess a net ERF (effective radiative forcing) of -0.9 W/m2 that factors the indirect negative forcing from cloud formation. However, this assignment has a low confidence level and depends upon assumptions about the radiative forcing of black carbon.
• If black carbon forcing derived from observational data is correct, then the amount of negative (cooling) forcing required to explain the current GMT anomaly leads to an estimate of approximately -2.1 W/m2 for atmospheric coolants.
Examples of updated data and understanding regarding short-lived climate forcers

“Representative Concentration Pathways” (RCPs) are used to define scenarios.
Source: IPCC AR5 Summary for Policymakers, Figure SPM.1.
• The IPCC has projected how the Global Mean Temperature (GMT) anomaly will evolve over time, as radiative forcing changes over the 21st century. Four scenarios (“RCPs”) are defined based upon the forcing level in 2100.
• Only RCP 2.6 has the potential to stabilize the GMT anomaly at +1.5 to 2°C above pre-industrial temperatures. In all other scenarios, +2.0°C will be passed by mid-century.
1.5